
Abstract
Despite its ‘wordless’ and hidden characteristics, it is within the everyday tasks, routines, and rhythms that consumption takes place, from getting up every morning, having breakfast, going to work or school, having lunch, going home, having dinner, reading a book, surfing the Internet, watching TV, and probably doing similar things again and again. This study examines this routinized daily use of time of employed individuals based on the 2014–2015 UK Time-Use Survey data. In doing this, we focus on individual’s day-to-day activities and how they are routinized or how they are formed into stabilized practices. Starting from the definition of stable practices, we apply a relatively new method of social network analysis to visualize stable practices during workdays. We then analyse the cohesion between practices based on work hours and connections and coordination between practices. Our results suggest that work arrangements create stable practices that by themselves are stone pillars of daily routines. This implies that the removal (or ‘unlocking’) of stable practices during these time periods could produce some – albeit marginal – decongestion of routinized activities.
Introduction
Sociological research on consumption has highlighted that the allocation and coordination of everyday activities is strongly associated with the time of day (such as meal and work times) and week (Sunday as rest day). Southerton’s (2020) qualitative study on time squeeze indicates that institutionally fixed events (such as work and school schedules) create fixed moments within the day around which other types of activities are scheduled. Furthermore, their interview data revealed that this patterning of activities was not necessarily the result of individuals complying with collective temporalities. Van Tienoven et al. (2017) seem to share this view when they describe the way individual practices are routinized. Defining daily routines as the repetitive social practices that reproduce the ‘everydayness’ of social life, they suggest that individuals create certain routines to manage parts of the day and to deviate from the collective temporal rhythm of society.
Our article deals precisely with repetitive social practices around which everyday life is organized. The research questions addressed in this article relate to (1) how duration of the work affects the cohesion between practices and (2) how making and breaking connections between stable practices impact the configuration of the day. The article starts with a discussion about regularized pattern of behaviour, how it fits within the praxeological approach and how studying stable practices helps us to understand daily routine behaviour (section ‘Theoretical background’). The methodology details the selection of individual time-use diaries based on work diaries, sample characteristics, measures, and analytical strategy (section ‘Data and methods’). Findings are presented in terms of cohesion between practices based on work hours and connections and coordination between practices (section ‘Findings’). The conclusions reflect on the limitations and implications of this work (section ‘Conclusions and implications’).
Theoretical background
Regularized sequence patterns
A number of sociological studies have identified numerous aspects of the socio-temporal structures that confirm the existence of regular sequence patterns at different levels of society, such as social institutions, norms, values, social networks, and social scripts. According to Durkheim (1997), social norms provide substantive restrictions on behaviour to a degree that whole sets of interactions become habitual and routine. Durkheim (1997) recognized that continuity and regularity of behaviour is an integral aspect of a properly working society. Weber (1978) saw the regularization of human behaviour as an unavoidable result of the inexorable progress of rationalization. This is demonstrated by his view that much of everyday activity is based on unreflective habit, and that daily life is gradually and deliberately systematized and controlled in the name of efficiency, productivity, and other instrumental interest.
Social interactions and social roles come to be structured in the same manner each day due to both non-rational and rational social influences. This is reinforced by institutional rules and calendars, clocks and schedules that produce sequential patterns that can be observed on the order of days, weeks, months, and years (Gershuny, 2000; Zerubavel, 1981). Parsons (1951) argued that patterns of social behaviour are made up of repetitive acts. For them, the repetition is embedded in several social structures, including the behaviour in which individuals are guided by traditions, responsibilities, and principles determined by broader society and community and even institutional practices. For example, an action of a person is partially directed at fulfilling the responsibilities associated with different social functions – that is, to fulfil the obligations connected with several persons and organizations connected through a wider integrated network of expectations. As a result, individuals’ typical social experiences are primarily characterized by reasonably stable, mutually reinforcing habits.
Since responsibilities and commitments are stable over time, time moves without real meaning. This line of reasoning is present in Giddens’ (1984) structuration theory. The focus of the structuration theory is on temporal aspects of micro-social action, specifically its relationship to social patterning. According to Giddens, social structure is revealed in the everyday routines of life. Social actors interact with each other in a specific order (e.g. sequence pattern) that is repeated again and again. Routinization occurs through the presence of normative rules, obligations, and institutional practices that govern the behaviours among people and acts as a source of psychological and existential security for people in a complex and rapidly changing society (Giddens, 1984). Put it differently, by repeating the same social interaction, it reinforces the social order within a social structure. Bourdieu (1984) indicates that micro-level practices play a key role in reproducing social structures. According to Bourdieu (1984) habitus, or the repetitive nature of these actions, continually reproduce the same sequences of action.
Our central motivation for studying sequential phenomena comes from the recognition that the way individuals schedule their daily activities reflects social-structural trends.
Empirical motivation: praxeological approach
Time-use diary studies provide a method for comparing different cultures based on the organization and experience of time. A seminal work of Warde et al. (2007) demonstrates how temporal organization of food consumption varies across societies, reflecting cultural variations in the social structure and stratification of eating. According to the author’s findings eating’s temporalities serve as a symbolic representation of social status in France and in the UK, but they are different in Norway, in the Netherlands, and in the USA.
Increasingly, time-use studies are looking beyond aggregate time-use statistics to explore how time is sequentially structured. The sequential approaches to time-use data have shown that the various activities in a person’s everyday life are organized in a way that is predictable and familiar and bring stability to the temporal rhythms of everyday life. These rhythms can be observed at multiple scales, ranging from the micro-level rhythms experienced by individuals and households to macro-level rhythms of rush hours. Theories of practice provide a conceptual framework that helps understand and explain how socio-temporal rhythms are established and reproduced. Based on these perspectives we explore the role of working hours on shaping daily routines and the role of the collectively shared temporalities of paid work in shaping daily routines.
In explaining, what underpins the process of structuration Giddens (1984) argues that the basic domain of study of the social sciences, according to the theory of structuration, is neither the experience of the individual actor, nor the existence of any form of societal totality, but social practices ordered across space and time.
Cultural theories have developed these considerations and positioned practice theory in relation to theoretical explanation of ‘human action’ and ‘social order’ (Reckwitz, 2002; Schatzki, 1996). The human actions are established by ‘individual purpose, intention and interest’ (Reckwitz, 2002). Social order is embedded in ‘symbolic structures of knowledge, which enable and constrain the agents to interpret the world according to certain forms, and to behave in corresponding ways’ (Reckwitz, 2002). In this way, the social practice theory understands social order and individual behaviour as interdependent. According to Reckwitz (2002), a ‘practice’ – from the German Praktik – is a routinized type of behaviour that consists of recognizable and interconnected elements: forms of bodily activities, forms of mental activities, things and their use, background knowledge in the form of understanding, know-how, states of emotion, and motivational knowledge. Thus, the survival of a practice necessarily depends on the existence and specific inter-connectedness of these elements, and which cannot be reduced to any one of these single elements. Likewise, a practice represents a pattern which can be filled out by a multitude of single and often unique actions reproducing the practice. (Reckwitz, 2002)
From a practice theory perspective, bodies are considered to be carriers of practices that makes the routinized actions become visible and with the continuous performance of practices actors become skilled over time. This implies that social structure is to be found in the routine nature of action as argued by Reckwitz: ‘Agents, on the other hand, consist in the performance of practices. [. . .] Thus, the social world is first and foremost populated by diverse social practices, which are carried by agents’.
The key theoretical insight from practice theory that we operationalize in this article is that social order is to be found in the temporal routines of daily activities. These temporal orders influence the organization of the times when activities are performed and experienced (Southerton, 2020). This means that, to understand the routinized daily use of time, we need to analyse the organization of daily routines and the socio-temporal rhythms that shape and reproduce everyday life.
The most common application of time-use data is to generate estimates of how people spend their time, or how time is ‘distributed’ or ‘allocated’ across different types of activities. In this instance, the implicit treatment of time as a substance, or commodity, that can be divided and distributed is particularly obvious and noticeable. Critics of time-use research methods argue that, in addition to studying the distribution of static substances or states and possible causal links between them, sociologists must also investigate how these elements shape the relationships between social actors.
In her seminal article ‘Women’s Time’ feminist philosopher Julia Kristeva emphasizes the relationship between feminine subjectivity and cyclical and monumental time, the former referring to repetition and the latter to the notion that this repetition will continue indefinitely. Kristeva et al. (1981) defines historical time as linear time (time as project, departure, progression), which she believes is associated with male subjectivity. Shaw et al. (1995) emphasized the importance of leisure as an aspect of adolescent life that can aid or hinder identity formation. This varies according to the leisure activity and its associated gender connotations. Sirianni and Negrey (2000) advocate for flexible work schedules to advance gender equality at home and in the workplace. According to Sirianni and Negrey (2000) to address the current ‘market failure’, it is necessary to internalize women’s positive externalities as mothers and caregivers. Paying ‘working’ mothers – defined as those who work both inside and outside the home – a ‘social’ wage rather than the market wage is one way to accomplish this. According to Wajcman and Dodd (2016), a significant source of urban inequalities between rich and poor can be traced back to both organizational and social temporalities. It is critical to define the influence of clock time on social action via an internalization process. Glennie and Thrift (2009) concept of temporal disciplines is instructive in this context. Unlike previous positions, they emphasize that time discipline is a collection of skills and conventions, some of which developed in Protestant and industrial milieux, while others pre- and postdate both. Thus, it is more accurate to speak of time disciplines rather than a single discipline Glennie and Thrift (2009). They argue that the majority of researchers combine at least three distinct time disciplines – standardization, coordination, and regularity – that overlap in some contexts but operate independently and in various combinations in other ‘communities of temporal practise’ Glennie and Thrift (2009).
Stable practices: mutually reinforcing patterns of behaviour
In the previous section, we argued that social-temporal order provides the context in which practices are sequenced. Our analysis focuses on exploring stable practices that make up the spheres of action that most people recognize in our contemporary society (Van Tienoven et al., 2017). Time-use surveys allow us to reconstruct the order between activities in time at the individual or micro-level into an analysable dataset. Based on the time-use survey data, we define stable practices as routines of daily activities that colonize specific time slots (Van Tienoven et al., 2017).
There are two important claims to consider when discussing how practices become routinized and how they turn into stable practices. First, according to Giddens (1984), routinization helps agents move through daily life and through societal institutions: ‘Routine is integral both to the continuity of the personality of the agent, as he or she moves along the paths of daily activities, and to the institutions of society, which are such only through their continued reproduction’. The repetitiveness of this activity and the cyclicality correlated with it express the temporality of everyday life and the strategic nature of routinization: ‘ . . . the “fading away” inherent in the syntagmatic ordering of social interaction is consistent with a very marked fixity of form in social reproduction’ (Giddens, 1984). Second, the pragmatic approach of practice theorists argues that the relation between action and structure emerges ‘when action is habitualised; that is, when we develop dispositions to act in the same manner in familiar environments’ (Gronow, 2012). From this perspective, human action is embedded in the organization of practices and unfolds through continuous reproduction of practices (Warde, 2010). Patterns of consumption change as a result of the shifts in the organization of practices (Mylan and Southerton, 2008).
While some authors would argue that the allocation and coordination of the practices is strongly associated with the time of day (Torriti, 2017) and week (Sunday as rest day), others see institutionally timed events to coordinate and organize the temporal rhythm of everyday activities. Other accounts that affect the fixed temporal location of activities within the day emerge from the multiple social roles that requires coordination for the purpose of co-presence or participation of others, especially household members (Southerton, 2020). As a result, the temporal demands of everyday life can be understood as the outcome of the micro-coordination of activities that each contains different temporal demands (Southerton, 2006, 2020). These temporal demands are often expressed in terms of objective time parameters like duration of certain activities (e.g. working hours), sequence of activities (e.g. taking kids to school before going to work), tempo or speed of activities (e.g. cooking tends to happen every day), and timing of activities (e.g. school hours for children) (Van Tienoven et al., 2017). Related work shows that to coordinate and uphold the obligations of everyday life, we rely on routines that may vary according to social roles. For example, Van Tienoven et al. (2017) used the Belgian time-use survey data to form a weekly work grid to measure daily routine over 7 days. The authors conclude that everyday life is a social structure that is carried into effect by stable practices that vary in their degree based on the temporal and social positioning of the practitioners (people) and their shared knowledge of temporal order (Van Tienoven et al. 2017).
In the following section, we introduce the time diary data used in our analysis. We will use a relatively new but powerful method for studying sequences as networks to explore what patterns of stable practices can be identified.
Data and methods
The 2014–2015 UK time-use survey and creation of the Great Work Day
The analysis presented in this article is based on the UK 2014–2015 Time-Use Survey (Gershuny and Sullivan, 2017), which is the most recent time-use survey available in the UK. The data was collected between April 2014 and December 2015 from a nationally representative sample of the British population using a multi-stage stratified probability sampling. The sample size consists of 9388 individuals in 4238 households who completed 16,550 diaries and 3523-week-long work schedules. The time-use diaries provide 10-minute information about what, where and with whom individuals are during 1 weekday and 1 weekend day.
The 7-day work diaries recorded by 3523 respondents provided information about the time spent in paid work excluding lunch breaks and commute at 15-minute intervals. The work diaries were used to match individuals time use with time spent in paid work. A total of 407 work schedule diaries with either missing, inconsistent, duplicated records of day of the week or where there was no match between the first diary and start of work schedule were removed. Figure 1 highlights the differences in working time patterns between weekdays and weekend days. Not surprisingly, work-related activity is higher during weekdays than during weekends and working times tend to be shorter during the weekends. Furthermore, Figure 1 shows that relative to the typical 9 to 5 work pattern, there is significant variability when it comes to start and finish times of work spells.
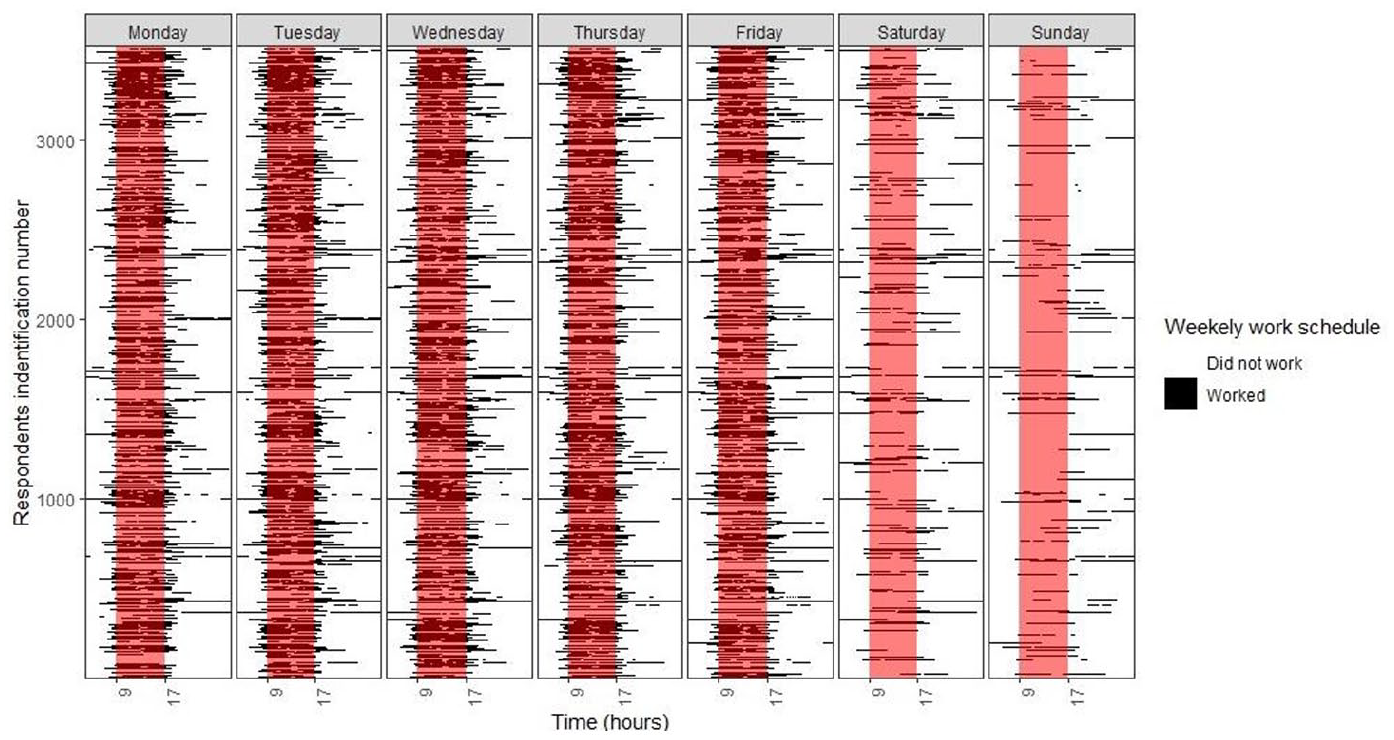
Seven-day work diaries by time of the day, sorted by personal identification numbers on the vertical axis – red bands highlight the 9 am to 5 pm time period.
We matched generic time-use diaries with the corresponding work diaries to identify participants time-use diary that was filled in on the first day of the work schedule and based on the identified time-use diary we created what we refer to as the Great Work Day, which is calculated as the total of the population time across the 24 hours (1440 minutes) of the day. This involves summing across all the day sequential activities to produce the average quantity time spent in each activity across the population (Gershuny and Sullivan, 2017). To obtain a clear picture of the association between work days and timing of activities we decided to focus only on time-use diaries that were filled in on the first day of the workweek.
Based on the self-reported daily work hours we divided our sample into two groups: individuals who reported working fewer than 35 hours per week (named as flexi times) and individuals who reported working more than 35 hours per week (named as fixed times). The following socio-demographic characteristics can be assigned to them based on the time-use data: students, parents, retirees, and other part-time workers. In addition, a number of workers hold two or more part-time jobs. According to time-use data, single people, couples with many children, and other full-time employees fall into the fixed category. The decision of splitting the sample based on the total number of hours followed the UK Government ‘Contracts of employment working hours’ document definition of part-time employment (UK Government, 2021).
Identifying routinized daily activities
Daily routines can be measured using time-use data by looking at patterns of activities over a certain period of time (e.g. days, weeks, or months) (Cornwell, 2018; Van Tienoven et al., 2017). In this article, we consider an activity to be stable if it occurs every day at the exact same time period. If somebody goes to sleep at the same time every day, 7 days a week, we consider the practice of going to sleep to be routine. The activity with the highest degree of regularity over the 7 weekdays is taken as an indicator of routine or stable practices (Van Tienoven et al., 2017) for a specific time slot. Whenever it was found that there were more than one activity with the highest occurrence frequency, it was considered that all of them constituted stable practices intersecting at that time slot.
For the purpose of our study, routine is characterized not only by the patterns in social activities throughout a given day (such as spending more time with children than with spouse), but how often such patterns are repeated over time (Giddens, 1984). Using the UK 2014–2015 Time-Use Survey, we identified four patterns of stable practices: sleep, paid work, television watching, and travel in the course of work from home.
Metrics and analytical strategy
Our aim is to examine individual’s actions throughout the Great Work Day to explore whether there are any trends that characterize their overall behaviour. To do this, we regard records of actions as instances of sequential behaviour. We use social sequence analysis techniques to recognize general behavioural trends of how people sequenced their behaviour (Cornwell, 2018). The idea of diagramming the connection between and within practices was set out by Kuijer (2014) and Higginson et al. (2015). The Higginson et al. (2015) study was further developed by McKenna et al. (2017) who used network theory techniques to analyse the 2000–2001 UK Time-Use Survey. They made use of network metrics such as node degree and centrality to identify the ‘most connected’ activities, which they suggest act as ‘hubs’ or ‘anchors’ within the overall network of activities and are therefore particularly central or important. Figures 2 and 3 show examples of the sequencing of activities as reported in time-use diaries. The nodes represent activity states and the connections show direction in time. The value of this type of representation is that it can reveal connections and coordination between activities, which may be critical in attempting to understand the fixities of everyday life.
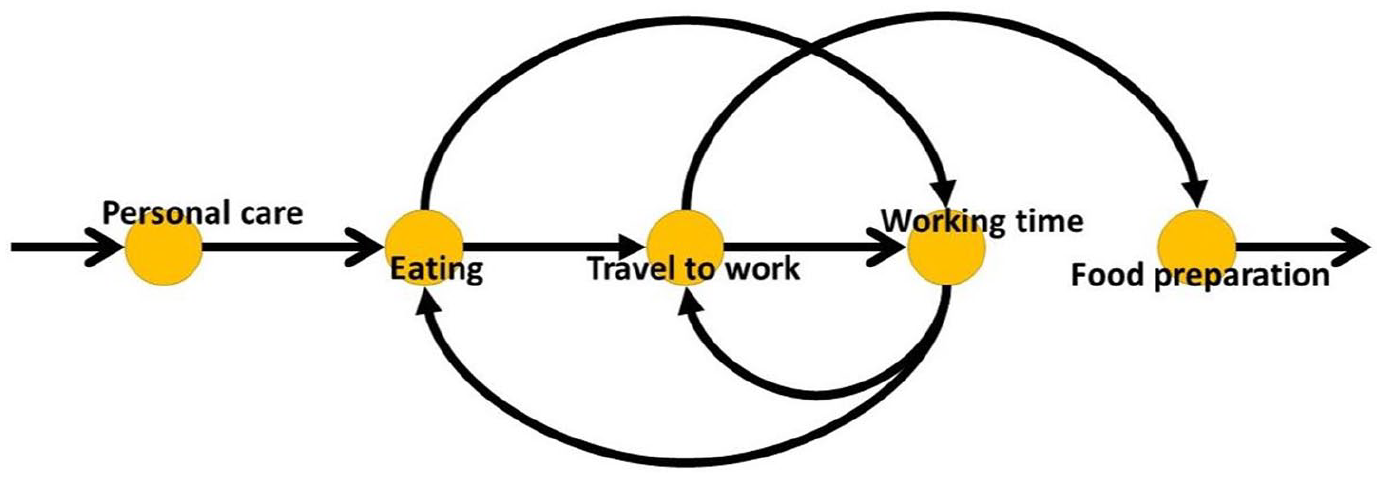
Sequence of activities (nodes) and their sequential flow in time (arrows).
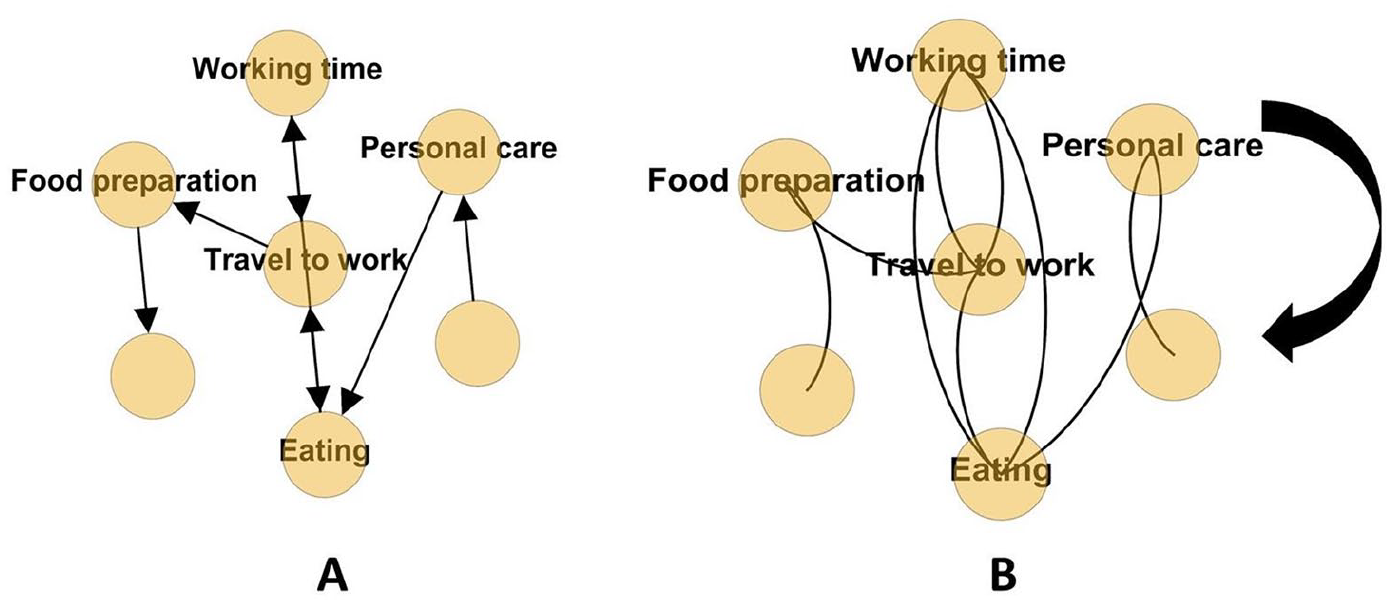
Network graph of activity sequences: straight (A) and curved (B) edge representation.
We use a similar approach where the nodes represent the primary activities reported by individuals throughout the day. However, the connections between the activities are weighted by the proportion of individuals switching from one activity at the time t to another one at the time t + 1. The absence of connection represents a no switch between activities. The arrows of the edges denote the direction of the connections between different nodes. In addition, in Supplemental Annex 2, there is information on network statistics used to characterize stable practice networks.
But importantly, in this article we are not diagramming the connections between social practices (see the ‘Regularized sequence patterns’ section for discussion on time) instead we are complementing the Van Tienovan et al. (2017) study by revealing the socio-temporal positioning and multiple interactions and interconnections between activities that define stable practices based on different work schedules.
With regard to metrics, Supplemental Annex 2 shows the different metrics used to measure the characteristic of stable practices.
Findings
Duration and timing
As we discussed in the ‘Identifying routinized daily activities’ section, the activities observed in the empirical time-use data are considered to be stable if they consistently occur at the same time of day. Thus, another way of visually inspecting the identified stable practices is through the use of heat maps that correspond to the joint frequency distribution of the duration of activity periods with respect to the time of day (Figure 4). In these representations, the colouring indicates the relative frequency; the darker the colour the lower the frequency of the stable practice in question during a particular time slot.
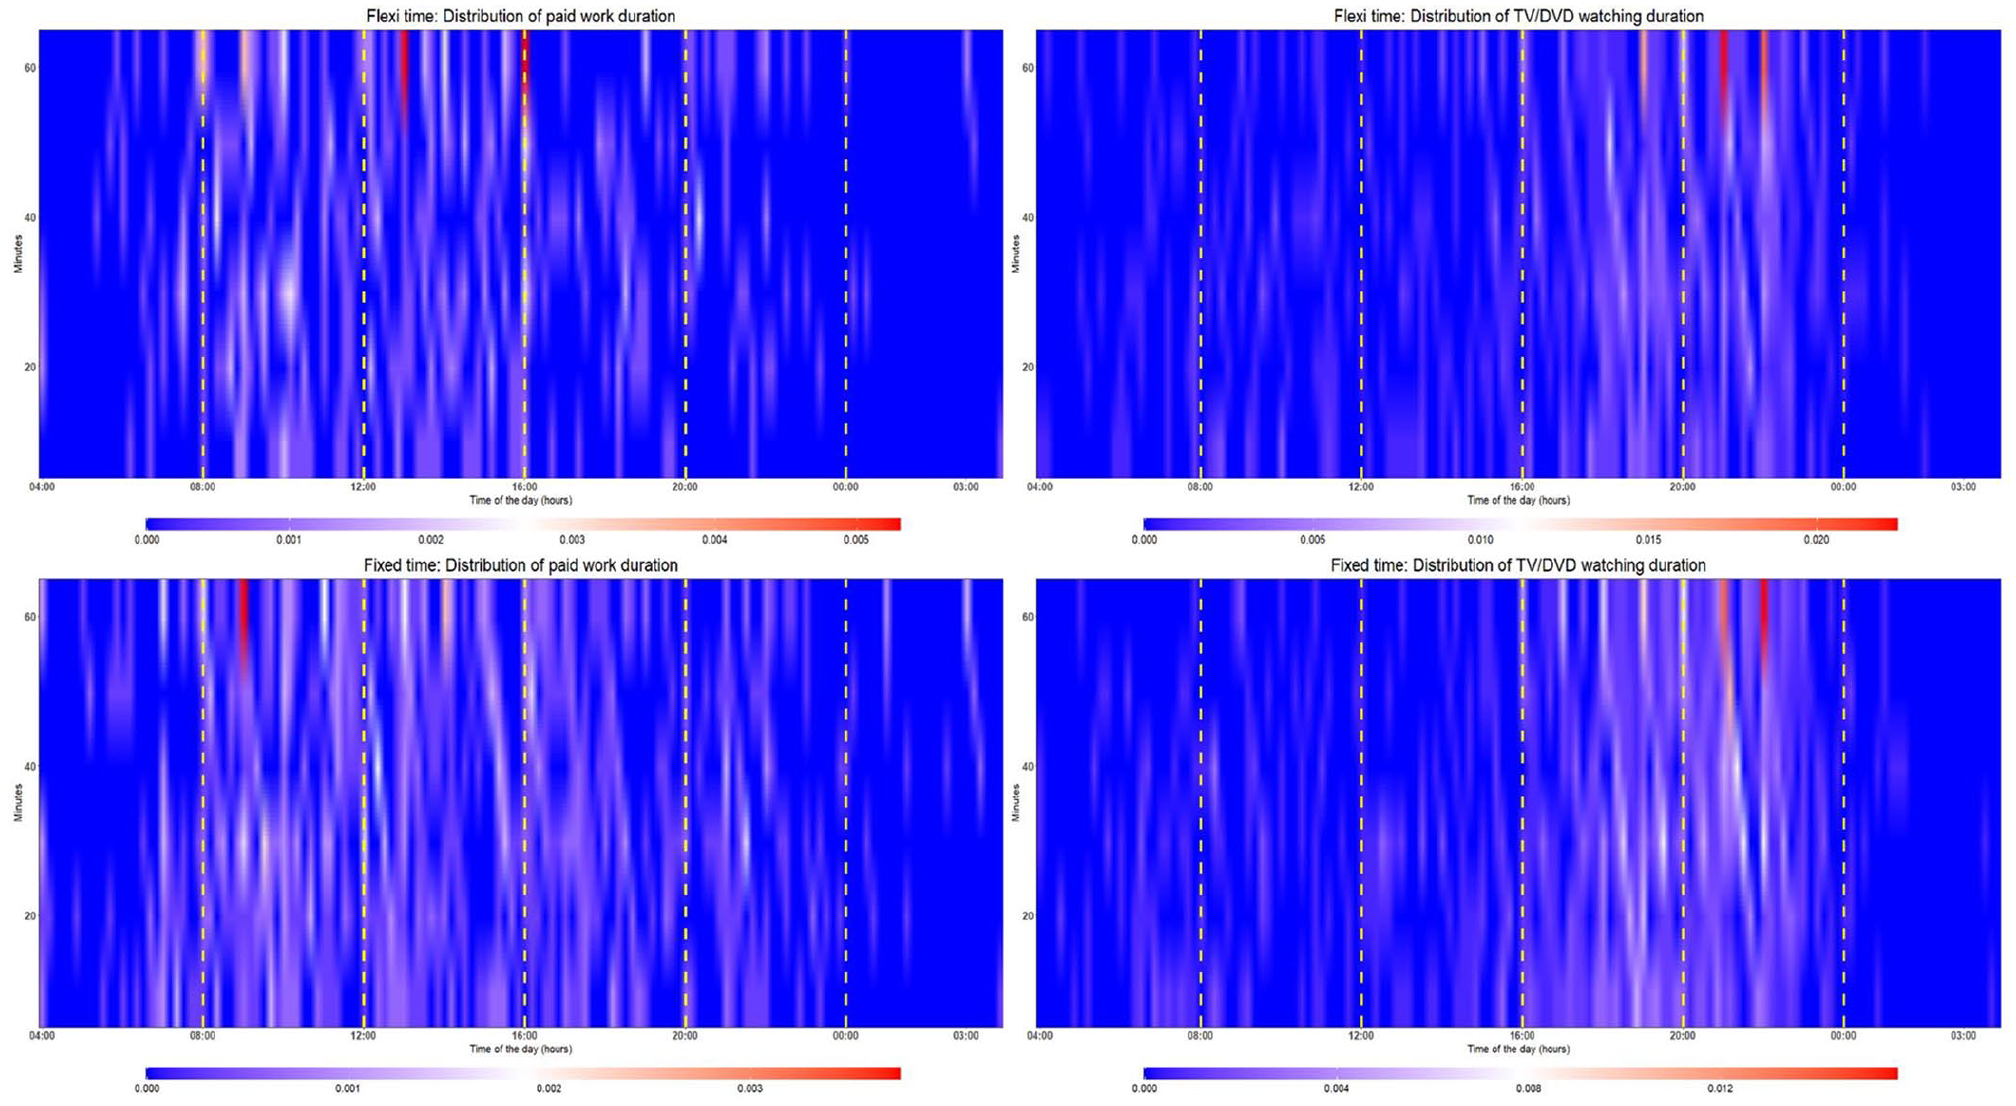
The visualization of the timings of stable practices within daily life (the darker the colour, the lower the frequency of the stable practice).
As shown in Figure 4, the timings and time devoted to the stable practices varies based on the rigidity of the working schedules. The most interesting finding from this picture is the difference in the stability of the practices in the morning and afternoon. Paid work routine stands out more in the morning thus is more ‘routineous’, while during the afternoon paid work is less stable. People on fixed time schedules are likely to start their work at the same time, they probably work every day. Conversely, those on flexi time schedules are more pronounced between 1 pm and 4 pm, indicating that paid work is more likely to be more ‘routineous’ during the afternoon than in the morning. Thus, we don’t find evidence that work schedules negatively affect the routine of sleep. Throughout the day watching television is the most reported stable practice with the highest percentage of TV watching sequences occurs at 8 pm for flexi time schedules and 9 pm for the fixed time schedules. The heat map figures made possible to visualize the concentration of stable practices as well to identify the exact hotspot of the patterns of stable practices. They fail to address the fact that there are micro-transitions between activities (Cornwell, 2018). The dynamics of this switching behaviour are central to the process through which routines emerge and are sustained, or routinization (Giddens, 1984).
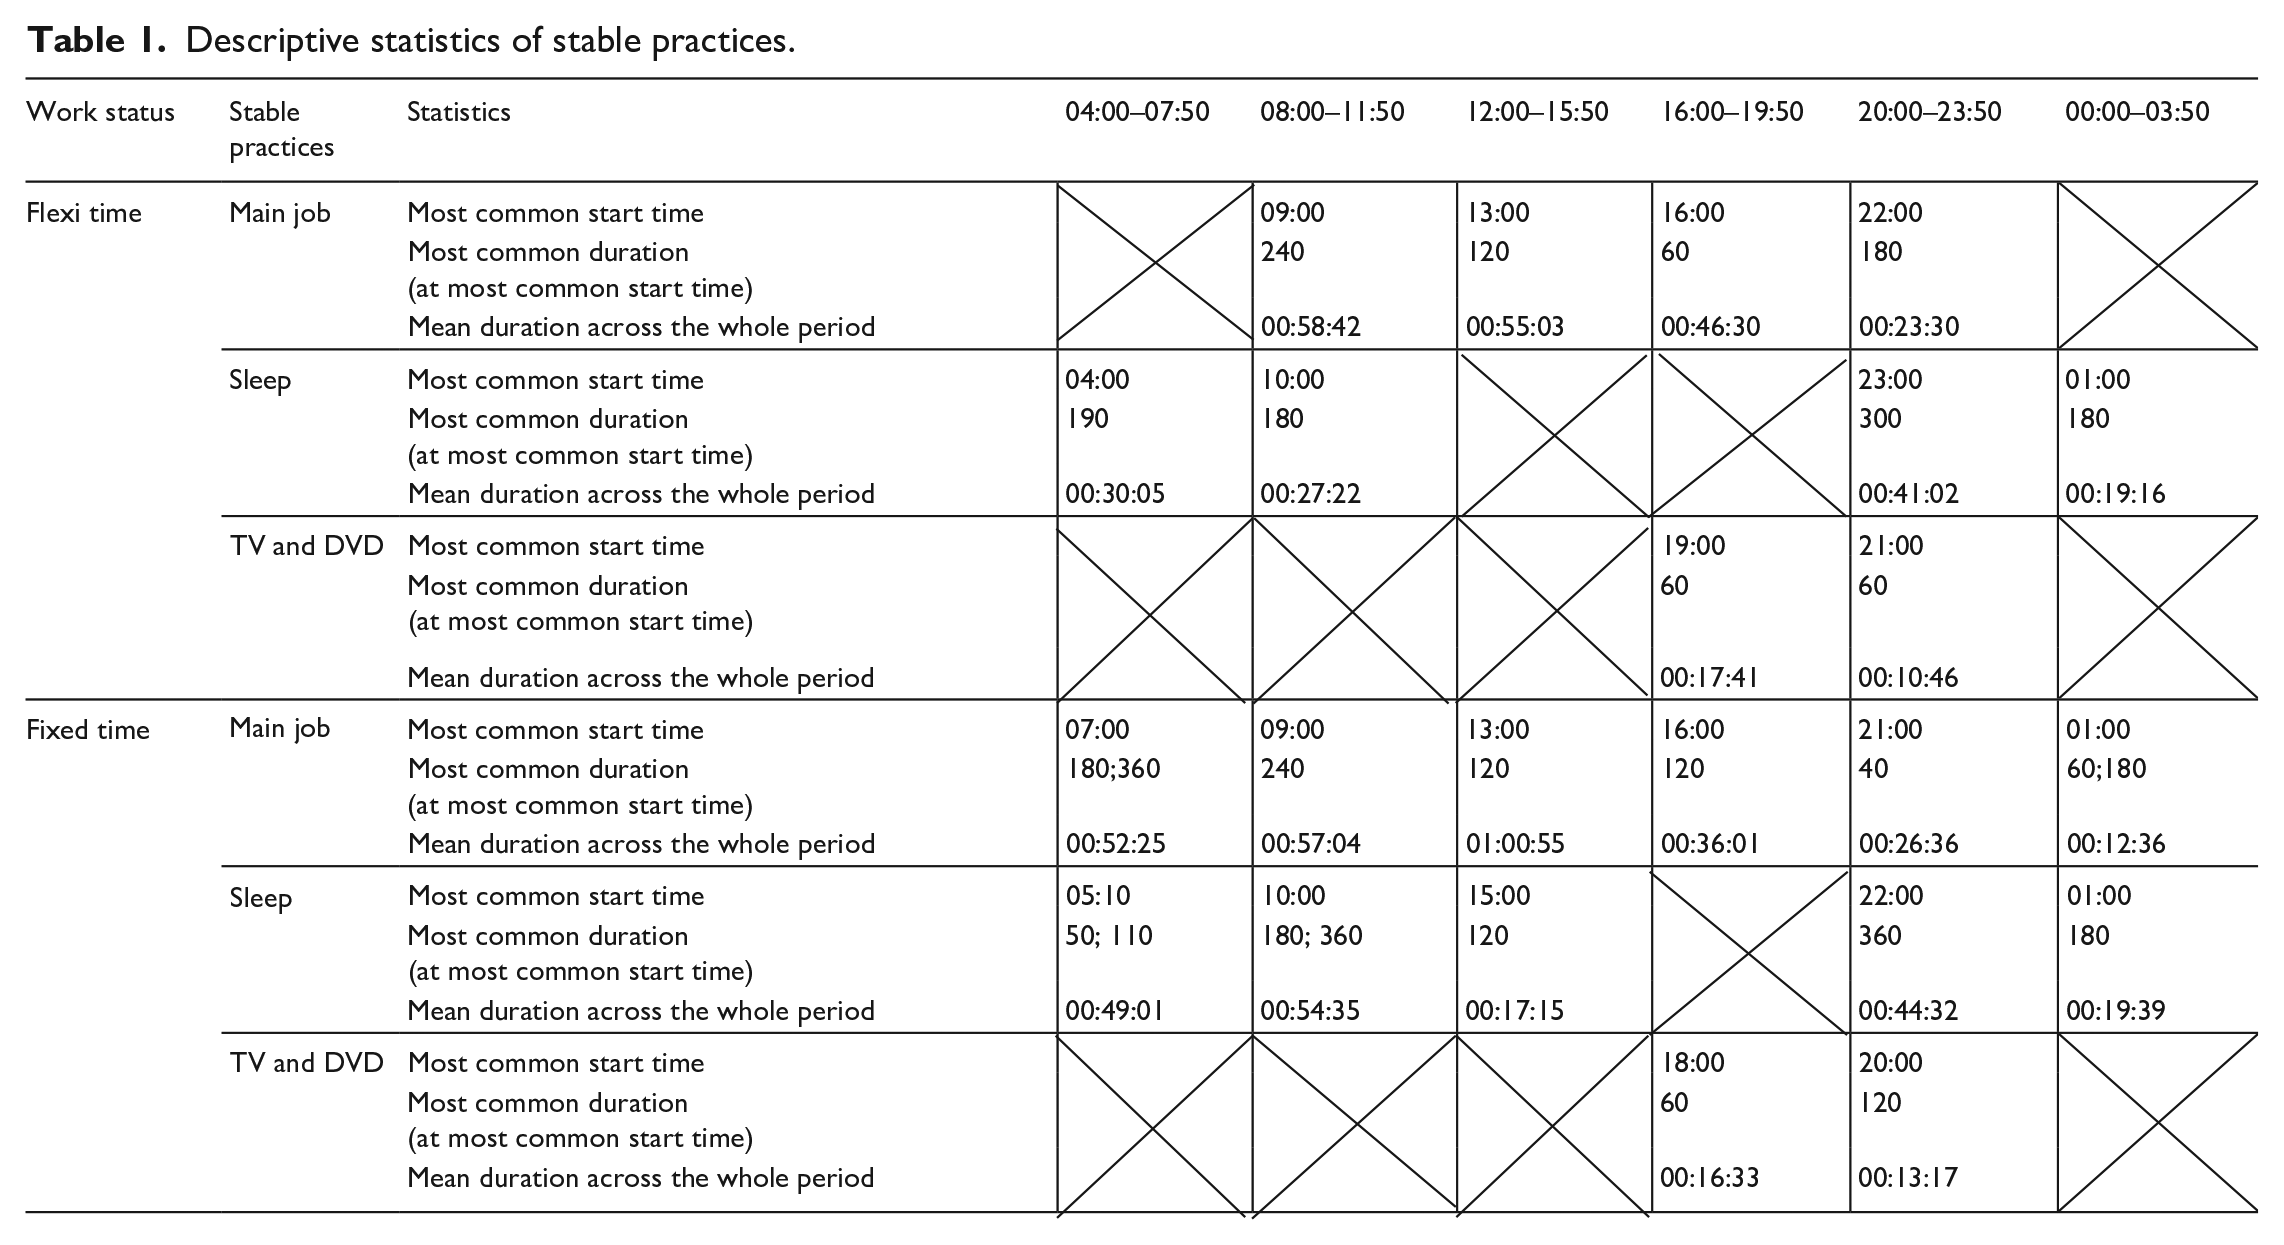
Table 1 provides a summary of the key temporal characteristics of the stable practices patterns observed. Here, we found evidence of the rigid timing and rigid duration of daily routines. Some interesting findings between the two samples can be identified from Table 1. First, it is noteworthy that the mean duration across the different time-periods of stable practices for fixed time work schedules is longer than the flexi time ones. Second, the common start time for the flexi time work schedules seems to be more varied than in the fixed one. Third, the timing of sleep stable practice in the morning in both work schedules is varied regardless of the length of paid work time, but the position of the timing of sleep practices in the afternoon seems to be earlier for those who engaged in fixed paid work schedules. Fourth, the stability of working practices had a positive correlation with the stability of television watching practices. In addition, people on fixed times tend to start their stable TV watching practices earlier and their level of commitment is higher during the night-time. Fifth, in the case of those respondents doing night shifts there appears to be an inverse relationship between working times and sleep duration, suggesting that people on night shifts are less likely to have a pattern corresponding to a stable sleep practice.
Descriptive statistics of stable practices.
The heat map figures made possible to visualize the concentration of stable practices as well to identify the exact hotspots in the patterns of stable practices. In the following section, we visualize routinization or the process by which individuals’ activities become more (or less) routine over time.
Switching dynamics
Table 2 provides a snapshot of the structural effects of the contracted working arrangements on the formation of daily routines. In this article, we consider an activity to be stable (or routinized) if it occurs every day at the exact same time period. If somebody goes to sleep at the same time every day, 7 days a week, we consider the activity of going to sleep to be routine. From Table 2, we see that some time periods (e.g. 4 pm–7:50 pm) stand out and the highest number of connections between work related and stable practices occurred during the evening period, while the lowest number during night and early morning. This finding supports the argument that the interconnectedness of external factors continuously influences the microsocial dynamics (Giddens, 1984).
Descriptive statistics of stable practices.
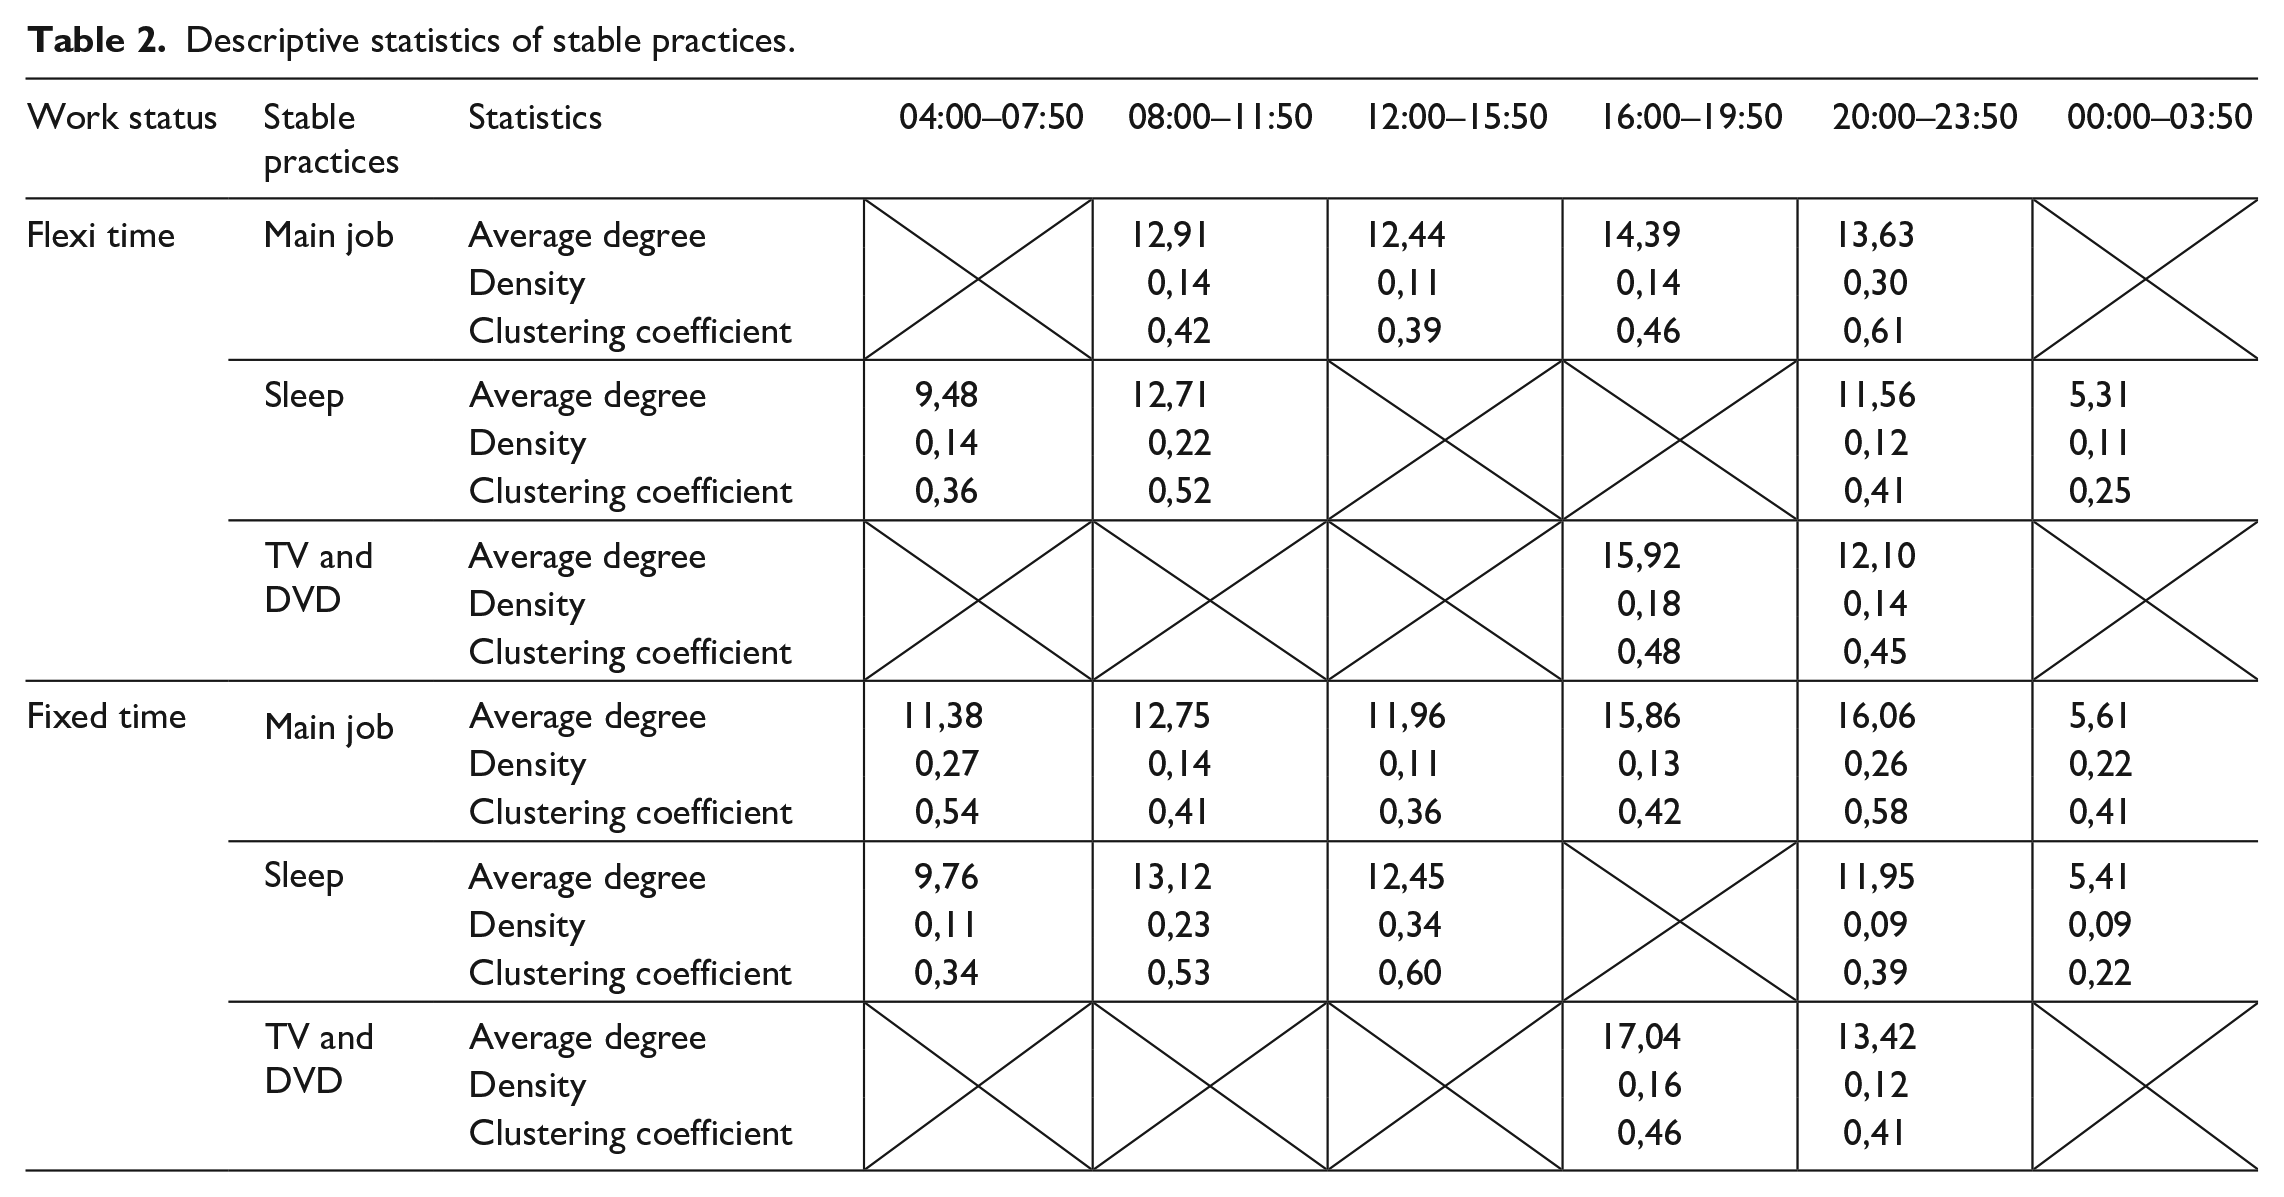
While Table 1 suggests that during the morning in both work schedules people allocated almost the same mean duration to the main job practice, Table 2 network statistics show that they have almost the same mean number of connections (e.g. average degrees) during this period. In other words, it would suggest that the timing of the main job is fixed by the different connections – other than work arrangements themselves- within main job practice. Conversely, during the evening when in both work schedules the common mean duration are different (Table 1) the mean number of connections (e.g. average degree) within fixed time work schedule is higher than in flexi time work schedule. Overall, these results point to high time dependence in the sequencing of stable practices. Similarly, regardless of their working hours, during the evening period (4 pm–7:50 pm) people allocated almost the same time on average for TV watching, but the average number of connections between activities during this period is different. This would reveal important differences between employees with respect to how they transitioned between their social roles (e.g. towards parenting) during specific time periods (Cornwell, 2018).
Perhaps even more importantly, stable practice networks metrics reveal that work tends to concentrate around certain times for the flexi time category, as opposed to the fixed time one. The density metric is used to capture the percentages in the connections between activities that are reinforcing the timings of the daily routines. Network densities vary considerably throughout the day. The highest density scores were measured in the case of the travel related routines suggesting a high degree of coordination between activities. This can be explained with fixed travel times that need to be coordinated with others and synchronized with other activities. If television watching has the highest number of average connections, it has the lowest density scores. Perhaps, from a more practical perspective, this finding suggests that the television remains important for the evening patterns of leisure activities.
Correlation between network metrics
As the degree distributions and centrality measures are not typically normally distributed, non-parametric statistical tests – namely, Kruskal–Wallis and Dunn tests – were applied to determine whether there are significant differences between the distributions associated with the two types of work schedules, fixed and flexi time.
The Kruskal–Wallis test (Table 3) identified statistically significant differences between the flexi and fixed times. To study how these distributions vary with respect to the period of the day, we conducted a series of Dunn’s tests.
Kruskal–Wallis correlation coefficients between network metrics.
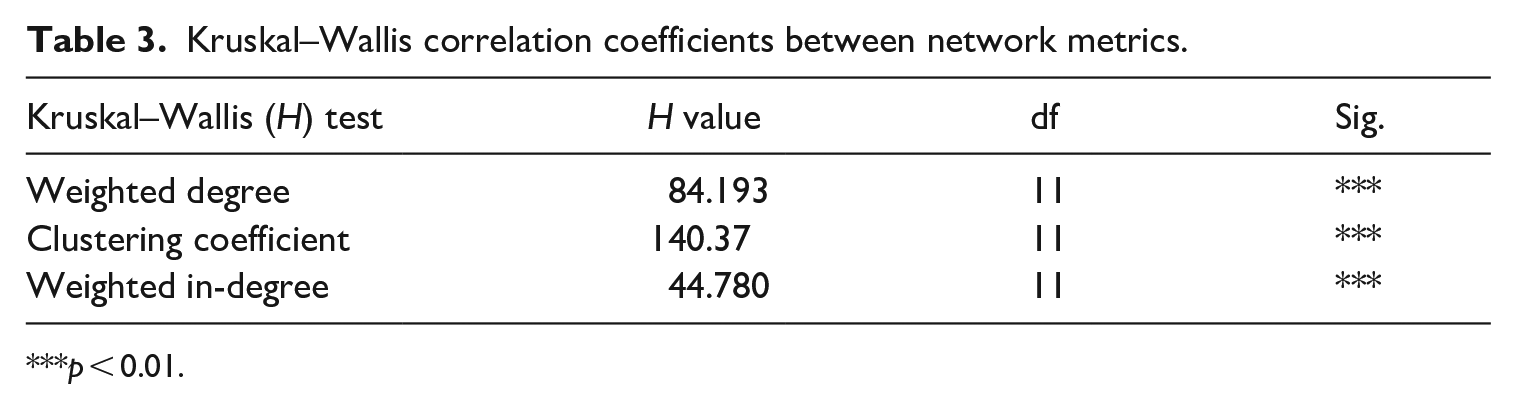
***p < 0.01.
Figure 5 shows which stable practice centrality measures significantly correlate during the morning and evening time periods. Results of the correlation test support that the sequencing within stable practice varies based on work clock. Furthermore, the degree centrality coefficient values follow an increasing trend; Dunn’s testing revealed a statistically significant difference in weighted degree values between 4 am–7:50 am and 12 pm–3:50 pm (p < 0.001), 4 am–7:50 am and 4 pm–7:50 pm (p < 0.001) periods. The post hoc test also indicates that the clustering coefficient of the stable practice networks during the 4 pm–7:50 pm period is significantly different from the 8 am–11:50 am and 12 pm–3:50 pm periods. This would mean that the performances of the stable practices are significantly different during these periods.
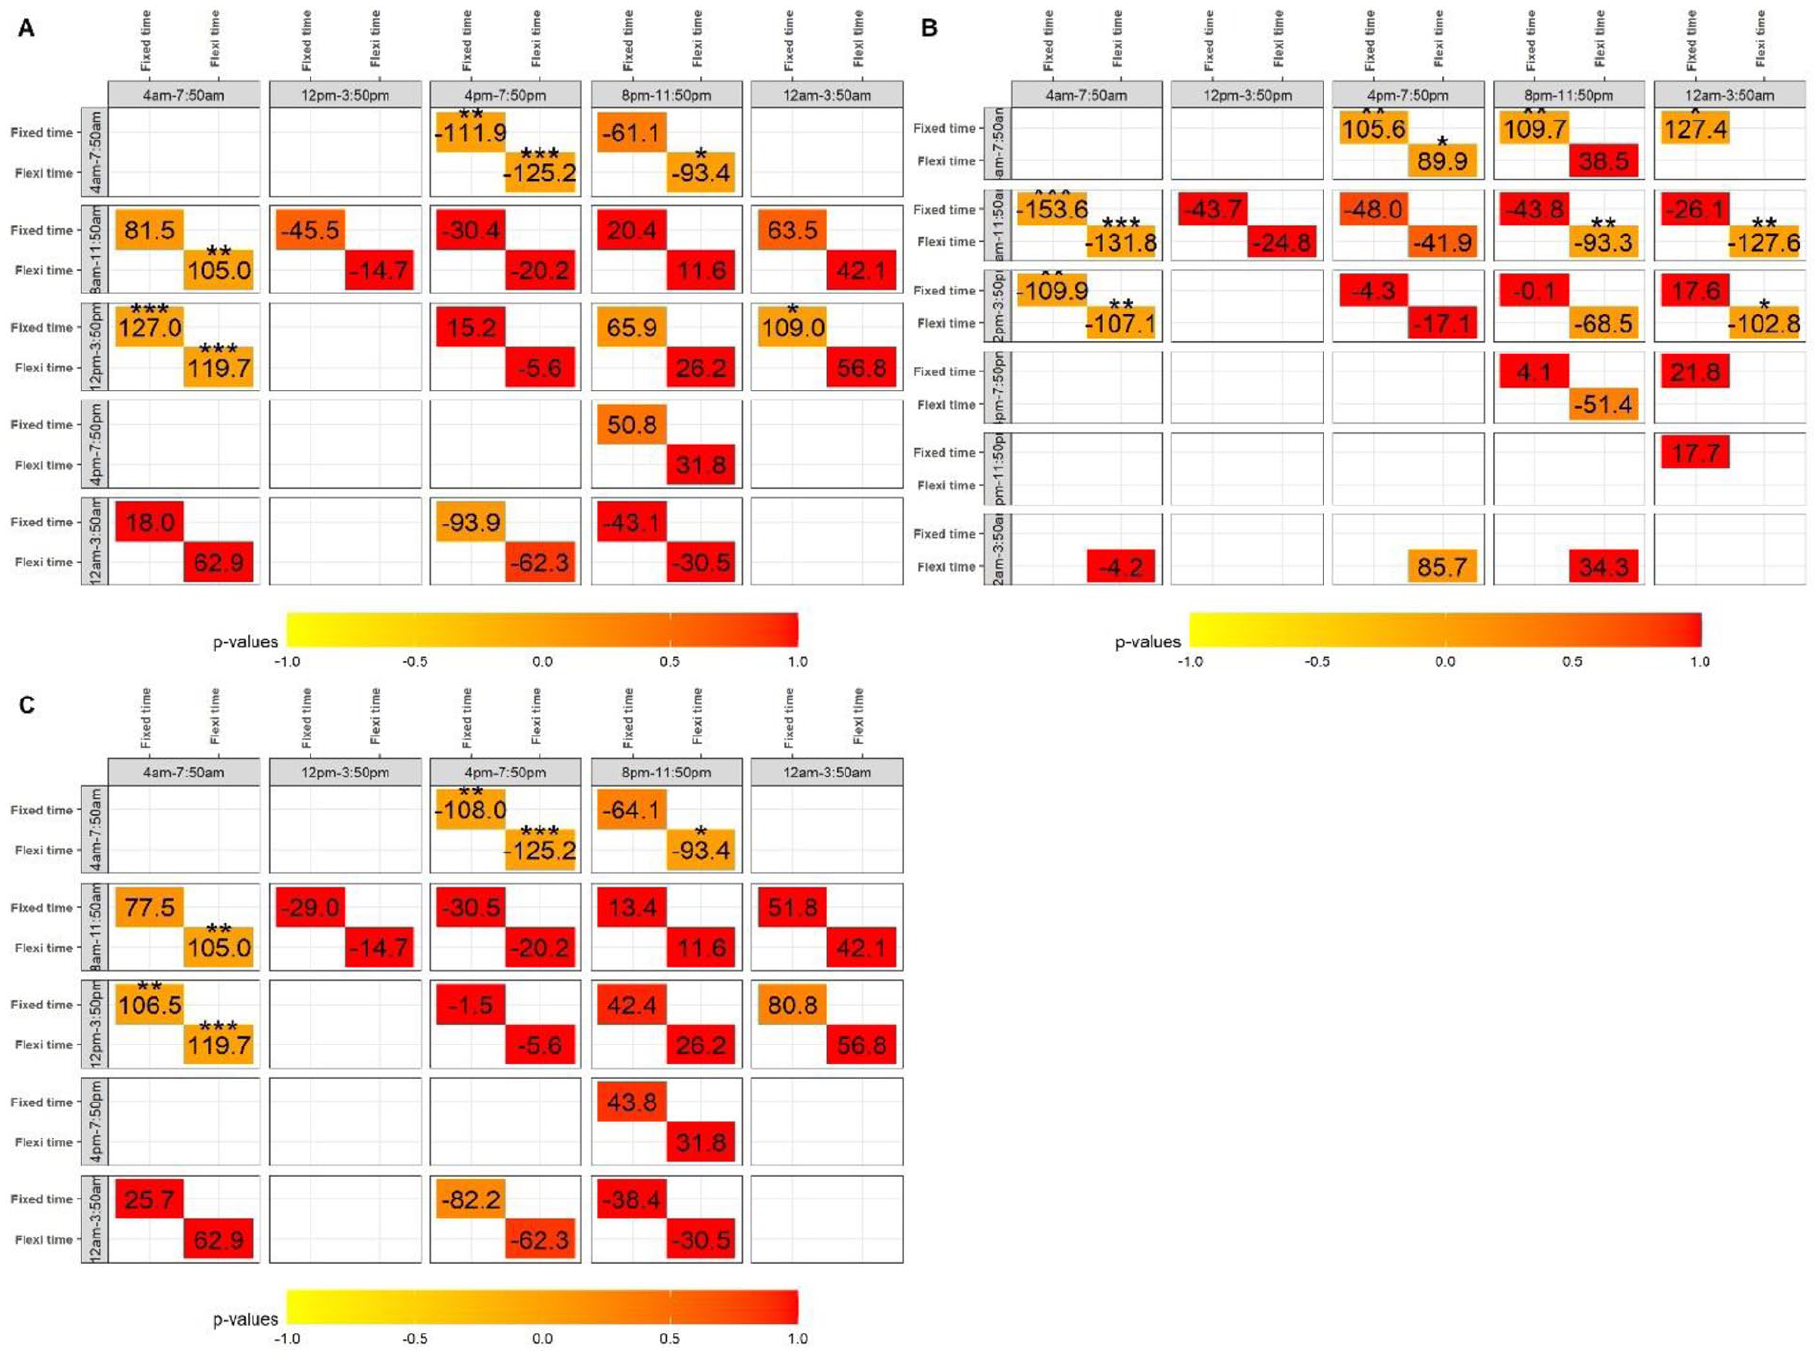
Dunn’s tests between distributions of different network metrics: A – weighted degree, B – cluster coefficient, C – weighted in-degree.
Furthermore, Dunn’s test shows that the distribution of in-degree values of the stable practice networks, as well as the number of direct connections, are significantly different during the 12 pm–3:50 pm and 4 am–7:50 am periods. In summary, post hoc Dunn’s test revealed that the values of metrics such as weighted degree, clustering coefficient and weighted-in degree associated with the periods corresponding to before (12 pm–3:50 am) and after (4 pm–7:50 pm) work exhibit statistically significant discrepancies.
Connection between work-related activities and stable practices
To explore the connections between work-related activities and stable practices we used the modularity metrics. The usefulness of this metric is that it allows us to divide the daily routine network into modules of activities and to measure the strength of the connections between work-related activities within these modules. In this context, stable practices are part of recognizable and interconnected clusters of activities that are defined by the time and space in which they are performed.
In Figure 6, we ‘zoom-in’ on the multiple connections within the stable practice clusters. In this case, the activity nodes are sized based on their number of connections (both incoming and outgoing). Red coloured nodes denote work-related activities (Supplemental Annex 1) while yellow nodes were used to highlight other type of activities. The thickness of the edge represents the strength of the connection between the activities. In general, all practices are connected with the stable practice and some are connected with each other. The network statistics indicate that the performance of stable practices widely vary within the working days. Furthermore, the modules reveal ‘locking-in’ trends towards stable practices. Thus, it suggests that regardless of the work hours, the work-related activities are mainly locked in by the main job stable practice. The highest number of density scores is identified during 8 pm and 11:50 pm, suggesting high coordination around work-related activities. The lowest coordination between activities within stable practice modules was measured between 4 am and 7:50 am in the case of sleep stable practice.
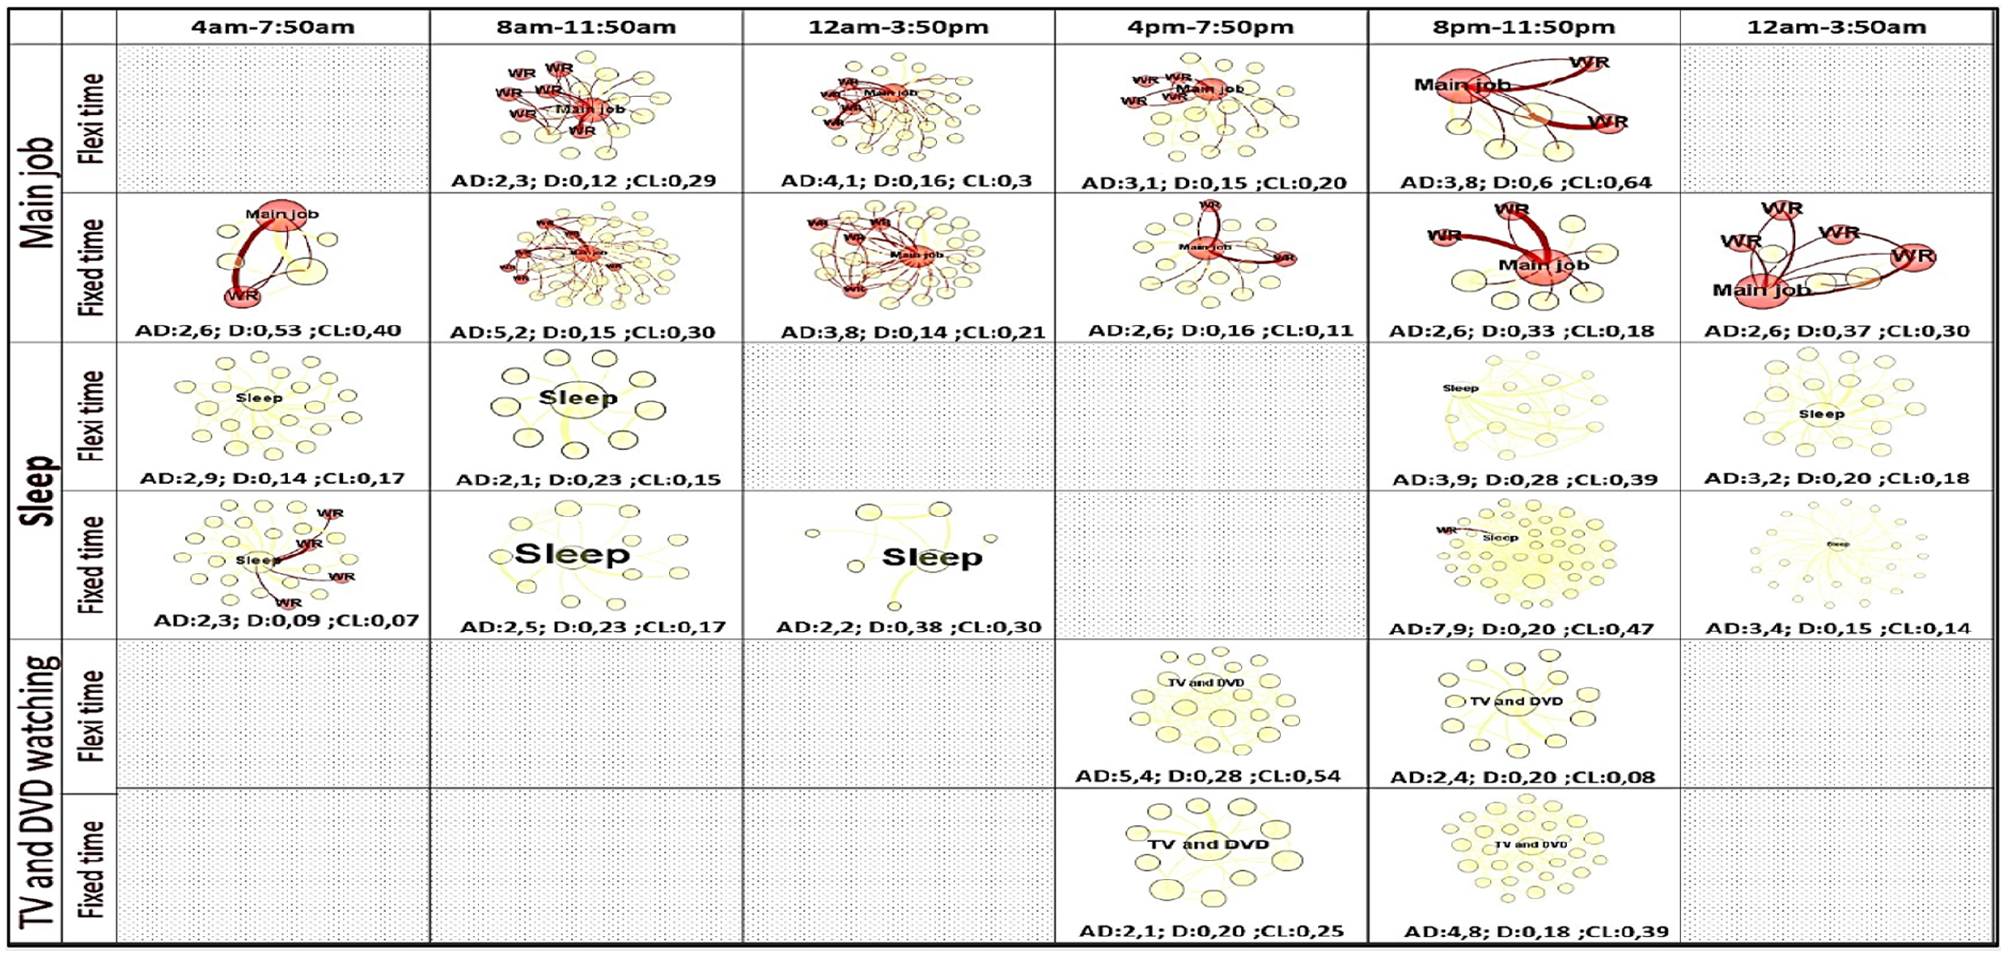
Connection between work-related activities and stable practices: red – work-related activities and yellow – other type of activities.
While the stable practice networks do not explain why this may be happening, it reveals how stable practices occupy a central role within their module and this can be used to form hypothesis about how changes to it could impact other activities. Furthermore, as Figure 6 suggests there might be certain (inter-)dependencies in the temporal ordering of stable practices influenced by the number of working hours. It seems that we face a trade-off in which stable practices (such as work-related stable practices) are the best way to coordinate the problems and social demands of a busy life or that temporal structures of collectively shared rhythms put pressure on parts of the day in a way that can only be handled by establishing stable practices (such as sleep) (Van Tienoven et al., 2017).
Similar patterns of behaviour
In the previous sections, we explored the way the duration, timing and coordination of the work-related activities affect the emergence of the stable practices. Figure 7 represents the sequencing of the most influential activities (e.g. those with the highest number of connection) within stable practice networks. The nodes are coloured based on their modularity rank. Nodes with the same colour belong to the same module. In this case edges have the same colours as their source activities. The thickness of the edge represents the strength of the connection between the activities. In the case of stable practices, we included the weighted edge values to highlight the way in which the connections between stable practices vary within the day.
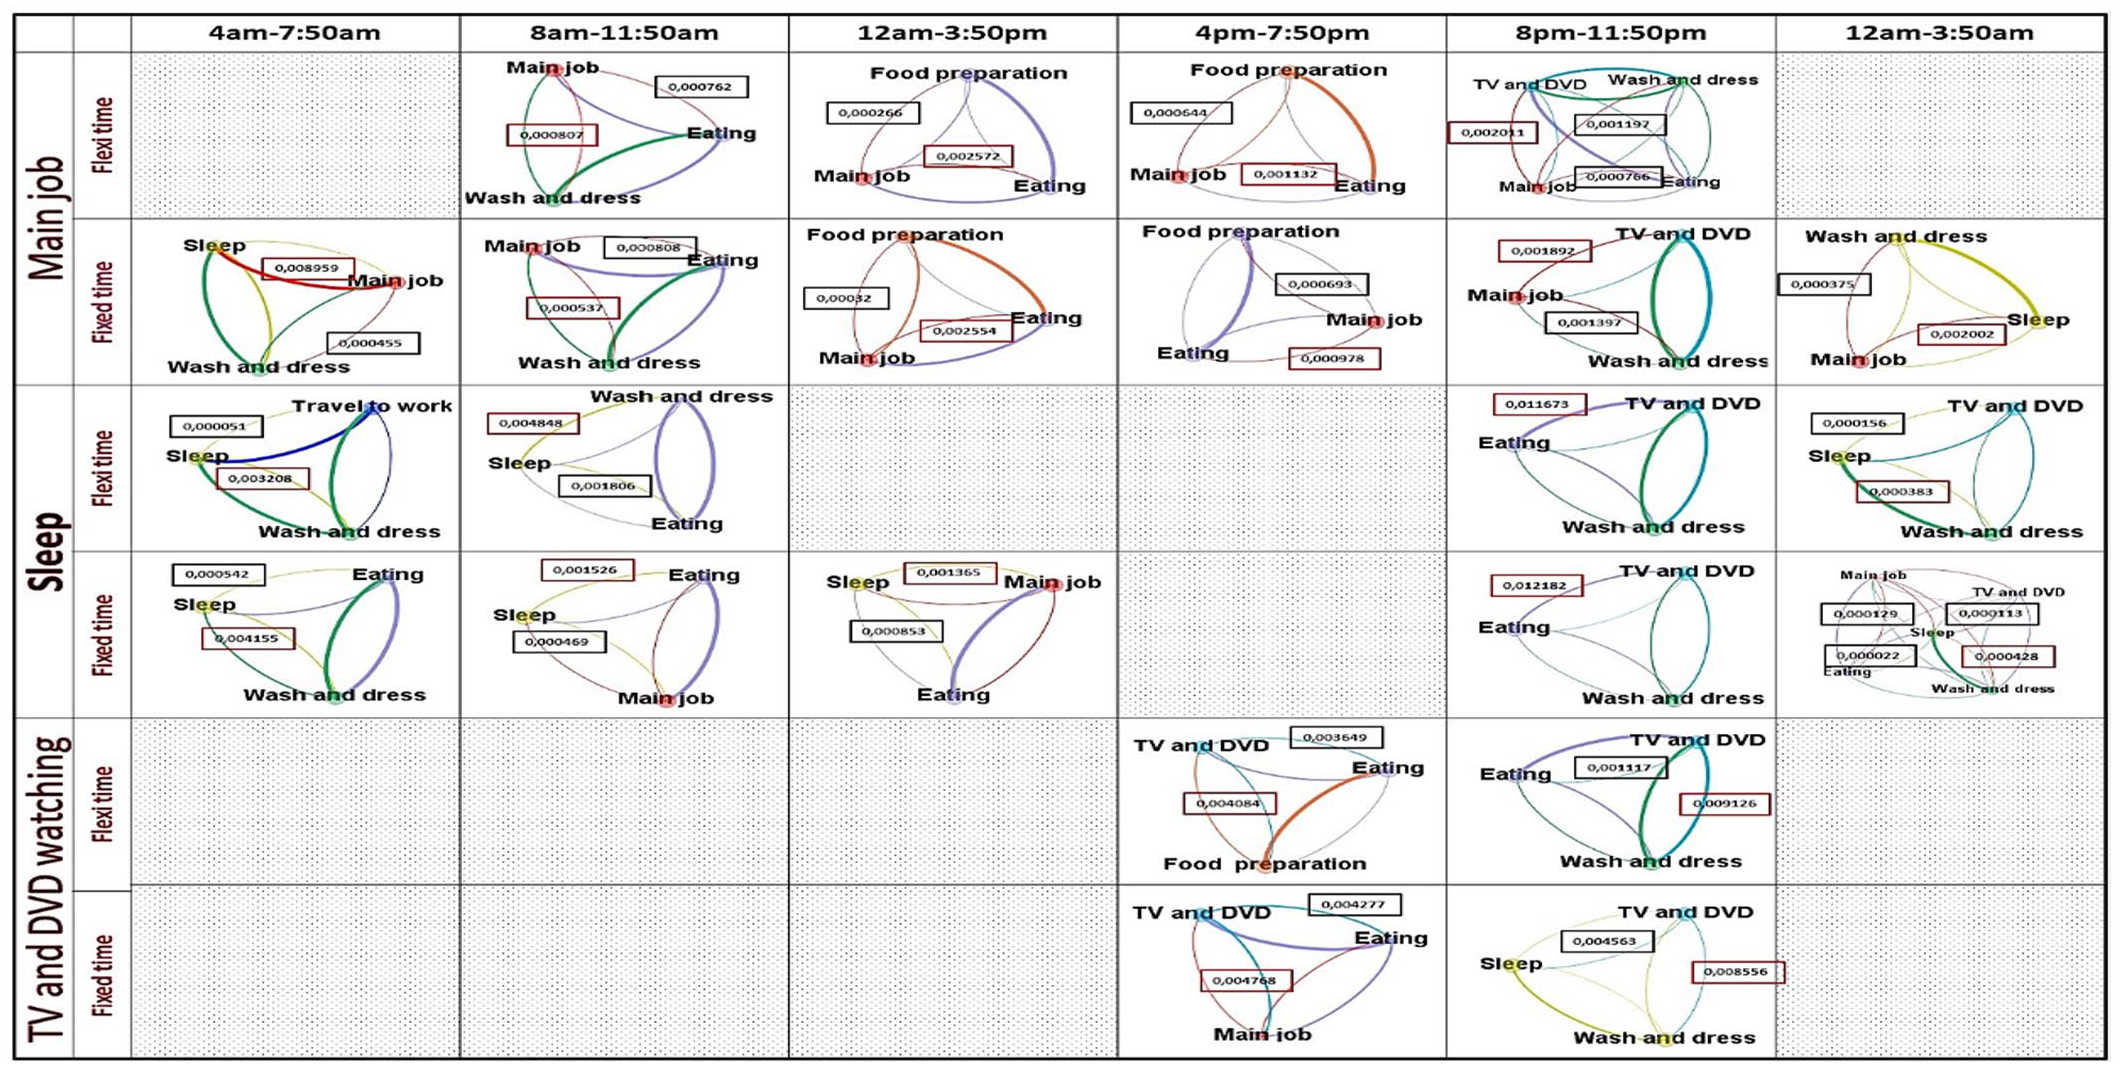
The most frequent connections within stable practice.
Figure 7 suggests several implications of the time and space dimensions of stable practices. First, the sequencing of activities throughout the day is broadly similar for most people regardless of their working arrangements. Second, the strength of the connections between activities varies throughout the day, hence suggesting a dynamic interaction between practices. Perhaps this variability in the strength of the connections is an indication of the existence of ‘appropriate times’ to perform different practices as suggested elsewhere (Southerton, 2020). This, for example, may well be the case of food preparation practices. During this time-period (4 pm–7:50 pm) the strongest connection is between main job and eating. Figure 7 also reveals time dependence in the sequencing of stable practices suggesting that the strength of the connections between stable practices is influenced by the duration of the work. Regardless of the working arrangements, Figure 7 suggests that there are several common, ‘normalized’ patterns of behaviour that make everyday life predictable and manageable by individuals (Giddens, 1984).
Breaking routines
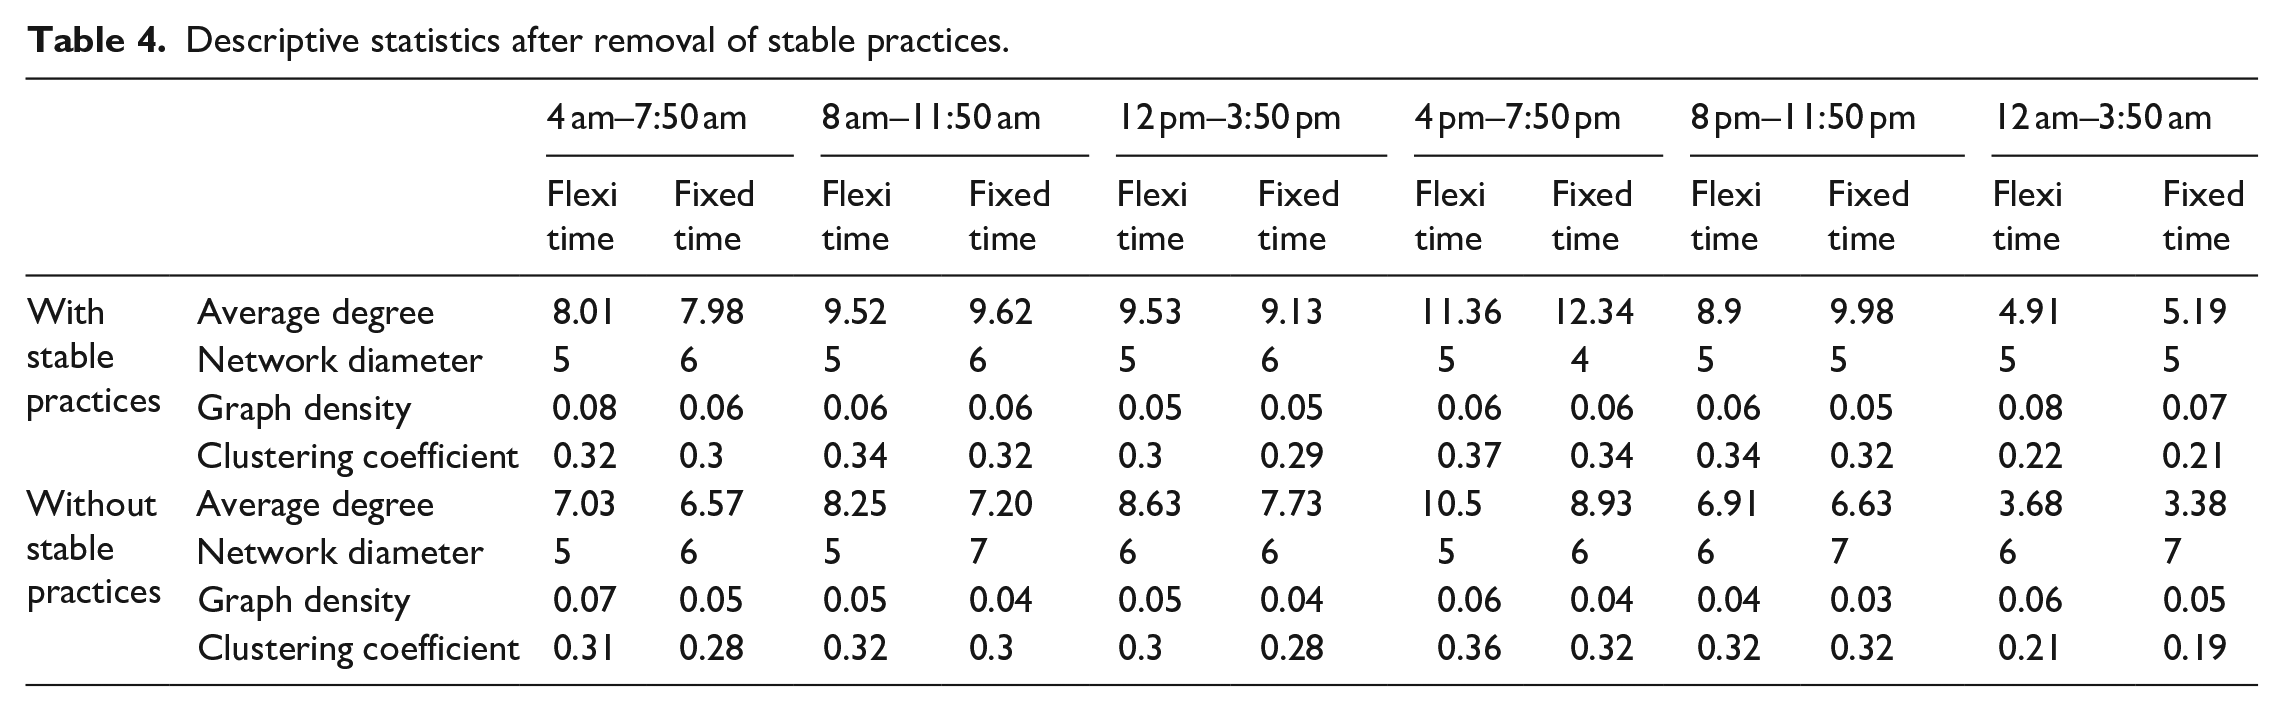
The comparison of network densities across the different time periods provides an indication of the cohesion between activities with and without stable practices (Table 4). This would suggest that cohesion between activities is stronger within stable practice networks. The low densities in the networks without stable practices indicate the existence of multiple fragmented and isolated activity networks (or modules) within the stable practice network. This is also underlined by the high diameter and low clustering coefficient scores that suggest low coordination (e.g. multiple connections) between practices, specifically during the evening periods. This would suggest that further exploration of the stable practice networks is required to get a more thorough understanding of the way connections form and break within their networks.
Descriptive statistics after removal of stable practices.
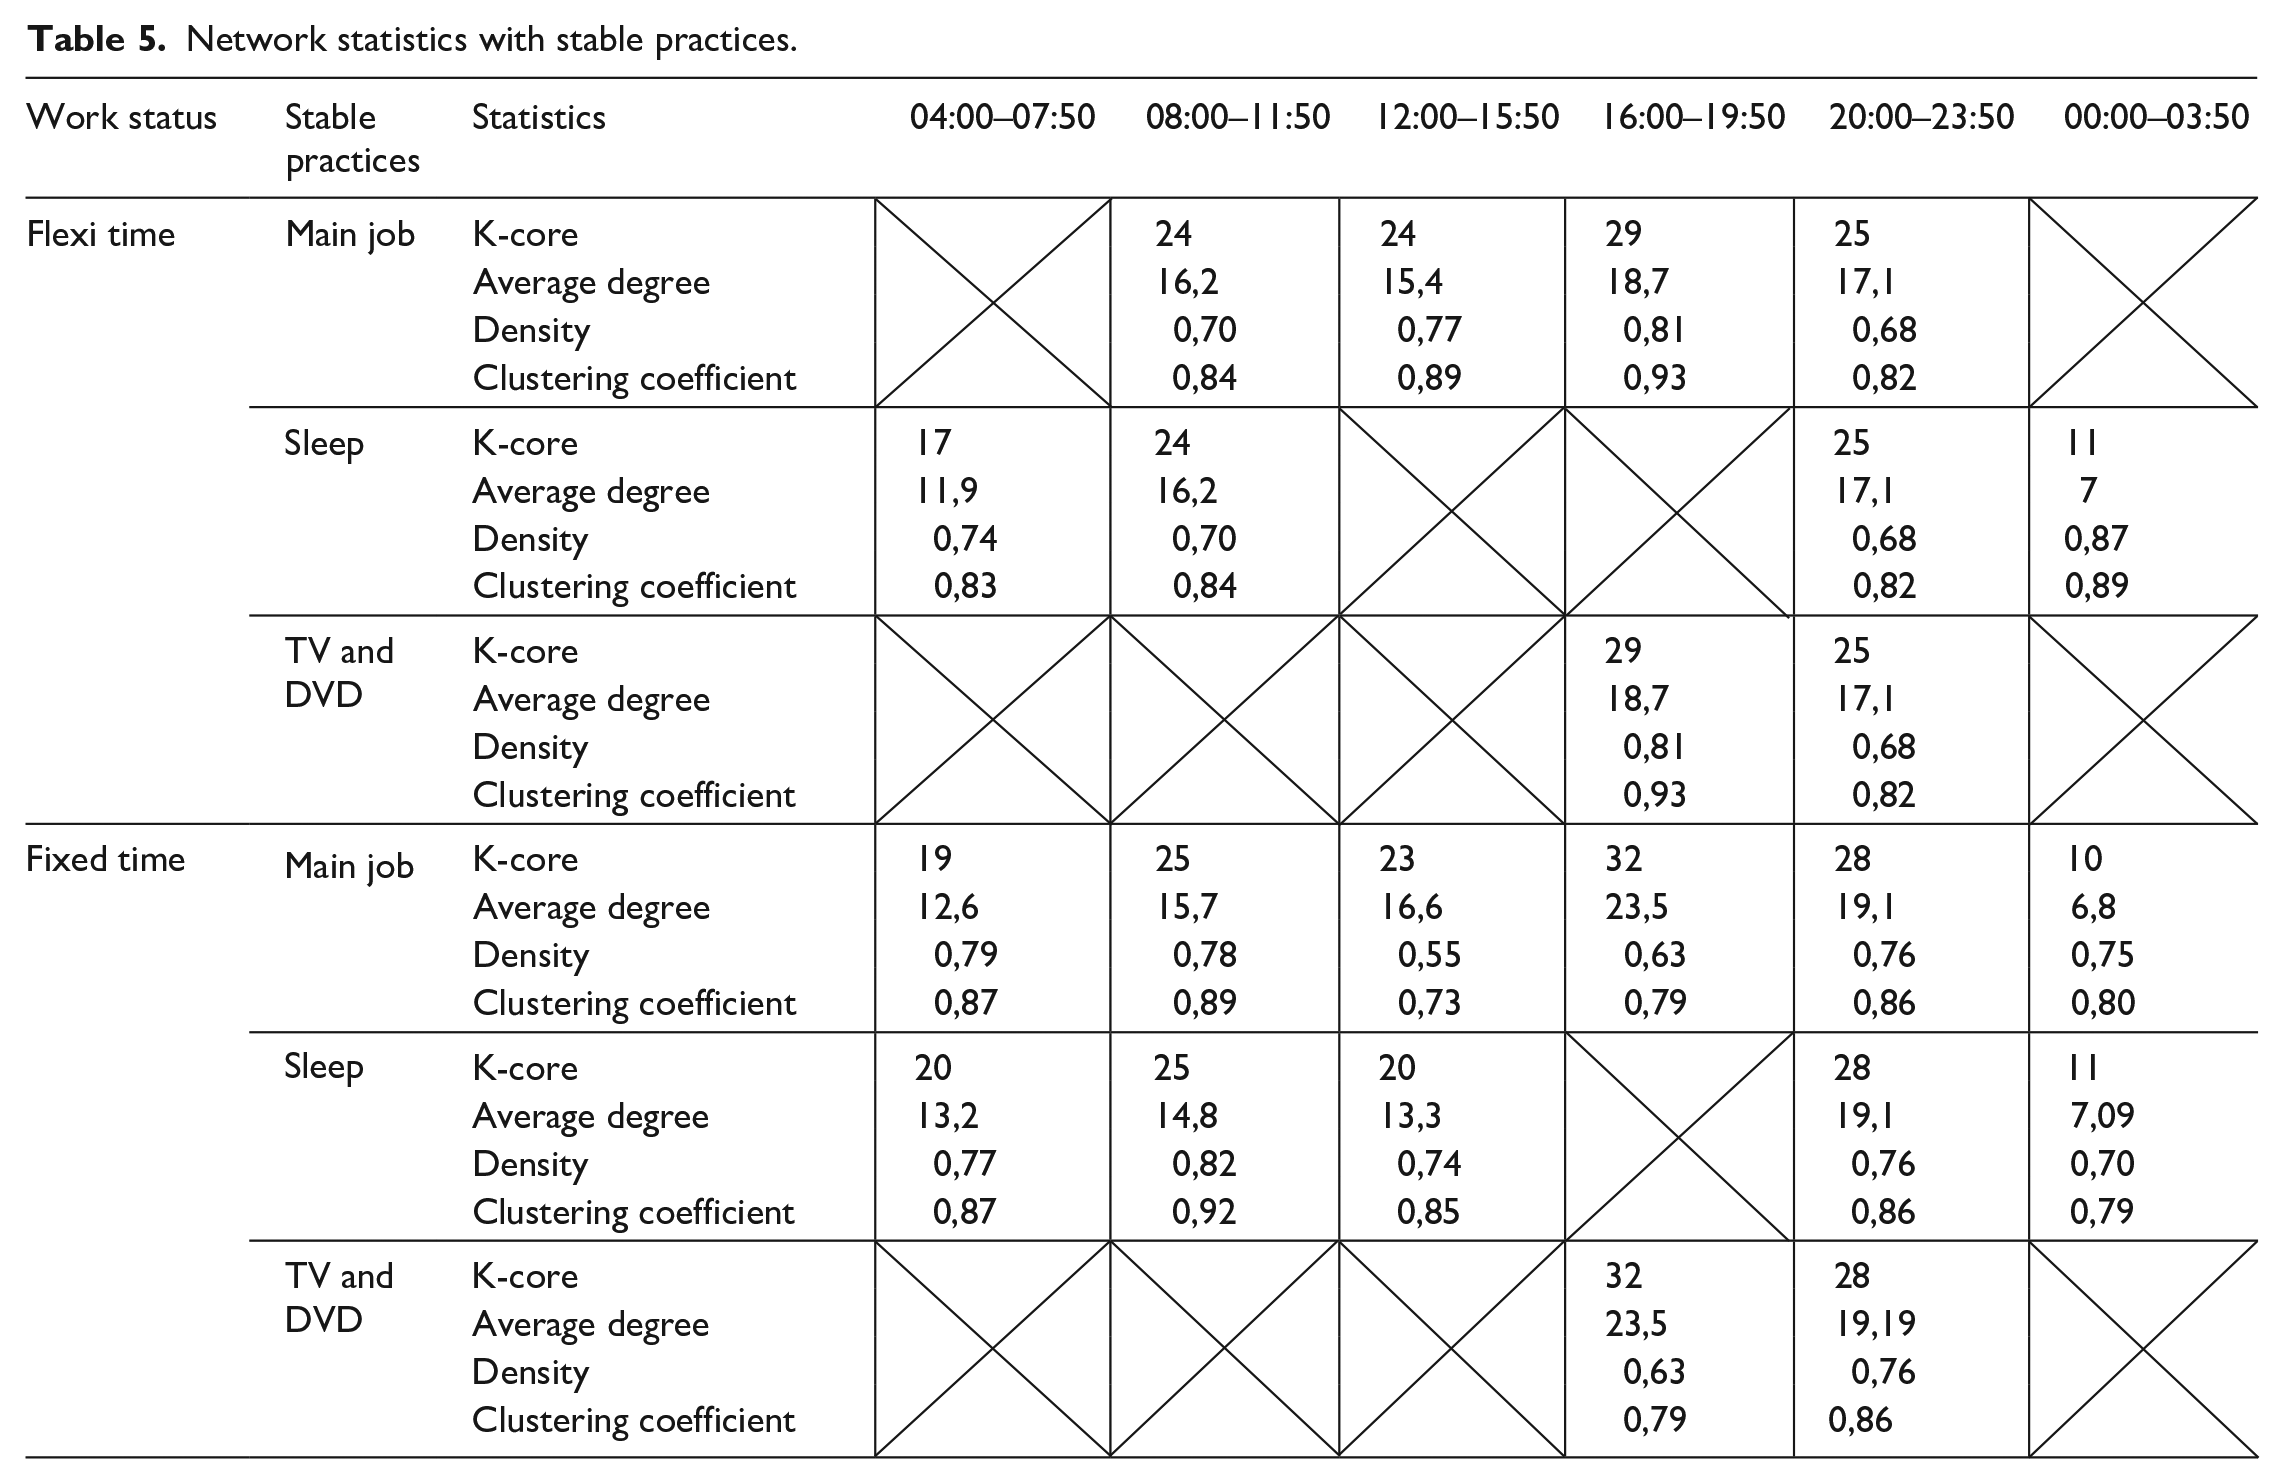
Tables 5 and 6 represent the networks statistics before and after removing the stable practices. The removal of the routines decreases the number of activities within the stable practice networks. This can be observed with the removal of sleep and main job routines, as the activities rearrange themselves in relation to one another, increasing constraints to the allocation of activities in daily lives.
Network statistics with stable practices.
Network statistics without stable practices.
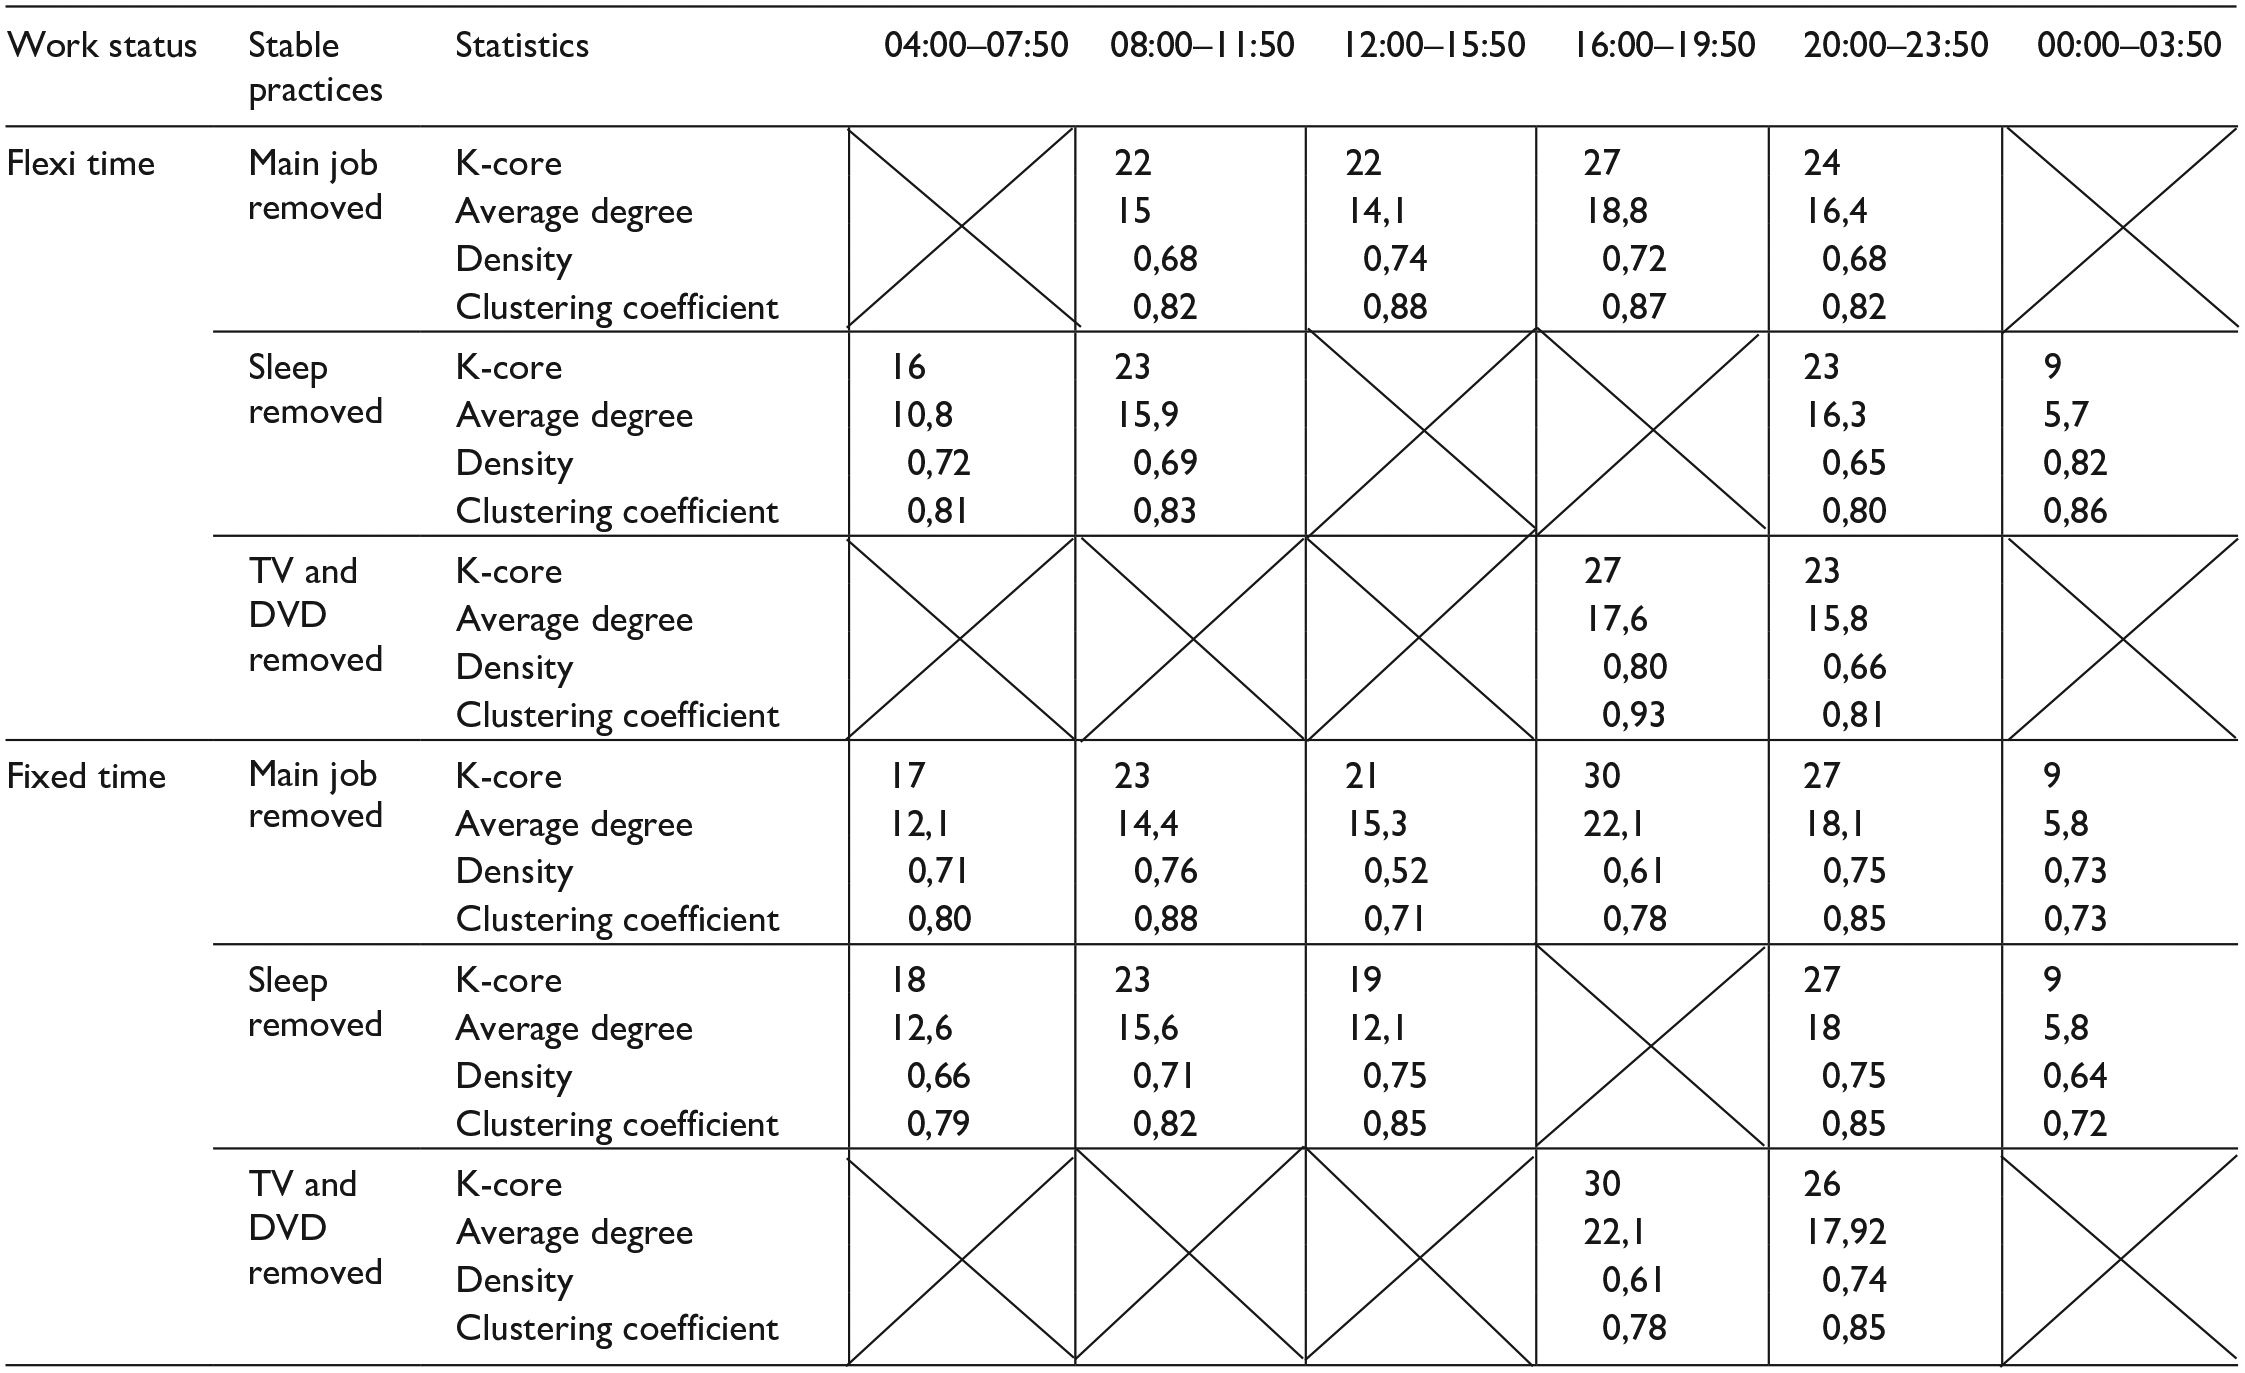
Furthermore, from Tables 5 and 6, we observe that work-related activities are at the core of daily life. Thus, the removal of the stable practices did not result in the removal of the work-related activities. This would suggest that work-related activities and stable practices have different temporal structures. Since all activities are embedded within these temporal structures, it can hardly be assumed that removing stable practices will change behaviour. Related to this, Tables 5 and 6 suggest that some stable practices are defined by the collective rhythms of paid work schedules, and because of this they have claimed their temporal locality in temporal units of the Great Work Day. Because stable practices are currently being established with this temporal frame, these stable practices, in turn, will reaffirm societal rhythms. This would mean that the temporal demands of paid work are the most decisive factor in creating stable practices, and this is further reinforced by the social demands of the work schedules.
Conclusions and implications
Recent developments in relation to the COVID-19 crisis exemplify the importance of understanding how developments in work arrangements underpin daily routines. Even without large disruptions to ‘normality’, time-related labour policies such as the institutionalization of a shorter working week are likely to significantly change the coordination and sequencing in daily routines. After years of trying to avoid ‘taking work home’, working from home is now a part of one’s daily life. Recent research revealed that working from home for extended periods of time had unanticipated consequences. For some the blurred lines between work and family life made it difficult to detach from work and maintain a healthy work-life balance (Klerk et al., 2021). Future studies should investigate how work-related practices become part of residential practices. The main finding of this article is that work arrangements create stable practices that are stone pillars (e.g. by locking-in several practices) of daily routines. This implies that the removal (or ‘unlocking’) of stable practices during these time periods could produce some – albeit marginal – decongestion of routinized practices.
The findings of this analysis have multiple implications, three of which are listed here. First, the results of the analysis demonstrate that the proposed way of conducting empirical studies overcomes some of the limitations associated with treating activities in isolation, and allows for a closer inspection of the intra-day dynamics of everyday life. Second, it is shown that an excessive focus on what happens in the home may result in far too static representations of everyday life in which other arrangements which might play a vital role, such as working practices, are neglected. Thus, importing network and sequence analysis techniques into the realm of time-use data analysis applied to the impact of different work arrangements yields significant benefits in this regard. Third, it has become clear that a more detailed breakdown of the stability of practices throughout the day provides further insight into the way daily routines in the homes unravel. The article focuses on key metrics to identify which aspects of everyday life are central to how people go about their lives, taking work arrangements as the pivotal component. This opens up opportunities to explore other aspects such as changes in, say, energy consumption patterns not only as a result of technology and price interventions, but also as a result of social (e.g. change in work arrangements) and spatial (e.g. changes in when and where people work) transformation. This article offers the methodological foundations for appraising the implications of institutional policies that affect everyday life, taking stable practices as the unit of analysis.
This being an empirical study, however, is bound by the limitations of the data it has been based upon. The main limitation echoes the last point raised just before starting this discussion of the limitations: practices vary throughout time, and so does their temporal attribution. As a result, the representations of stable practice performance are influenced by methodological biases in coding, interpreting, and reporting (Torriti, 2017). While there is significant, value in analysing this kind of data using the methods proposed in this article, this last observation makes it clear that there is much scope for further research.
Supplemental Material
sj-docx-1-sro-10.1177_13607804221084344 – Supplemental material for Work-Related Practices: An Analysis of Their Effect on the Emergence of Stable Practices in Daily Activity Schedules
Supplemental material, sj-docx-1-sro-10.1177_13607804221084344 for Work-Related Practices: An Analysis of Their Effect on the Emergence of Stable Practices in Daily Activity Schedules by Máté János Lőrincz, José Luis Ramí-Mendiola and Jacopo Torriti in Sociological Research Online
Footnotes
Funding
The author(s) disclosed receipt of the following financial support for the research, authorship, and/or publication of this article: The authors gratefully acknowledge support from the EPRSC (Grant No. EP/P000630/1) and UK Research and Innovation through the Centre for Research into Energy Demand Solutions [Grant No. EP/R035288/1].
Supplemental material
Supplemental material for this article is available online.
Author biographies
References
Supplementary Material
Please find the following supplemental material available below.
For Open Access articles published under a Creative Commons License, all supplemental material carries the same license as the article it is associated with.
For non-Open Access articles published, all supplemental material carries a non-exclusive license, and permission requests for re-use of supplemental material or any part of supplemental material shall be sent directly to the copyright owner as specified in the copyright notice associated with the article.