
Abstract
Nursing is often associated with providing working-class women a route to upward social mobility. This article argues that although nursing is a relatively open profession, the impact of social class endures, with the main division between nurses who are from higher professional backgrounds and the rest. We utilise the Great British Class Survey (GBCS) to explore nurses’ social origins; the relationship between background and economic, social, and cultural capital; and the impact of origin and capitals on income (and inferred career trajectory). While recognising the methodological limitations of the GBCS, we suggest there may be a ‘class ceiling’ in nursing, and that class advantages are still significant in lower professions of the public sector. Class identification endures regardless of whether nurses have been upwardly or downwardly mobile. We also suggest future directions for intragenerational mobility and gender in social mobility research and make a case for longitudinal and qualitative analysis of nurses’ trajectories. Our findings indicate that the downwardly mobile children of the middle classes retain their classed advantages as they establish their own careers.
Introduction
Like other feminised caring professions, nursing 1 is associated with offering working-class women a route to upward social mobility (Huppatz, 2010), yet there is a lack of sociological research on nurses’ class origins. 2 Social mobility research tends to focus on the ‘higher professions’ (Friedman et al., 2017). Nursing, on the contrary, is not only a ‘lower profession’, but it is also one where around 90% of the workforce are female (RCN, 2020a). While the dominant public and political discourse focuses on ‘more social mobility’ and access to the professions as a progressive tactic to combat socio-economic inequality, a growing body of critical sociological work challenges this position (see, e.g. Lawler and Payne, 2018; Payne, 2017). This article aims to contribute to this body of research through exploring the class origins of nurses and considers how the advantages of class may endure beyond entering a career. In doing so, we speak to wider sociological debates surrounding the intergenerational transmission of class advantage and criticisms of social mobility as a panacea for solving inequality. We highlight the contribution of a ‘cultural class analysis’ approach to social mobility as it analyses inequalities within employment aggregate categories. We also show how unpicking the distinction between ‘higher’ and lower professionals can identify a key structural divide, and we draw attention to the intersection of gender and class in social mobility trajectories that is often overlooked.
In this article, we aim to explore the social mobility trajectories of nurses and midwives who completed the Great British Class Survey (GBCS) to ask whether there is a ‘class ceiling’ (Friedman and Laurison, 2019) in nursing. We map nurses’ social origins; examine the relationship between background and economic, social, and cultural capital; consider the impact of origin and capitals on income (and inferred career trajectory); and describe nurses’ own subjective expressions of class position. In the following section, we consider the profile of nurses and note the gap in research around social mobility and this profession. We also examine the case for focusing on a feminised occupation in social mobility research given how women’s working lives have different trajectories to men’s and are located in different sectors.
Social mobility and the nursing profession
In terms of socio-economic classification, nurses are categorised as NS-SEC2: ‘lower professional and higher technical occupations’ (ONS, 2018a). 3 As one of the ‘newer’ professions, nursing has only recently become a graduate-only occupation in the UK, following the move of nurses’ training from hospitals to universities in the 1990s and then the requirement from 2013 for all new nurses to hold a degree. This has led to some concerns that professionalisation may have restricted access (Milburn, 2012). Nursing has a complex relationship with class. Modern nursing emerged in the 19th century as a career for middle-class women, offering secure and high-status employment. The opportunities afforded by professionalisation were not open to working-class and Black and minority ethnic women who provided much of the hands-on care in auxiliary and support roles (Abbott and Wallace, 1990). Conversely, the newer professions like nursing have not established the same mechanisms of social closure through credentials as the more traditional ones such as medicine and law in NS-SEC1 (Payne, 2017).
In reviewing the existing widening participation literature, Heaslip et al. (2017) note that the diversity and flexibility of historical training routes meant that such programmes were generally accepted as drivers of social mobility, yet ‘there appears to be no evidence or exploration of the impact of nursing on social mobility . . . Perhaps WP [widening participation] and social mobility are taken for granted in nurse education’ (Heaslip et al., 2017: 72). We argue that nursing as a route to social mobility should not be taken for granted, and that an explicit focus on social class is warranted. The dominance of women in the nursing profession also warrants a consideration of the intersection of gender and class. The gender balance in many occupations has changed over time, due to the expansion of university education and the increased numbers of women in employment (Payne, 2017: 120), but the same cannot be said of nursing. Numbers of male nurses increased from just 1% at the start of the 20th century to around 10% at the start of the 21st century, but it remains a distinctly female-dominated occupation (Traynor, 2013: 11).
Traditionally, women’s lives were neglected in mainstream social mobility research (Abbott and Payne, 1990). Feminist critiques argue that women should be subjects of social mobility study in both their own right as workers and in terms of their role within the family (Hayes and Miller, 1993). Moreover, men continue to dominate the higher professions of NS-SEC1 and women the lower professions of NS-SEC2 (Li and Devine, 2011; Payne, 2017). The dominant field of sociological research which investigates comparative rates of intergenerational mobility between NS-SEC categories does, of course, compare the relative rates of mobility of men and women (see, for example, Bukodi et al., 2015; Goldthorpe, 2016; Li and Devine, 2011). However, conceptualising mobility into an aggregated occupational class position may not reflect the experiences of women in different sectors to their male counterparts in the same social-economic class (Abbott and Payne, 1990; Payne, 2017). Indeed, even within the same sector, their experiences and situations can be different ‘both in terms of remuneration and authority, and, of more significance for mobility studies, in terms of prospects for advancement’ (Hayes and Miller, 1993: 659).
Recent work on ‘class ceiling’ (Friedman et al., 2015, 2017; Friedman and Laurison, 2019; Laurison and Friedman, 2016) in elite and professional occupations has offered an alternative method, drawing on the contribution of Bourdieu and ‘cultural class analysis’ to understand the multidimensional aspects of class based on economic, cultural, and social capital. While still using NS-SEC classes as point of origin, this work argues that taking an employment aggregate approach to class destinations loses sight of class identities and relations. By taking a Bourdieusian-inspired approach, the class ceiling research takes account of how ‘past forces affect mobility in the present and future’ (Friedman and Laurison, 2019: 193); for example, how the embodied cultural capital inculcated while growing up in the family home may confer advantage in the workplace as an adult. Consequently, this criticises the dominant paradigm in which entry into an occupation is the ‘end point’ of social mobility and which does not take account of success and career. Initially utilising the GBCS (Savage et al., 2013) to explore the economic, cultural, and social capital of respondents in elite occupations, this body of work has also used the nationally representative UK Labour Force Survey (ONS, 2018b) to look at the relationship between class origin and income in both elite occupations (Laurison and Friedman, 2016) and other professions (Friedman et al., 2017). While this innovative work notes the ‘double disadvantage’ of gender and class (Laurison and Friedman, 2016: 685), it has yet to focus on a feminised ‘lower’ profession like nursing in detail.
In this article, we are inspired by these studies to consider whether the ‘class ceiling’ approach can shed light on patterns of social mobility in the nursing profession, given its association with both upward social mobility and ongoing social divisions. An analysis of Labour Force Survey (LFS) data suggests that public sector occupations are among the most open, including nursing: ‘61% of nurses come from non-professional backgrounds’ (Friedman et al., 2017: 17). While this report extends the class ceiling research beyond elite occupations, it aggregates respondents from NS-SEC1 and NS-SEC2 origins, which we suggest hides important advantages and differences. On one hand, we should acknowledge the relative openness of the nursing profession and its established association with upward social mobility; it is clearly much more accessible than medicine, for example. On the other hand, we argue it is important to disaggregate these origin classes – not least because of the gender balance of NS-SEC1 compared with NS-SEC2 – to explore intra-occupational differences in trajectories and capital accumulation, to consider the ongoing inheritances and legacies of class background. Consequently, our analysis considers both the inheritances of class origin on nurses’ levels of economic, cultural, and social capital to explore classed advantages beyond entry point into a career and how gender, class background, and other contextual factors influence nurses’ income.
Finally, we also consider how social origin may shape current class subjectivities. Since the 1990s, sociological research has grappled with the paradox of increasing inequality alongside declining class identification (Bottero, 2004; Irwin, 2015; Miles and Leguina, 2018; Savage et al., 2001, 2010; Skeggs, 1997). Structural location shapes the forms such ‘dis-identification’ may take, be it a distancing from stigmatised working-class identities (Skeggs, 1997) or an emphasis on ‘ordinariness’ among the middle classes (Savage et al., 2001). This disavowal has, for some authors, encapsulated how contemporary subjective inequalities are instead expressed through individualised hierarchies (Bottero, 2004) and social comparisons with proximate others (Irwin, 2015), rather than class. Crucially, mobility is a factor here, be it social mobility influencing how inequalities are articulated through social comparisons (Irwin, 2015) or how both class movement and geographical migration – socio-spatial mobility – impact ‘class talk’ (Miles and Leguina, 2018). We draw upon data on class identities and social background of nurses to explore whether the advantages of class inheritance are matched by the subjective understanding of class position.
Methods
Data
Our analysis is based on the innovative dataset from the GBCS. The GBCS drew upon Bourdieu’s multidimensional approach to class, gathering data on economic, cultural, and social capital (Bourdieu, 1984), with a particular interest in the interplay between the various forms of capital in reproducing advantage (Savage et al., 2013). It offers particularly valuable data on cultural and social capital, which is rarely addressed in social surveys (for a notable exception, see Bennett et al., 2008). We were also able to take advantage of the unusually large sample size to explore the intra-occupational differences among nurses: four times the size of the sample of nurses and midwives in the Labour Force Survey.
The web-based survey, hosted by BBC’s Lab UK website, ran from January 2011 to July 2013 and gathered data from almost 325,000 people. In addition to the questions on economic, cultural, and social capital, the survey also gathered basic demographic information on age, gender, marital status, dependents, ethnicity, and disability, along with education, occupation, and family background. Moreover, respondents were also asked about political efficacy and trust, and their subjective views of opportunities and social divisions.
Measures
In this article, we have used data from some specific questions asked in the GBCS that are linked to our research problem. This section describes how these questions are used to measure the key concepts.
Socio-demographic characteristics
For this article, socio-demographic characteristics of the respondents are measured using data on age (measured in a scale ranging from 16 to 99 years), gender (female vs male), education (postgraduate, undergraduate, and A-level or less), marital status (whether married, partnered, and/or in a relationship: yes vs no), ethnic background (White vs non-White), and region (London, Southeast, and rest of the UK).
Capital: economic, cultural, and social
Savage et al. (2013), drawing on Bourdieu, define the three forms of capital as follows: (1) economic capital (wealth and income); (2) cultural capital (the ability to appreciate and engage with cultural goods, and credentials institutionalised through educational success); and (3) social capital (contacts and connections which allow people to draw on their social networks. (p. 223)
The economic capital variables available in the GBCS are household income, property value, and household savings. As Savage et al. (2013: 228) indicate, the use of a household measure means that gender inequalities may be obscured, which we consider in our analysis below. An inductive approach was taken by the GBCS team to the development of the two cultural capital variables using multiple correspondence analysis of the respondents’ answers to questions about cultural participation, likes, and dislikes. This identified an axis of cultural taste from ‘highbrow’ cultural capital associated with more traditional, established tastes, such as art galleries and classical music, and ‘emerging’ cultural capital associated with more youthful middle-class tastes, such as going to the gym and attending gigs. Both were distinct from an axis of cultural engagement, which corresponded to social class. Social capital is measured in the GBCS in two ways: the mean status score of respondents’ social contacts and the mean number of contacts. These measures give an indication of the social standing and size of the respondents’ social networks. The variables were constructed by the GBCS team based on whether respondents knew someone socially in 34 occupations. 4 Status scores were coded using the Cambridge Social Interaction and Stratification (CAMSIS) scale, a continuous scale of stratification based on interactions and social distance between occupations (see Lambert and Prandy, 2018).
Following Friedman et al. (2015), we utilise all three economic capital measures in our analysis, along with legitimate cultural capital scores and social capital status scores, to offer a comparative analysis to their work on elite occupations. The GBCS offers a different way of conceptualising social class to the ‘employment aggregate’ definition, which is based on employment relations (Crompton, 2008). The survey has been subject to extensive critique over whether this is gathering data on social class at all (Mills, 2014; Rose and Harrison, 2013). We suggest that the GBCS remains a valuable resource that offers a unique insight into the position of nurses in the British class structure and how the legacies of occupational class origin may shape locations and trajectories. However, we also need to address a key methodological limitation of the survey, namely that this is a self-selected sample in which more advantaged and well-educated groups are over-represented (Savage et al., 2013). As such, we offer some caveats about the conclusions that can be drawn from our analysis in terms of representativeness and also stress its value, which we return to in the concluding section of this article.
Social mobility: upwardly, stable, and downwardly mobile
Social mobility is usually measured by comparing one’s social origin with his or her destination (Friedman et al., 2015). In the GBCS, destination is measured using respondents’ self-reported job title, coded to the Standard Occupational Classification 2010 (SOC2010) occupational categories. Although an identical measure for origin – in terms of individual parental occupation – was not available, we used a proxy variable as suggested by Friedman et al. (2015) which asked respondents what kind of work the ‘main income earner’ in their household carried out when they were 14 to measure occupational origin. The nine possible answer categories to this question, designed to map into the eight major NS-SEC categories, were grouped into four categories: senior manager (NS-SEC1), lower manager (NS-SEC2), technical/intermediate clerical (NS-SEC3–5), and manual/semi-manual/never worked (NS-SEC6–8. In NS-SEC classification, nursing is attached to lower managerial category (NS-SEC2). In this article, nurses are classified as ‘stable’ if their social origin is in the lower managerial category. Nurses are ‘downwardly mobile’ if their social origin is in senior manager and ‘upwardly mobile’ if their origin is in either the technical/intermediate or manual/semi-manual/never worked categories.
Data processing and statistical analysis
This article focuses on mobility of nurses and midwives who are classified under NS-SEC2. From that group, anyone under 21 and in full-time education is excluded from our analysis as these respondents are unlikely to have transitioned into stable occupation pathways (Friedman et al., 2015). This leaves a sample of 113,515 respondents who were divided into two groups (nurses and midwives vs others in NS-SEC2) for comparison and analysed in Tables 3 and 4. Subsequent analyses were carried out among 4342 nurses/midwives classified in SOC2010 occupational categories 2231 and 2232. 5 After data cleaning, analysis was undertaken by Statistical Package for the Social Sciences (SPSS, version 25). A range of univariate, bivariate, and multivariate statistical techniques were used for analysing data. For univariate analysis, mean, median, and percentages were computed. For bivariate and multivariate analyses, cross-table and ordinary least squares regression analyses were used, respectively.
Nurses in the GBCS and their socio-demographic characteristics
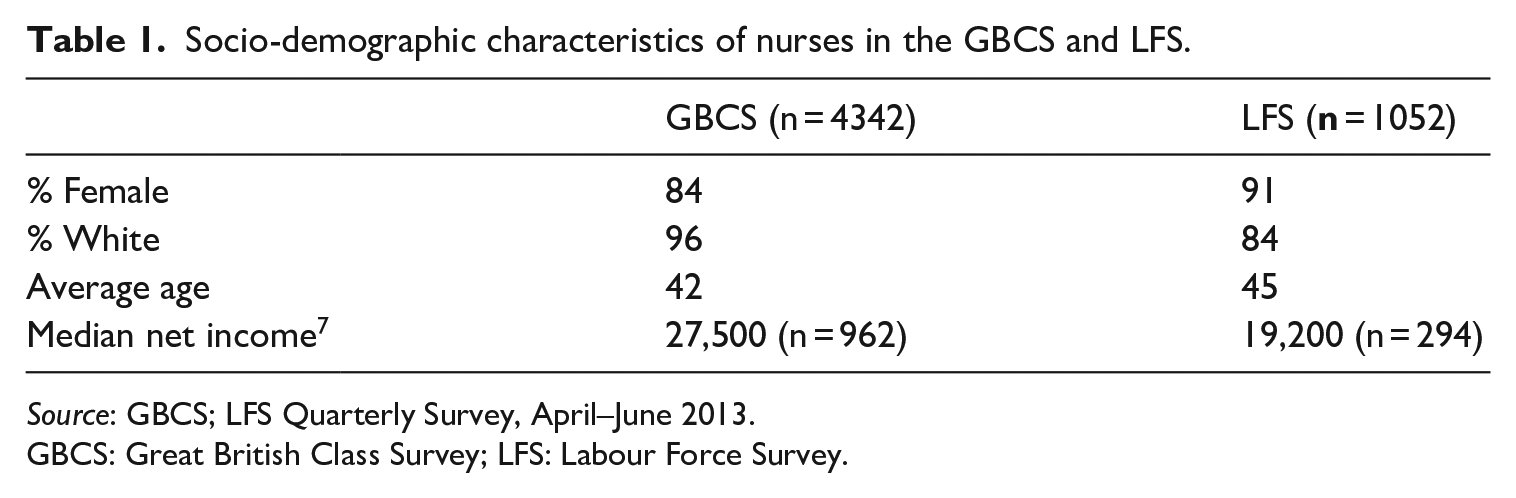
Approximately 2% (n = 4342) of the GBCS respondents were reported to be in nursing and midwifery. Those in nursing are predominantly female (84%) and White (96%) with an average age of approximately 42 years. To get a sense of how this reflects the wider nursing workforce, we compare this with LFS data below on those coded to the SOC2010 minor group 223 (Nursing and Midwifery Professionals) (taken from the quarterly LFS survey April–June 2013, which corresponds to the date the GBCS survey was finally closed in July 2013). 6
We can see from Table 1 that the GBCS sample is slightly younger and has a greater proportion of male nurses, and most significantly has a very small number of nurses from ethnic minorities compared with the wider population. Their median annual income is also considerably greater than that reported in the LFS (although these figures should be approached with extreme caution; see Note 7). Already we can see one of the limitations of the GBCS to explore nursing and social mobility, as our sample is more privileged than the wider population. They are, for example, more likely to be more culturally engaged as demonstrated by responding to a survey conducted in partnership with the BBC. Consequently, we approach our findings with caution.
Socio-demographic characteristics of nurses in the GBCS and LFS.
Source: GBCS; LFS Quarterly Survey, April–June 2013.
GBCS: Great British Class Survey; LFS: Labour Force Survey.
Social mobility and capital: the higher/lower professional divide
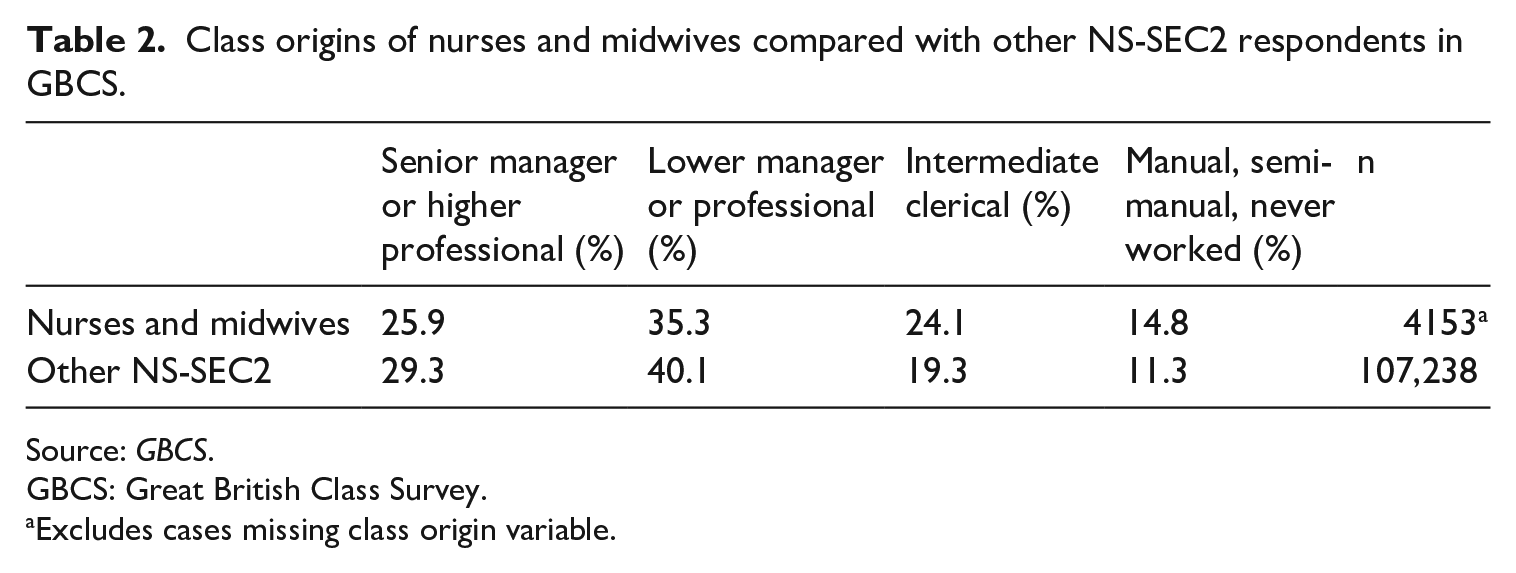
To assess whether there is anything distinctive about the social origins of nurses and midwives compared with other occupations of similar class location, we compared their backgrounds with those of respondents in other NS-SEC2 occupations, as shown in Table 2. For both groups, most respondents were from lower managerial or professional backgrounds themselves. However, the proportion of respondents with these stable trajectories was slightly higher for other NS-SEC2 occupations (40.1%) than for nursing occupations (35.3%). Table 2 also shows that there were more respondents who had been downwardly mobile into other NS-SEC2 occupations from senior management or higher professional backgrounds compared with nurses and midwives. Conversely, more nurses and midwives had been upwardly mobile, with 39% coming from intermediate, clerical, manual, semi-manual occupational backgrounds, or whose parents never worked. This is in comparison with around 30% of other respondents in comparable occupations who had less privileged roots. Given these higher rates of upward mobility, these findings suggest that nursing is slightly more ‘open’ to those from lower social class backgrounds than the average lower professional occupation. However, we can see that nurses from either higher or lower professional backgrounds dominate the GBCS sample (just over 61%) which is in contrast to the nationally representative data reported in the work by Friedman et al. (2017).
Class origins of nurses and midwives compared with other NS-SEC2 respondents in GBCS.
Source: GBCS.
GBCS: Great British Class Survey.
Excludes cases missing class origin variable.
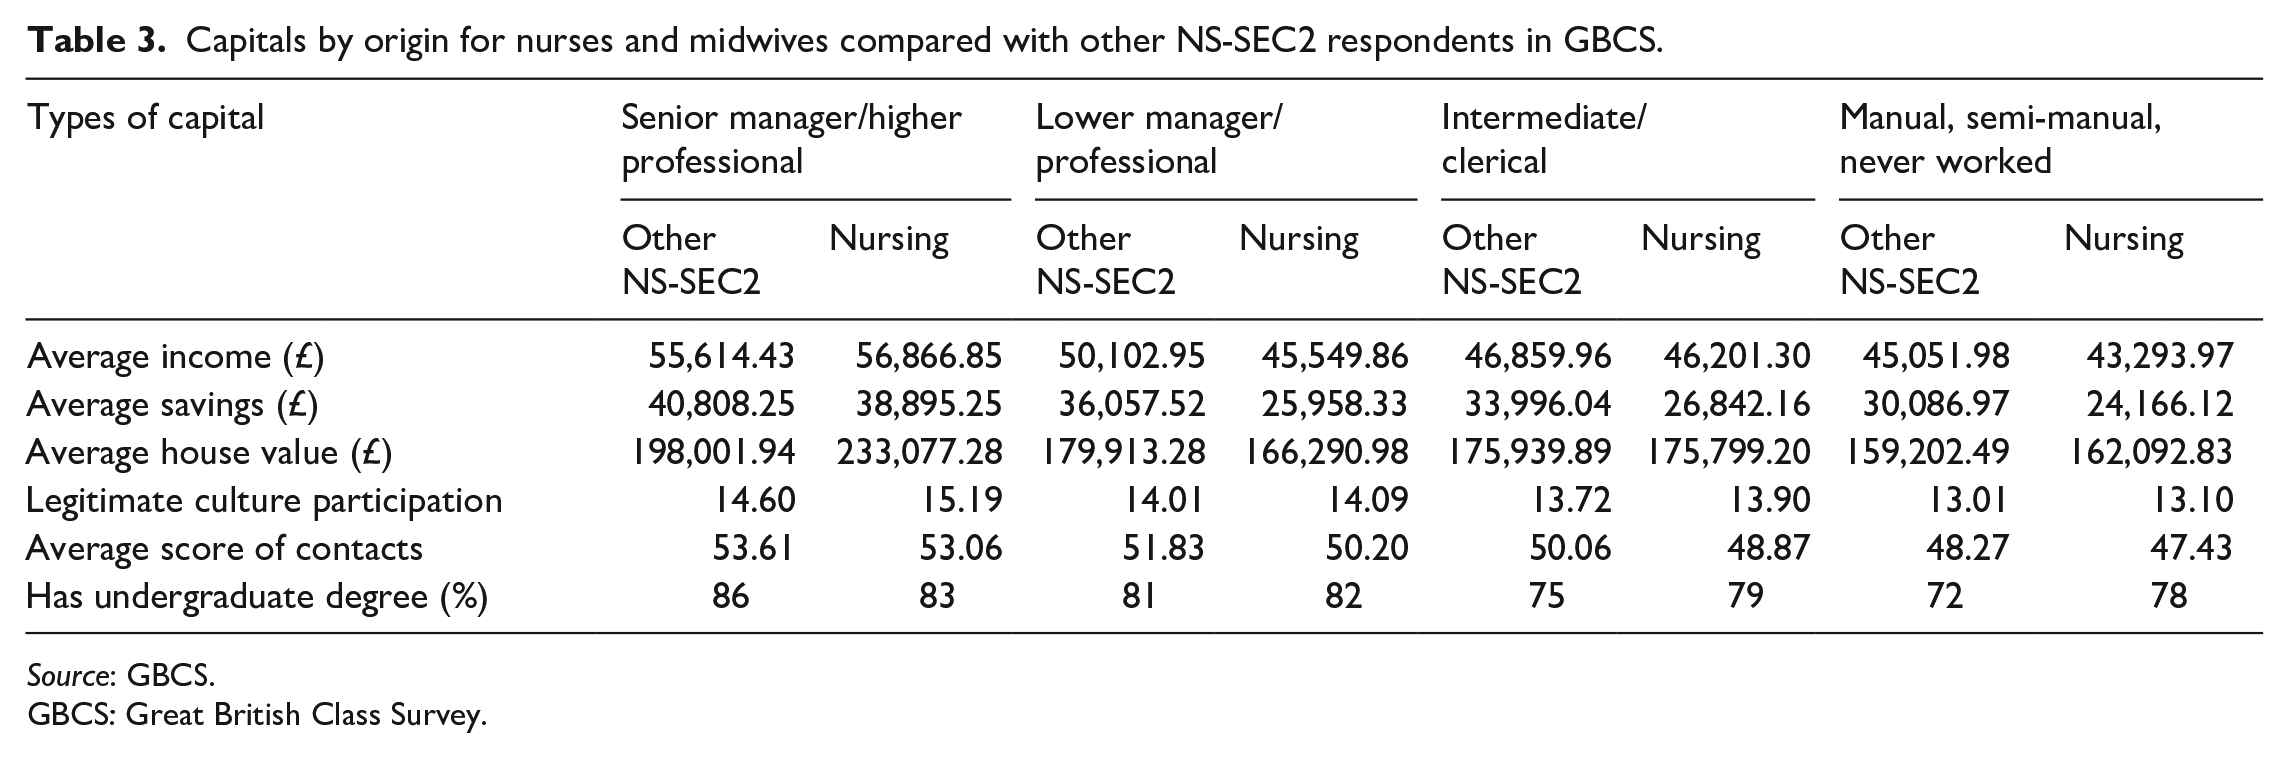
The benefits of analysing respondents from higher and lower professional backgrounds separately, rather than combining the two as in the work by Friedman et al. (2017), becomes apparent when we explore the economic, cultural, and social capital of nurses and midwives. Table 3 reports the scores of these capital measures. The analysis uses three economic capital measures from the GBCS: income, savings, and house value. For cultural capital, we use the GBCS ‘legitimate’ culture variable. We also add whether the respondent has an undergraduate degree, in keeping with the inclusion by Friedman et al. (2015) of this indicator of cultural capital in the form of educational attainment. Finally, we use the GBCS social capital measurement of mean status score of contacts.
Capitals by origin for nurses and midwives compared with other NS-SEC2 respondents in GBCS.
Source: GBCS.
GBCS: Great British Class Survey.
Table 3 shows an overall trend: the more advantaged social background of a respondent, the higher their scores in the economic, cultural, and social capital measures. Nurses from senior management or higher professional backgrounds have an average household income of nearly £57,000 per year, whereas the income of those from manual backgrounds is just over £43,000 per year, a difference of £13,000. Similarly, the other economic capital measures show an overall trend of nurses from more privileged social origins having more savings and their houses being worth more. They are more likely to engage in legitimate culture, have an undergraduate degree, and have higher status social contacts. The exception is nurses from intermediate social backgrounds, who have higher economic capital scores in all three measures than those from lower professional backgrounds. The picture is also less straightforward when comparing nurses with other NS-SEC2 occupations. Nurses’ savings are slightly less, but their legitimate cultural participation is slightly greater. For some groups (senior management and manual backgrounds), nurses’ houses are worth more; in others, they are worth less. On the contrary, nurses are more likely to have an undergraduate degree, except for those from senior management or higher professional families.
What is most striking about these results is the significant drop in capital scores across all measures between nurses from senior management or higher professional backgrounds, and those from lower professional backgrounds. This is evident in the legitimate cultural capital score (from 15.19 to 14.09) and the social capital score (from 53.06 to 50.20). It is a particularly sharp decline in the economic cultural capital measures: over £11,000 in income, nearly £13,000 in savings, and over £65,000 in average house prices. This is also evident among other NS-SEC2 occupations, although not to the same dramatic extent as for nurses. Thus, while nurses from the most privileged social backgrounds have technically been downwardly socially mobile, they have carried their classed advantages with them as they have established their own careers. It is quite typical for women to have a mobility drop when entering the labour market, given that their class origin is more likely to be derived from their fathers’ occupation and men are located in higher class positions on average than women (Payne, 2017: 129). These findings support arguments that the most distinct dividing line in the British class structure is not found between the ‘middle’ and ‘working’ classes, or professional and non-professional occupations, but between those who are most privileged and the rest (Savage et al., 2015). Consequently, we would argue that analyses of social mobility which take this granular approach to explore specific occupations need to consider the implications of aggregating those from higher and lower professional backgrounds, as this could hide important differences.
Such findings highlight the ways in which the privileges of class can be enduring and not reducible to an individual’s occupation at a particular point in time. While we have used NS-SEC categories to obtain a sense of the respondents’ social class backgrounds, the differences within the nursing cohort from the GBCS suggest that the employment aggregate approach (Crompton, 2008) cannot capture the extent of this privilege. The issue of inheritance is a case in point, in which not only wealth but also cultural knowledge and social contacts from higher professional parents are passed to their children (Bourdieu, 2001 [1986]) We also note that the economic capital scores are based on household measures; nurses themselves may have been downwardly mobile, but it is possible that they are more likely to have partners who are from similarly advantaged social backgrounds (Goldthorpe, 2016: 106). The next section presents a regression analysis that explores the potential factors that could explain the variance in capitals scores among the sample of nurses within the GBCS.
The class ceiling in nursing
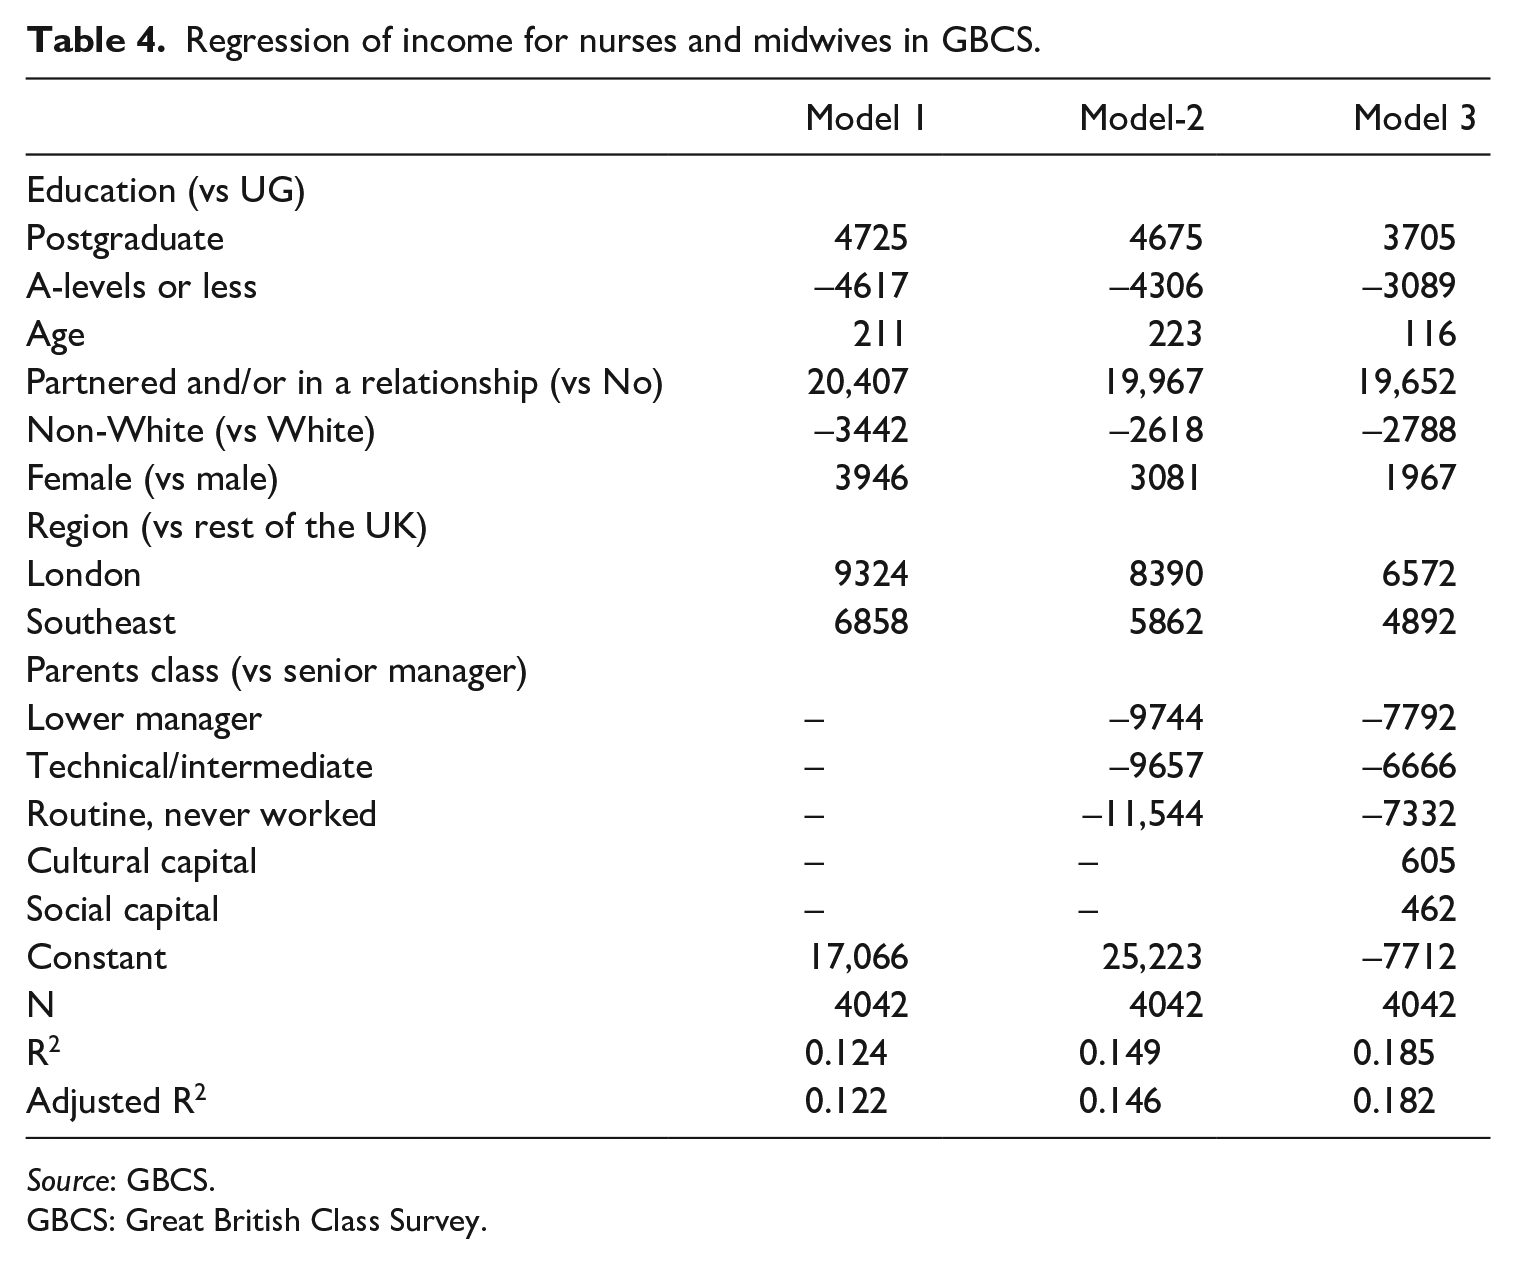
As noted above, there is a £13,000 average gap in income between nurses from senior management and higher professional backgrounds in the GBCS, and those from routine and semi-routine backgrounds. The variance among the other three social origin groups is much smaller. In this section, we consider how we might begin to explain these differences. Nurses who work for the National Health Service (NHS) – by far the biggest employer (RCN, 2020a: 7) – are paid according to a national pay scale. We can assume that nurses with higher personal incomes in the general UK population will therefore have progressed in their careers to more senior roles. In our sample, we only have a measure of household income and consequently must express caution about the conclusions that can be drawn, although our models control for whether respondents had a partner. We conducted a series of regression models to explore the factors that could explain the differences in income observed according to social origin. The models are reported in Table 4 and take inspiration from the income regressions conducted by Friedman et al. (2015) on elite occupations. In Model 1, the respondent’s level of education, age, whether they had a partner, their ethnicity, gender, and their region all predicted their household income. These factors explain around 12% of the variation. As might be expected, having a postgraduate degree increased a nurse’s income by over £4000 compared with an undergraduate degree. 8 Also as expected, age and whether the respondent had a partner were associated with household income. Model 1 also indicates ethnic inequality, with non-White nurses earning over £3000 less than White. What is surprising in Model 1 is that while gender predicts household income, it is female nurses rather than male who earn more. This is contrary to the extensive literature, which suggests that a small proportion of male nurses are more likely to progress up the career ladder into senior management roles (Davey et al., 2005; Traynor, 2013). However, these results should be interpreted with the caveat that the GBCS sample contained a small number of male nurses (N = 665; 16% of total in nursing in the sample). The ‘double disadvantage’ of gender and class is not evident in this analysis, but we must exercise caution given the ways that using a measure of household income can obscure gender inequalities. Finally, we can see something of a ‘London effect’ even in a public sector profession such as nursing, likely due to the London weighting on the national pay scales (RCN, 2020b).
Regression of income for nurses and midwives in GBCS.
Source: GBCS.
GBCS: Great British Class Survey.
In Model 2, we add the social origins variable, with nurses from senior management and higher professional backgrounds as the reference group. Even when taking education, age, relationship status, and region into account, a nurses’ social class background strongly predicts their income. The household income of nurses whose parents were in routine/semi-routine occupations or never worked backgrounds was £11,500 less than those in the higher status professions. Moreover, as in the descriptive results on average capital by origin, the biggest gap is between those from the most privileged backgrounds and the rest. Introducing this new variable into the model explains additional 2.4 % variation in income. Model 2 also suggests that the effects of gender and ethnicity are mitigated somewhat by the inclusion of class origin.
Model 3 introduces cultural and social capital, to explore whether this is behind the ‘class effect’ observed in Model 2. As Table 4 reports, including these variables reduces the effects of education, age, ethnicity, and region, although these factors still strongly predict household income. It also shows that the impact on household income of whether a nurse has a partner remains constant across the three models. Of particular significance here is that social and cultural capital have some influence on income, with class origin retaining some impact. Nurses from higher professional/senior management backgrounds had an income of around £7000 more than nurses from the other class origins, when cultural and social capital is taken into account. Yet again, the dividing line of advantage seems firmly located between the most privileged and the rest.
These findings emphasise that the class advantages enjoyed by those from professional backgrounds working in elite occupations can be found in the ‘lower’ professions, even in fields such as nursing which are predominantly located in the public sector and subject to national pay scales (and, indeed, pay caps). The models demonstrate that these advantages can be partly explained by the status of respondents’ social contacts and their participation in legitimate culture, both of which are associated with social class of origin. Extensive work inspired by Bourdieu has highlighted how the transmission of cultural and social capital from the family entrenches privilege across generations (see, for example, Lareau, 2015 on cultural knowledge and Li et al., 2008 on social capital). The inheritance of parental capital alone does not explain income disparities however, given that we can still see class disadvantage operating in Model 3. We can conclude, therefore, that there is also a ‘class ceiling’ (Friedman et al., 2015; Laurison and Friedman, 2016) at work. Compared to the other two models, Model 3 appears to be more effective in explaining variation in nurses’ income, which is evident from the higher adjusted R2 value of 18.2% from the model. However, we have not been able to explain the exact reasons that drive such differences. Factors that we have not been able to include in our model are nursing specialism, type of employer (NHS or other), or whether the respondent works full- or part-time, length of service or experience, and domestic caring roles. All of these are likely to have an impact on income. Moreover, unlike Friedman et al. (2015), we were unable to include type of educational institutions attended as only around 1% of nurses in the sample reported to study in independent schools and/or Russell Group universities. Such factors clearly warrant further study within the nursing workforce, especially considering the current dissatisfaction and controversies over nurses’ pay. Alongside explanatory analysis, this would also indicate a need for in-depth work on nurses’ lived experience of class and the resources they are able to draw on when they confront the labour market (including how these may have been inherited via the family) (Lawler and Payne, 2018: 10). We thus echo calls for more sociological work on the subjectivities of social mobility, a point we return to in the conclusion. What we are able to begin to explore with the GBCS data, however, is how the class identification of nurses is related to social origins.
Class identities among nurses
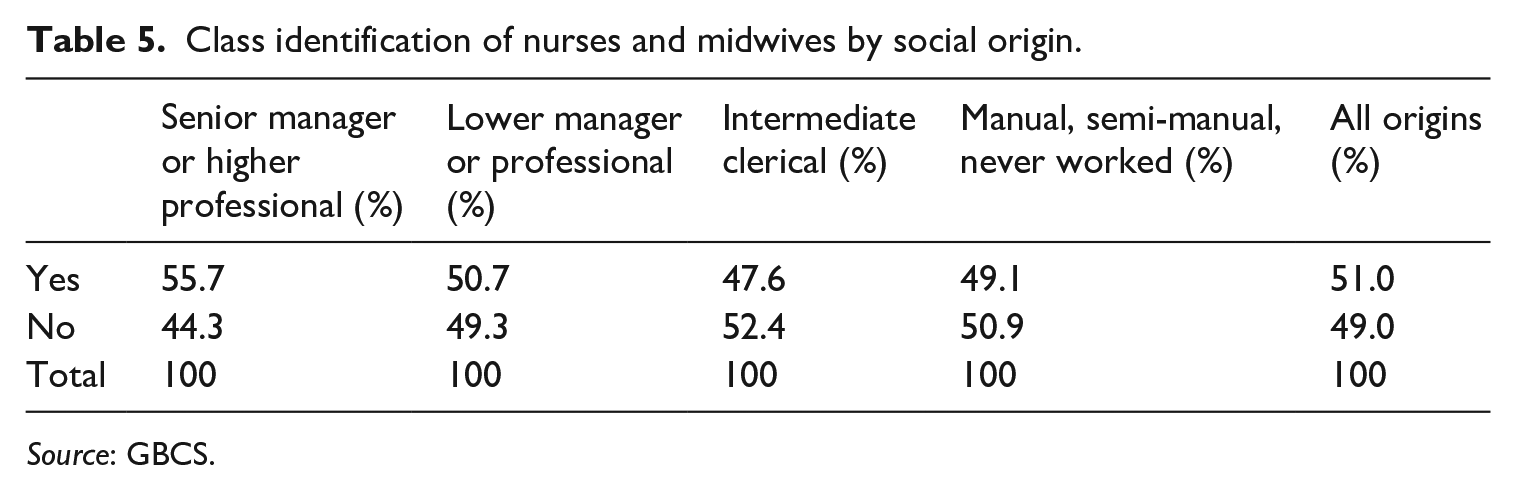
Alongside the rich data on economic, cultural, and social capital in the GBCS, and the widely publicised ‘new model of social class’ (Savage et al., 2013), the dataset contains a wealth of information about political activity, consumption habits, and class subjectivities. We draw here on the GBCS questions which asked respondents whether they considered themselves to belong to a social class and, if they had to place themselves, where they would be located. Here, we are interested on whether we can observe trends of class dis-identification (Savage et al., 2010) and whether mobility is a factor in the class positions adopted. Table 5 reports whether the nurses within the GBCS sample considered themselves to belong to a social class. Overall, the replies of the respondents match those from the GBCS overall. GBCS respondents are, by definition, more likely to be interested in social class and therefore more likely to self-identify; when the same question was asked of a nationally representative sample, two-thirds responded that they did not feel like they belonged to a social class (Savage et al., 2015: 367–368). However, when we look at the occupational class of origin, we can see that slightly more nurses from senior management/higher professional backgrounds identify with a social class (55.7%) than those from other occupational households.
Class identification of nurses and midwives by social origin.
Source: GBCS.
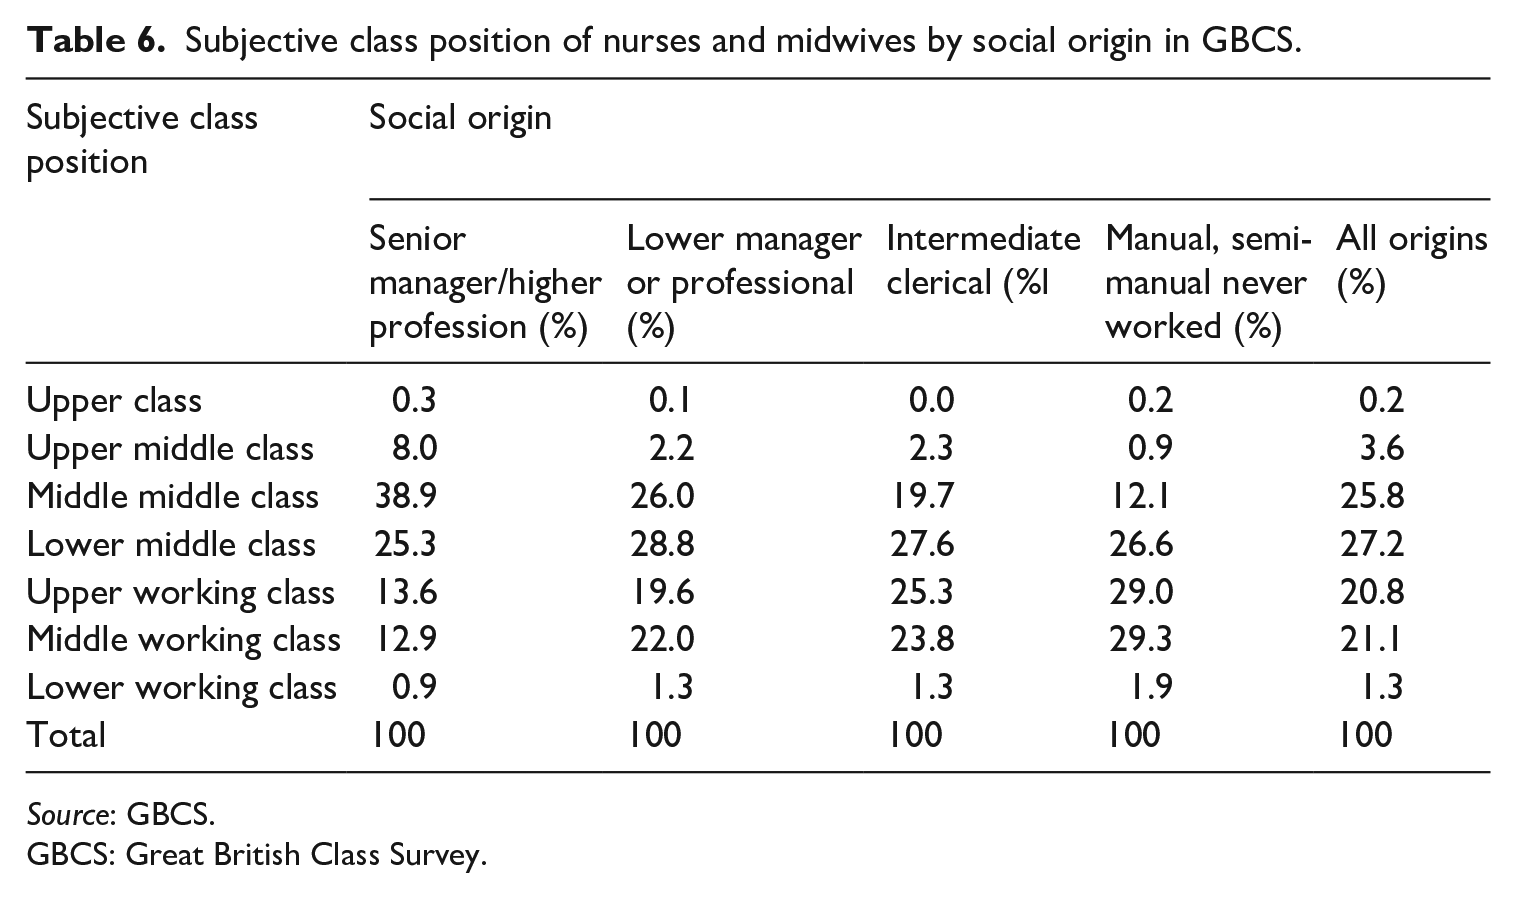
In Table 6, we explore which class they would place themselves in, if they had to choose. Based on the ‘employment aggregate’ approach, all of the respondents are the same occupational class: NS-SEC2. This remains the case whether they have recently qualified or are more senior. Table 6 demonstrates that the class they identify with seems to have some association with their class of origin. Over a third of the downwardly mobile nurses from more privileged class backgrounds identify as ‘middle middle class’. The most popular answer for respondents from lower professional or intermediate/clerical families was ‘lower middle class’. Over half of the nurses from manual/semi-routine backgrounds identified as either ‘upper working class’ or ‘middle working class’. What these descriptive results suggest is that the trends for the inheritance of class advantages observed above in the form of economic, cultural, and social capital correspond to feelings of one’s place in the world. In other words, the ‘socialized subjectivity’ of the habitus (Bourdieu, 1990), shaped by family milieu, needs to be considered beyond current location in the occupational structure. Class identification endures somewhat regardless of whether nurses have been upwardly or downwardly mobile into their careers. Again, this points to the possibility of fruitful qualitative empirical research into the classed (and gendered, and raced) experiences of nurses. This may then begin to unpick the processes in which nurses from more privileged class backgrounds progress to gain greater financial rewards.
Subjective class position of nurses and midwives by social origin in GBCS.
Source: GBCS.
GBCS: Great British Class Survey.
Conclusion
Our findings suggest that nursing is a relatively open profession in terms of social class origin compared with other NS-SEC2 occupations, but there is a relationship between class background and the economic, cultural, and social capital of nurses. Those from more privileged backgrounds carried their advantages with them, even though they had been technically downwardly mobile. Social and cultural capital, along with class origin, affect nurses’ income. While there may be other factors that we have not been able to incorporate into our analysis, these income differences are also likely to reflect career progression. Thus, we suggest that the ‘class ceiling’ observed in elite occupations (Friedman et al., 2015, 2017; Laurison and Friedman, 2016) could also operate in the nursing profession and warrants further study. We can also see that subjectivities of class, explored through questions of class identification, were also shaped by nurses’ backgrounds. Importantly, we found that the key class divide in the sample was between those from higher professional backgrounds and all others. A central insight from our analysis is that aggregating those from ‘higher’ and ‘lower’ professional backgrounds may obscure ongoing class advantages in a context where the major structural divide is between the most privileged and the rest (Savage et al., 2015). Overall, the analysis reflects the inherited effects of social class in shaping ongoing mobility trajectories, not just entry into a career.
While using the GBCS provides us with clear advantages in being able to access unique data on economic, cultural, and social capital, it does present us with considerable methodological limitations. First, it is a self-selected skewed sample. In particular, nurses from Black and minority ethnic backgrounds are under-represented in the GBCS, which is significant given our finding that non-White nurses earn less, consistent with the NHS’ own analysis of the ethnicity pay gap (NHS Digital, 2018). The number of male nurses in the sample, while a slightly greater proportion than in the wider population, also means that we have to treat our findings regarding gender and income with caution, given that previous evidence suggests men are over-represented in senior roles (Davey et al., 2005; Traynor, 2013). We also need to recognise that by virtue of participation in the GBCS, our sample of nurses are likely to be culturally engaged and as such our findings on cultural capital may not reflect the wider nursing population. Second, we are unable to incorporate whether the respondents worked part-time into our analysis, a crucial influence on women’s career trajectories (Dex and Bukodi, 2012). Third, we only have a measure of household income and thus cannot confidently state whether our analysis captures career trajectories. 9 As such, analysis of the social origins data within the LFS (currently not published openly but available via the Office of National Statistics (ONS) Approved Researcher Scheme) would be a valuable benchmarking exercise to explore whether there is an earnings class ceiling at work in nursing using data from a nationally representative survey.
More substantively, there is a case for more attention to be paid to intragenerational trajectories and gender in social mobility research. This is particularly pertinent for women’s social mobility, given that their work–life mobility is often non-linear compared with men’s pathways to advancement and promotion (Davey et al., 2005). We recognise we have ourselves presented an analysis using cross-sectional data, looking at social origins and destinations at a single point in time. In exploring nurses’ capitals, and the factors which influence their income as an indication of career stage, we have attempted to incorporate issues of inheritance and trajectory into our analysis. However, we would add to calls for greater attention to be paid to time in social mobility research (Friedman and Laurison, 2019), and we would particularly like to explore longitudinal analysis of nurses’ mobility to progress the field in this area. Doing so would allow us to gain greater insight into the intragenerational mobility of nurses and how class, gender, and ethnicity intersect across the life course to shape pathways into and through the profession. We also need to pay attention to how the establishment of nursing as a graduate profession and the potential for upward mobility can depend on the labour of less qualified working-class and ethnic minority women in healthcare assistant roles (Abbott and Wallace, 1990). Finally, there is also a need for qualitative social mobility research to engage with these trajectories by exploring nurses’ subjectivities of mobility: what is driving the class ceiling effect, what it feels like to be upwardly or downwardly mobile into nursing, and the ongoing lived experiences of class, ‘race’, and gender (Friedman, 2016; Lareau, 2015; Lawler, 1999; Payne, 2017; Walkerdine et al., 2001). Such an approach, inspired by feminist research in which the emotional and embodied dimensions of mobility are central, seems particularly pertinent in a gendered occupation defined by caring.
Footnotes
Acknowledgements
The authors are grateful to Daniel Laurison for his help with the GBCS data, to Sam Friedman for his comments on an early draft of this paper, and to the anonymous reviewers of this article for their constructive feedback.
Funding
The author(s) received no financial support for the research, authorship, and/or publication of this article.