
Abstract
Background
Few models to predict antiviral response of peginterferon were used in hepatitis B e antigen (HBeAg)-positive chronic hepatitis B patients and the prediction efficacy was unsatisfied. Quantitative antibody to hepatitis B core antigen (anti-HBc) is a new predictor of treatment response. We aimed to develop a new model to identify HBeAg-positive Chinese patients who were more likely to respond to peginterferon.
Methods
Data from 140 peginterferon recipients with HBeAg-positive were applied with generalized additive models and multiple logistic regression analysis to develop a baseline scoring system to predict serological response (SR: HBeAg loss and HBeAg seroconversion 24 weeks post-treatment) and combined response (CR: SR plus serum HBV DNA levels <2000 IU/mL 24 weeks post-treatment).
Results
Anti-HBc levels, alanine aminotransferase ratio, and HBeAg were retained in the final model. The new model scored from 0 to 3. Among patients with scores of 0, 1, or ≥2, SR was achieved in 6.45% (2/31), 13.21% (7/51), and 55.36% (31/56), respectively, and CR in 3.23% (1/31), 9.43% (5/53), and 25.00% (14/56), respectively. Our model has a higher AUROC for SR comparing to Chan’s (Z = 2.77 > 1.96, p < 0.05) and Lampertico’s (Z = 2.06 > 1.96, p < 0.05) model. The negative predictive value for SR and CR were both 100% in patients with score 0 and hepatitis B surface antigen ≥20,000 IU/mL at week 12.
Conclusions
Patients with higher scores at baseline were more likely to respond to peginterferon. This new model may predict the treatment response.
Introduction
Hepatitis B virus (HBV) remains an important global public health problem with a devastating cause of morbidity and mortality. 1 Antiviral therapy can effectively reduce the incidence of HBV-related complications and improve the quality of life.2–4 Peginterferon (Peg-IFN) has both antiviral and immunomodulatory activity, which has already been routinely used in clinic. Compared with nucleos(t)ide analogs (NAs), Peg-IFN has the greatest advantage of inducing immune control and maintaining long-term therapy efficacy. However, its response rate is lower and the side effects are significantly higher compared to NAs.5–7 Therefore, how to screen out the patients with good response to Peg-IFN is a big puzzle for clinical doctors.
Indicators to predict antiviral response of Peg-IFN have been used in some studies, which are experimental use and difficult to apply in clinical practice.8,9 Other prediction methods mainly focused on establishing models including the levels of HBV surface antigen (HBsAg) or hepatitis B e antigen (HBeAg), alanine aminotransferase (ALT), sex, and age. Those models are easy to use, but the actual prediction efficacy is not satisfied.10–13 Antibody to hepatitis B core antigen (anti-HBc) is a novel use of an old test indicator of HBV infection which can be used to estimate the risk of HBV reactivation in patients undergoing immunosuppression. 14 However, its clinical use is limited due to the lack of quantitative detection methods. Based on the application of double antigen enzyme-linked immunosorbent assay and standard quantitative technology, quantitative assays of measuring anti-HBc levels become useful. 15 Quantitative anti-HBc could be used to distinguish the different disease stages of chronic hepatitis B (CHB) infection.16,17 More importantly, it is a novel biomarker for predicting treatment response in HBeAg-positive patients receiving NAs 18 and Peg-IFN. 19 In patients with HBsAg clearance after Peg-IFN treatment, the levels of anti-HBc at the end of treatment can also predict the recurrence for those patients. 20
Sonneveld et al. found that response rates were low in CHB patients with HBsAg level >20,000 IU/mL after the monotherapy of Peg-IFN. The HBsAg levels at week 12 or 24 have been a stopping rule for Peg-IFN therapy. 21 We aimed to establish a prediction model including anti-HBc levels, which can better screen out patients suitable for Peg-IFN therapy. Meanwhile, we also compared the two existing models10,11 with the new one we established in order to select a better model for clinical service. Then we used the stopping rule of Peg-IFN 21 treatment to confirm our new prediction model.
Methods
Patients
140 of the 205 patients confirming the inclusion criteria were enrolled in the study (Supplementary figures). All the patients received Peg-IFN therapy alone. And the total cycle was 72 weeks, including 48 weeks of Peg-IFN treatment period and 24 weeks of follow-up period after treatment. Serum samples were collected every 12 weeks.
The inclusion criteria were as follows: (1) aged between 18 to 65 years old; (2) HBsAg-positive for more than 6 months; (3) HBeAg-positive; (4) had two episodes of elevated serum ALT levels (>1.5 times the upper limit of the normal range) within 6 months before randomization, and the normal range of serum ALT levels was defined as ≤ 40 IU/L; and (5) HBV DNA level > 105 IU/mL.
The exclusion criteria were as follows: (1) received antiviral or immunosuppressive therapy within 6 months; (2) co-infection with hepatitis A, hepatitis C, hepatitis D, hepatitis E, or human immunodeficiency virus; (3) other acquired or inherited causes of liver disease; (4) neutrophil count <1.0 × 10⁹/L or platelet count <50 × 109/L; (5) decompensated liver disease; (6) immunologically mediated disease; (7) pregnancy; and (8) alcoholism.
The definition of response: Serological response (SR) is defined as HBeAg loss and HBeAg seroconversion 24 weeks post-treatment. Combined response (CR) is defined as SR plus serum HBV DNA levels <2000 IU/mL 24 weeks post-treatment. NSR means no SR, and NCR means no CR.
The details of two published prediction models of Peg-IFN on CHB patients: (1) Chan et al.’s model 10 (Supplemetary Table) will be called Chan’s mode and (2) Lampertico et al.’s model 11 (Supplementary Table) will be called Lampertico’s model.
Laboratory measurements
Serum samples collected at weeks 0, 12, 24, 48, and 72 were analyzed. The serum anti-HBc levels were measured by a newly developed double antigen enzyme-linked immunosorbent assay (Wantai, Beijing, China) that was calibrated using immunoassay. 15 The HBsAg, HBeAg, and antibodies to hepatitis B e antigen (anti-HBe) were detected with the Architect assay (Abbott Laboratories, IL, USA). Serum HBV DNA was measured using COBAS AmpliPrep/COBAS TaqMan (Roche Diagnostics, Basel, Switzerland). The HBV genotype was assessed by sequencing.
Statistical analysis
SPSS software version 20.0 (SPSS Inc., Chicago, IL, USA) was used to perform statistical analysis. Continuous variables were presented as mean ± standard deviation (SD) for normally distributed data or median (interquartile range) for non-normally distributed data. Categorical variables were presented as counts and percentages. Areas under the receiver operating characteristic curve (AUROC) were applied to discriminate the model. Comparison between two different prediction models was carried out using a formula as follows: Z = A1-A2/√SE12+SE22-2rSE1SE2, Z > 1.96, p < 0.05; Z > 2.58, p < 0.01. 22
Model establishment
First, generalized additive models were used to detect the relationship between continuous variables and the two response indexes (SR and CR) in order to find the appropriate cut-off values for use in the logistic regression analysis. Second, associations between the baseline continuous indexes and treatment response were explored by univariate logistic regression analyses, aiming to find the optimal cut-off values. Continuous variables were classified into two different groups according to the above optimal cut-off values. Categorical variables were compared using χ2 test or Fisher’s exact test as appropriate. Third, multiple logistic regression analyses were performed using a backward elimination process. Baseline factors associated with SR or CR with a p < 0.50 were included in the multiple logistic regression analyses. p < 0.1 was required in the backward selection procedure for a baseline factor to remain in the final model. The stability of the selected model was evaluated by bootstrap resampling. 23 A baseline variable was considered to be a reliable predictor if it was selected in at least ≥50% of 500 bootstrapped samples with replacement. AUROC and the Hosmer–Lemeshow tests were applied to assess the goodness of fit of the final model.
The article involved two different response indexes, and the SR model–related baseline variables were considered to be the primary model. The scoring system was derived by assigning points according to the method of Sullivan et al. 24 The reference category for each predictive factor was assigned to a score of 0. Points were then assigned according to the size of the regression coefficient in the final model.
Results
Baseline characteristics
Baseline characteristic of patients stratified by the follow-up endpoint.

Serological response (SR) is defined as HBeAg loss and HBeAg seroconversion 24 weeks post-treatment; NSR means no SR.
Combined response (CR) is defined as SR plus serum HBV DNA levels <2000 IU/mL 24 weeks post-treatment; NCR means no CR.
ALT ratio = alanine aminotransferase level divided by the upper limit of normal (ULN) for the local laboratory.
HBV, hepatitis B virus; ALT, alanine aminotransferase; HBsAg, hepatitis B surface antigen; HBeAg, hepatitis B e antigen; Anti-HBc, antibodies to hepatitis B core antigen; SD, standard deviation; ULN, upper limit of normal.
Compared to NSR patients, SR patients had significantly higher anti-HBc levels (4.58 ± 0.50 log10 IU/mL vs.4.13 ± 0.69 log10 IU/mL, p < 0.001) and ALT ratio (6.13 ± 5.02 × ULN vs. 4.07 ± 2.61 × ULN, p < 0.001) but significantly lower HBsAg (3.95 ± 0.50 log10 IU/mL vs. 4.12 ± 0.62 log10 IU/mL, p = 0.027) and HBeAg S/CO levels (2.45 ± 0.75 log10 S/CO vs. 2.88 ± 0.38 log10 S/CO, p < 001). Compared to no NCR patients, CR patients had significantly higher anti-HBc levels (4.61 ± 0.51 log10 IU/mL vs. 4.18 ± 0.69 log10 IU/mL, p = 0.016) and ALT ratios (5.50 ± 2.12 × ULN vs. 4.52 ± 3.76 × ULN, p = 0.006) but significantly lower HBV DNA levels (7.30 ± 0.57 log10 IU/mL vs. 7.70 ± 0.88 log10 IU/mL, p = 0.017) and HBsAg levels (3.85 ± 0.59 log10 IU/mL vs. 4.11 ± 0.59 log10 IU/mL, p = 0.027).
Among 51 genotype B patients, 16 (31.37%) patients achieved SR and 7 (13.73%) patients achieved CR. Among 89 genotype C patients, 24 (26.97%) patients achieved SR and 13 (14.61%) patients achieved CR. There is no significant difference between SR and NSR patients in HBV genotype (p = 0.652), so as well between CR and NCR patients (p = 0.886).
Generalized additive model and univariate logistic regression analysis to identify baseline predictive characteristics
Univariate logistic regression analysis of factors associated with SR and CR 24 weeks post‐treatment.

Serological response (SR) is defined as HBeAg loss and HBeAg seroconversion 24 weeks post-treatment.
Combined response (CR) is defined as SR plus serum HBV DNA levels <2000 IU/mL 24 weeks post-treatment.
HBV, hepatitis B virus; HBsAg, hepatitis B surface antigen; HBeAg, hepatitis B e antigen; Anti-HBc, antibodies to hepatitis B core antigen.
ULN, upper limit of normal; ALT ratio = alanine aminotransferase level divided by the upper limit of normal (ULN) for the local laboratory.
a Wald chi‐square test for each regression coefficient.
b Wald chi‐square test for each variable.
Multiple logistic regression analysis of selected baseline characteristics with SR and CR
Multiple logistic regression analysis of factors associated with SR and CR 24 weeks post‐treatment.

Serological response (SR) is defined as HBeAg loss and HBeAg seroconversion 24 weeks post-treatment.
Combined response (CR) is defined as SR plus serum HBV DNA levels <2000 IU/mL 24 weeks post-treatment.
HBV, hepatitis B virus; Anti-HBc, antibodies to hepatitis B core antigen.
ALT ratio = alanine aminotransferase level divided by the upper limit of normal (ULN) for the local laboratory.
a Wald chi‐square test for each regression coefficient.
b Wald chi‐square test for each variable.
Scoring system for predictive baseline characteristics.

Anti-HBc, antibodies to hepatitis B core antigen; HBeAg, hepatitis B e antigen.
ALT ratio = alanine aminotransferase level divided by the upper limit of normal (ULN) for the local laboratory.
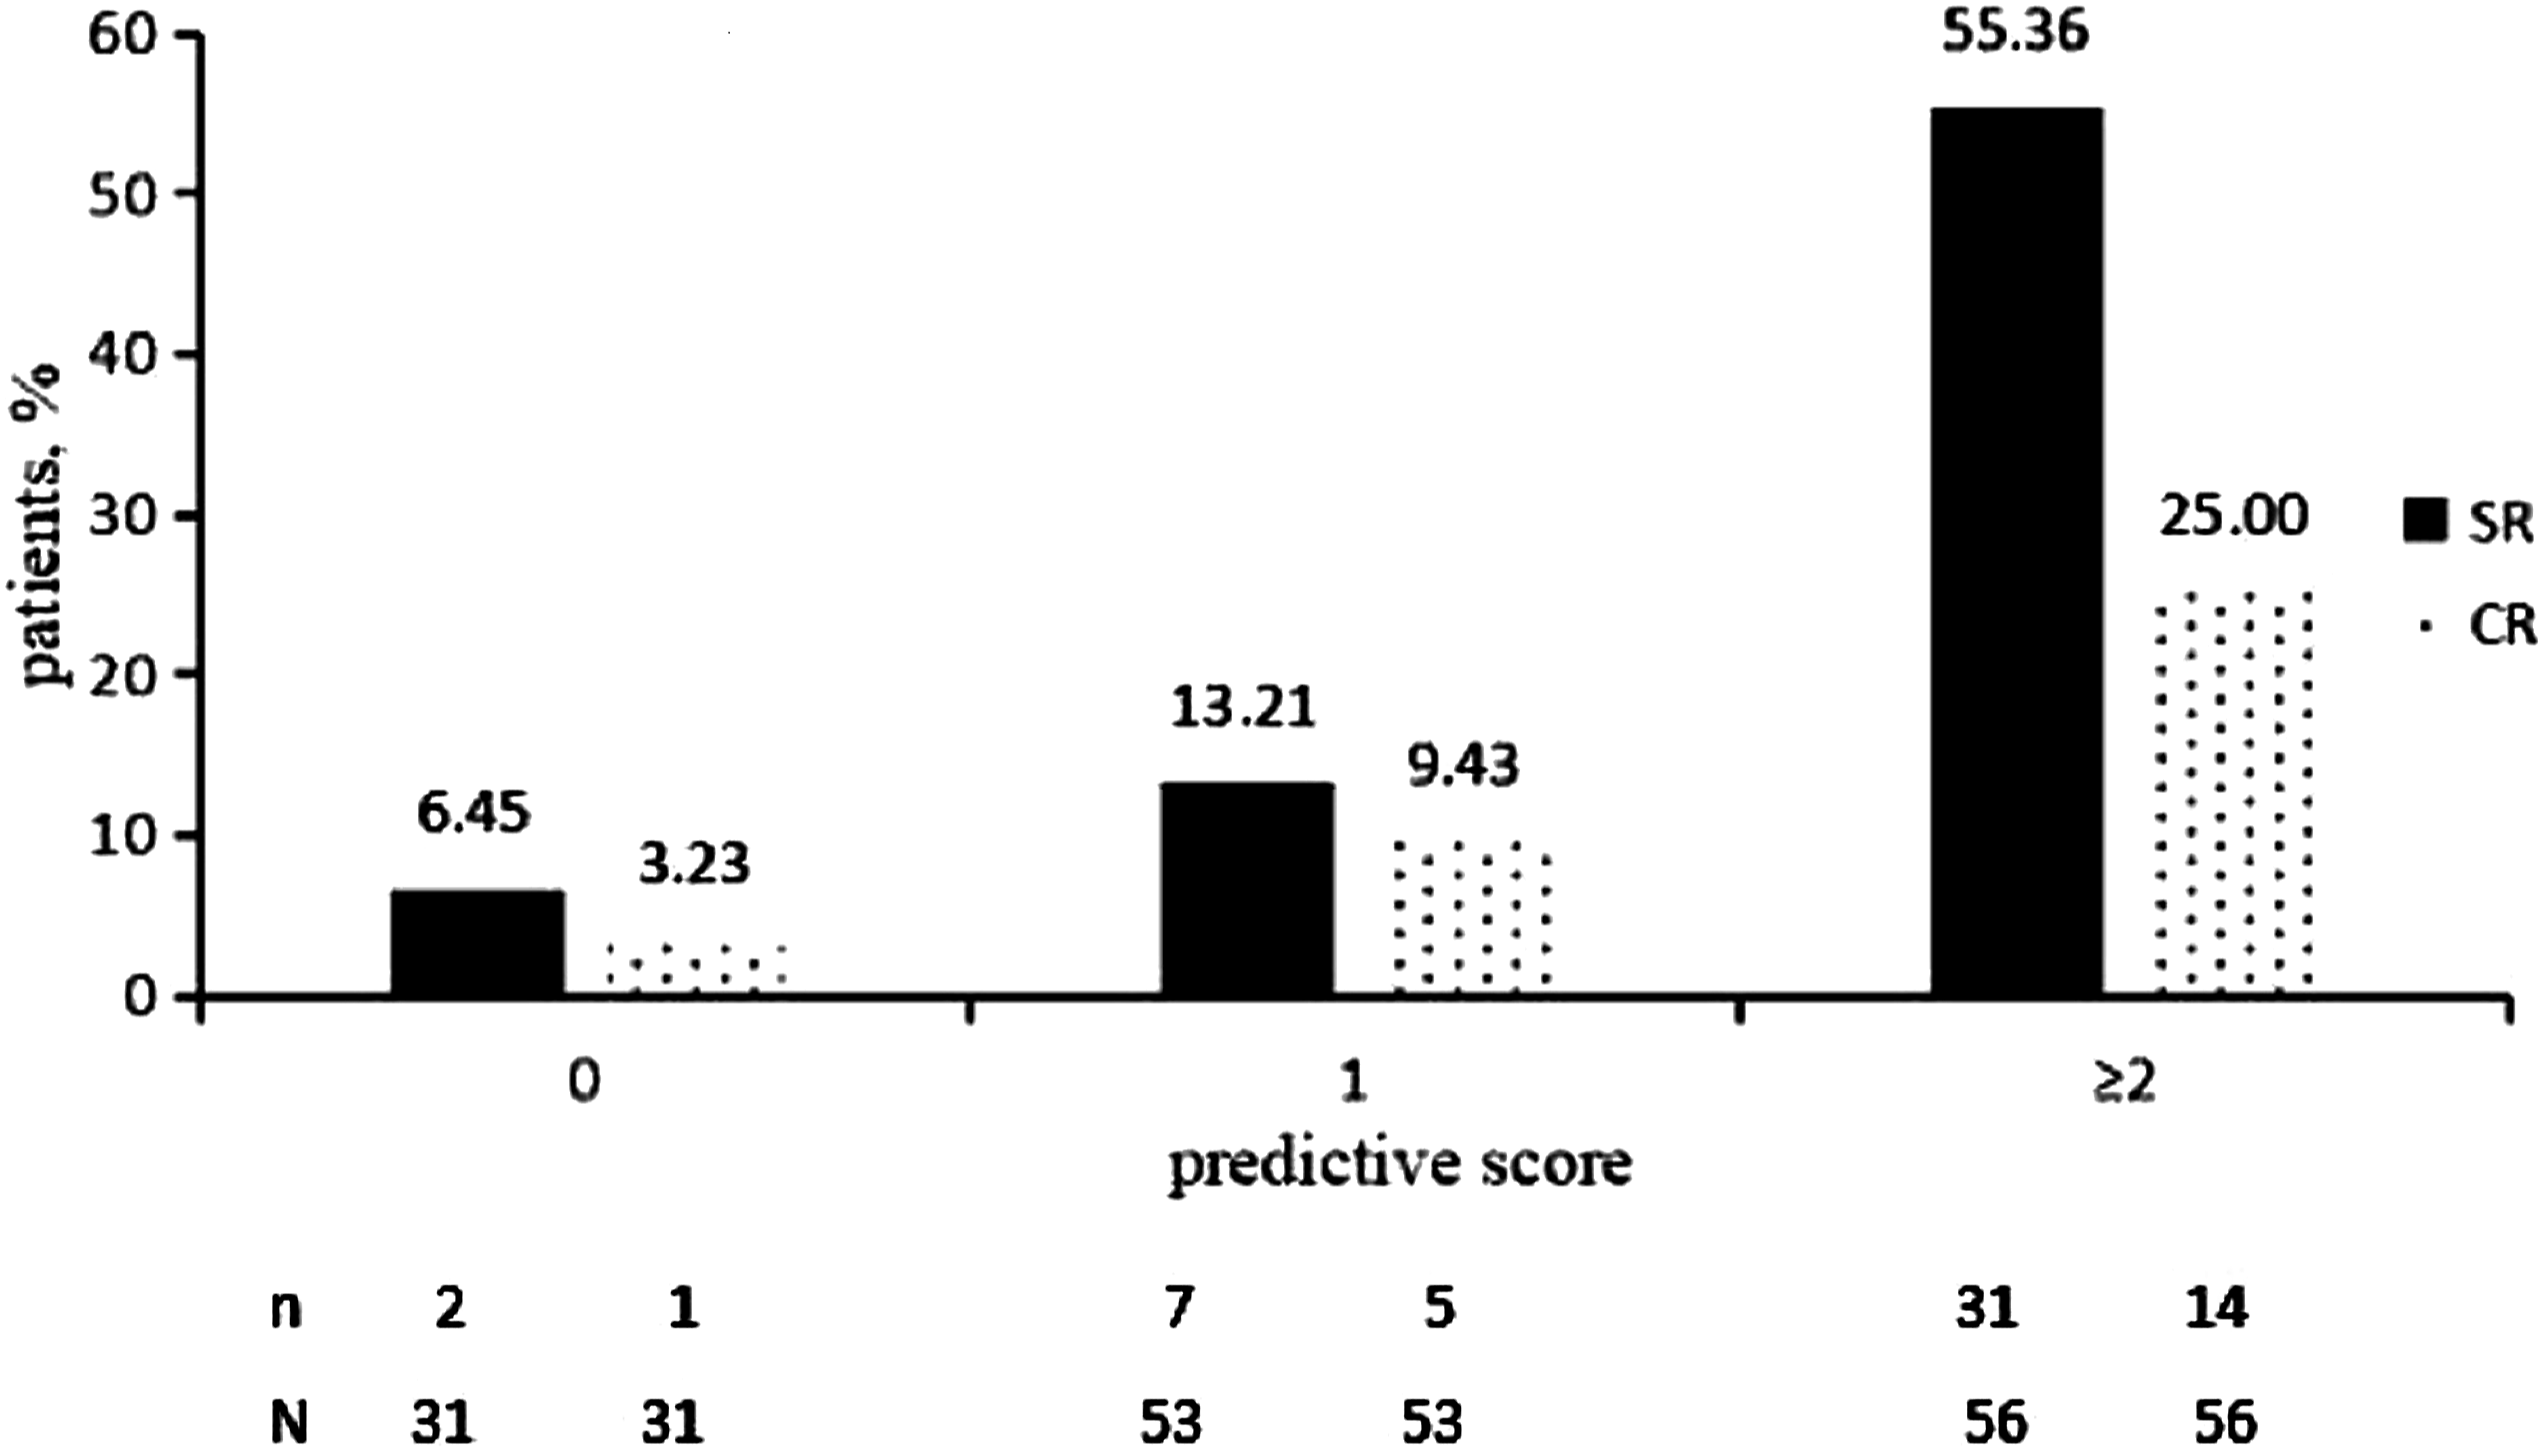
SR and CR response rates 24 weeks post-treatment by our baseline new predictive score. SR = HBeAg loss and HBeAg seroconversion 24 weeks post-treatment. CR = SR plus HBV DNA levels <2000 IU/mL 24 weeks post-treatment.
Response rates according to baseline prediction scores
The overall SR and CR rates were 28.57% (40/140) and 14.29% (20/140), respectively, and both the response rates gradually increased with increasing baseline prediction scores. According to the response rates of different scores, we classified the patients into three groups: 0 point was defined as low response, 1 point as moderate response, and ≥2 points as high response. Among 31 patients in the low response group, only two patients (6.45%) achieved SR and one patient (3.23%) achieved CR. The negative predictive value (NPV) in low response group was 93.55% with SR and 96.77% with CR. Among 53 patients in moderate response group, seven patients (13.21%) experienced SR and five patients (9.43%) experienced CR. Among 56 patients in high response group, 31 patients (55.36%) achieved SR and 14 patients (25.00%) achieved CR. The rates of SR and CR in high response group were significantly higher than the overall response rates (Figure 1).
Comparison of AUROC between the new prediction model and two published prediction models
For all the 140 enrolled patients, Chan’s model
10
had 0.627 (p = 0.019) AUROC curve for SR and Lampertico’s
11
model had 0.669 (p = 0.002) AUROC curve for SR. However, the new prediction model in our study had 0.782 (p<0.001) AUROC curve for SR (Supplementary figure). Compared with the AUROC of Chan’s model,
10
our new prediction model had a higher AUROC (Z = 2.77 > 1.96, p < 0.05). Similarly, our new prediction model also had a higher AUROC (Z = 2.06 > 1.96, p < 0.05) comparing with the AUROC of Lampertico’s model
11
(Figure 2). The comparison of AUROC between our new prediction model and the two published prediction models. AUROC = Areas under the receiver operating characteristic curve; NS = not significant; ∗ p<0.05.
The new baseline prediction score combined with week 12 or 24 HBsAg levels to predict SR and CR
123 patients (87.86%) had HBsAg levels <20,000 IU/mL at week 12, while the rest 17 patients (12.14%) had HBsAg levels ≥20,000 IU/mL. Among the 123 patients with HBsAg levels <20,000 IU/mL, 38 (30.89%) and 20 (16.26%) individuals achieved SR and CR, respectively. Among 53 patients with HBsAg levels <20,000 IU/mL and prediction scores of 2–3, 30 individuals (56.60%) achieved SR and 15 (28.30%) achieved CR. Among the 17 patients with HBsAg levels ≥20,000 IU/mL, two individuals (11.76%) achieved SR but none achieved CR. Among 10 patients with HBsAg levels ≥20,000 IU/mL and prediction scores of 0, no individual achieved SR or CR. The NPV for SR and CR were both 100% in patients with HBsAg levels ≥20,000 IU/mL at week 12 and prediction scores of 0.
The association between response rates and the combination of baseline prediction score with HBsAg level at week 24 was similar (data not shown). The NPV for SR and CR were both 100% in patients with HBsAg levels ≥20,000 IU/mL at week 24 and prediction scores of 0.
Discussion
Our study showed that the new prediction model was useful to identify HBeAg-positive CHB patients who were more likely to respond to Peg-IFN therapy. Meanwhile, a significantly higher NPV (>90%) was observed in non-responsive patients. All the 140 patients enrolled were CHB patients of genotype B or C, and the response rates of the two genotypes were similar. Since almost all CHB patients in China are genotype B or C, genotyping tests might not be necessary for Chinese HBeAg-positive CHB patients receiving Peg-IFN therapy.
Chan H et al. found that a pre-treatment scoring system using readily available baseline characteristics (sex, age, ALT ratio, HBsAg levels, and HBV DNA levels) identified HBeAg-positive Asian patients likely to experience sustained HBeAg seroconversion after treatment with Peg-IFN. 10 Lampertico P et al. also found that an easy-to-use baseline scoring system would allow clinicians to identify patients with a low or high chance of achieving a durable post-treatment response to Peg-IFN. 11 These two models were also carried out for the 140 patients involved in our study, and the results were used to verify their efficacy in practice. Unfortunately, their AUROC were both <0.700, and the actual potency was unsatisfied. There were two prediction models containing semi-quantitative anti-HBc levels, which revealed that the baseline level of anti-HBc might be a good indicator for predicting SR of interferon.12,13 A novel diagnostic immunoassay testing procedure for anti-HBc using homogeneous purified full-length hepatitis B core antigen (HBcAg) capsids obtained from Escherichia coli could quantify the levels of anti-HBc in serum. 15 Based on quantitation of anti-HBc, a new prediction model in our study was established by combining baseline anti-HBc levels with other two baseline indicators. The final scores of the selected indexes were as follows: anti-HBc levels <30,000 (0) or ≥30,000 IU/ml (1); HBeAg levels <800 (0) or ≥800 S/CO (1); and ALT <4 (0) or ≥4 ratio × ULN (1).
The new scoring system ranged from 0 to 3, with higher scores predicting a higher likelihood of experiencing SR and CR. According to the response rates of different scores, we classified patients into three groups. Patients with baseline prediction scores 2 to 3 (40% of the total patients) had the highest probability of achieving SR (55.36%) and CR (25.00%). The probability of achieving SR (13.21%) and CR (9.43%) in patients with baseline prediction score 1 (38% of all patients) was similar to that of the general populations. Patients with baseline prediction score 0 (22% of all patients) had the lowest likelihood of achieving SR and CR (both<10%). Compared to the two previously published models, the AUROC of our new model was significant higher. It showed that the new model had more advantages in identifying patients between responsive and non-responsive individuals, which indicated that our model could be more superior for clinical use.
HBsAg levels at weeks 12 and 24 had already been a stopping rule for HBeAg-positive CHB patients receiving Peg-IFN therapy alone.6,21 The NPV for SR as well as CR was 100% in patients with HBsAg levels ≥20,000 IU/mL and prediction scores of 0 at weeks 12 and 24. So our new model enables us to master the withdrawal indications more accurately at week 12 and adjust the treatment strategy in time to avoid receiving useless treatment or leading to potential adverse events.
The purpose of our article is to provide scientific basis for patient selection of Peg-IFN therapy and adjustment during treatment. Compared with the published models, our prediction model could significantly increase the PPV and NPV of SR and CR. For patients with prediction scores ≥2, they were suitable candidate to receive Peg-IFN therapy. But for patients with prediction score 0, Peg-IFN was not routinely recommended. For patients who had already received Peg-IFN treatment, HBsAg levels at week 12 combined with baseline prediction score 0 could be a useful stopping rule. The most advantage of our article is that all patients were treated with Peg-IFN alone. However, our research still has certain limitations. The sample size was not large enough, and further expansion of sample size in the future would lead to more convincing results.
In conclusion, our new baseline scoring system reveals that CHB patients with higher baseline prediction scores usually have a higher likelihood of experiencing SR and CR. It is helpful for clinicians to identify patients with a low or high possibility of achieving a durable treatment response to Peg-IFN treatment in CHB patients.
Supplemental Material
sj-pdf-1-avt-10.1177_13596535211059895 – Supplemental Material for A baseline model including quantitative anti-HBc to predict response of peginterferon in HBeAg-positive chronic hepatitis B patients
Supplemental Material, sj-pdf-1-avt-10.1177_13596535211059895 for A baseline model including quantitative anti-HBc to predict response of peginterferon in HBeAg-positive chronic hepatitis B patients by Yu-Qing Fang, Xiao-Yan Xu, Feng-Qin Hou and Wei Jia in Antiviral Therapy
Footnotes
Acknowledgments
We would like to thank Liu-Wei Song (National Institute of Diagnostics and Vaccine Development in Infectious Diseases, Xiamen, Fujian, China) for his technical support of measuring anti-HBc.
Author contributions
All authors contributed to the study conception and design. Material preparation, data collection, and analysis were performed by Wei Jia, Xiao-Yan Xu, and Feng-Qin Hou. The first draft of the manuscript was written by Yu-Qing Fang and all authors commented on previous versions of the manuscript. All authors read and approved the final manuscript.
Declaration of conflicting interests
The author(s) declared no potential conflicts of interest with respect to the research, authorship, and/or publication of this article.
Funding
The author(s) received no financial support for the research, authorship, and/or publication of this article.
Availability of data and material
Data are available within the article or its supplementary materials.
Informed consent
Informed consent was obtained from all individual participants included in the study. All patents provided written informed consent for the scientific use of their clinical data, sample. Patients signed informed consent regarding publishing their data.
Ethics approval
The study has been approved by the local ethics committee of Peking University First Hospital before experiment was started and that has been conducted in accordance with the principles set forth in the Helsinki Declaration and its later amendments.
Supplemental material
Supplemental material for this article is available online.
References
Supplementary Material
Please find the following supplemental material available below.
For Open Access articles published under a Creative Commons License, all supplemental material carries the same license as the article it is associated with.
For non-Open Access articles published, all supplemental material carries a non-exclusive license, and permission requests for re-use of supplemental material or any part of supplemental material shall be sent directly to the copyright owner as specified in the copyright notice associated with the article.