
Abstract
Open label placebos (OLPs) refer to the non-deceptive administration of inert treatment. This pre-registered study (AsPrediced#139837) explored the role of expectations and tailored health feedback on the OLP effect using an automated online procedure. Healthy participants (N = 293) were randomised to a 10-day course of OLP pills with veridical feedback (OLP-Feedback: N = 92), without feedback (OLP-Standard: N = 105), or to a no-treatment control (NTC: N = 96). Participants were informed the pills were inert but may enhance wellbeing. Wellbeing was assessed at baseline, day-5 and day-10. Feedback was delivered on day-5 and day-10 via interactive graphs and descriptive statistics. OLP-treatment significantly improved wellbeing (negative emotions and sleep quality), while feedback did not significantly enhance this effect. Expectations for improvement were significantly elevated among OLP-treated participants across the 10-day study. However, at the individual level, expectations only mediated OLP outcomes once treatment experience had been acquired. Results reconcile inconsistencies in the literature regarding mechanisms.
Introduction
In 1965, a self-professed ‘unusual’ report appeared in the Archives of General Psychiatry. It described those seeking treatment for anxiety as experiencing improvement after the open administration of inert sugar pills (Park and Covi, 1965). This study garnered limited attention for several decades. A landmark trial demonstrating similar benefits in irritable bowel syndrome, however, reignited the question, ‘can placebo effects occur without deception?’ (Kaptchuk et al., 2010). Since then, over 50 RCTs have explored this question, with meta-analyses demonstrating that open label placebos (OLPs) – those given non-deceptively – appear to improve subjective outcomes in clinical samples with small-to-medium effect sizes (Charlesworth et al., 2017; Fendel et al., 2024; von Wernsdorff et al., 2021).
OLP effects have additionally been observed in healthy and sub-clinical populations, albeit in attenuated form (Fendel et al., 2024; Spille et al., 2023). However, findings are varied. Some report results in primary (Barnes et al., 2023; Buergler et al., 2023; Disley et al., 2021; El Brihi et al., 2019; Guevarra et al., 2020, 2024; Hahn et al., 2022; Mills et al., 2023; Schaefer et al., 2019; Schneider et al., 2020) and exploratory analyses (Bräscher et al., 2022; Kleine-Borgmann et al., 2021; Leibowitz et al., 2019; Schaefer et al., 2021), while others show limited evidence (Anna et al., 2019; Barnes et al., 2019; Friehs et al., 2022; Kube et al., 2020; Locher et al., 2017; Mathur et al., 2018; Meeuwis et al., 2019; Schienle and Unger, 2021).
Reasons for these mixed effects remain unclear. One challenge concerns a limited understanding of how OLP effects arise, making methodological evaluation, and theory building, difficult. Theories concerning deceptive placebos posit that expectations drive health improvements (Colagiuri et al., 2015; Meissner et al., 2011). However, there is no clear consensus regarding OLPs. Some have suggested that these two types of placebo are governed by different mechanisms (Haas et al., 2022), with expectations playing a lesser role in the latter (Kaptchuk et al., 2020). This follows, as expectations regarding deceptive placebos concern the supposed active ingredient of the treatment. Nevertheless, two pieces of evidence suggest that expectations may be implicated in OLPs. First, they are typically administered with a positive rationale (e.g. Kaptchuk et al., 2010; Leibowitz et al., 2019). As omission of this information diminishes OLP effects, explicit expectations appear implicated (Anna et al., 2019; Barnes et al., 2023; Göhler et al., 2021; Leibowitz et al., 2019; Locher et al., 2017). Second, deceptive relative to OLP effects are significantly larger in non-clinical samples (Barnes et al., 2019; Friehs et al., 2022; Haas et al., 2020; Mills et al., 2023: although see Disley et al., 2021). As the rationale varies, this suggests that placebo effects increase with expectations.
This evidence, however, infers the modulation of expectations from the presence of the experimental manipulation. While not uncommon in the literature (Faasse, 2019; Rooney et al., 2023), the minority of OLP studies directly measuring expectations raises questions about the validity of this assumption, with only a few reporting significant results. One found a correlation between expectations and health outcomes in the OLP-treated group alone (El Brihi et al., 2019), another showed that expectations predicted outcomes, but did not fully explain differences between OLP and control groups (Buergler et al., 2023) and a third found expectations only predicted OLP improvement when baseline health outcomes were poor (Barnes et al., 2023). In contrast, most studies have reported limited associations in healthy participants (Guevarra et al., 2024; Kube et al., 2020, 2022; Lee et al., 2022; Meeuwis et al., 2019; Mills et al., 2023; Schaefer et al., 2023).
Reconciling these differences is difficult. Overall, the literature reviewed suggests that expectations may play a role when broadly construed (i.e. at the level of the manipulation) but lack specificity when addressed at the individual level. This is compatible with computational and statistical models of the placebo effect that suggest expectations and treatment experience create a dynamic feedback loop that evolves over time (e.g. Barnes et al., 2021; Jepma et al., 2018). Notably, most OLP studies measure expectations at baseline, before updating based on treatment experience could occur. Unlike deceptive placebo studies, where expectations tend to be predictive of outcomes, in OLP studies, individuals have limited prior experience on which to anchor OLP-related expectations. As such, these expectations are likely to be uncertain and loosely held (i.e. apparent at the level of the group only). Only three studies have deviated from baseline measurement. One measured at baseline and mid-point (Pan et al., 2020) and one at the study’s end (Schaefer et al., 2023), but neither found an association with OLP outcomes. A third, employed a pain model and measured expectations multiple times, being one of the few to find direct mediation of the OLP effect through expectations (Tang et al., 2024). This provides tentative evidence that measuring expectations successively might strengthen their predictive value, although this effect was observed in subgroup analysis only.
One aim of the present study was therefore to fill this knowledge gap by investigating whether the lack of association between expectations and the OLP effect is reflective of measurement timing. Specifically, whether expectations measured during the treatment course are associated with OLP outcomes. Understanding how OLPs work is important in terms of accelerating our theoretical understanding of the effect, allowing for a better understanding of when they may take effect in practice.
To further understand OLP-related mechanisms, the study also aimed to determine if the OLP effect could be enhanced through a simple intervention to sharpen expectations via tailored feedback. The rationale concerns the potential for self-reflection on changes in health status, as outlined below.
Existing research raises the potential that tangible and unwanted symptoms that can easily be tracked and quantified during the process of self-evaluation may be more receptive to OLP effects. Specifically, qualitative analysis shows that the administration of inert treatment may increase attention to, and agency over, internal states occurring during self-evaluation (Hruschak et al., 2023; Pan et al., 2020). This aligns with quantitative evidence demonstrating that clinical samples with elevated baseline visceral pain sensitivity, amplification and severity (i.e. states easy to discern) experienced greater relief from OLP treatment (Ballou et al., 2022; Flowers et al., 2021).
Data from sub-clinical samples supports this idea. OLP effects were found to be most pronounced among those with poor physical and emotional well-being at baseline (Barnes et al., 2023). Additionally, expectations strengthened the OLP effect when baseline symptoms were present to act on. This was particularly true for physical symptoms compared to emotional well-being and sleep quality, which may be harder to track. As such, it is possible that sharpening participants’ expectations regarding the amount of improvement they have made, particularly in ambiguous situations, may increase the OLP effect.
One way this can be achieved is to provide participants with an accurate representation of their improvement. In deceptive placebo studies, false feedback regarding improvement can enhance placebo effects (Colagiuri and Boakes, 2010), suggesting that genuine feedback is likely to be assimilated into expectations as the OLP effect unfolds. However, assessing expectancy interventions in OLP designs are complicated by experimenter bias from lack of blinding. This makes it hard to disentangle pure expectancy effects from other components of the patient-practitioner interaction which are known to enhance the placebo effect (Barnes et al., 2024; Czerniak et al., 2016; Howe et al., 2019). Automated methods offer a solution (Gruszka et al., 2019). Several studies have used online methods to explore the OLP effect, with mixed results in clinical samples (Kube et al., 2021), but positive outcomes in healthy participants (Buergler et al., 2023; Guevarra et al., 2024), providing proof of concept. All, however, incorporated one-on-one contact with participants via video conferencing software. To eliminate contact entirely, the present study employed a fully automated design where there was never any contact between experimenter and participants.
The current study therefore explored: (1) the longitudinal effect of expectations on OLP outcomes in a large online sample without experimenter contact, and (2) whether the addition of tailored feedback would enhance the OLP effect via the sharpening of expectancies. A paradigm was selected that has previously produced significant OLP effects (Barnes et al., 2023; El Brihi et al., 2019) and where the primary outcomes targeted physical and psychological wellbeing, demonstrated to be receptive to OLP administration (Barnes et al., 2023; El Brihi et al., 2019; Guevarra et al., 2020, 2024; Hahn et al., 2022; Schaefer et al., 2019). As an overarching theory of why OLP effects occur is largely missing from the literature, the aim was to further our understanding of the mechanisms that drive health improvement after OLP administration, with the aim of being able to intervene with greater specificity in future.
Method
Design
A design with one between-subjects factor of Group (OLP-Feedback; OLP-Standard; No Treatment Control (NTC)) and one within-subjects factor of Time (Baseline; T1-post (Day 5); T2-post (Day 10)) was employed. OLP-treated participants received inert pills. To maintain blinding, the NTC received a small box of mints for after the study (see below). Based on previous research (Barnes et al., 2023; El Brihi et al., 2019), primary outcomes concerned physical symptoms (The Subjective Health Complaints scale; SHC), sleep quality (Insomnia Severity Index; ISI), and psychological well-being (The Depression Anxiety Stress Scale; DASS-21). Expectations and perceptions of health improvement, as well as adherence, were additionally measured. Primary outcomes were assessed at all timepoints. Feedback was delivered to the OLP-Feedback group at T1- and T2-post. Expectations were measured in all participants after randomisation but prior to treatment. At T1- and T2-post, expectations were measured in all participants after feedback had been delivered to the OLP-Feedback group. The study was approved by the University of New South Wales Human Research Ethics Advisory Panel-C (behavioural sciences; File 3802) and preregistered (https://aspredicted.org/5v7b-mpnd.pdf).
Pre-registered hypotheses were:
Enrolment and sample
Healthy participants from the Australian general population were recruited via Facebook adverts between 17th October, 2023 and 12th January 2024 (Supplemental Materials 1). Those completing received a $25 gift voucher as recompense. Inclusion criteria were: (1) 18+ years of age; (2) English fluency; (3) located in Australia for 30 days post-consent; (4) no previous allergy, or sensitivity, to gelatin or cellulose; (5) able to swallow capsules and pills; (6) having noted that the capsules were kosher but not halal. Pre-registered exclusion criteria concerned those who did not make a serious attempt at participation (i.e. not following instructions, providing meaningless or inconsistent responses, failing a bot-check (reCAPTCHA)). Participants were additionally excluded if they reported becoming ill during the study (i.e. were not healthy at the time of testing). Figure 1 presents data regarding attrition and exclusions.
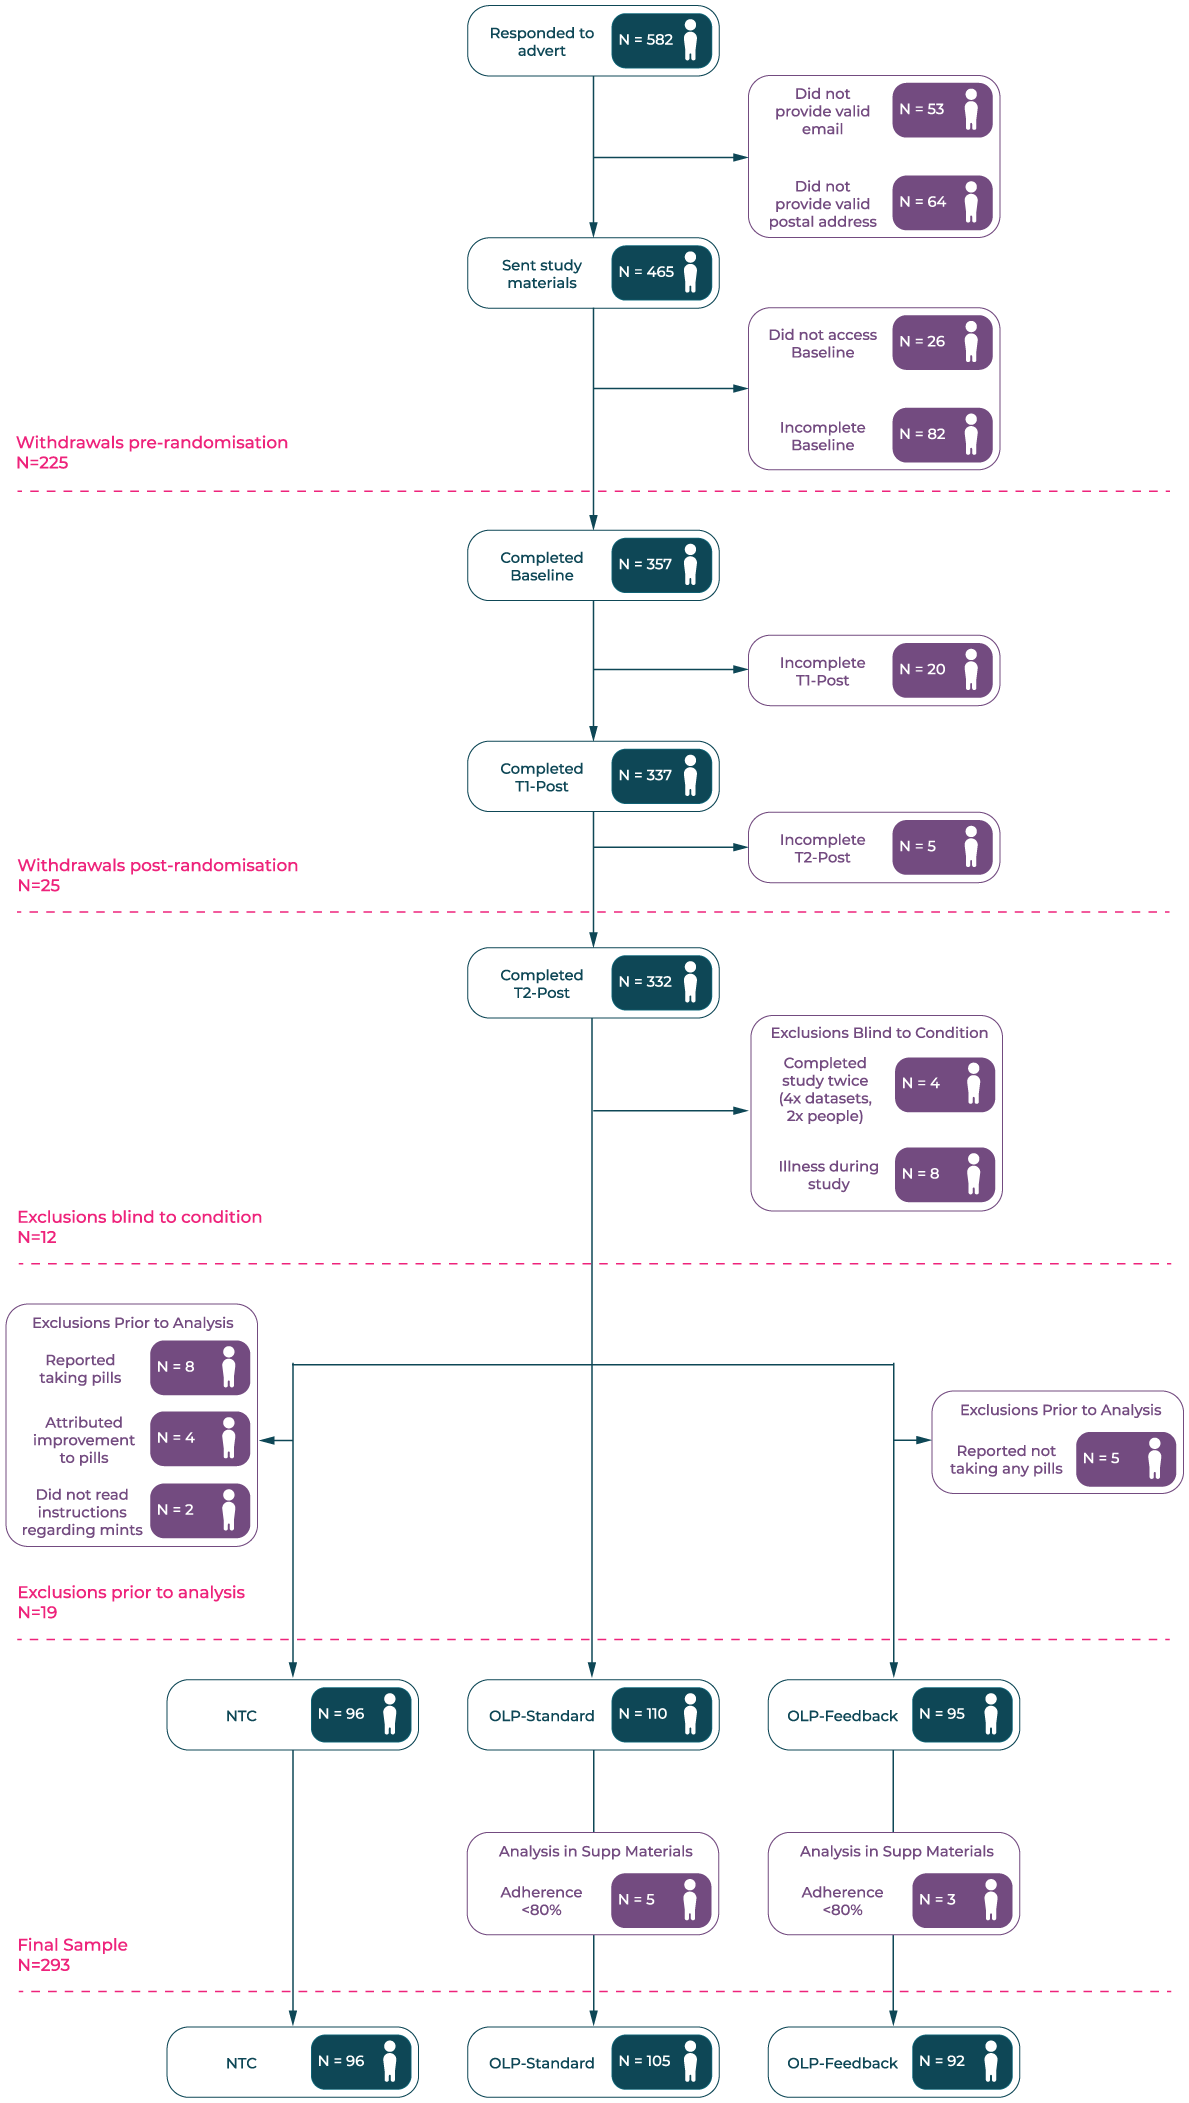
Recruitment flow-chart detailing withdrawals and exclusions. Exclusions prior to analysis included duplicate responses, illness during the study (conjunctivitis, UTI, sinus infection, head cold, tonsillitis, flu/fever, gastroenteritis, arthritis flare-up, COVID) and not following instructions. The latter included not taking any OLP pills, reporting taking pills when none were provided, attributing health improvement to OLPs when none were provided and referring to mints as placebos.
After exclusions, data was available for 301 participants: OLP-Feedback N = 95; OLP-Standard N = 110; NTC N = 96. A further eight (OLP-Feedback N = 3; OLP-Standard N = 5) did not meet the set criterion for adherence (80%; see below). Based on a pre-registered sensitivity analysis, the primary analysis including these participants is presented in Supplemental Materials 2 for transparency. We note that, as would be expected, results were stronger with non-adherent participants removed, but their omission did not change significance (i.e. non-significant results did not become significant). Final statistics are therefore based on a sample of N = 293.
Materials
Placebo-treated participants were provided with capsules containing cellulose in a gelatine wrapper. Pills were blister packaged and bright yellow in colour to increase their salience.
Manipulation: Health feedback
Those randomised to the OLP-Feedback group received information regarding their improvement over the previous 5 days, delivered at T1- and T2-post, after the primary outcomes had been collected. This consisted of written information regarding their change score (Baseline minus Follow-Up) presented in raw numbers and as a percentage. A dynamic graph appeared on screen with participants encouraged to hover over their scores to explore changes (Supplemental Materials 3). Feedback was presented separately for each health outcome (physical symptoms, sleep quality, negative emotions). For ethical reasons (i.e. not to induce nocebo effects), only those who showed an improvement in the target outcome were provided with feedback. This meant that at each Follow-Up, participants could see feedback ranging from all three outcomes to none. Each feedback page was displayed for 12 seconds before participants could proceed.
Measures
At Baseline and both Follow-Up timepoints, participants completed questionnaires assessing aspects of physical and psychological wellbeing. All questions enquired about their experience over the previous 5 days.
Psychological wellbeing: Negative emotions
The DASS-21 was used to assess negative mood states (Henry and Crawford, 2005; Lovibond and Lovibond, 1995). Participants were asked to rate 21 items (e.g. ‘I found it hard to wind down’) on a four-point scale (0 = never, 3 = almost always). A total sum score was calculated, consistent with previous OLP research (Barnes et al., 2023; El Brihi et al., 2019). Higher scores indicating greater depression, anxiety and stress. Responses were summed and scores doubled (Lovibond and Lovibond, 1995) to make them comparable to the full measure (α: BL = 0.93; T1 = 0.93; T2 = 0.94).
Physical wellbeing: Sleep quality
The ISI measured sleep quality (Morin et al., 2011). The seven items (e.g. ‘How worried or distressed are you about your current sleep pattern?’) were rated on a five-point scale (e.g. 0 = not at all worried, 4 = very much worried). A sum score was calculated with higher scores indicating lower sleep quality (α: BL = 0.88; T1 = 0.87; T2 = 0.88).
Physical wellbeing: Physical symptoms
The SHC was used to assess physical symptoms (Eriksen et al., 1999). Participants were asked to rate 35 physical symptoms (e.g. ‘coughing’ ‘headache’) on a four-point scale (0 = not at all, 3 = severe). A sum-score was calculated, with higher values indicating greater symptom experience (α: BL = 0.91; T1 = 0.92; T2 = 0.92).
Outcome expectations and health perceptions
At the end of each survey, participants rated how much they expected their well-being to improve over the subsequent 5 days. At T2-post, participants were asked to imagine the study were to continue in the same manner for another 5 days. Ratings were provided for physical symptoms, sleep quality and negative emotions separately, on a scale from 0 (not at all) to 10 (to a great extent). At the beginning of each Follow-Up, participants were asked ‘how much has your general well-being improved as a result of taking part in this study’ on a scale of 0 (not at all) to 10 (very much). Those in the OLP groups who scored over zero were asked to what extent they would attribute this change to the OLP pills (same scale as above).
Adherence
OLP-treated participants were asked how many OLP pills they had taken over the past 5 days, from ‘5 (I took all the placebo pills)’ to ‘0 (I did not take any of the placebo pills)’. They were also asked if they had been taken at roughly the same time each day (Yes/No), in the hope that this would act as a reminder. As in previous studies (Barnes et al., 2023; El Brihi et al., 2019), the threshold for non-adherence was set at <80% (fewer than 4 pills) in either T1- and T2-Post timewindow, based on a commonly accepted threshold to determine clinical adherence (Simpson and Mendys, 2010). Several exploratory items were included at the end of the study to better understand perceptions of OLP treatment (not reported here).
Procedure
Healthy participants were recruited to take part in a study regarding OLPs on physical and psychological wellbeing. During the consent process, participants were informed that the study aimed to examine OLPs on physical and psychological wellbeing and that they may be asked to take OLP pills. Information about OLP and control groups was withheld until after Baseline measures were complete (see below). Those who consented and provided a valid mailing address were subsequently assigned to an experimental condition in order of completion using a pre-determined random sequence. They were then sent a package containing study materials (Supplemental Materials 4). This consisted of an information leaflet with a link to the baseline questionnaire and a sealed box containing ID codes and either placebo pills (OLP-Feedback and OLP-Standard groups) or a small box of mints (NTC) with comparable auditory properties when shaken. This ensured that all participants were blind to condition until baseline outcomes were complete (Kube et al., 2022). During the initial 30-minute baseline questionnaire, participants completed measures of the primary outcomes (physical and psychological well-being). Experimental groups were not mentioned prior to baseline measurement and participants were blind to the Standard and Feedback groups until debrief. All subsequently watched a 5-minute video concerning deceptive placebo effects and a 2.5-minute video about the OLP effect, controlling for the amount and type of information provided to participants (Supplemental Materials 5). Videos followed the standard OLP rationale (e.g. Carvalho et al., 2016; Kaptchuk et al., 2010): (1) placebos can have powerful effects; (2) the body can respond automatically; (3) a positive attitude may help but is not required; (4) adherence is important; and (5) effects operate through mind-body mechanisms (conditioning, expectations, neurophysiology). The video, audio and transcript are freely available (https://tinyurl.com/OLP-OSF). Participants could not proceed with the survey until the time taken to watch the videos in full had elapsed. An attention check, consisting of five questions about the placebo effect (Supplemental Materials 6), was implemented at the end of the videos to assess retention of the information. Participants were then instructed to open the study materials, revealing group assignment. Participants were asked if they had previously opened their materials accidentally (N = 8; <3%) and were then required to enter a group and personal code, contained in the sealed study materials. This filtered them to a short video regarding how to complete the study. Based on the design of Barnes et al. (2023), all placebo-treated participants were instructed to take one placebo pill each day, for 10 days, starting on the subsequent day. These participants were asked to set a reminder on their phone to take the pills at a set time. Those in the NTC group were told about the importance of control groups in research and instructed to live their lives as usual. Finally, all participants rated their expected improvement over the next 5 days and completed a reCAPTCHA (bot) check. Consistent with previous research (e.g. Barnes et al., 2023; El Brihi et al., 2019; Guevarra et al., 2024; Mills et al., 2023), expectancies are therefore post-randomisation measures. Completion of the Baseline survey triggered an automated process where participants were sent a Follow-Up survey on Day 5, which in turn triggered a similar survey on Day 10. Embedded data was carried forward with each survey and used to present dynamic graphs of any health improvement to those in the OLP-Feedback group via the Chart.js package for JavaScript. Follow-Up surveys took ~10 minutes to complete and consisted of the items regarding perceived improvement (OLP-treated participants only), primary outcomes, adherence, feedback (OLP-Feedback participants only) and expectations for health improvements over the next 5 days.
Statistical analyses
Pre-registered factorial analysis, controlling for Baseline scores, was conducted on the primary outcomes (each separately). As measured variables and their residuals were found to significantly depart from normality, this took the form of robust linear mixed effects models with participant-level random intercepts. This approach was selected to reduce the influence of outliers and non-normal error distributions on fixed and random effect estimates, which can otherwise bias results in standard LMMs. Models were run with the rlmer function from the robustlmm package (Koller, 2016). Satterthwaite approximations of degrees of freedom (e.g. Geniole et al., 2019; Luke, 2017) were calculated via the sjPlot package (Lüdecke, 2024) to assess significance. Pre-registered orthogonal contrasts in the model were: (1) OLP Contrast (NTC vs both OLP-treated groups); (2) Feedback Contrast (OLP-Feedback vs OLP-Standard). The OLP Contrast was not expected to interact with time (T1-post vs T2-post). The Feedback Contrast was, with differences between the two OLP groups expected at T2-post (after feedback delivery). Expectations regarding health improvement at each time-point were analysed via the rlm function of the MASS package (Venables and Ripley, 2013), using default Huber weightings. Wald’s test of significance was calculated via the f.robftest function from sfsmisc (Maechler, 2017). The OLP and Feedback contrasts were included in these models, with the hypothesis that the former would not differ across time-points (a lasting effect of OLP information on expectations), while the latter would be statistically significant after feedback delivery (Time-1 and Time-2 Post). Mediation, investigating the role of expectations in driving differences in significant OLP and Feedback contrasts was pre-registered. Robust mediation was performed with the robmed package (Alfons et al., 2022).
A power analysis was conducted on pilot data using a similar design without feedback (Cohen’s f = 0.185; Cohen’s d = 0.370). Based on this, a total sample size of N = 285 (N = 95 per-group; alpha = 0.05; power = 80%) was estimated. All analyses were performed using R (version 4.3.3). An alpha level of 0.05 was used for all tests and pre-planned orthogonal contrasts are reported uncorrected. Estimated marginal means, calculated via the emmeans package (Length, 2024) are reported with 95% CIs (asymp.LCL, asump.UCL).
Results
Baseline measures and manipulation checks
Baseline demographics and primary outcomes
Descriptive statistics regarding demographic information (by sample and group) are contained in Supplemental Materials 7. Participants were most likely to identify as female (N = 211; 72%), white (N = 208, 71%), have English as a first language (N = 251; 86%), and reside in New South Wales (N = 156; 53%). On average, participants were 37 years of age (range 18–70). Baseline characteristics can be found in Supplemental Materials 8.
Attention to study videos
All participants were asked to answer five questions about the placebo effect after the informational videos. A minority (8%) answered one or more incorrectly (NTC = 10; OLP-Standard = 9; OLP-Feedback = 5), suggesting that participants were generally attentive.
Numbers receiving feedback (OLP-Feedback only)
Ten participants (11%) did not receive feedback at T1-Post (i.e. did not show any improvement – slightly more than our 4%–10% pre-registered estimate). Participants were most likely to receive feedback for two outcomes (N = 35; 38%) followed by all three (N = 32; 35%). They were most likely to see feedback regarding physical symptoms (SHC: N = 71; M Change Score = 8.54), negative emotions (DASS: N = 61; M Change Score = 17.80), and then sleep quality (ISI: N = 49; M Change Score = 3.90). At T2-Post, five participants did not receive any feedback (5%), the remainder were most likely to see feedback for all three outcomes (N = 37; 40%) followed by two (N = 32; 35%). Histograms and descriptive statistics in Supplemental Materials 9.
Open-label placebo effects
Psychological wellbeing: Negative emotions
As depicted in Figure 2, the contrast comparing OLP (M = 22.49, SE = 0.70, 95% CI [21.11, 23.86]) to NTC (M = 25.75, SE = 1.01, 95% CI [23.78, 27.72]) was statistically significant (estimate = −2.18, p = 0.008, 95% CI [−3.78, −0.57]) and did not vary over time (estimate = −0.29, p = 0.351, 95% CI[−0.90, 0.32]). Among OLP-treated participants, there was no statistically significant main effect of Feedback (estimate = 0.24, p = 0.733, 95% CI [−1.14, 1.62]) and no expected interaction with time (estimate = −0.32, p = 0.238, 95% CI[−0.84, 0.21]).
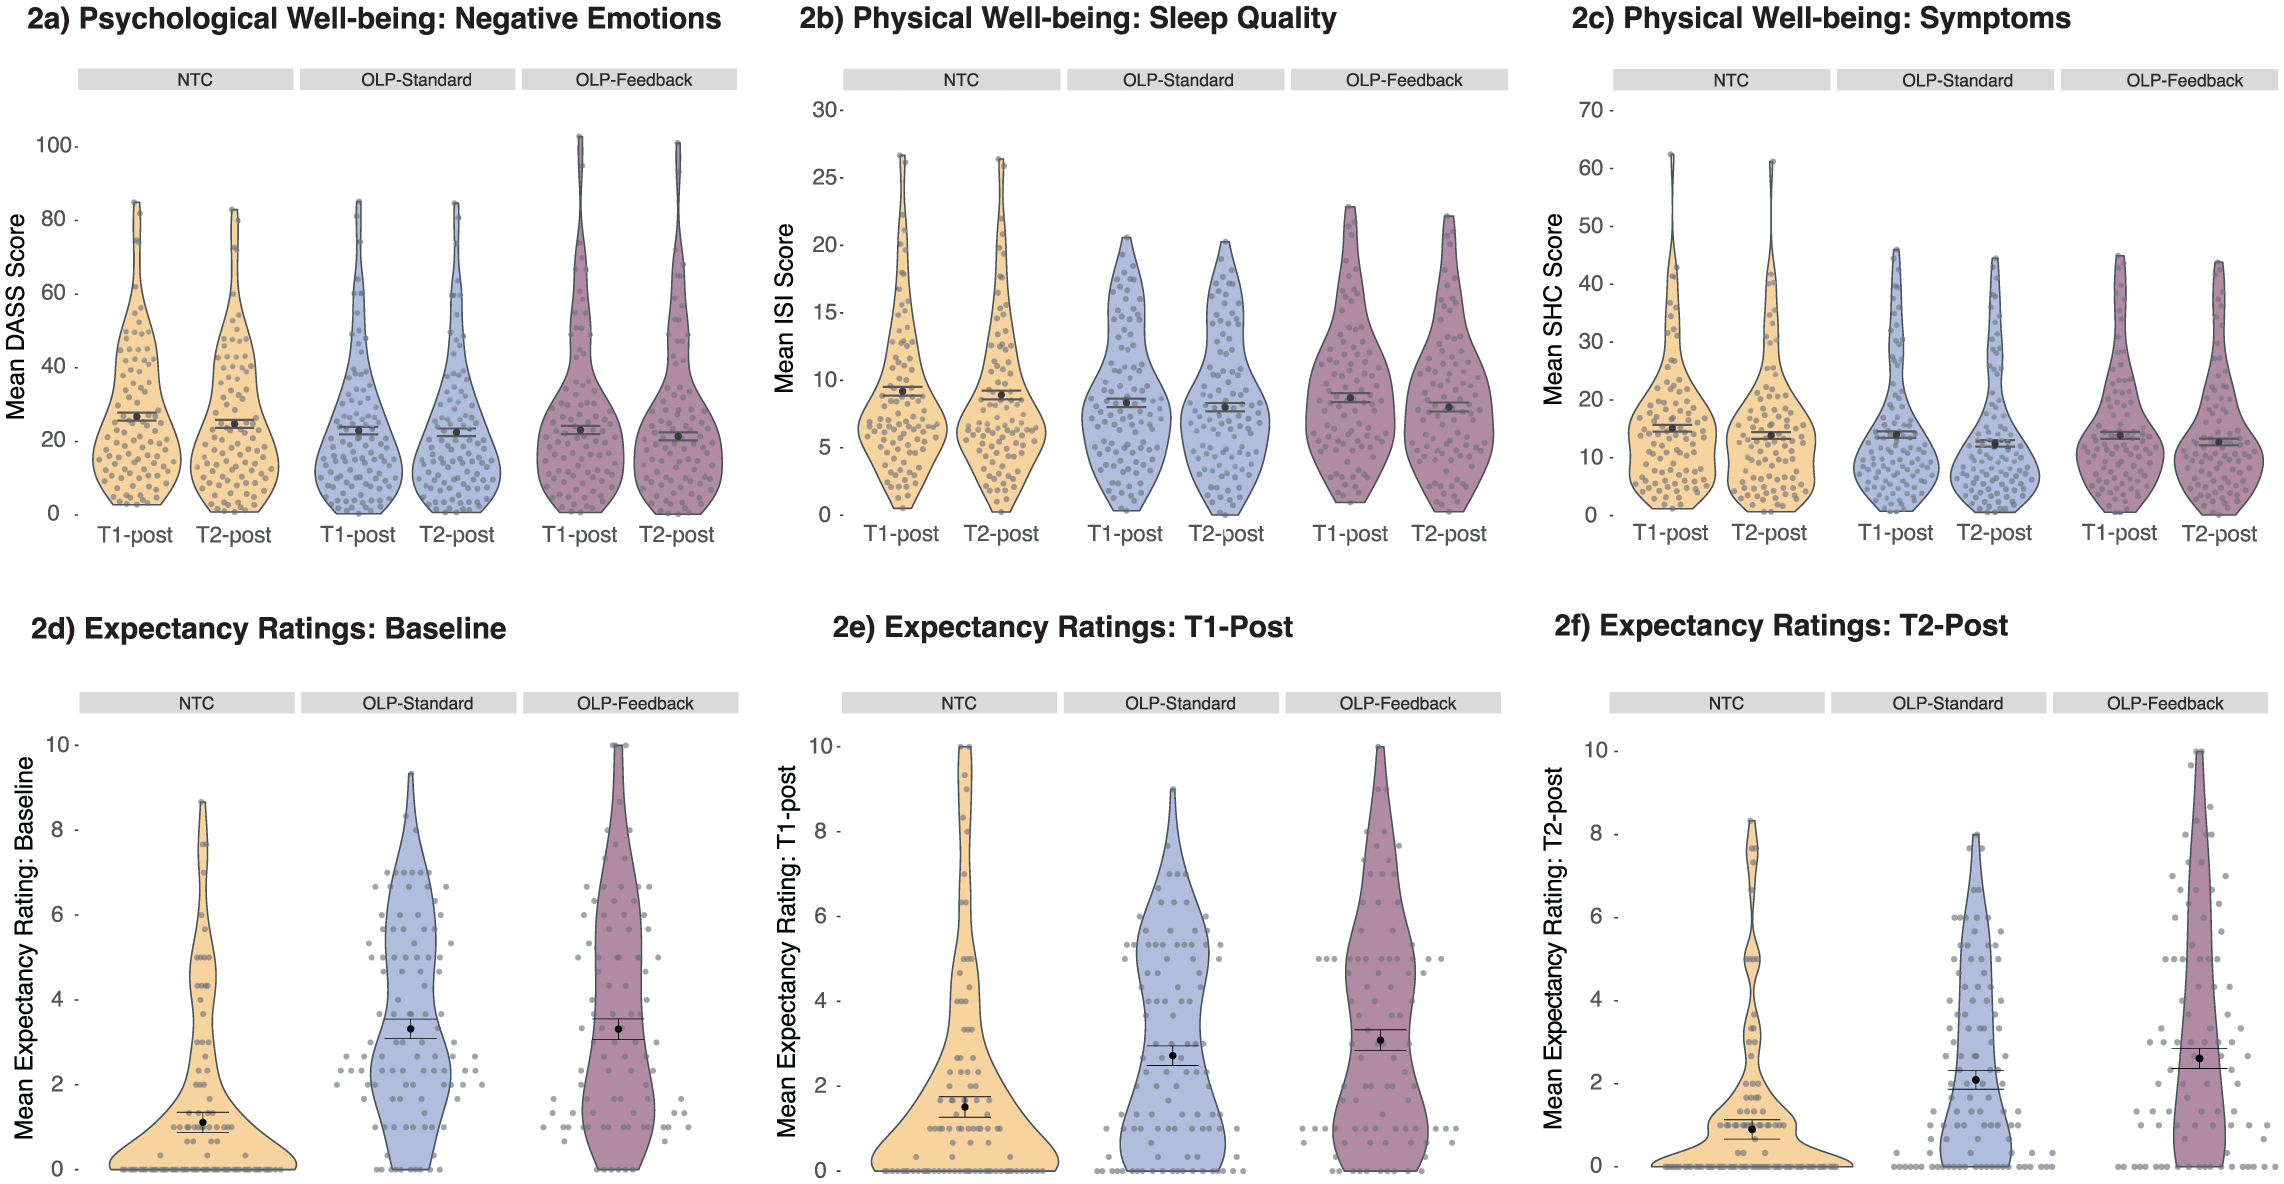
Model estimated values regarding the primary outcomes and expectations. Error bars represent ±1 SEM.
Physical wellbeing: Sleep quality
The OLP (M = 8.27, SE = 0.21, 95% CI [7.86, 8.67]) versus NTC (M = 9.05, SE = 0.30, 95% CI [8.47, 9.63]) contrast was significant (estimate = −0.52, p = 0.030, 95% CI [−0.99, −0.05]) and did not vary significantly over time (estimate = 0.08, p = 0.496, 95% CI[−0.15, 0.30]). There was no statistically significant effect of Feedback (estimate = −0.10, p = 0.628, 95% CI[−0.50, 0.30]), and no significant interaction between Feedback and time (estimate = −0.09, p = 0.349, 95% CI[−0.29, 0.10]).
Physical wellbeing: Symptoms
There was no statistically significant OLP effect (M = 13.28, SE = 0.38, 95% CI [12.54, 14.02]) relative to NTC (M = 14.50, SE = 0.54, 95% CI [13.44, 15.56]) in physical symptoms (estimate = −0.81, p = 0.065, 95% CI [−1.68, 0.05]). There was also no statistically significant effect of Feedback and no statistically significant interactions with time (all ps > 0.05). Full statistics regarding primary outcomes in Supplemental Materials 10.
Outcome expectations
Expectations regarding improvement in negative emotions, sleep quality and physical symptoms significantly correlated: Baseline (rs 0.89–0.90, ps < 0.001); T1-Post (rs 0.83–0.87, ps < 0.001); T2-Post (rs 0.88–0.91, ps < 0.001). Expectations across the three measures were averaged in accordance with the pre-registered stats plan. We note that two participants had missing expectations data at T2-Post. At all timepoints, there was a significant OLP contrast (Baseline: B = 1.47, t(290) = 7.52, p < 0.001 | T1-Post: B = 0.93, t(290) = 4.72, p < 0.001 | T2-Post: B = 0.97, t(288) = 5.07, p < 0.001). The largest difference in Expectations between OLP-Standard (M = 2.09, SE = 0.22, 95% CI [1.65, 2.53]) and OLP-Feedback (M = 2.61, SE = 0.24, 95% CI [2.14, 3.08]) occurred at T2-Post, but did not reach statistical significance (p = 0.120). Expectations are presented in Figure 2, with participants demonstrating low scores on average. Full statistics are included in Supplemental Materials 11.
Perceived improvement and attribution
Similar results were reflected in the single-item perceived improvement measure, where an OLP effect was found across T1- and T2-Post (ps < 0.001). No statistically significant effect of the Feedback contrast was found, neither were those assigned to OLP-Feedback more likely to attribute any improvement to the pills than the OLP-Standard group (ps > 0.05). See Supplemental Materials 12.
Mediation analysis
Analysis tested the mediatory role of expectations on the OLP-effect (OLP-treated participants vs NTC). Baseline primary outcomes formed covariates in the model. Expectancy and baseline scores (mediators and covariates) were standardised.
When the mediating effect of baseline expectations on the primary outcomes at T1-Post were analysed, there was no evidence for a statistically significant indirect effect: Negative emotions (95% CI [−1.19, 0.25]); sleep quality (95% CI [−0.20, 0.29]); physical symptoms (95% CI [−0.54, 0.19]). However, expectations at T1-Post were found to mediate the effect of OLP treatment on the primary outcomes measured at T2-Post, confirming
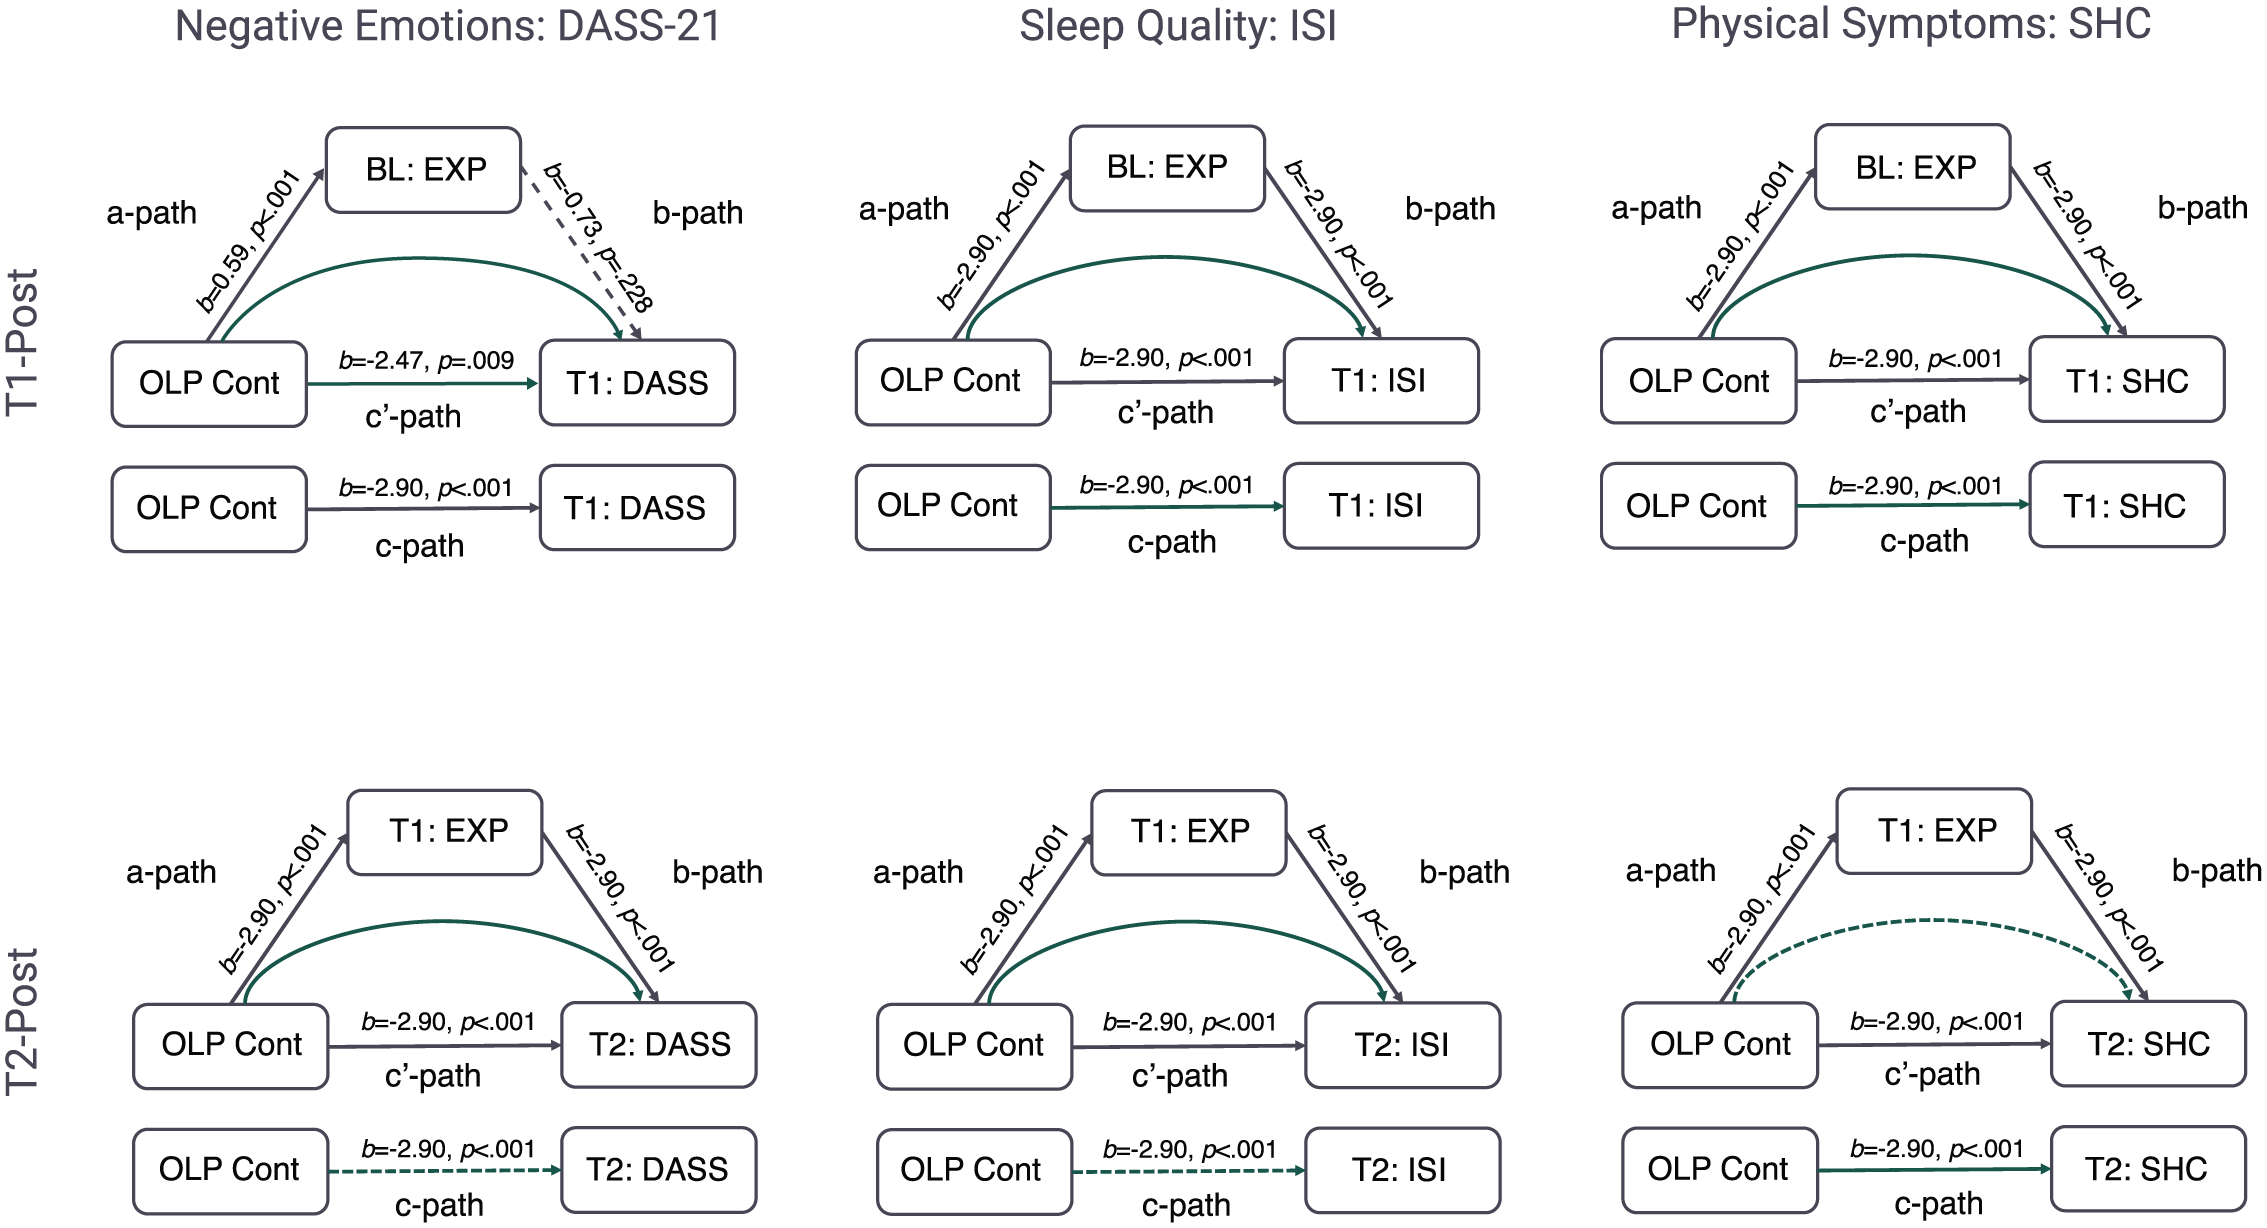
Mediation results, where filled lines represent statistically significant pathways, dashed lines represent non-significant pathways, and curved lines represent the indirect effect of OLP treatment on the primary outcome through expectancies.
Discussion
The present study investigated the effect of OLP administration with and without tailored feedback on physical and psychological wellbeing. Three key results were observed: (1) there was a small but significant OLP effect in negative emotions and sleep quality, demonstrating that OLP effects can be generated in an automated fashion without any experimenter contact; (2) tailored feedback did not enhance the OLP effect to a statistically significant level despite most OLP-treated participants experiencing some improvement; (3) expectations at mid-point mediated the OLP effect at the end of the study, but baseline expectations (post-randomisation) did not mediate the effect at midpoint (i.e. expectations appeared to be updated over time).
The first result provides the basis for testing the effect of feedback and expectancy effects. The presence of an OLP effect is in keeping with other studies that have employed online paradigms (Buergler et al., 2023; Guevarra et al., 2024). The novelty is that participants had no contact with research personnel and remained blind to treatment allocation until after the baseline measurement. Expectancy effects were therefore isolated from any positive effect of patient-practitioner interaction (Gruszka et al., 2019). We note, however, that differences between groups were small, which is perhaps not unexpected given the online nature of the paradigm. In terms of practical thresholds, there was a mean difference of 25.6 (NTC) to 22.5 (OLP) points for the total scale of the DASS-21. Thresholds for this total scale range from 21 to 25 for moderate severity, to 26–29 for severe (Lovibond and Lovibond, 1995). As such, the OLP group fell within, and NTC group just over, the upper threshold of the moderate bracket. The approximated effect size calculated from the adjusted means (Cohen’s d = 0.33) was also small, equating to 62.9% of the OLP group falling below the mean of the control group (Cohen’s U3). With respect to sleep quality, means of 8.27 (OLP) and 9.05 (NTC) placed both groups in the sub-threshold insomnia bracket (range 8–14), with a small approximated effect size (Cohen’s d = 0.26), comparable to 60.4% of the OLP group falling below the mean of the control. Previous research concerning the ISI has suggested either a −8.4 (Morin et al., 2011) or −6 point change (Yang et al., 2009) to be clinically meaningful. Overall, therefore, the present paradigm created small shifts in physical and psychological wellbeing.
As a point of comparison, lab-based studies employing the same outcomes and OLP rationale found medium (ηp2 = 0.08) to large (ηp2 = 0.14) effects with respect to both the DASS-21 and the ISI (Barnes et al., 2023; El Brihi et al., 2019). Automated procedures may therefore attenuate the OLP effect. Future research is needed to determine whether this is due to a lack of interpersonal interaction (Barnes et al., 2024; Howe et al., 2019) or increased variability in the data (Gosling et al., 2004). While the differences observed in the present study may not be clinically significant, the primary aim was to develop a methodology through which to explore the underlying mechanisms of the OLP effect. The paradigm was therefore successful in generating a pre-requisite OLP effect.
Despite being able to induce an OLP effect, however, there was no statistical evidence for an effect of the feedback manipulation. Interestingly, the discrepancy in mean expectations for improvement between the two OLP-treated groups increased numerically over time. More frequent feedback and a longer trial duration may therefore be sufficient to induce a feedback effect in future research. The practical implication with respect to placebo-based therapy may therefore be that longer treatment periods with numerous opportunities for feedback may produce better results. However, more research is needed to establish this. Given that the present study demonstrates that OLP effects can be elicited remotely, one way this might be achieved is through methodologies such as ecological momentary assessment (EMA) that allow for multiple assessments to be made seamlessly over time (Shiffman et al., 2008). We note that across the OLP-Feedback condition, change scores from baseline were positively skewed (Supplemental Materials 9), with the largest frequency of participants showing the smallest change. Given stronger OLP effects have been observed among those with higher baseline scores (Barnes et al., 2023), recruiting sub-clinical participants with pre-existing symptoms may aid in determining whether non-deceptive feedback can enhance the OLP effect.
In the absence of a feedback effect, estimates regarding the percentage of participants experiencing some form of improvement, generated from pre-registered pilot data (4%–10%) and from the current study (5% [T2]/11% [T1]), provides practical information for experimental research based on a similar design. This may be particularly useful in conjunction with previously published estimates (Barnes et al., 2023), where ~34% of OLP-treated participants differed from control in physical symptoms (those with a baseline >20 points), ~23% in sleep quality (those with a baseline >15 points), and 43% in negative emotions (those with a baseline >13 points). Given that several OLP studies have failed to establish an OLP effect necessary to explore underlying mechanisms (e.g. Anna et al., 2019; Barnes et al., 2019; Friehs et al., 2022; Kube et al., 2020; Locher et al., 2017; Mathur et al., 2018; Meeuwis et al., 2019; Schienle and Unger, 2021), a set of standardised procedures, measures and thresholds are of general use to the field.
Finally, theoretical differences in the role of expectations in driving OLP and deceptive placebo effects have been proposed (Haas et al., 2022; Kaptchuk et al., 2020). It was hypothesised that expectations would become a stronger predictor of the OLP effect over time, reconciling OLP research with broader theories of the placebo effect. This hypothesis was supported. The current paradigm was able to generate group-level shifts in expectations based on the manipulation employed that lasted from the delivery of the OLP instructions to the end of the study (i.e., 10 days). On a practical level, however, patient OLP expectations at baseline may be a poor predictor of OLP outcomes. To the best of our knowledge, this is the first study to measure expectations at multiple timepoints using an ecologically valid take-home paradigm. At the individual level, expectations were found to significantly mediate the overall OLP effect only once some prior experience with the treatment had been acquired. These results are consistent with current Bayesian (Ongaro and Kaptchuk, 2019), computational (Jepma et al., 2018), and statistical (Barnes et al., 2021) models of the placebo effect, where expectations and outcomes are updated. This resolves some of the discrepancies observed in the literature regarding the underlying mechanisms of the OLP effect. Future studies may therefore wish to explore secondary features of these expectations, such as uncertainty or confidence, as well as the perception of tangible baseline symptoms, to determine whether these features in conjunction can account for the initial experience of the OLP effect. These metrics could then potentially be used to make predictions about clinical outcomes.
More generally, results demonstrate that the way expectations are measured and analysed can alter the results obtained. Researchers may therefore consider whether they are interested in group-level changes in expectations (for example, if running a manipulation check to determine whether the information delivered with OLP treatment has been successful) or whether they are more interested in individual differences in expectations and their function. With respect to the latter, taking multiple measurements over time is likely to produce robust results.
There are several strengths to the present study, including the recruitment of a large sample from across Australia, the ability to isolate expectations from interpersonal communication and a naturalistic paradigm where participants took placebo pills in their own home. However, limitations must be noted. First, despite numerical differences between the OLP-Standard and OLP-Feedback groups increasing over time, it is possible that statistical information included as tailored feedback is not sufficient to significantly increase the OLP effect even at longer durations due to issues in interpreting this type of numerical information. Future studies may therefore attempt to reinforce the information. This might include stating when participants have shifted between brackets on an outcome measure or gamifying the experience to include badges or rewards for improvement. This type of addition to the design would help to clarify whether the salience of the feedback is an important feature of the manipulation. Additionally, participants in the current study were left to their own devices to read the information regarding improvement. As such, it cannot be guaranteed that they attended to it. This was an active choice as participants would attend at their own discretion if such an intervention were employed in practice. However, including ways to ensure participants were engaged, such as including checkboxes, tasks, or mouse tracking technology, may ultimately reduce noise in the data. Second, the study only measured self-report outcomes, which may introduce bias. The automated paradigm and blinding prior to randomisation served to reduce this bias. Furthermore, recent studies demonstrate that self-report OLP effects are consistent with objective neurophysiological measures, and therefore appear not to simply be a product of biased responding (Ashar et al., 2024; Guevarra et al., 2020; Schienle et al., 2022). However, these focused on healthy participants employed a time-limited lab-based task concerning affective facial processing (Guevarra et al., 2020; Schienle et al., 2022). While these controlled studies are essential for demonstrating changes in neurophysiological outcomes, they lack some ecological validity with respect to how OLP treatment might be deployed. Combining the present methodology with objective measures, such as actigraphy to assess sleep quality, for example, would add to this literature. Finally, the study was advertised as examining OLPs and wellbeing. This may have biased results, such as increasing disappointment in the control group. An exploratory item (‘How did you feel about being randomly assigned to the control group?’; 0 = very disappointed–100 = very happy; M = 62, SD = 30) indicated that control participants were, on average, more happy than disappointed. However, future studies should test and control for wording effects on OLP outcomes.
In summary, the results presented here support previous research (Barnes et al., 2023; El Brihi et al., 2019; Guevarra et al., 2020, 2024; Hahn et al., 2022; Schaefer et al., 2019), demonstrating that OLP administration can increase physical and psychological wellbeing. Novel results demonstrate that this can be achieved in a completely automated fashion. Finally, repeated measurement of OLP-related expectations demonstrated that these measures become more predictive of the OLP effect at an individual level over time. This reconciles some of the inconsistencies observed in the literature and suggests that, like deceptive placebo effects, expectations are a plausible mechanism associated with the OLP effect.
Supplemental Material
sj-pdf-1-hpq-10.1177_13591053251414005 – Supplemental material for The role of expectations and tailored feedback on the open-label Placebo effect
Supplemental material, sj-pdf-1-hpq-10.1177_13591053251414005 for The role of expectations and tailored feedback on the open-label Placebo effect by Kirsten Barnes and Kate Faasse in Journal of Health Psychology
Footnotes
Ethical considerations
Approval granted by the UNSW Human Research Ethics Advisory Panel-C (behavioural sciences; File 3802).
Consent to participate
All participants gave digital written consent.
Consent for publication
Consent for publication is not applicable to this article as it does not contain any identifiable data.
Author contributions
Conceptualisation (K.B., K.F.); Methodology (K.B., K.F.); Software (K.B.); Validation (K.B.); Formal analysis (K.B.); Investigation (K.B.); Resources (K.B.); Data Curation (K.B.); Writing – Original Draft (K.B.); Writing – Review & Editing (K.B., K.F.); Visualisation (K.B.); Supervision (K.F.); Project administration (K.B.); Funding acquisition (K.F.)
Funding
The authors received no financial support for the research, authorship, and/or publication of this article.
Declaration of conflicting interests
The authors declared no potential conflicts of interest with respect to the research, authorship, and/or publication of this article.
Supplemental material
Supplemental material for this article is available online.