
Abstract
Living with type 1 diabetes (T1D) can significantly affect emotional well-being, often involving fatigue, diabetes-related distress, and depressive symptoms. This study examined relationships between fatigue, diabetes distress, and emotional well-being in adults with T1D, employing network analysis. We used baseline data from a survey of a web-based, self-guided mental health intervention. Participants were recruited via diabetes organization websites, social media, and healthcare professionals. Fatigue (CIS-F), diabetes distress (PAID-11), and emotional well-being (WHO-5) were measured with validated questionnaires. Network analysis examined symptom-level connections within and between constructs. Among 319 participants (mean age = 43.0, 64.6% female), most reported severe fatigue (53.9%), elevated diabetes distress (71.2%), and low emotional well-being (58.9%). Strong internal connections were found within each construct, but with few links between constructs. No consistent connections emerged between fatigue and diabetes distress. Fatigue, diabetes distress, and emotional well-being appear to function largely independently in the current sample of adults with T1D.
Keywords
Introduction
Living with type 1 diabetes (T1D) can have a significant impact on emotional well-being, with severe fatigue, symptoms of depression, and diabetes-specific distress having been shown to be prevalent (Jensen et al., 2017; Pouwer et al., 2020; Skinner et al., 2020). These psychological symptoms often co-occur. For instance, studies indicate that about 5%–15% of people experience both elevated depressive symptoms (or low emotional well-being) and diabetes distress (Skinner et al., 2020; Snoek et al., 2015). Diabetes distress refers to the worries, concerns, and fears associated with living with diabetes. Although it is moderately to strongly correlated with depressive symptoms (Snoek et al., 2015), diabetes distress is a distinct psychological construct. It is also a heterogeneous construct, with previous studies identifying subdomains such as emotional problems, treatment problems, food problems, and lack of social support (Snoek et al., 2000, 2015). Individual experiences may vary: some are overwhelmed by the daily efforts required for glucose management, while others mainly worry about long-term complications.
Diabetes distress and depressive symptoms (or low emotional well-being) are often measured using total scores from validated questionnaires, which measure overall severity and show high internal consistency (Hajos et al., 2013; Snoek et al., 2000, 2015). For instance, the five-item “World Health Organization Well-being Index” (WHO-5) is a recommended and validated tool to assess emotional well-being, and it can also serve as a screener for likely depression in people with and without diabetes (Hajos et al., 2013).
Fatigue is less researched among individuals with T1D, despite being common in both the general population and even more in people with chronic diseases (Corfield et al., 2016; Goërtz et al., 2021). There is a lack of a standardized definition of fatigue (Jensen et al., 2017, 2018). The Oxford Dictionary defines fatigue as “Physical or mental weariness resulting from exertion; extreme tiredness or exhaustion” (Oxford English Dictionary, 2025), but recent literature recognizes it to be a multidimensional experience, with physical, mental, cognitive, and emotional components (Corfield et al., 2016). Fatigue seems to be a continuum in which individual symptoms may vary in severity and duration. The pooled prevalence of fatigue among individuals with T1D is 44% (Romadlon et al., 2022). Severe fatigue and chronic fatigue are reported by approximately 40% of adults with T1D (Goedendorp et al., 2014), with chronic fatigue defined as severe fatigue lasting at least 6 months according to self-report (Goërtz et al., 2021). Symptoms of Fatigue in T1D are linked to anxiety, depression, and sleep disturbances, and negatively impact diabetes self-management, complicating blood glucose monitoring and insulin administration (Jensen et al., 2018).
Fatigue and depression often co-occur, both in the general population (Corfield et al., 2016) and in those with T1D (Goërtz et al., 2021; Jensen et al., 2018). Symptoms of depression, for instance, are found to be contributors to fatigue, which reinforces the connection between these two constructs (Griggs and Morris, 2018). At the same time, fatigue is also a symptom of a depressive disorder, so there is overlap between these constructs (American Psychiatric Association, 2013). The relationship between fatigue and diabetes-specific distress is less clear. Approximately 40% of adults with T1D report severe fatigue as a distressing symptom (2, 7, 8), highlighting the need for further research in this area.
Given the heterogeneity of most psychological constructs, it is important to understand how individual symptoms interact. Individuals may show different scores on each symptom, and network analysis can help with symptom-level investigation, which can help to uncover the variability within a construct. For instance, a tightly connected network with many strong connections among symptoms is considered a “riskier” network because activation of one symptom can quickly “spread” to other symptoms, increasing the risk of more chronic symptoms over time (van Borkulo et al., 2015). Advantages of network analysis compared to correlation or regression analysis include that the network approach accounts for interactions across multiple symptoms simultaneously. Additionally, it can visualize a complex network without distinguishing between dependent and independent variables, it can show clusters of symptoms that interact more strongly together, and it can identify the most influential symptoms in the network. Identifying the most influential symptoms within a network could be relevant for knowing which symptom to target first in treatment for the greatest therapeutic effect (Fried et al., 2014).
McInerney et al. (2022) were the first to explore interactions between individual symptoms of diabetes distress, depression, and anxiety in adults with type 2 diabetes using network analysis (McInerney et al., 2022). They found that while anxiety and depressive symptoms clustered together with several bridging connections, diabetes distress appeared as a separate cluster. Within the diabetes distress cluster, regimen-related and physician-related diabetes-specific problems were identified as the most influential factors contributing to diabetes distress (McInerney et al., 2022), and similar results were found in a study of Zu et al. (2024) and Zhang et al. (2024). To date, no study has applied a network approach to T1D that includes symptoms of fatigue. This study aims to investigate the relationships between individual symptoms of fatigue, diabetes distress, and emotional well-being in adults living with T1D.
Methods
Participants
Data were derived from an earlier study that explored the uptake and usage of a web-based self-guided intervention for adults with T1D to support mental health (Embaye et al., 2024). During the study, the intervention was made freely available to adults with T1D in the Netherlands between March 2021 and December 2022. Participants were eligible for the user-profile study if they were 18 years or older, had T1D, and were Dutch-speaking. The study sample was comprised of 343 participants filling out baseline questions, and 319 participants had complete data on fatigue, diabetes distress, and emotional well-being.
Data collection
Participants were recruited through various channels, including websites of diabetes organizations in the Netherlands, social media platforms such as Facebook and Instagram, and via healthcare professionals within our network. Interested individuals were directed to the study website, which provided detailed study information.
Users of the digital application could volunteer to participate in a user-profile study, which required filling out a set of baseline questionnaires. Informed consent was provided online at the start of the questionnaire. The questionnaires were sent out via the secured survey platform Castor Electronic Data Capture (EDC). The study protocol was approved by the Medical Ethics Committee of VU University Medical Centre (2021.0007) on 20-2-2021.
Measures
The baseline survey included self-reported sociodemographic questions (e.g. age, sex, education, and living status), time of diabetes diagnosis, current psychological treatment, and validated measures of fatigue, diabetes distress, and emotional well-being.
Fatigue was measured using the “Checklist Individual Strength” (CIS) questionnaire, a frequently used tool for the assessment of fatigue that has been validated in the Netherlands among adults with T1D (Worm-Smeitink et al., 2017). The CIS measures four dimensions of fatigue: fatigue severity, concentration, motivation, and activity. In this study, the Fatigue subscale of the CIS questionnaire was used to assess fatigue severity (Vercoulen et al., 1999), reflecting the level of subjective fatigue over the past 2 weeks. This subscale consists of eight items. With each statement, participants have to indicate a score from 1 to 7, indicating either “yes, that is true” or “no, that is not true.” A CIS-fatigue score of 35 or higher (range 8–56) indicates severe fatigue. In the present sample, internal consistency of the CIS was good (α = 0.84). For items 1, 2, 4, 6, and 7, a higher score indicates fewer symptoms of fatigue, whereas for items 3, 5, and 8, a higher score indicates more symptoms of fatigue. For the network analysis, the items were used in their original format, with no rescoring applied.
Diabetes distress was measured with the 11-item version of the “Problem Areas in Diabetes” questionnaire (PAID-11; Stanulewicz et al., 2019), which assesses the current level of diabetes distress. The PAID-11 is a widely used instrument that has also been validated in Dutch (Stanulewicz et al., 2019). Participants rate the statements on a 5-point Likert scale (from 0 “not a problem” to 4 “serious problem”). Total scores range from 0 to 44, with higher scores indicating greater diabetes distress. A PAID-11 score of 18 or higher (range 0–44) suggests elevated diabetes distress. In the present sample, internal consistency of the PAID-11 was good (α = 0.90).
Emotional well-being was measured with the five-item “World Health Organization Well-being Index” (WHO-5). The WHO-5 is a positively worded self-report measure that assesses emotional state over the past 2 weeks. The questionnaire is also used as a screener for likely depression in people with diabetes (Hajos et al., 2013). The questionnaire is widely used in research and clinical settings and has been validated among Dutch adults with diabetes (Hajos et al., 2013). The WHO-5 only contains positively phrased items. Response options range from 0 (“at no time”) to 5 (“all of the time”). The total raw score, ranging from 0 to 25, is multiplied by 4 to give the final score, with 0 representing the worst imaginable well-being and 100 representing the best imaginable well-being. A WHO-5 score of less than 50 (range 0–100) indicates poor emotional well-being, which may be secondary to a depressive disorder or other etiology, and is an indication for further evaluation. In the present sample, internal consistency was good (α = 0.88).
Statistical analysis
Descriptive statistics of participants were summarized using mean and standard deviation, or frequencies and percentages in the case of categorical data. SPSS version 26.0 was used to conduct these analyses.
A network analysis was conducted with R, version 4.0.5, to analyze the relations among the variables. A network comprises nodes (variables) and edges (the relationships between the variables). The edges are learned from data. First, the data was Gaussianized data using the HUGE software package. This transformation preserves the relationships among the variables and ensures distributional assumptions of the downstream methods. To the transformed data, we fitted a regularized Gaussian graphical model with a saturated underlying network using the R software package rags2ridges (Peeters et al., 2022). We selected a regularization parameter of 0.125 using leave-one-out cross-validation, a resampling method that iteratively trains the model on all but one data point, and tests it on the excluded point. We sparsified the saturated network by means of a false discovery rate (FDR) procedure with a cut-off of 80%. We evaluated the reliability of the resulting network and re-ran the analyses 1000 times on a subsample (75%) of the data.
We summarized the results of these 1000 analyses into the selection frequency and median partial correlation of each edge. The selection frequency measures how often an edge is detected in the networks reconstructed from multiple resampled versions. If an edge appears frequently across networks reconstructed from different resamples of the data, it is more likely to represent a stable or consistent relationship. Selection frequency is usually expressed as a percentage, with a higher percentage indicating that the edge is more frequently found across the reconstructed networks and so more consistent/stable. When interpreting the results, we start with the visual result of the selection frequency. We used a cut-off (or sparseness) of 10%. A sparseness of 10% means that 10% of the possible edges in the network are missing, and thus 90% are present. The sparser the network, the fewer edges (only the most meaningful ones) are being visualized. A sparseness of 10% is a common cutoff, and this means that 10% of the edges were not visualized.
Once we knew which edges were consistent, we used the median partial correlations to detect the strength of these edges. The median partial correlation measures the strength of the edges, while controlling for the influence of all other variables in the network. It is a numerical value that can be either positive (indicating a positive relationship) or negative (indicating a negative relationship). Higher values indicate a stronger connection between two nodes (edge). The median partial correlation helps to assess how strong the consistent connections identified by the selection frequency actually are.
We also examined the presence and strength of bridges. These are symptoms that connect two constructs to each other. Bridge symptoms were identified by visual inspection.
Finally, we visualized the network using the Fruchterman-Reingold algorithm to find a layout that minimizes the number of crossing edges.
Results
Descriptive statistics
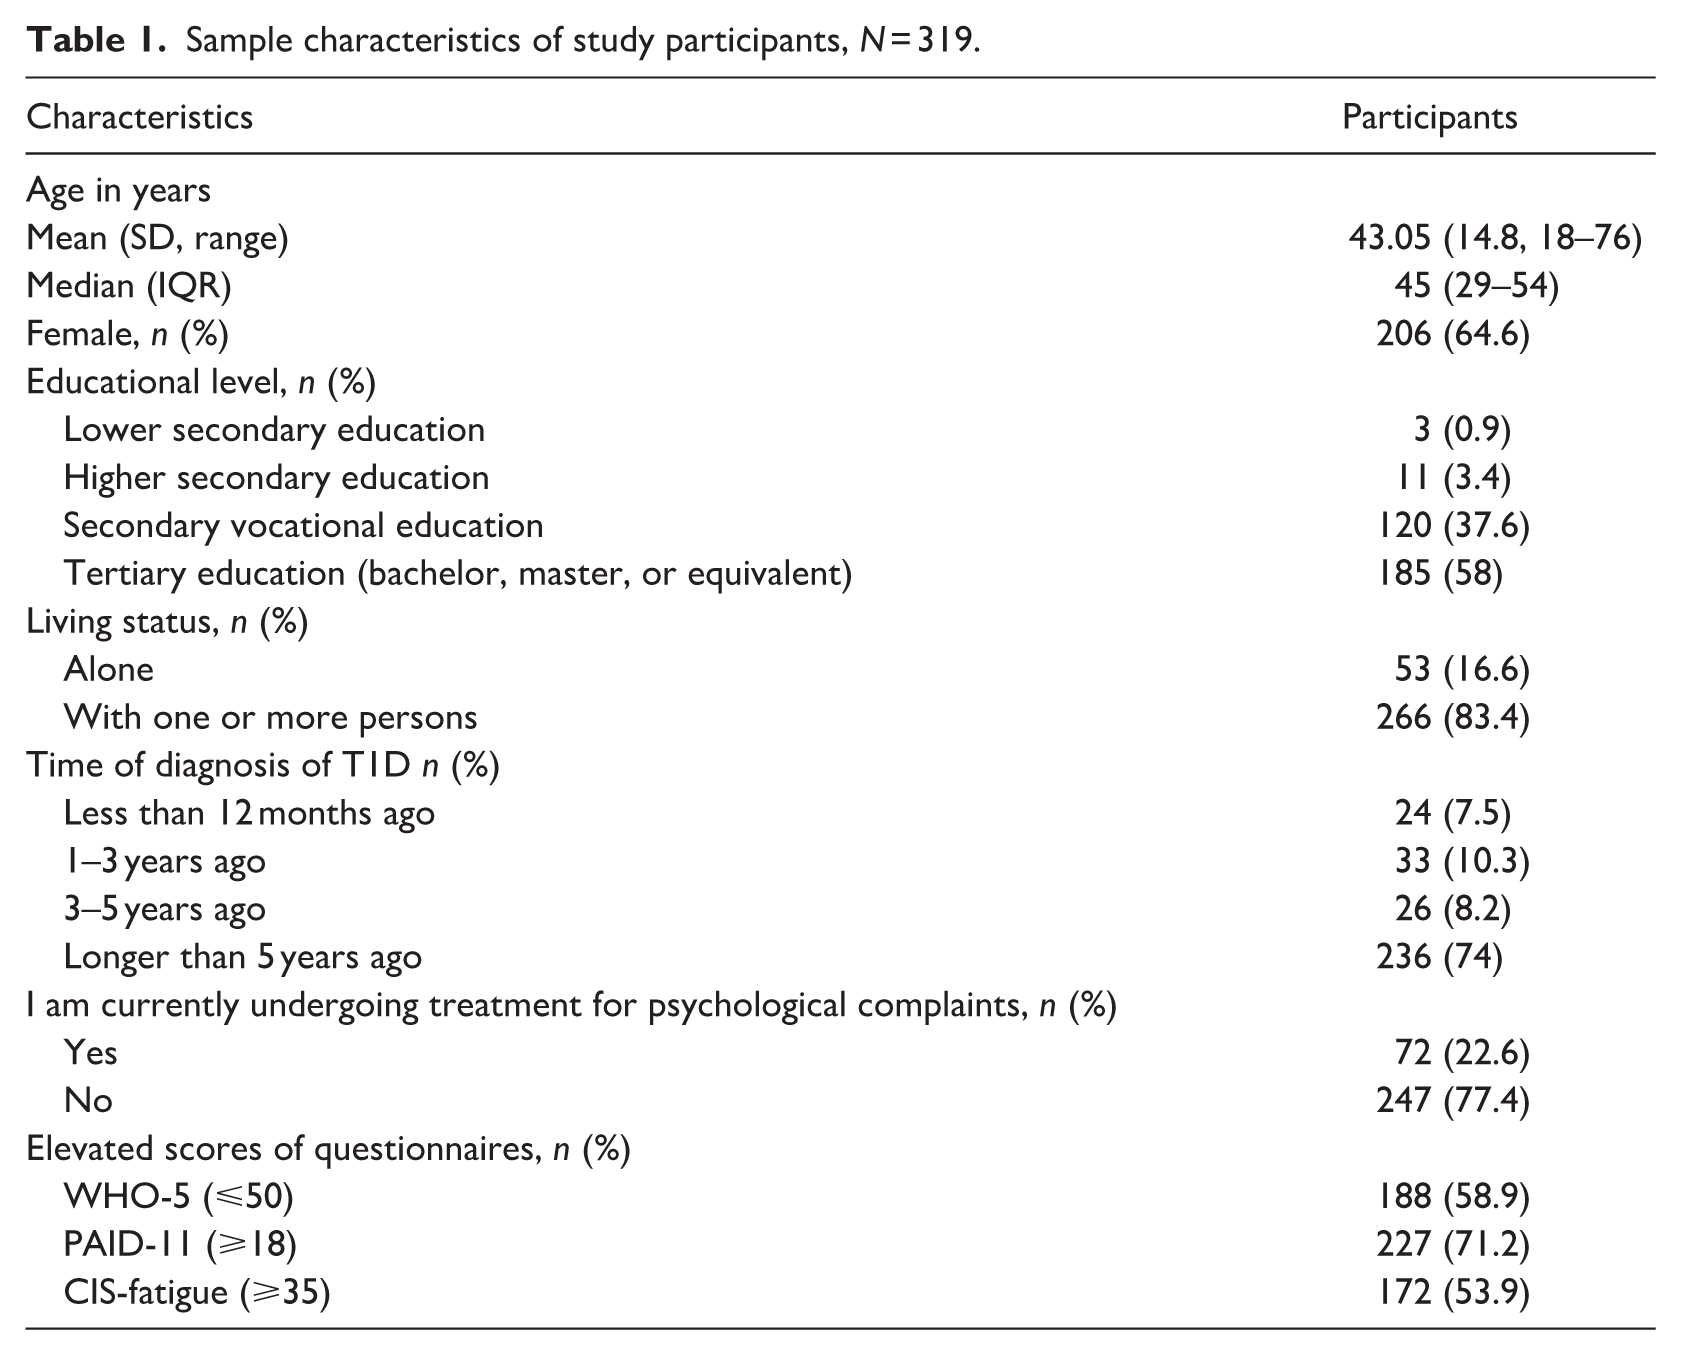
Table 1 describes the sample characteristics of study participants. Most participants were female (n = 206, 64.6%) and a majority of the participants were higher educated (n = 185, 58%). Mean age was 43 (SD 14.8; 18–76) years, with the majority having lived with T1D for over 5 years (n = 236, 74%). A total of 53.9% (n = 172) reported severe fatigue (CIS-fatigue score ⩾ 35); 71.2% (n = 227) reported elevated diabetes distress (PAID-11 score ⩾ 18), and 58.9% (N = 188 reported low emotional well-being (WHO-5 score ⩽ 50). Additionally, 22.6%% (n = 72) reported currently receiving psychological treatment.
Sample characteristics of study participants, N = 319.
Fatigue, diabetes distress, and emotional well-being network
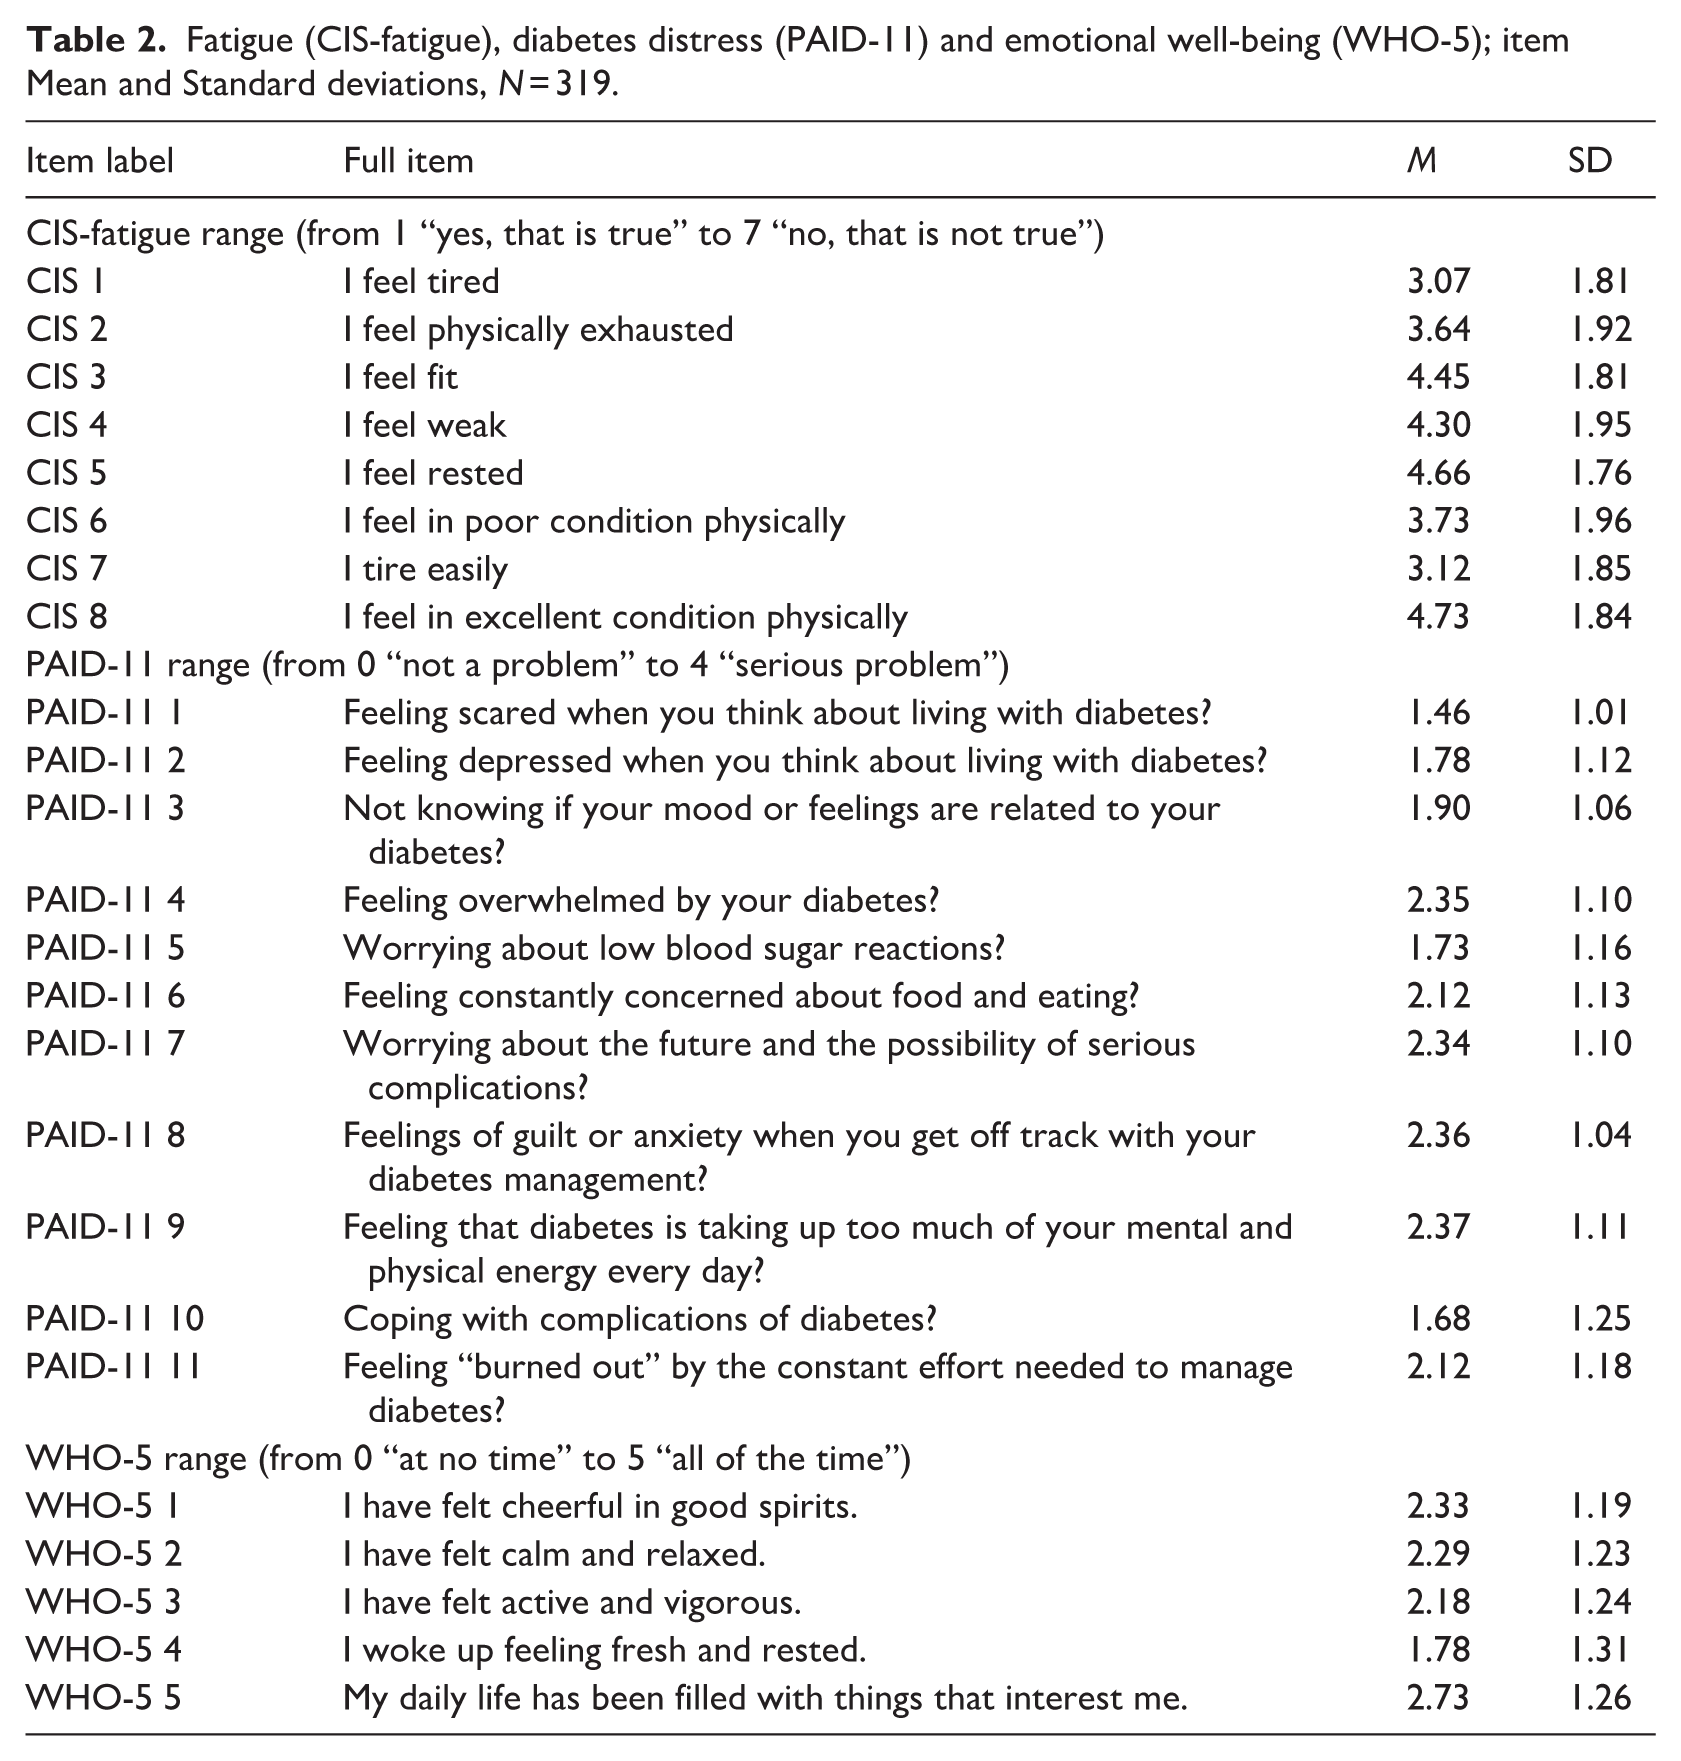
The mean and SD for each item of fatigue (CIS-fatigue subscale), diabetes distress (PAID-11) and emotional well-being (WHO-5) are presented in Table 2. Figures 1 and 2 both represent the fatigue, diabetes distress, and emotional well-being network. In both figures, only the edges that are calculated under a sparsity threshold (cutoff) of 10% are shown. Figure 1 illustrates the selection frequency, which shows the most consistent edges. Figure 2 shows the median partial correlations of all edges calculated under a sparsity threshold (cutoff) of 10%, including edges that are not visualized in Figure 1, which are therefore considered less consistent. Supplemental Table 1 provides detailed information on the strength of each edge, indicated by the median partial correlation and selection frequency. The selection frequency represents how often an association appears in the network on a scale from 0 to 1000.
Fatigue (CIS-fatigue), diabetes distress (PAID-11) and emotional well-being (WHO-5); item Mean and Standard deviations, N = 319.
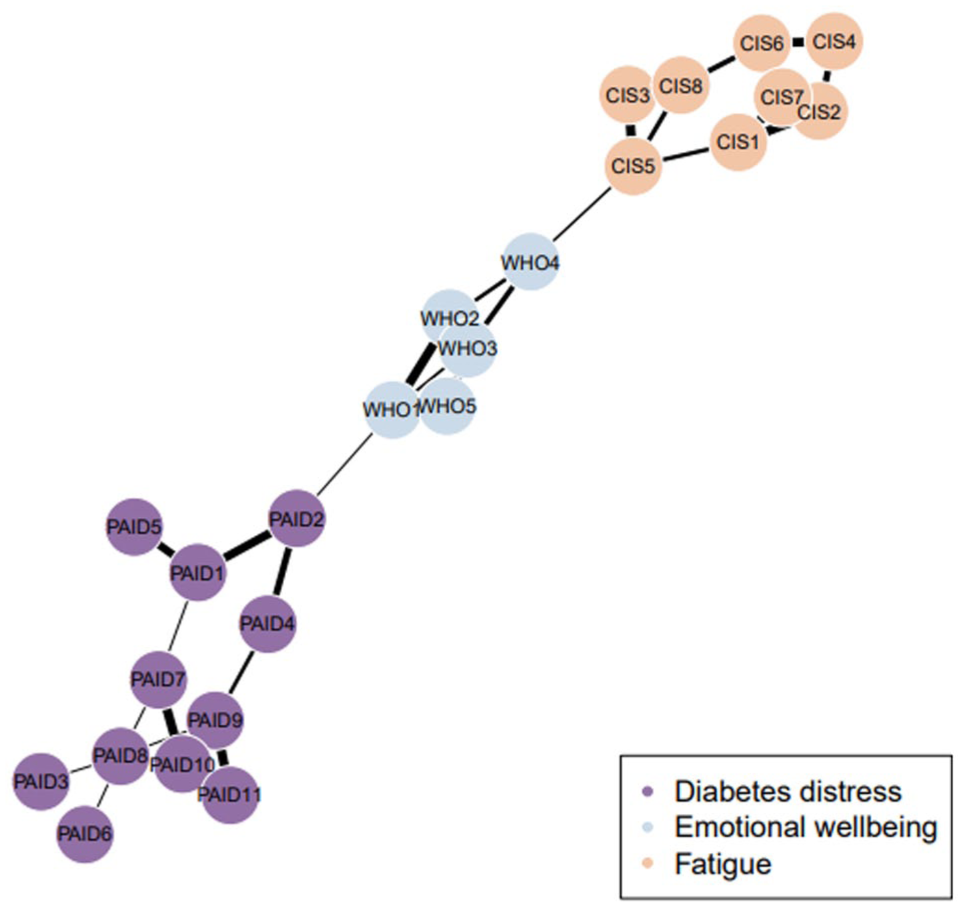
Edge selection frequency with a sparseness of 10%.
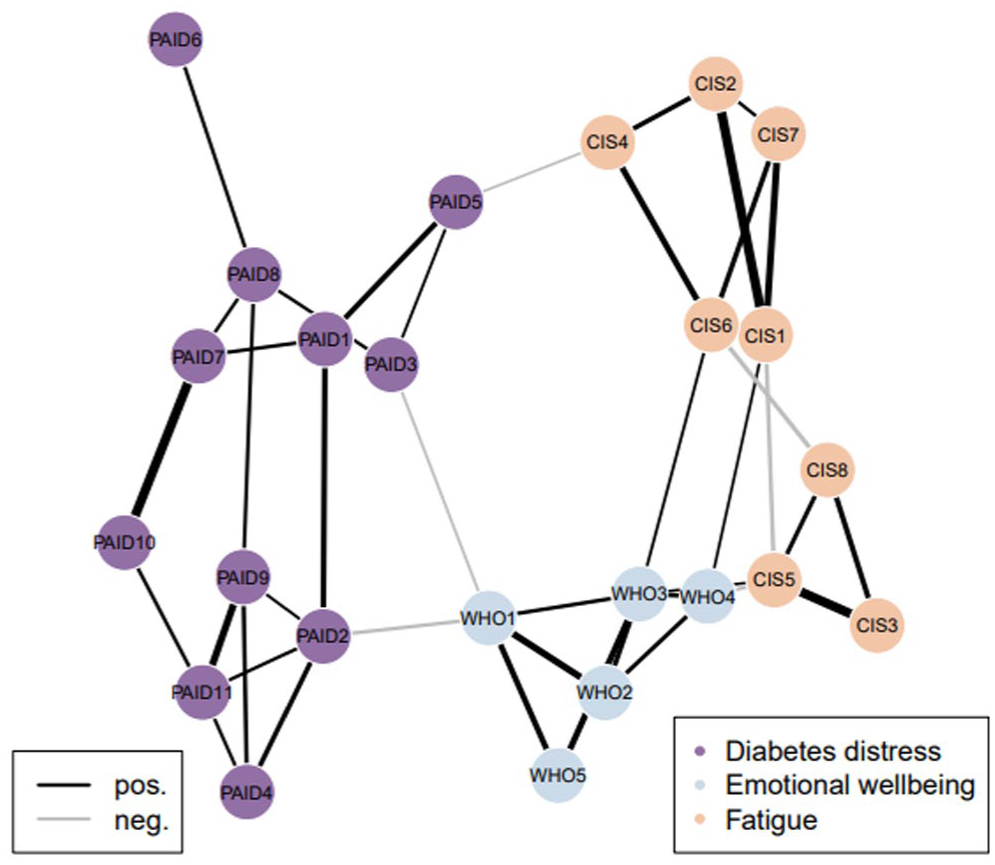
Median partial correlations with a threshold of 0.1.
When observing the selection frequency (Figure 1), relatively few edges demonstrated consistency under this level of sparseness. Within constructs, most nodes appeared connected, but some disparities were noted. In the fatigue construct (CIS-fatigue), the highest level of connectivity between nodes was observed. Notable connections included the positive edge between CIS3 (I feel fit) and CIS5 (I feel rested), with a median partial correlation of 0.35 (95% CI [0.35, 0.36]). Another significant positive connection was found between CIS1 (I feel tired) and CIS2 (I feel exhausted), with a median partial correlation of 0.36 (95% CI [0.35, 0.36]). Within the diabetes distress construct (PAID-11), the strongest connections were observed between PAID7 (worrying about the future and complications) and PAID10 (coping with complications), with a median partial correlation of 0.36 (95% CI [0.35, 0.36]). Another notable connection was between PAID9 (feeling that diabetes takes up too much mental and physical energy) and PAID11 (feeling burnt out by the effort needed to manage diabetes), which had a median partial correlation of 0.27 (95% CI [0.27, 0.27]). Conversely, some nodes, such as PAID6 (worrying about food and eating), appeared relatively isolated and did not show strong connections with other nodes. For emotional well-being (WHO-5), a few edges stood out as the strongest connections. These included the positive edge between WHO1 (feeling cheerful and in good spirits) and WHO2 (feeling calm and relaxed), with a median partial correlation of 0.26 (95% CI [0.26, 0.26]). Similarly, a positive edge was observed between WHO3 (feeling active and vigorous) and WHO5 (my daily life has been filled with things that interest me), with a median partial correlation of 0.24 (95% CI [0.23, 0.24]).
Bridges
Relatively few bridge symptoms were identified between the constructs of fatigue (CIS), diabetes distress (PAID-11), and emotional well-being (WHO-5), suggesting that these constructs appear to function somewhat independently within the network. However, some bridging connections were observed that remained consistent under the 10% sparseness threshold. One consistent connection was between WHO1 (feeling cheerful and in good spirits) and PAID2 (feeling depressed when thinking about diabetes), which exhibited a negative median partial correlation of −0.26 (95% CI [−0.26, −0.26]). This indicates that feeling more often cheerful and in good spirits is associated with feeling less often depressed when thinking about diabetes. Another consistent connection was observed between WHO4 (woke up feeling fresh and rested) and CIS5 (I feel rested), showing a negative median partial correlation of −0.14 (95% CI [−0.15, −0.14]). This indicates that feeling more often fresh and rested when waking up is associated with feeling more often rested.
Discussion
Principal findings
The findings of this study showed high connectivity within the constructs of fatigue, diabetes distress, and emotional well-being, suggesting internal consistency at the symptom level. Interestingly, certain symptoms within diabetes distress appeared more isolated, such as worries about food and nutrition (PAID6), which may represent a more distinct source of diabetes distress (Snoek et al., 2000). This supports earlier findings showing that, although diabetes distress is often assessed as a unidimensional construct using the PAID, it may encompass heterogeneous subdomains (Fisher et al., 2024; Hajos et al., 2013; Snoek et al., 2000, 2015; Stanulewicz et al., 2019).
Across the constructs of fatigue, diabetes distress, and emotional well-being, only a few associations were identified. The bridging connections were mostly found between almost similarly worded symptoms. For instance, the symptom of feeling rested (WHO4 woke up feeling fresh and rested and CIS5 I feel rested), seemed to connect emotional well-being and fatigue. This aligns with research suggesting that comorbidity between depression or emotional well-being and fatigue is partly due to overlapping symptoms, such as insomnia, hypersomnia, and poor concentration (Corfield et al., 2016). However, no other consistent bridges connected emotional well-being and fatigue, despite literature indicating a strong overall relationship between these constructs (Griggs and Morris, 2018; Zhang et al., 2023).
At the same time, existing literature emphasizes that chronic fatigue and depressive symptoms, while overlapping, may also represent distinct phenomena. A study in adults with T1D found that 31% of those with chronic fatigue did not report clinically relevant depressive symptoms, suggesting that while depression is closely linked to fatigue, it could not fully account for the presence of chronic fatigue. This highlights the overlap but yet distinct nature of chronic fatigue from depressive symptoms (Goedendorp et al., 2014).
Additionally, a bridging connection was found between WHO1 (feeling cheerful and in good spirits) and PAID2 (feeling depressed when thinking about diabetes), suggesting that improving emotional well-being may positively impact diabetes distress and vice versa. This is consistent with previous studies linking emotional well-being with diabetes distress (Snoek et al., 2015). However, notably, this is the only consistent connection that was identified between emotional well-being and diabetes distress.
Interestingly, no consistent connections were identified between fatigue and diabetes distress. This finding is in line with research on fatigue in people with chronic illnesses, including diabetes, which suggests that the mechanisms underlying severe fatigue may be largely transdiagnostic (similar for multiple chronic diseases)—or even partially generic—rather than diabetes-specific (similar for persons with and without a chronic disease; Goërtz et al., 2021). This may explain why fatigue appears to be less closely linked to diabetes distress at the symptom level. While the findings of the present study support this interpretation, longitudinal studies are needed to further explore the role of fatigue as a psychological symptom in adults with diabetes. It is however, important to note that we measured fatigue using the CIS-fatigue subscale, which primarily measures the physical aspects of fatigue and, to a lesser extent, the mental aspects of fatigue. This may partly explain the weak association with the PAID scale, which predominantly reflects the mental load of diabetes.
Similar to earlier network studies (McInerney et al., 2022; Zu et al., 2024), our results indicated that diabetes distress mostly formed a separate cluster. Diabetes distress seems to reflect the specific challenges of living with diabetes, whereas fatigue, anxiety, and depression/emotional well-being are not necessarily limited to diabetes. It is important to note that associations between these constructs might be more pronounced at the level of total scores than when examining individual symptoms or item-level data (Snoek et al., 2015).
Caution is warranted when interpreting the edge strengths because of the limited number of comparable studies available. In general, edge strengths in the present study were similar or slightly higher than those reported in other studies (Beard et al., 2016; Zhang et al., 2023, 2024; Zu et al., 2024), although they varied across specific connections. Since there are no clear standards for what constitutes a “strong” edge, these findings should be interpreted with caution and considered within the broader context of existing research (Epskamp et al., 2018).
Implications
The few bridging symptoms identified between fatigue, diabetes distress, and emotional well-being in our study suggest that the three constructs seem to function relatively independently within the network. This supports the view that they represent distinct dimensions; for instance, individuals may experience high levels of fatigue without experiencing high levels of depressive symptoms or diabetes distress and vice versa (Snoek et al., 2015). These findings may suggest that when individuals present with multiple psychological symptoms, such as fatigue and diabetes distress, symptom-specific interventions could potentially be effective. However, it is important to acknowledge the complexity of these constructs and the need for further research.
Strengths and limitations
A strength of this study is the inclusion of fatigue symptoms in the network analysis of adults with T1D. Fatigue is understudied, while it has been shown to be a prevalent and disabling symptom (Jensen et al., 2018). Another strength is the sample composition, as it included self-selected individuals with relatively low psychological health, making the findings relevant to clinical settings. In addition, the use of a highly sparse network helped to highlight the most important symptom connections and simplified the interpretation.
The study has several limitations worth mentioning. Selection bias may limit generalizability, as the study sample mainly consisted of women and higher educated individuals. Recruitment of the study was mostlythrough social media, which may have attracted individuals who are more active on such platforms. In addition, the study was advertised as a mental health intervention to support emotional well-being, and therefore may have attracted individuals who were experiencing elevated levels of distress and fatigue and low emotional wellbeing. And while the inclusion of participants with low psychological health adds to the clinical relevance, the results of the study may not be generalizable to those with less or more severe symptoms. Future research in more diverse T1D populations is warranted for this. Moreover, the cross-sectional design prevents conclusions about the dynamics of the variables studied here and causal relationships. Longitudinal studies are needed to clarify how symptoms influence each other over time. For example, experiencing prolonged fatigue could reduce engagement in enjoyable activities and diabetes self-care, impacting both emotional well-being and diabetes distress. Lastly, differences in the time spans of the questionnaires may have influenced the findings. The PAID-11 measures diabetes distress at a single point, whereas the WHO-5 and CIS-fatigue measure the constructs over the past 2 weeks. The relatively small sample size may have influenced the results. There is currently no consensus on the minimum sample size required to achieve sufficient power in network models. However, networks estimated with larger sample sizes are generally more accurate (Epskamp et al., 2018). Additionally, the potential impact of factors such as age, timing, and context of diabetes diagnosis on the network structures was not explored in this study, due to the unequal distribution within the relatively small sample. This study also focused solely on T1D but based on prior research, we did not expect markedly different outcomes between individuals with T1D and T2D (McInerney et al., 2022).
Future research
Future studies should aim to include broader and more representative samples to gain a fuller picture. Moreover, examining potential confounding factors, such as age and diabetes duration, in larger samples, comparing T1D and T2D, could further enhance the personalization of these findings. The results of this study highlight the most consistent connections for the average participant in the sample. However, these findings may not apply to individuals with extreme symptom scores. Future studies could explore individual-level analyses, which, for example, could be done using repeated measurements, such as ecological momentary assessment (EMA; Borsboom et al., 2021). This approach may help identify subgroups of patients who show particular patterns in their networks and allow for personalized mental health interventions (Harnas et al., 2021; Hermanns et al., 2022).
Conclusion
This study provides insights into the interconnected, but also distinct, roles of fatigue, diabetes distress, and emotional well-being in adults living with type 1 diabetes. While the constructs showed strong internal connectivity, the limited number of bridging symptoms suggests that they may function largely independently. The findings of this study contribute to a growing number of studies investigating psychological constructs at the symptom-specific level using network analysis. Future research should explore individual networks using longitudinal methods to better understand these dynamics and to stimulate personalized care strategies.
Supplemental Material
sj-docx-1-hpq-10.1177_13591053251411702 – Supplemental material for The interconnectedness between symptoms of fatigue, diabetes distress and emotional well-being in people with type 1 diabetes: A network analysis approach
Supplemental material, sj-docx-1-hpq-10.1177_13591053251411702 for The interconnectedness between symptoms of fatigue, diabetes distress and emotional well-being in people with type 1 diabetes: A network analysis approach by Jiska Embaye, Wessel van Wieringen, Hans Knoop, Frank J. Snoek and Maartje de Wit in Journal of Health Psychology
Footnotes
Acknowledgements
We thank all the study participants for their valuable input and our users for their interest.
Ethical considerations
The study protocol was approved by the Medical Ethics Committee of VU University Medical Centre (2021.0007).
Consent to participate
Participants provided informed consent online at the start of the questionnaire.
Consent for publication
Consent for publication is not applicable to this article as it does not contain any identifiable data.
Funding
The authors disclosed receipt of the following financial support for the research, authorship, and/or publication of this article: The MyDiaMate study was supported by an unrestricted educational grant from Novo Nordisk (2008298).
Declaration of conflicting interests
The authors declared no potential conflicts of interest with respect to the research, authorship, and/or publication of this article.
Data availability statement
The data that support the findings of this study are available from the corresponding author upon reasonable request.
Supplemental material
Supplemental material for this article is available online.