
Abstract
We examined the measurement of mindful screen time and whether it moderated links between screen-related psychological needs (satisfaction and frustration) and well-being. University students (N = 770, Mage = 19.96) completed a questionnaire online. A unidimensional structure of mindful screen time had an adequate fit (CFI = 0.97, RMSEA = 0.08) and composite reliability (0.79). Correlations between mindful screen time and well-being (rs = |0.08–0.26|) showed evidence of validity based on relations to other variables. Path analysis indicated two of the eight moderated associations were statistically significant but counter to hypotheses: higher mindful screen time increased the negative influence of need frustration on negative affect and diminished the positive influence of need satisfaction on flourishing. Screen-related psychological need satisfaction and frustration were key factors influencing well-being. Effect sizes were small-to-moderate (R2 = 0.21–0.48). Overall, we found that that mindful screen time is not a robust moderator. More research is needed to better understand the role of mindful screen time on well-being.
Introduction
Young adults are deeply interconnected with their digital devices (Odgers et al., 2020). With recent systematic reviews finding only small negative links between screen time and mental health (Ferguson et al., 2022; Tang et al., 2021), researchers have suggested that in addition to examining how long someone is engaged in screen time, their quality of experience should be considered (Ferguson et al., 2022; Odgers et al., 2020; Orben, 2020; Tang et al., 2021). Based on theory (Rigby and Ryan, 2017; Ryan and Deci, 2017; Schneider et al., 2022), experiencing psychological needs and having higher mindfulness while using screens are two factors that could differentiate quality engagement and are associated with well-being. In this study, we investigated if we can measure mindful screen time and if mindful screen time and psychological needs during screen time were related to well-being.
Self-determination theory, psychological needs, and mindfulness
Within self-determination theory (Ryan and Deci, 2017) there are three basic psychological needs for competence (i.e. feeling capable and effective), autonomy (i.e. feeling agency), and relatedness (i.e. feeling connected with important others). To the extent that psychological needs are satisfied (vs frustrated) they are theorized to lead to higher quality engagement and well-being. Therefore, it is not necessarily a domain (e.g. sport, work, screen time, education) or time spent in that domain (e.g. hours of screen time, hours at work) that fosters or forestalls well-being, it is the experience of psychological needs within the domain that matters (Rigby, 2023). As such, experiences of psychological need satisfaction (vs frustration) during screen time represent good candidates to help us understand how quality experiences during screen time relate to well-being.
Research on psychological needs and well-being supports theory. For example, in-video game satisfaction of psychological needs is related to positive outcomes (e.g. enjoyment, vitality; Ryan and Deci, 2017), whereas in-video game need frustration has been found to be related to negative outcomes (e.g. aggressive thoughts, internet gaming disorder; Allen and Anderson, 2018; Przybylski et al., 2014; Ryan and Deci, 2017). Additionally, Van de Casteele et al. (2024a, 2024b) have found that experiencing psychological need satisfaction while using social media is associated with better mental health. Therefore, research supports theory in that screen time’s association with well-being outcomes can be understood by examining perceptions of psychological needs during screen time.
Mindfulness as a moderator between psychological needs and well-being
Within self-determination theory, mindfulness (i.e. “receptive awareness of attention to present-moment experiences” Beloborodova and Brown, 2023: 187) has been described as both a predictor and moderator of psychological needs. As a predictor, Ryan and Deci (2017) contend that mindfulness generates higher integrated self-regulation (i.e. acting in accord with people’s values, interest) and basic psychological needs. As a moderator, Vansteenkiste and Ryan (2013) theorize that mindfulness is an inner resilience factor because it can protect against negative experiences associated with need thwarting environments and psychological need frustration. Notably, its theorized that having higher mindfulness allows people to have more objective and realistic appraisals of events that in turn decrease defensiveness, increase coping, and permits more reflective and autonomous actions (Ryan and Deci, 2017; Schultz and Ryan, 2015). For example, in the work domain, Olafsen et al. (2021) found that the mediating effect of psychological need frustration between role conflict and burnout, somatic symptoms burden, and turnover intentions was less pronounced for people who had higher trait mindfulness. In other words, mindfulness reduced the negative impact of experiencing need frustration on work related outcomes.
Extending these self-determination theory-based assertions to a screen time context, Schneider et al. (2022) proposed the Integrative Model of Mobile Media Use and Need Experiences (IM3UNE). Most pertinent to the current study, trait mindfulness is hypothesized to alter the relationship between perceptions of psychological needs derived in media contexts and well-being (see Schneider et al., 2022 for a full description of IM3UNE). For example, in situations of high psychological need frustration, people who are higher in trait mindfulness are hypothesized to be able to maintain balanced awareness and not focus excessively on threatening states (i.e. psychological need frustration) incurred while using mobile media, which reduces the negative impact of need frustration on well-being (Schneider et al., 2022).
Present study
Domain level mindfulness (i.e. mindfulness during specific screen domains) is associated with psychological outcomes. For example, mindful instant messaging is linked with better positive affect and lower stress in young adults (Bauer et al., 2017). Mindful social media use is related to more favorable outcomes such as fewer symptoms of addiction (Shabahang et al., 2024), social anxiety, and stress (Apaolaza et al., 2019). Despite these empirical links between mindfulness in screen time domains (vs trait mindfulness), few researchers have examined the psychometric properties of their domain modified instruments to ensure their conclusions were based on valid and reliable scores. Of note, however, Shabahang et al. (2024) recently developed the Mindful Use of Social Media Scale (MUSMS) and examined its psychometric properties, finding evidence for the construct of mindful social media use. In another study, the Mindful Attention and Awareness Scale (MAAS; Brown and Ryan, 2003) was modified to video game contexts and the authors found support for a three-factor structure (Gackenbach and Bown, 2011). Nonetheless, these mindful screen time scales were only applicable to social media (Shabahang et al., 2024) and video game use (Gackenbach and Bown, 2011) and do not apply to all screen time contexts overall. To examine screen time more broadly and align with public health screen time guidelines more generally, we modified an existing theoretically derived scale (i.e. the short Mindful Attention and Awareness Scale (MAAS); Brown and Ryan, 2003) to contextualize items to mindful screen time. Before making conclusions about mindful screen time and its potential role in understanding screen time experiences and well-being, it was important to examine the psychometric properties of this modification.
As noted above, (Olafsen et al., 2021; Ryan and Deci, 2017; Schneider et al., 2022) higher trait mindfulness is theorized and has been found to protect against negative experiences associated with psychological need frustration; however, despite evidence that screen time domain mindfulness is linked with psychological outcomes (Apaolaza et al., 2019; Bauer et al., 2017), researchers have yet to examine if domain mindfulness in screen time contexts moderates the link between psychological needs and well-being. This research is needed because if we find that mindful screen time enhances the link between psychological need satisfaction and well-being and reduces the link between psychological need frustration and well-being, we can begin to examine if screen time mindfulness interventions can be applied to screen time contexts to enhance or protect against the experiences people have during screen time.
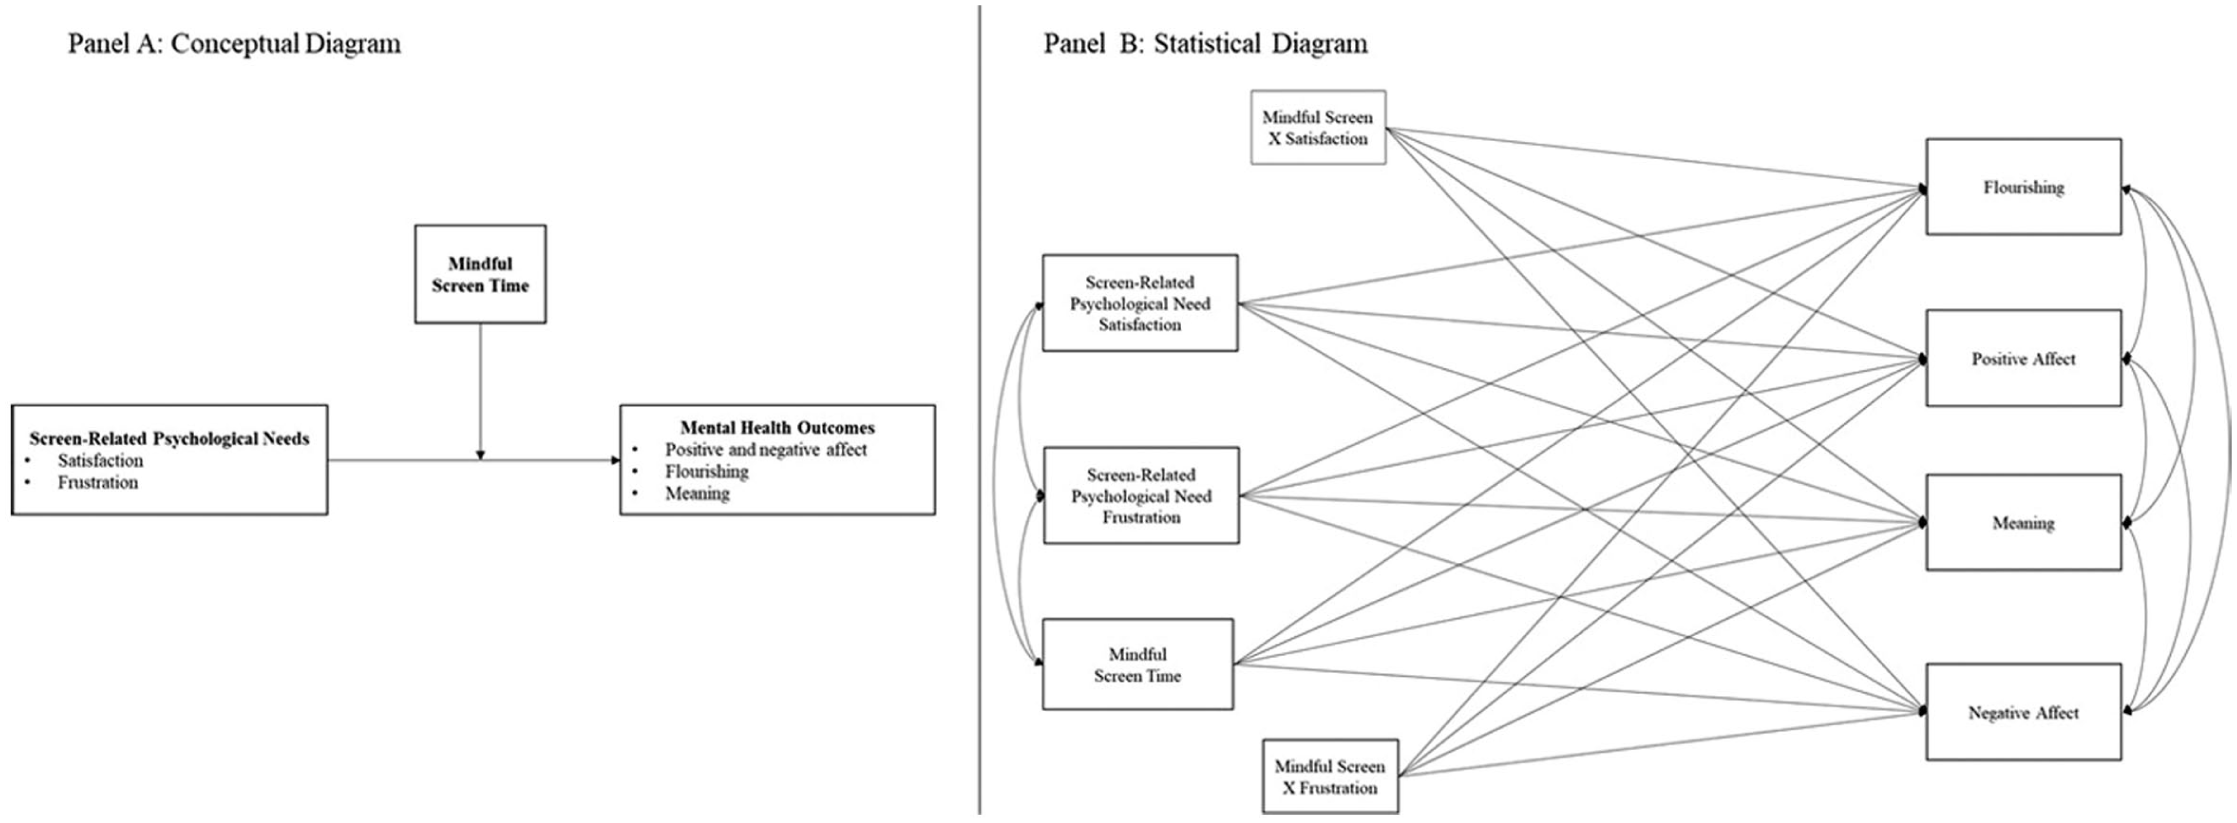
Conceptual and statistical diagrams depicting mindful screen time as a moderator.
Methods
Statement of transparency and openness
The data analysis for this study was pre-registered (https://doi.org/10.17605/OSF.IO/4QYHA) and materials are available (https://osf.io/th2vm). Deviations were noted where applicable throughout the manuscript. Unfortunately, gender was accidentally omitted from the survey and could not be included as a covariate in analyses as planned. No specific a-priori power analysis was conducted, but we aimed to recruit 500 people for adequate statistical power for latent variable analyses (Kline, 2011). This study was approved by Carleton University’s research ethics board.
Participants and procedure
Participants were part of a university-wide participant pool, consisting of students enrolled in first-year psychology courses at a university in Canada. Participants had to be ⩾18 years and able to understand English. University students were recruited because they report high screen time (Weatherson et al., 2021). The psychology participant pool was used for practical constraints and relied on the convenience of the existing participant pool. Importantly, our target population was undergraduate students, and the participant pool allowed us to efficiently reach that population. Participants completed informed consent and answered a battery of questionnaires online via Qualtrics at one point in time (i.e. cross-sectional design). Participants received bonus course credit toward their introductory psychology course. A total of 770 participants (Mage = 19.96, SD = 3.74 years) were included in the final analysis.
Measures
Demographic information
Participants indicated their age, race/ethnicity, their parents’ marital status, and each parent’s highest levels of education.
Well-being
In this study, we used Huta and Ryan’s (2010) definition of well-being as “one or more subjective experienced states or evaluations of one’s life that could be rated as desirable or undesirable” (p. 736). Huta and Ryan recommend incorporating various indicators of well-being that broadly reflect subjective states and evaluations associated with both hedonia and eudaimonia. Therefore, we selected four indicators of well-being including positive affect, negative affect, meaning, and flourishing. The short Positive and Negative Affect Schedule (Mackinnon et al., 1999; Watson et al., 1988) was used to assess positive affect (average of 5 items) and negative affect (average of five items). Responses were provided on a five-point scale ranging from 1 (very slightly or not at all) to 5 (extremely) following the instructional stem: “This scale contains a number of words describing different feelings and emotions. Indicate to what extent YOU generally felt this way in the past 7 days (week).” Higher scores reflect higher positive or negative affect. Researchers have found support for the short version of this measure showing that scores retained a good factor structure and alpha ⩾ 0.75 (Mackinnon et al., 1999). Meaning was assessed with four items from a 12-item measure developed to assess trait and state level experiences of meaning (Huta and Ryan, 2010). Participants were instructed to rate the degree to which they typically felt that their activities and experiences were: meaningful, valuable, precious, and full of significance. Items were rated on a scale of 1 (not at all) to 7 (very much). The four items were averaged with higher scores representing higher meaning. Huta and Ryan have shown the original 12-items to demonstrate score reliability and validity. Additionally, Huta (2013) found alphas above 0.74 for the shortened version of the meaning scale. Flourishing was assessed with eight items from the Flourishing Scale (Diener et al., 2010). Participants read the instructional stem: “Considering your last 7 days (week), using the 1-7 scale below, indicate your agreement with each item by indicating that response for each statement.” They then rated each item on a scale of 1 (strongly disagree) to 7 (strongly agree). An example item was “I am engaged and interested in my daily activities.” An average was created with all the items such that higher scores represented higher flourishing. Alpha (0.87) and validity evidence based on convergence with well-being was documented (Diener et al., 2010).
Screen-related psychological need satisfaction and frustration
The 24-item basic psychological need satisfaction and frustration scale (Chen et al., 2015) was used to assess screen-related psychological needs. The instructional stem was modified to ask participants to consider a definition of screen time and then respond to the items thinking about when they were engaged in screen time (see Supplemental file). They rated each item on a scale of 1 (completely untrue) to 5 (completely true). The scale contains four items assessing each psychological need satisfaction (competence satisfaction, autonomy satisfaction, and relatedness satisfaction) and each psychological need frustration (competence frustration, autonomy frustration, and relatedness frustration). Screen-related psychological need satisfaction was created by averaging the average of competence, autonomy, and relatedness satisfaction variables. Screen-related psychological need frustration was created by averaging the average of competence, autonomy, and relatedness frustration variables. Higher scores represent higher screen-related psychological need satisfaction and frustration. Validity and reliability evidence for the original scale has been documented (Chen et al., 2015). Recent research that has modified the instructional stem and individual items to similar contexts (i.e. social media) has demonstrated score reliability (alpha ⩾ 0.61) and validity with correlations in the expected direction with indicators of well-being (Van de Casteele et al., 2024a).
Mindful screen time
Mindful screen time was assessed with a modified version of the 5-item state Mindful Attention and Awareness Scale (MAAS; Brown and Ryan, 2003). The modification was made by altering the instructional stem to cue participants to consider their leisure time on digital devices and by altering each item to cue their use of digital devices (please see Supplemental file for details on how the modifications were made). Responses to items were made on a six-point response scale of 1 (almost always) to 6 (almost never) with higher scores reflecting higher mindful screen time. An example original item was “I find myself doing things without paying attention” and when modified was “I find myself engaging with my digital device without paying attention.” The original shortened state MAAS demonstrated good reliability (alpha = 0.92; Brown and Ryan, 2003). The MAAS has been modified to assess mindfulness during instant messaging and retained good score reliability (alpha = 0.71; Bauer et al., 2017).
Screen time duration
Leisure screen time was assessed with two items from the International Sedentary Assessment Tool (ISAT; Prince et al., 2017). Two items were used to represent leisure screen time: (1) watching television or videos (counting time spent watching television, DVDs and online videos) and (2) using a computer (counting time spent on things such as computers, laptops, Xbox, PlayStation, iPod, iPad, or other tablet, or a smartphone, YouTube, Facebook or other social networking tools, and the Internet). Both items were presented twice, once for weekdays and once for weekend days. Participants entered the time in hours and minutes. A total score was created and then a weighted average daily score was calculated as ((weekday*5 + weekend*2)/7). Higher scores reflect higher leisure screen time duration in hours.
Data analysis
Data were cleaned based on completeness and attention checks. Next, missing data at the item level was examined for the main variables. Since missing data were less than 5% per item within each main variable, variable means were calculated only for participants who had complete item-level data for all items comprising that variable. Although not specified in the pre-registration, participants who responded to a screen time item as indicating they spent 24 or more hours per day on that type of screen, their responses to that item were removed and a missing value was entered given that their response was not plausible. Next, statistical outliers for each main variable were examined and participants were removed if z ⩾ 3.29 (Tabachnick and Fidell, 2021). Because screen time was an open-ended response, we expected higher missing data and outlying scores. As such, we did not remove entire participants if they had an outlying response on screen time; rather, their outlying screen time score was removed and replaced with a missing data value (i.e. the person’s response was treated as missing data). For analysis involving items only (i.e.
To examine
To address
Inference criteria and effect sizes
Chi-Square tests are often statistically significant with a large sample size. Hence, although we included these tests in the results of the CFA and path models, we did not interpret them. Instead, we adopted two recommended fit indices: Comparative Fit Index (CFI ⩾ 0.95) and Root Mean Square Error of Approximation (RMSEA ⩽ 0.08) that were interpreted as good data-model fit. Parameter estimates were also interpreted (e.g. factor loadings). Given the sensitivity of p-values to large sample size, we followed Cohen’s suggestion for interpreting bivariate correlations, small (0.10), medium (0.30), and large (0.50). For the path models, we examined R2 and ΔR2 when the interactions were added.
Results
Descriptive statistics
Data cleaning, missing data frequencies, and outlier detection are outlined in the Supplemental file. Participants (N = 770) were on average 19.96 (SD = 3.74) years old. Demographic, descriptives, and reliability information is presented in Table 1. Estimates of internal consistency were above 0.76.
Descriptive statistics and internal consistency for study variables.
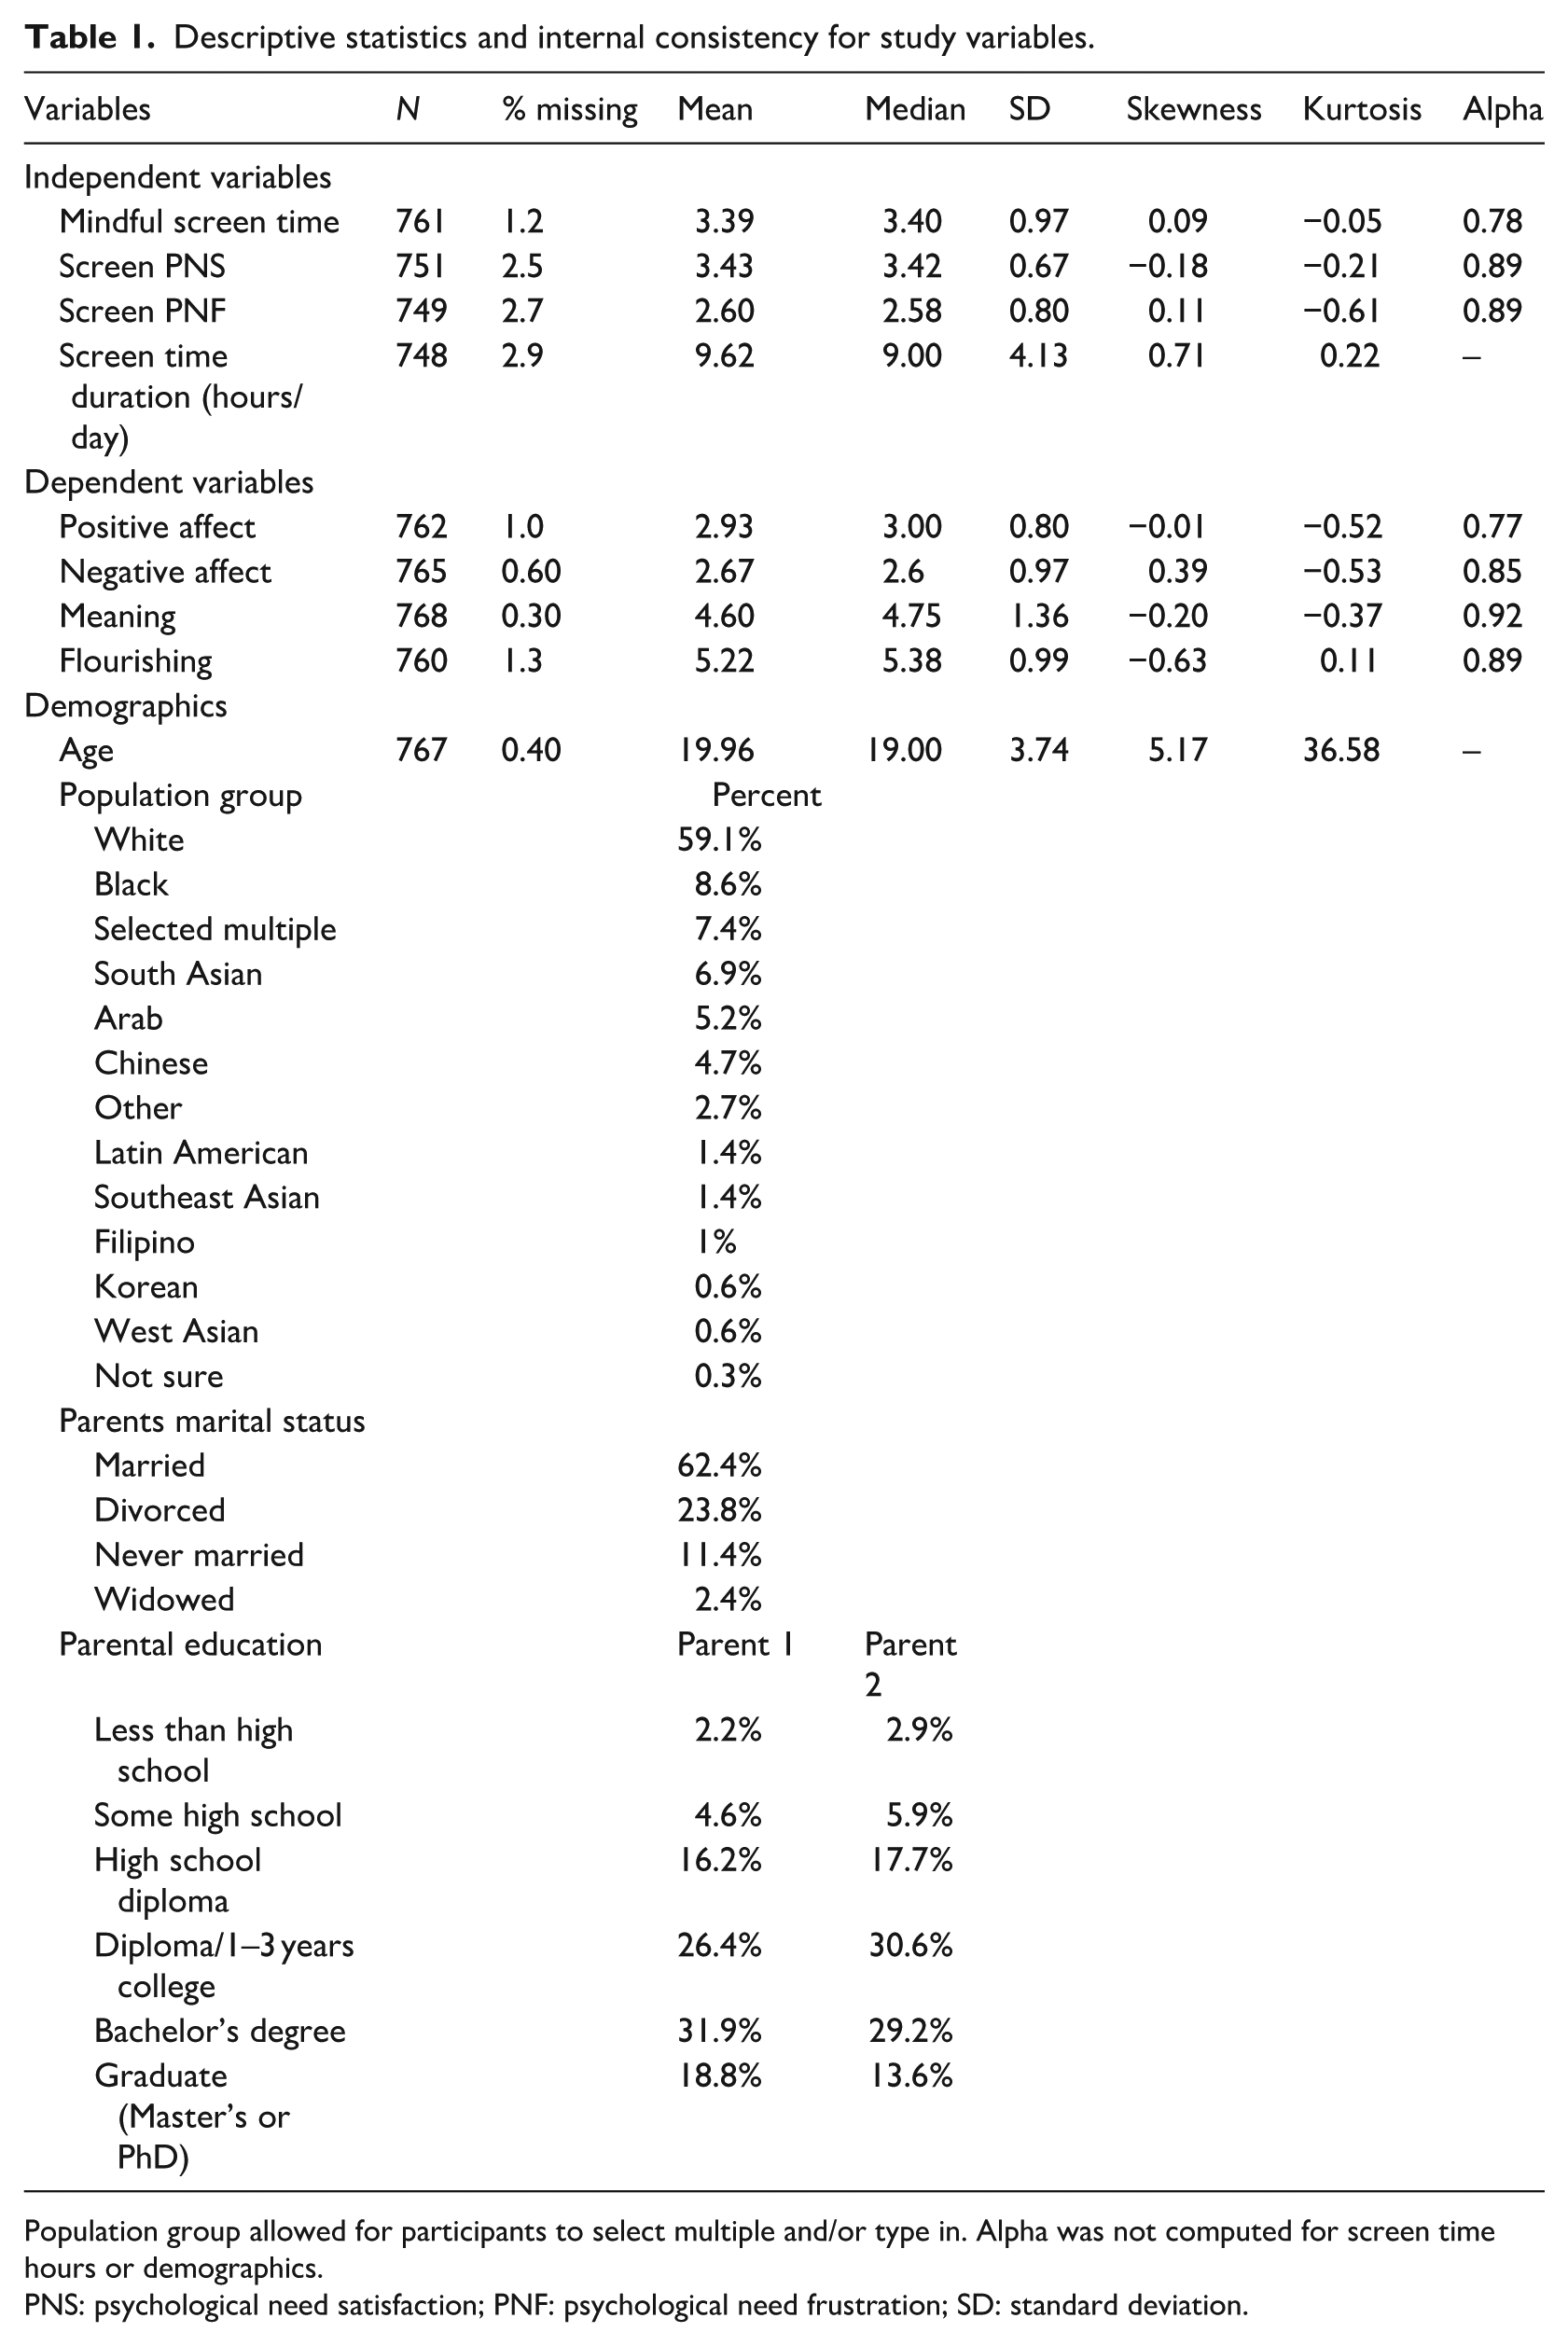
Population group allowed for participants to select multiple and/or type in. Alpha was not computed for screen time hours or demographics.
PNS: psychological need satisfaction; PNF: psychological need frustration; SD: standard deviation.
RQ1. Reliability and internal structure of responses to the mindful screen time measure
A one-factor model of mindful screen time fit the data well (n = 761, χ2(5) = 29.83, p < 0.001; CFI = 0.97; RMSEA = 0.08, 90% confidence interval (CI) (0.05, 0.11)). Standardized parameter estimates indicated moderate-to-strong factor loadings (λ = 0.47–0.75, p < 0.05). Composite reliability was 0.79.
RQ2. Validity evidence based on relations to other variables
Bivariate correlations are presented in Table 2 (confidence intervals available in Supplemental file). Higher mindful screen time was associated with higher positive affect, meaning, and flourishing and lower negative affect with small correlations. Higher mindful screen time was associated with higher screen-related psychological need satisfaction and lower screen-related psychological need frustration with small and medium correlations, respectively. Mindful screen time was not significantly associated with screen time duration. Higher mindful screen time was associated with higher age with a small correlation.
Bivariate correlations between study variables.
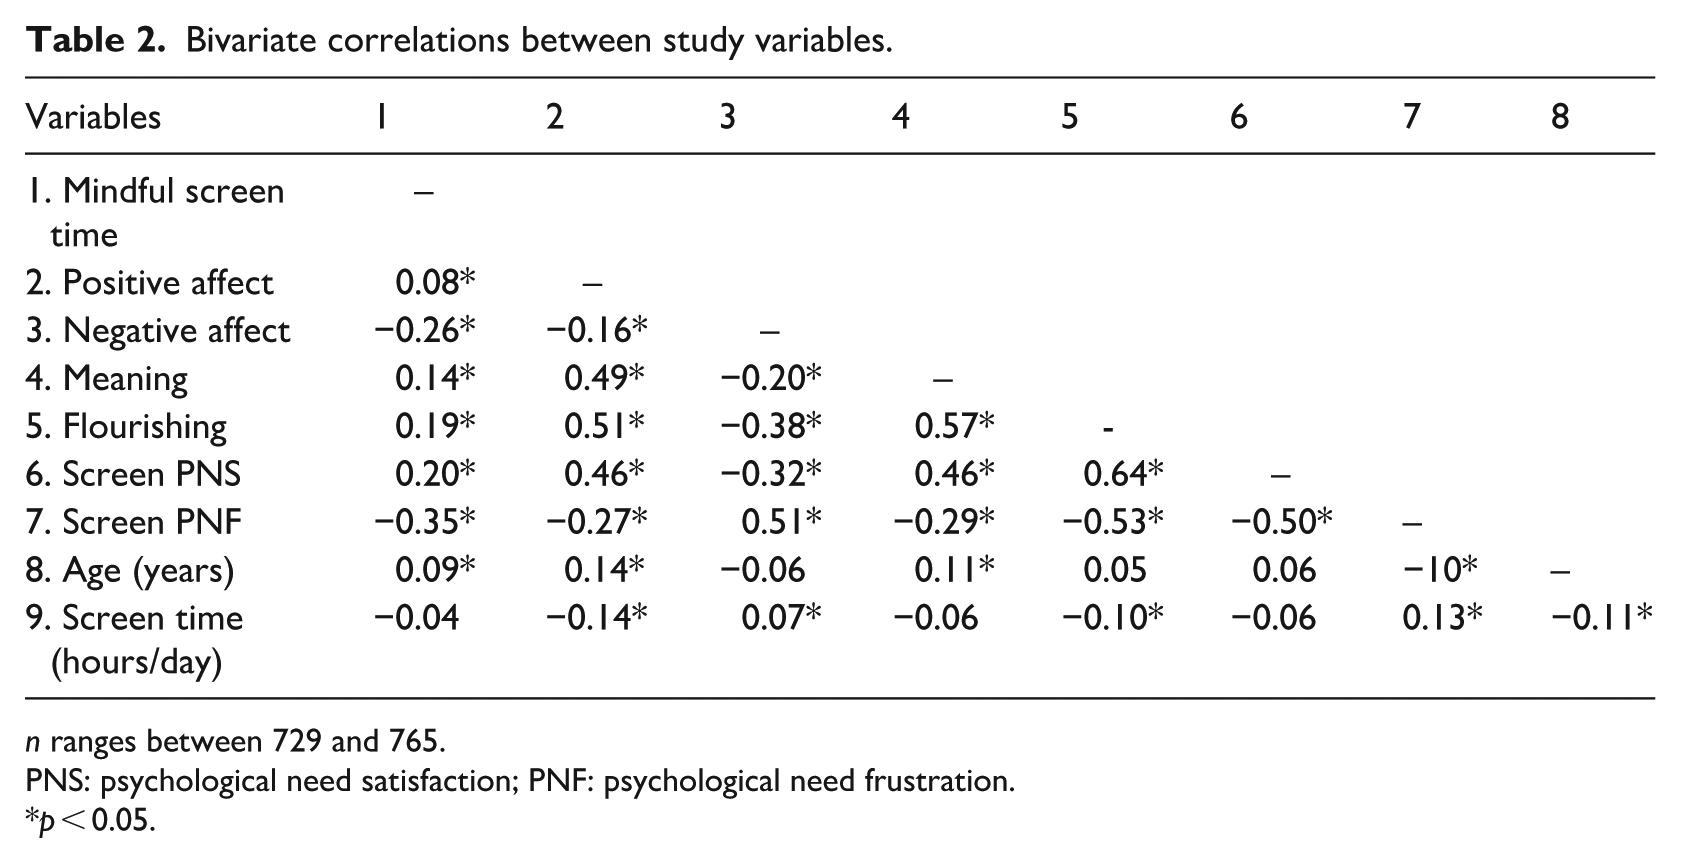
n ranges between 729 and 765.
PNS: psychological need satisfaction; PNF: psychological need frustration.
p < 0.05.
RQ3. Moderating role of mindful screen time
The results of Models 1–3 are presented in Table 3 (see Supplemental file for standard errors and confidence intervals). Model 1 was just identified, so no indices of fit are provided. Model 2 (χ2(6) = 3.00, p = 0.81, CFI = 1.0, RMSEA = 0.00, 90% CI (0.00, 0.03)) and model 3 (χ2(12) = 12.46, p = 0.41, CFI = 1.0, RMSEA = 0.01, 90% CI (0.00, 0.04)) provided a good fit and the statistically significant paths were in the hypothesized direction (see Table 3). Of note, R2 values changed in a small magnitude with the addition of the interaction terms (i.e. Model 2 from Model 1) for positive affect (R2 = 0.22, ΔR2 = 0.01), negative affect (R2 = 0.27, ΔR2 = −0.01; note the sample size changes between models 1 and 2), meaning (R2 = 0.22, ΔR2 = 0.01), and flourishing (R2 = 0.48, ΔR2 = 0.01) suggesting that the moderation of mindful screen time on the relationships between screen-related needs and well-being does not account for a large proportion of variance in outcomes beyond their main effects.
Unadjusted and adjusted moderation models.
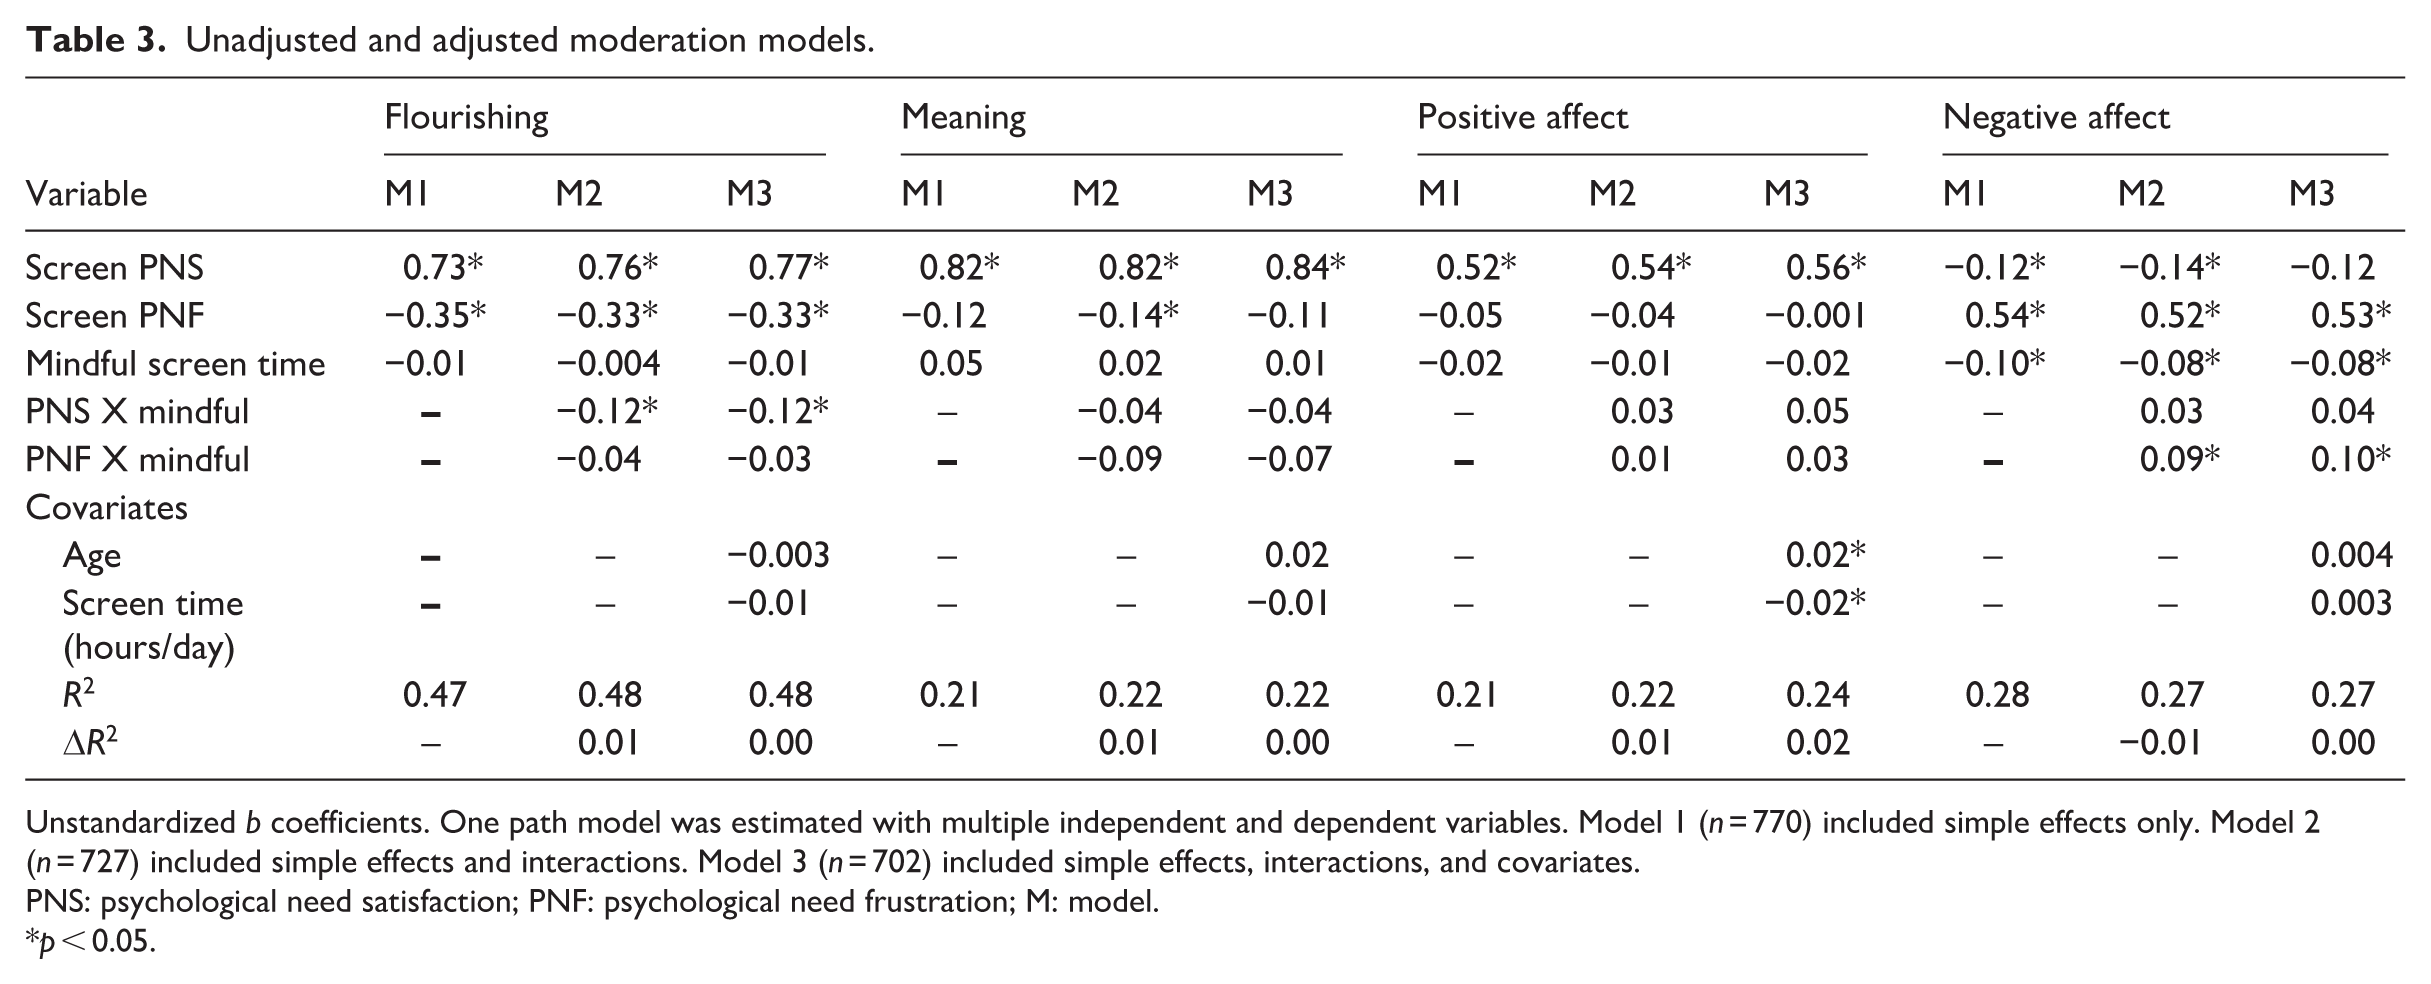
Unstandardized b coefficients. One path model was estimated with multiple independent and dependent variables. Model 1 (n = 770) included simple effects only. Model 2 (n = 727) included simple effects and interactions. Model 3 (n = 702) included simple effects, interactions, and covariates.
PNS: psychological need satisfaction; PNF: psychological need frustration; M: model.
p < 0.05.
The associations in Model 2 were generally robust to the inclusion of covariates in Model 3, except two paths became non-significant (p > 0.05): screen-related frustration no longer significantly related to meaning and screen-related satisfaction no longer significantly related to negative affect. In the unadjusted and adjusted models, screen-related need frustration was associated with increased negative affect, while screen-related need satisfaction was associated with greater flourishing; however, mindful screen time moderated these relationships differently and contrary to hypotheses: given the same level of need frustration, individuals with higher mindful screen time experienced notably more negative affect (see Figure 2, Panel A) whereas given the same level of screen-related need satisfaction, those with higher mindful screen time reported lower flourishing (see Figure 2, Panel B). Therefore, higher mindful screen time was detrimental to negative affect and flourishing at higher levels of screen-related need frustration and satisfaction, respectively.
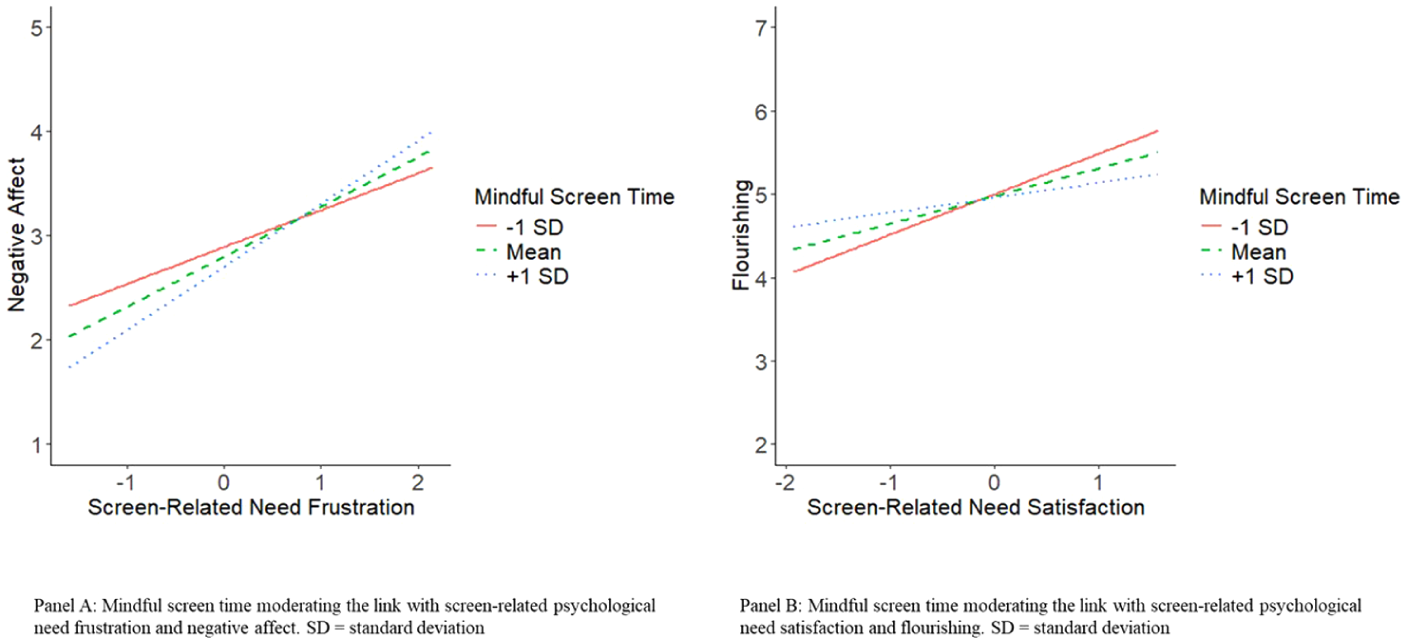
Simple slopes for the two significant interactions.
Discussion
Based on self-determination theory (Ryan and Deci, 2017; Vansteenkiste et al., 2020) and the IM3UNE model (Schneider et al., 2022), we examined the measurement of mindful screen time and whether it moderated links between screen-related psychological needs (satisfaction and frustration) and well-being.
Validity and reliability of modified MAAS scores
Given our interest in mindful screen time (vs overall trait mindfulness), a necessary first step of our study was to examine if the MAAS could be modified to screen time contexts and retain evidence of score validity and reliability. Results supported our hypotheses. Composite reliability and internal consistency of scores were good. This finding is consistent with other studies where the researchers have modified MAAS items to other screen time contexts such as instant messaging (short MAAS; Bauer et al., 2017) and video gaming (15-item MAAS; Gackenbach and Bown, 2011). Moreover, the results of our confirmatory factor analysis supported the original one-factor model (Brown and Ryan, 2003). Few studies have examined the factor structure of a modified MAAS to screen time contexts. In one, Gackenbach and Bown (2011) modified MAAS items to a video game context and found support for a three-factor structure rather than one-factor structure, although they used the longer version of the MAAS. Continued research on the validity of the modified mindful screen time measure is warranted.
We found support for our hypothesis that modified MAAS scores would demonstrate validity evidence based on relations to other variables. Higher mindful screen time was associated with higher positive affect, meaning, flourishing, and screen-related psychological need satisfaction and lower negative affect and screen-related psychological need frustration. Given the large sample size, caution is warranted when interpreting the statistical significance of these correlations. Indeed, researchers have argued that correlations under 0.10 have little practical significance when examining the relationships between screen time duration and mental health (Ferguson et al., 2022). Although mindful screen time correlations with well-being indicators were above 0.10 (except for the correlation with positive affect = 0.08), the effect sizes were still small |0.08–0.26|. A new assessment of mindful use of social media (Shabahang et al., 2024) demonstrated stronger patterns of correlations with similar psychological variables, suggesting that perhaps narrowing the focus of items to one type of application use (e.g. social media use) strengthens relationships. Nonetheless, our results suggest that responses to the modified MAAS show validity evidence based on relations to other variables and could be used to understand relationships with other variables.
Main effects of screen related psychological need experiences and mindful screen time
In the main effects only model (Model 1), mindful screen time and screen-related psychological needs contributed a large proportion of variance explaining well-being outcomes (R2 ranged from 0.22 to 0.48). These R2 values are stronger than effects typically found when examining the links between screen time duration and well-being outcomes which tend to be small in general populations (Ferguson et al., 2022; Tang et al., 2021).
Screen-related psychological need satisfaction and to a lesser extent frustration were independently related to well-being indicators. These findings on the importance of domain specific psychological need experiences are consistent with theory (Rigby, 2023; Ryan and Deci, 2017; Schneider et al., 2022; Vansteenkiste et al., 2020) and past research examining specific app types (Przybylski et al., 2014; Van de Casteele et al., 2024a, 2024b). Importantly, few studies in screen time contexts have simultaneously examined both frustration and satisfaction in one model, thereby failing to account for shared variance between the two and consequently attaining results that could be artificially inflated. Developing a better understanding of psychological need satisfying and frustrating experiences during screen time with more rigorous methods is needed.
Inconsistent with theory, the unique role of mindful screen time in the presence of screen-related psychological need satisfaction and frustration (and interactions) is questionable at best. Mindful screen time was not significantly associated with positive indicators of well-being (i.e. positive affect, flourishing, meaning), but was associated with lower negative affect. This finding was surprising since the bivariate correlations were statistically significant, and past research has also found relationships between mindfulness during social media use and mental health (Shabahang et al., 2024). Studies in other domains (e.g. life in general or sleep) testing other plausible models have found that when psychological needs are in the model as mediators, the direct links from mindfulness to outcomes are no longer significant (Campbell et al., 2019; Chang et al., 2015, 2018). More research with longitudinal or experimental designs to test directional processes is needed to determine how screen-related psychological needs and mindful screen time are related to well-being.
The moderating role of mindful screen time
Our hypothesis that mindful screen time could be a resilience factor that protects people from the detrimental effects of psychological need frustration or amplifies the positive effects of psychological need satisfaction were generally not supported. We tested eight moderated associations s (i.e. interactions) and only two were statistically significant. Furthermore, the changes in R2 when the interactions were added to the model were extremely small suggesting that very little additional variance in well-being indicators was explained by the interaction terms. These generally null findings were inconsistent with theory (Schneider et al., 2022) and work showing trait mindfulness moderating links between screen-related variables and psychological outcomes (Charoensukmongkol, 2016; Poon and Jiang, 2020; Richner et al., 2023; Yang et al., 2017). It is possible that our operationalization of mindfulness at the domain level (vs trait level) accounts for these largely non-significant findings. Indeed, the IM3UNE model (Schneider et al., 2022) and contentions in self-determination theory (Vansteenkiste et al., 2020) discuss individual differences or trait levels of mindfulness rather than state or domain levels of mindfulness. Alternatively, our measure focusing on overall screen time may be too broad therefore washing out associations due to differences between how different types of apps are used and experienced. Researchers should explore the moderating role of mindfulness at different levels of specificity to test the IM3UNE model and self-determination theory-based tenets.
Despite the generally null moderated associations, mindful screen time did moderate the link between screen-related psychological needs and negative affect and flourishing. In both cases, at below average levels of screen-related psychological needs, higher mindful screen time was beneficial. It is possible that at lower levels of screen-related psychological needs, mindful screen time helps people be aware and attend to the beneficial aspects of their screen time in balance with the detrimental aspects of their screen time (i.e. not dwell or ruminate on negative experiences) thereby enhancing well-being outcomes.
Contrary to hypotheses, being less mindful during screen time characterized by high need frustration and satisfaction, was more favorable for negative affect and flourishing, respectively. For negative affect, it is possible that high psychological need frustration creates a dysregulation of emotions. Notably, researchers found evidence that emotional dysregulation, which can be a negative outcome of long-term need frustration is one factor that can turn the positive effects of mindfulness into negative consequences (Serhatoğlu et al., 2022). Additionally, Britton et al. (2021) found that mindfulness-based practices can have negative impacts and that using mindfulness and non-judgmental reappraisals of dissociative symptoms (e.g. emotional blunting) is not sufficient to prevent impairment. It is possible that at higher levels of mindfulness, people who are experiencing distress or emotional dysregulation due to high screen-related need frustration experienced worse negative affect because it draws attention toward their frustration (vs keeping it in balance as would be the case with lower frustration). Given the strong links between psychological need frustration and ill-being, it is prudent to examine if, how, and when mindfulness impacts this relationship. Finally, for flourishing, it seems possible that at higher levels of satisfaction, higher mindfulness may not benefit flourishing compared to lower mindfulness because lower mindfulness allows people to experience their emotions and satisfaction without consciously drawing excessive attention to them. More research is needed to better understand both counterintuitive interactions.
Limitations and future directions
Although this study has several strengths (e.g. large sample size, path analyses including all variables), limitations should be considered. These data are cross-sectional and self-reported. Using experience sampling methods to understand in the moment mindful screen time and its concurrent and predictive relationship with indicators of well-being and screen-related psychological needs would be an interesting avenue for future research and could reduce the effect of recall bias. It is possible that mindful screen time is more important within-persons than between-persons. The self-report measure of screen time is limited in that it is subject to recall bias and values may be overrepresented. We attempted to correct this by removing implausible responses of 24+ hours per day and removing univariate outliers on the overall screen time variable (see Supplemental file for details). We did not test the impact of removing participants who reported any other value (e.g. 12 hours or more) as we are not aware of gold standards for doing so and such exploratory analyses were not pre-registered. More research is needed to examine the validity and reliability of scores from self-report screen time measures and how to treat responses that do not meet outlier criteria but could appear high. Researchers should use direct measures of screen time quantity in future research (e.g. screenshots of smartphone metrics). The results are obtained from university students participating in a participant pool and may not generalize to other populations. It is possible that university students have different screen time and well-being rates and experiences. For example, although not directly comparable, one study with Canadian university students found that only 36.2% met recreational screen time guidelines in the Fall of 2019 (Weatherson et al., 2021) whereas in another study, it was found that in 18–34 year olds, more people were meeting the guidelines (63.4% before 2018 and 49.5% during 2021; Toigo et al., 2024). In a review, Sharp and Theiler (2018) concluded that university students experienced more prevalent and severe psychological distress compared to age-match peers from general populations. Lastly, our results are limited by the underrepresentation of certain populations (e.g. Indigenous peoples). Therefore, given possible differences in sample characteristics, caution is warranted when attempting to generalize our findings to other populations. Since gender was erroneously excluded from data collection, we are unsure of the gender distribution in our study. Previous research using the same participant pool with a cross-sectional design and similar exclusion criteria reported that the majority of participants were female (69%; study 1 in Gunnell et al., 2025). Lastly, we examined one moderated pathway specified in the IM3UNE model. It would be interesting to examine the first path from the IM3UNE model to determine if screen time use and demands (e.g. direct measures of screen use, smartphone pickups, notifications) are linked with psychological needs and buffered by mindful screen time.
Practical implications
During screen time, when people feel connected with important others (i.e. relatedness), experience growth and capability (i.e. competence), and make their own decisions and follow their desires (i.e. autonomy) it is linked to better well-being. Importantly, our findings alongside recent findings about social media (Van de Casteele et al., 2024a, 2024b) demonstrate that screen time experiences can be associated with positive outcomes when they are need satisfying. Conversely, experiencing need frustration during screen time such as if students felt alienated from important others (i.e. relatedness), felt pressure to be on screens or portray themselves inauthentically (i.e. autonomy), or felt incapable (i.e. competence), could undermine well-being. Therefore, we echo others (Ferguson et al., 2022; Odgers et al., 2020; Orben, 2020; Tang et al., 2021) who have argued that the quality of screen experiences is worth investigation. Programs targeting improved screen time would do well to educate university students on how to identify and enhance need satisfaction experiences while avoiding need frustrating experiences through need crafting (Van de Casteele et al., 2024b).
Conclusion
In this study, we found preliminary evidence for the measurement of mindful screen time and that it may have some buffering and amplifying associations on select relationships between psychological needs and well-being indicators; however, the added associations were very small, counterintuitive, and may be of little practical significance. Nonetheless, one clear finding was that experiences of screen-related psychological need satisfaction and, to a lesser extent, frustration were related to well-being indicators and together, the model accounted for small-to-moderate proportions of the variance in well-being, suggesting that these associations may be meaningful.
Supplemental Material
sj-docx-1-hpq-10.1177_13591053251398259 – Supplemental material for Is mindful screen time a resilience factor for screen-related experiences of psychological needs and well-being?
Supplemental material, sj-docx-1-hpq-10.1177_13591053251398259 for Is mindful screen time a resilience factor for screen-related experiences of psychological needs and well-being? by Katie E. Gunnell, Mackenzie Salmon, Jayson J. Yung, Yan Liu and Gary S. Goldfield in Journal of Health Psychology
Footnotes
Author note
M.S. and J.J.Y. were students in the department of Psychology at Carleton University at the time the data were collected for this study.
Ethical considerations
This study received ethical approval from the Carleton University Research Ethics Board (#114999) on date January 15, 2021.
Consent to participate
All participants provided electronic informed consent before beginning the study.
Consent for publication
Consent for publication is not applicable to this article as it does not contain any identifiable data.
Author contributions
Conceptualization: (KG, MS, JY); Methodology: (KG, MS, JY); Formal analysis and investigation: (KG, YL); Writing – original draft preparation: (KG); Writing – review and editing: (KG, GG, YL, MS, JY); Funding acquisition: (KG); Supervision: (KG).
Funding
The authors disclosed receipt of the following financial support for the research, authorship, and/or publication of this article: Funding for this study was provided by a Faculty of Arts and Social Sciences Research Excellence Award, Carleton University.
Declaration of conflicting interests
Dr. Goldfield reports a relationship with ongoing social media litigation efforts that includes: paid consulting or Advisory. The other authors declared no potential conflicts of interest with respect to the research, authorship, and/or publication of this article.
Supplemental material
Supplemental material for this article is available online.
Notes
References
Supplementary Material
Please find the following supplemental material available below.
For Open Access articles published under a Creative Commons License, all supplemental material carries the same license as the article it is associated with.
For non-Open Access articles published, all supplemental material carries a non-exclusive license, and permission requests for re-use of supplemental material or any part of supplemental material shall be sent directly to the copyright owner as specified in the copyright notice associated with the article.