
Abstract
With widespread late- and under-diagnosing, health register code G93.3 data cannot offer an unbiased sampling frame for myalgic encephalomyelitis, complicating prevalence and demographic distribution assessments. It also remains unclear if all G93.3 cases would meet the Canada Consensus Criteria (CCC). This article describes a novel methodological approach to addressing selection bias when estimating a CCC population’s characteristics, applying an online respondent-driven sampling approach and validated DePaul University algorithms. In a sample of 660 respondents, we assess possible bias in the G93.3 diagnosis by regressing sociodemographic factors on G93.3 status, controlling for medical factors. Results support suggestions that G93.3 register data are biased against those socially deprived.
Keywords
Introduction
The International Statistical Classification of Diseases and Related Health Problems (ICD; 11th Rev.) classified myalgic encephalomyelitis (ME) as a nervous system disorder (World Health Organization, 2022). The updated National Institute for Health and Care Excellence (NICE, 2021) guidelines described the illness as a “complex, multi-system, chronic medical condition” (p. 9). Estimates of its incidence and sociodemographic distribution in Norway are based largely on public health register data for ICD (10th Rev.) diagnostic code G93.3 (Hilland and Anthun, 2024). The overall annual incidence (2016–2018) was estimated as 36 per 100,000 person-years, with a female-to-male incidence rate of 3.76 (Hilland and Anthun, 2022). This represents an increase in the number and women’s share since 2008–2012, when the incidence was estimated at 26 per 100,000 person-years and the female-to-male incidence rate was 3.2 (Bakken et al., 2014).
Late-, under-, and non-diagnosing is assumed to be common. Earlier studies from the United States indicated that as many as 84%–91% of ME patients might go undiagnosed (Jason et al., 2020; Solomon and Reeves, 2004). The diagnostic process is lengthy and involves bottlenecks (Owe et al., 2016). Bragée et al. (2020) found that their sample of 229 Swedes with ME had been ill an average of 9 years (SD = 8) before diagnosis, received 20 somatic and two psychiatric diagnoses, and been in contact with the health system 90 times before being referred to Bragée’s ME specialist clinic. Recent register data studies have shown that the consumption of sickness benefits accelerated, and wage incomes in the group started falling rapidly around 3 years before the diagnosis (Kielland and Liu, 2024). Importantly, high educational attainment was strongly associated with obtaining a G93.3 diagnosis (Hilland and Anthun, 2024).
This article describes a novel approach to producing representative sample estimates for persons meeting the Canada Consensus Criteria (CCC) within a population of persons with severe fatigue illness. We explored possible demographic biases in diagnostic practices by applying validated algorithms proxying different diagnostic criteria. Acknowledging the bias seen in register data, we suggest a novel combination of research tools to (a) produce unbiased estimates of a sample of fatigue-affected participants, (b) distinguish participants meeting the CCC from others, (c) evaluate the extent to which specialist healthcare services gave the G93.3 diagnosis to persons meeting the CCC, and (d) assess which factors other than symptoms had affected an (earlier) diagnosis, thereby implicitly biasing research based on health register data. Although we tested the approach on a Norwegian-only sample, the method should be suitable for surveys across disciplines and countries if certain conditions are met. Discrimination along sociodemographic divides in a disease most common in women would add to the notion that diagnostic practices may entail a social justice concern.
Theory and hypotheses
The NICE guidelines suggests that stricter diagnostic manuals requiring post-exertional malaise, such as the CCC, better define a more homogenous patient group with more uniform intervention needs. Assuming the CCC is a more stringent way of defining the distinct illness of ME, patient register data on G93.3 may not accurately indicate ME’s prevalence or the distribution of other patient characteristics due to under-diagnosing and diagnosing according to different manuals.
The basic assumption of this study was that ME is late- and under-diagnosed with G93.3 in Norway, as elsewhere (Bragée et al., 2020; Jason et al., 2020; Norges Myalgisk Encefalopti Forening [NMEF], 2022; Solomon and Reeves, 2004). Uncertainty among practitioners also suggests diagnosing according to criteria broader than the CCC (Owe et al., 2016). Therefore, we hypothesized that not everyone diagnosed with G93.3 would meet the CCC.
Certain illness features—for example, a rapid onset, as in cases triggered by an acute Epstein-Barr infection—may speed up the diagnosis. In such cases, exploring the possibility of G93.3 may be a more intuitive path for physicians to pursue (Solomon and Reeves, 2004). Psychological distress can cause burnout and fatigue and should preclude a G93.3 diagnosis. Therefore, we expected that a previous psychiatric diagnosis, correct or not, would delay or prevent the G93.3 diagnosis, whereas an Epstein-Barr infection would accelerate it.
Beyond medical factors, a bias against the socially deprived has been suggested to affect the under-diagnosing of G93.3 (Hilland and Anthun, 2024; Jason et al., 2020; Solomon and Reeves, 2004). Persons with low health literacy may experience challenges maneuvering the health systems, and some seriously ill may give up trying to get the diagnosis due to general resource constraints.
We hypothesize that women presenting with the same symptoms as men are more likely to be given the diagnosis, as the high female-to-male ratio among those diagnosed portrays ME as a women’s disease (Hilland and Anthun, 2022). Men may be less willing to undergo a lengthy diagnostic procedure leading to a low-status diagnosis associated with women (Lian and Bondevik, 2013), and practitioners may be less likely to consider the diagnosis when assessing fatigue in men.
In addition, G93.3 seems more common in younger people (Bakken et al., 2014; Hilland and Anthun, 2022). However, health services and diagnostic practices differ between the younger and older populations—as do life conditions. Outbreaks in older persons may receive heightened attention if those patients are breadwinners. Alternately, they may receive less attention because this predominantly female population more often fluctuates between part-time jobs and sick-leave periods (Lian and Bondevik, 2013).
We tested the hypotheses for bias in diagnosing with G93.3, making the operational assumption that meeting the CCC would make the G93.3 diagnosis a “correct” one. The factors/sub-hypotheses tested were (a) a rapid onset would speed up the diagnosis, (b) an Epstein-Barr infection would fast-track the process, (c) a prior psychiatric diagnosis or misdiagnosis would delay or derail the diagnostic process, (d) being female or (e) younger would make it more likely to receive the diagnosis, and (f) as diagnosing is resource-demanding, persons with low human, social, or economic resources would be more likely than others to give up or be further delayed in their diagnostic process.
Method
DePaul algorithms
We applied validated DePaul algorithms to distinguish survey participants meeting the CCC from those meeting other or no case-definition criteria for ME (Jason et al., 2015, 2017; Jason and Sunnquist, 2018; Murdock et al., 2016). We incorporated all questions in the DePaul Symptoms Questionnaire (DSQ-1) and the Medical Outcomes Study Questionnaire Short Form 36 (SF-36) included in DSQ’s algorithms for the Fukuda, CCC, International Consensus Criteria (ICC), and Institute of Medicine (IOM) case criteria for ME/chronic fatigue syndrome (Jason and Sunnquist, 2018; RAND, n.d.). Alterations are explained in Supplemental Appendix A.
A previous study had tested the DSQ-1 sensitivity and specificity as a diagnostic tool (Strand et al., 2016). Sixty-four participants referred for ME examination completed the DSQ-1 and SF-36 and underwent a comprehensive specialist clinical assessment. Researchers found 98% sensitivity (a positive predictive value of 92%), suggesting that a positive CCC score was a good indication that clinical examination would conclude with the ME diagnosis. Specificity was lower—38% (with a negative predictive value of 75%)—but less relevant to our study because the indicated low chance of inclusion error supported the adequacy of the DSQ-1 algorithms for our purpose.
Online respondent-driven sampling
Persons with ME are a rare and elusive population; their distribution is too uncommon to be studied through surveys of the general population. Research on persons with ME commonly targets a population either diagnosed by specialized physicians or self-identified as having ME. Both sampling frames involve biases, and neither is suited for a study exploring potential bias in diagnostic practices. Response rates from patient-list sampling have fallen as the number of surveys circulating increased, adding further bias. Therefore, no available registers or population lists constituted a sampling frame suitable for drawing a representative sample of persons with and without G93.3 meeting the CCC case-definition criteria. Further, we needed a sample that also covered persons with other or no illnesses because the aim was to assess possibly inconsistent diagnostic practices and potential over- and under-diagnosing.
A respondent-driven sampling (RDS) design could instead be applied to address fatigue illnesses meeting different diagnostic criteria. The sampling strategy was developed precisely for sampling and analyzing survey data from rare and elusive populations where clear sampling frames do not exist (Heckathorn, 2002; Tyldum and Johnston, 2014). The methodology has been used widely in epidemiology to investigate HIV/AIDS prevalence and demographic distribution in hard-to-reach populations (Heckathorn, 2002; Tyldum, 2020; Tyldum and Johnston, 2014).
Respondent-driven sampling is a network recruitment system. Respondents are asked to recruit a fixed number of new respondents from their own network, simulating a random walk of the larger social network (Gile and Handcock, 2010; Johnston, 2014). The method draws on information about the respondents’ network size and composition and uses specialized indicators to produce estimators for populations at large.
The strength of the RDS method and tools is their capability to produce estimators that correct bias deriving from variations in recruitment probabilities (network size) and in-group recruitment tendencies (homophily; Gile et al., 2015; Johnston and Luthra, 2014). In precision and variance, RDS can hardly compete with classical probability sampling designs when good sampling frames are available or can be constructed. When they are not, however, a properly implemented RDS will produce better data than snowball or other convenience sampling methods (Tyldum, 2020).
One source of bias from online surveys of ME populations is that respondents who are the most active online may be over-represented. In an online RDS, access is restricted by invitation, increasing the relative weight of those less active in online forums in the total sample. Peer recruitment also increases the participation of groups often under-represented in other surveys because some will participate out of a social commitment to the person recruiting them (Tyldum and Johnston, 2014). The RDS estimators use network information to “weigh” participant responses. This algorithm downgrades the impact of the responses from the groups most likely to recruit each other, which would reduce the weight of more online “activistic” subgroups if they were over-represented. The estimators are also weighted according to network size, recognizing that people with small networks within the target group will have a lower probability of being included in the sample.
The eligible population was defined as persons with a fatigue-type illness, too sick to work or study full-time, and above 14 years old. It is generally advisable in survey research to target a population slightly wider than the one of interest. Inclusion errors can be handled once the data are collected, but exclusion errors cannot. Therefore, we needed to rely on criteria that were broad enough to appeal also to people who had not (yet) obtained a G93.3.
The starting points for network recruitment, referred to in RDS as seeds, were demographically diversified. Four new and unique survey links, referred to in RDS as coupons, were automatically generated when a respondent completed an electronic questionnaire. They could then forward the coupons to target group members of their social networks. We did not provide any goods or cash-based incentives for completion or recruitment.
The relevant national ethics committee supervised and supported the survey design, wording, and content. Respondents consented electronically to participate. Personal data were not recorded. The survey tool was developed in collaboration with the survey solution company, Walr.com. We applied logistic regression to the data collected, including the variables suggested in the theory section, using IBM SPSS (Version 27) and the RDS package of R (Version 0.9-9).
Ethics
Persons with ME are vulnerable at many levels. The disease itself is painful, traumatizing, and debilitating. Many experience prejudice from helpers in health and social services and researchers like us—in addition to the negative stigma felt in social settings, online, and mainstream media (Scoles and Nicodemo, 2022). Globally, there have been several known suicides among people with ME (Johnson et al., 2020; McManimen et al., 2018). Acknowledging the duress many affected families suffer, we applied caution throughout the project.
Stress affects ME symptoms negatively, warranting an attentive approach to the target group. The public debate about the reliability, integrity, and other negative characteristics assigned to this patient group has left many skeptical about research participation. We facilitated broad user communication—from auditorium meetings with stakeholders to advisory user groups and openness to questions and concerns on private messaging.
Results
Data collection
The survey started in August 2020 with the four seed participants selected from a database of 230 persons who had applied to participate in other parts of the larger research project. The four seeds were diversified on age, gender, geography, and affiliation with the main patient organization in Norway (NMEF). Among the seeds were one central member, one peripheral member, one former member, and one non-member. One seed became what is labeled a “superseed,” generating most of the respondents. Six more seeds from different environments were added in September, when the recruitment chains from the four main seeds started to stagnate, to ensure the sample had not become constrained to one network; one of them produced 12 new respondents. The survey was closed in October 2020.
The questionnaire link was opened by 741 persons, and 738 gave informed consent to participate. Six were excluded for not meeting the survey’s eligibility criteria. A total of 660 (89.4% of the initial consenting participants) completed the entire questionnaire.
Sample evaluation
The RDS estimators differ somewhat in calculation and interpretation from estimators for classic random sampling methods. The quality of the data is assessed by studying equilibrium and homophily. If we refer to each recruitment round as a wave, equilibrium is reached at the wave where the distribution of a variable stabilizes. Homophily is an indicator of in-group recruitment: If women recruit only other women, and men mainly recruit other men, there will not be good estimators of the distribution of men and women in a sample. The RDS estimators will adjust for some in-group recruitment; however, if homophily is substantial, the estimators will lack precision. Thus, equilibrium and homophily are calculated for individual variables, not the sample at large.
For example, the recruitment tree (Figure 1) illustrates the recruitment patterns for the variable for NMEF members and non-members. Whereas similar recruitment trees can be constructed for all variables, we chose this because critics suggested there would be enclosed, ideology-based networks within and outside the association. The figure shows how the superseed, an NMEF member, recruited four other members. Two non-members were recruited in the next recruitment wave. By the sixth to seventh waves, non-members surpassed one third of the participant share. That share remained unchanged; the sample reached an equilibrium for this variable. It is generally encouraging that members and non-members appeared to recruit each other indiscriminately, indicating that the assumed polarization within the patient group is perhaps overstated in the popular debate.
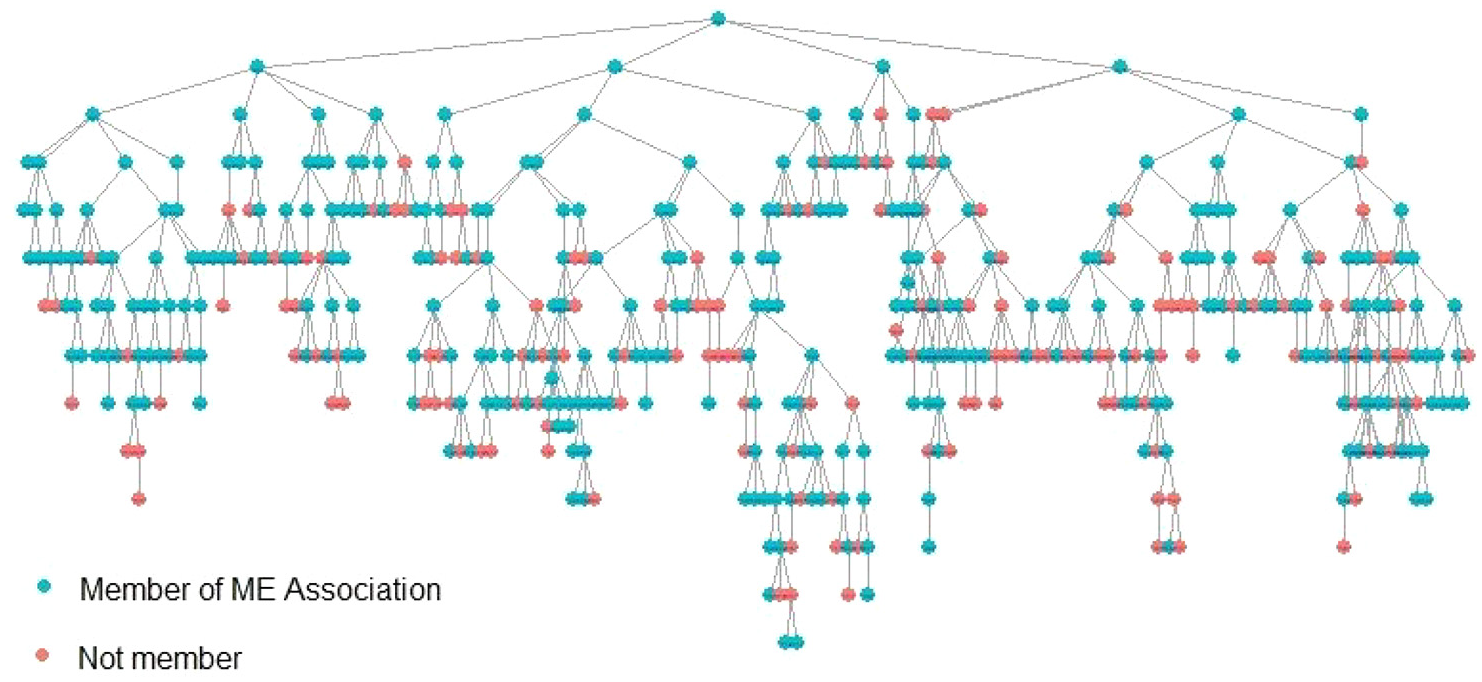
RDS recruitment tree showing recruitment patterns for members and non-members of the Norges Myalgisk Encefalopti Forening (NMEF).
The point of reaching equilibrium for members and non-members is shown more accurately in RDS with a convergence plot. Figure 2 illustrates how the distribution fluctuates around an equilibrium point of 60% before stabilizing after about 300 participants. Applying RDS estimators, non-members are estimated to make up 40% of the sampled population.
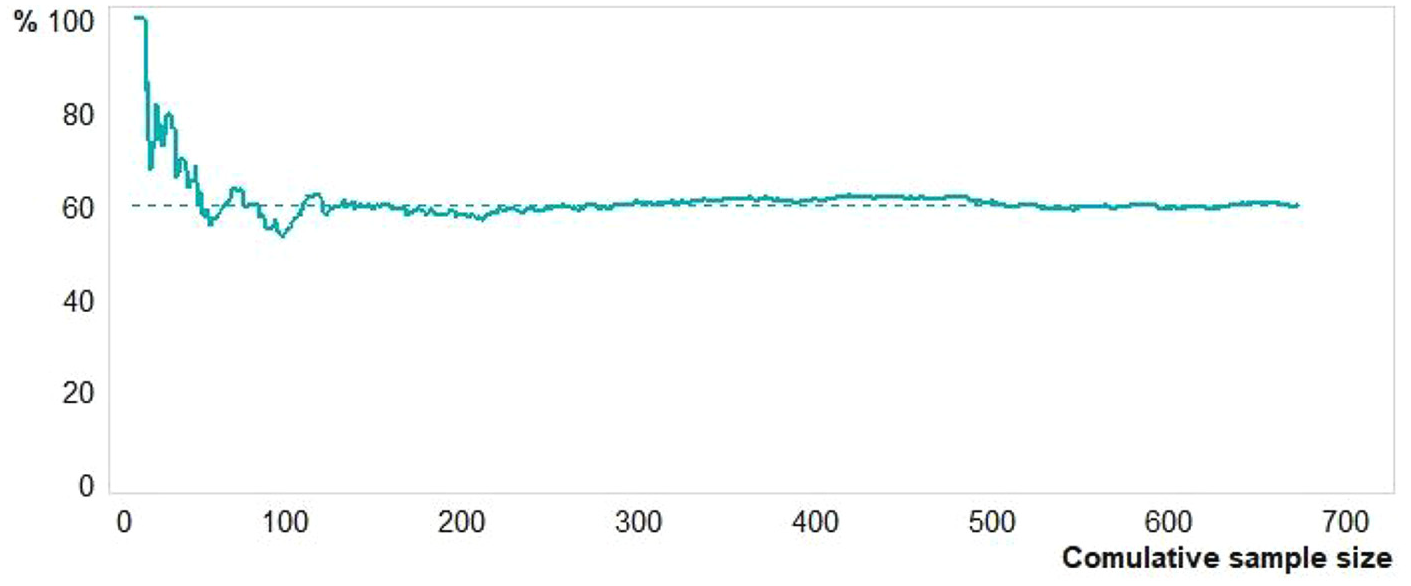
Convergence plot on the variable “Member of ME Association.”
G93.3 diagnosis and diagnostic criteria
Figure 3 shows the results of running the DePaul algorithms for the four most applied case-definition criteria for ME (Fukuda, CCC, ICC, and IOM) on the survey participant data, applying RDS II estimators. It compares the positive algorithm scores for the 494 participants with a G93.3 diagnosis to the 166 with other or no diagnoses. Almost all (584) participants scored positive for the Fukuda criteria, 558 for the IOM criteria, 474 for the CCC, and only 394 for the ICC criteria. The trend for all four groups was the same: The share scoring positive was only marginally higher among those diagnosed with G93.3 than those given other or no diagnoses. Noticeably, 26% of the participants with the G93.3 diagnosis did not meet the CCC in the DSQ-1 algorithm. (See syntax and primary data in Supplemental Material.)
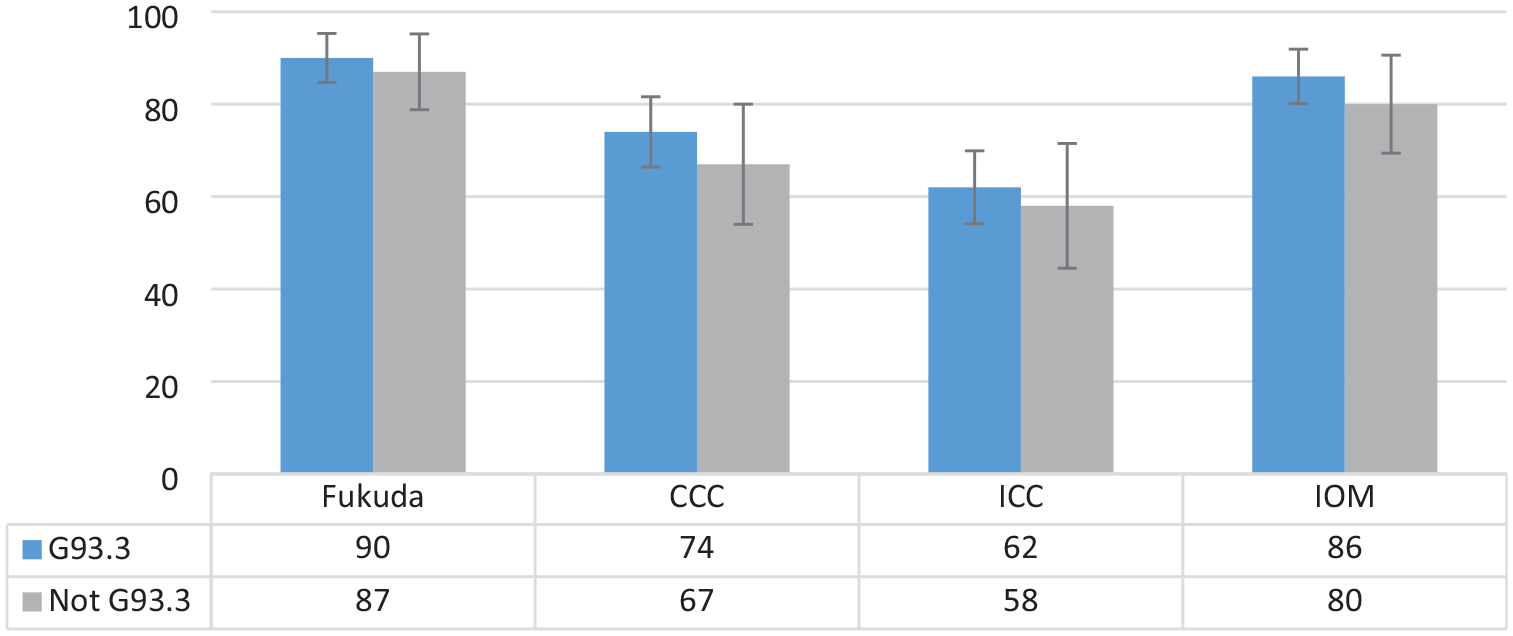
Share of participants who met diagnostic criteria for Fukuda, CCC, ICC, and IOM, comparing participants with and without G93.3 diagnoses (N = 660).
The confidence intervals suggested that the differences between the diagnosed and the undiagnosed were not very significant. However, it should be noted that standard errors in RDS are usually large due to the design of the algorithms producing the estimators. The results supported the hypothesis that under-diagnosing with G93.3 may be considerable.
Logistic regression outcomes
Among persons meeting the CCC, who gets the G93.3 diagnosis, and who does not or must wait longer? We held the CCC algorithm outcome constant and examined medical and sociodemographic factors that might affect the diagnostic process. We regressed the G93.3 diagnosis on factors related to the model outlined in the theory section (syntax in Supplemental Appendix B). The results (Table 1) supported the hypothesis that meeting the CCC in the DSQ-1 algorithm was not statistically associated with receiving the diagnosis. As expected, having a prior psychiatric diagnosis was negatively associated, and having a previous Epstein-Barr infection and rapid onset was positively associated with obtaining the G93.3. Gender was not statistically significant, whereas education level very much was. Age was negatively associated with having the diagnosis, and controlling for non-linearity by age squared yielded no significant change.
Logit: Modeling correlates to the G93.3 diagnosis (N = 660).
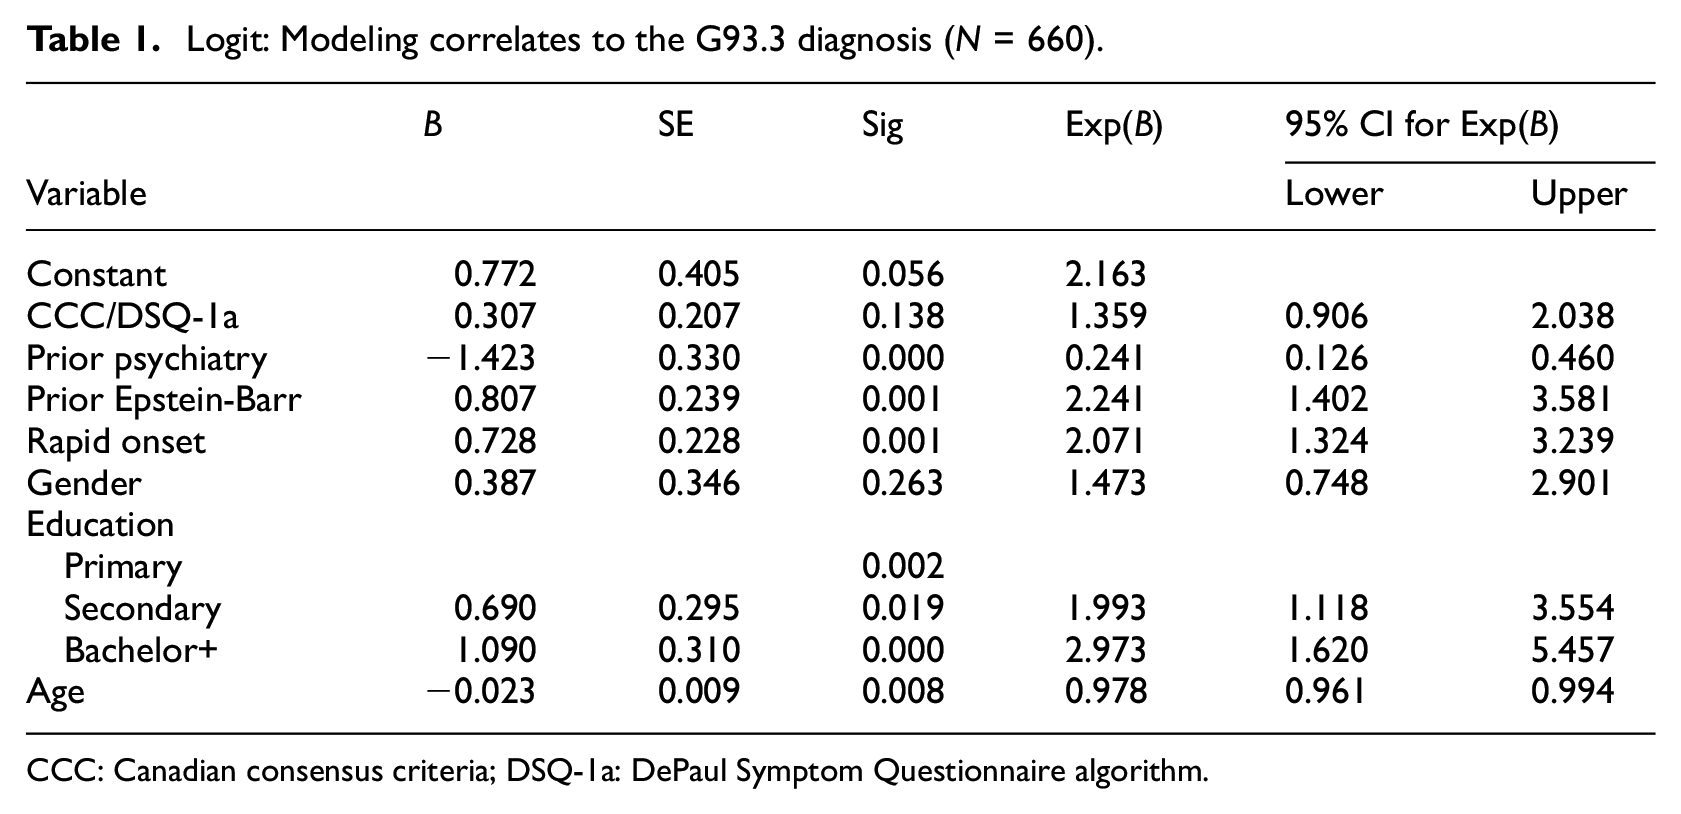
CCC: Canadian consensus criteria; DSQ-1a: DePaul Symptom Questionnaire algorithm.
Discussion
Empirical results
With other medical factors held constant, the results of our analysis support the notion that there may be considerable under-diagnosing of ME with G93.3 in Norway, assuming the CCC is the standard and the DePaul algorithms are a good identification tool. The confidence intervals suggest that the differences between the share meeting the CCC among the diagnosed and undiagnosed were not significant. A quarter of those with a G93.3 diagnosis did not meet the CCC in our assessment. This may be due to (a) over-diagnosis, (b) using diagnostic manuals other than the CCC, (c) partial recovery, or (d) exclusion errors caused by a lower specificity than sensitivity in the algorithms (Strand et al., 2016). However, the share coincides strikingly with Owe et al. (2016), who concluded that 27% of their G93.3 cases did not meet the CCC but were instead diagnosed with post-viral fatigue.
Despite the risk of false negatives from the DSQ-1, Strand et al. (2016) suggested that scoring positive on the DSQ-1/CCC produced a very high likelihood (92%) that a specialized clinician would reach the same result by examination. Our sample characteristics are very similar to those of Strand et al.; see Supplemental Appendix C for a comparison by SF-36 subscale. Assuming a positive predictive value of 92% suggests that more than two of three fatigue patients living with diagnoses other than G93.3 in the captured population might qualify for the G93.3 diagnosis. Without knowing the scope of this group, we can conclude only that this is a potentially substantial issue.
Regressing the G93.3 diagnosis on sociodemographic variables and controlling for key illness characteristics supports some hypotheses presented in the theory section. First, however, gender did not emerge as statistically significant in this model, suggesting that women and men presenting with similar medical issues were not treated differently. The finding would instead support a claim that the high female-to-male ratio of the diagnosis reflects more medical than sociological issues. Alternatively, multiple and contradictory gender-related social mechanisms could be involved (Hilland and Anthun, 2022).
Second, the association between current age and diagnostic status is challenging to interpret because older patients may have been confronted with different diagnostic practices many years ago. To gain more clarity, we accessed a user survey that included self-reported calendar years of onset and diagnosis and regressed diagnostic duration on age at onset and onset year (Supplemental Appendix D). The result could support a claim that older respondents are less often diagnosed because they met a more challenging system in earlier periods and, therefore, remained undiagnosed. Based on our results, we cannot infer that age matters when diagnosing someone who becomes ill today.
Third, personal resources, as indicated by education level, were closely associated with the likelihood of having obtained the diagnosis. Participants with education levels higher than completed primary had a higher likelihood of obtaining a diagnosis corresponding to their DSQ-1 score. The impact of education increased when the person had completed a bachelor’s degree or more. Assuming education is indicative of intellectual, social, and economic resources, this result supports the claim of bias against the socially deprived in diagnostic practices. Over-representation of those more educated in register data may then result from individuals with lower education being less capable in maneuvering the healthcare system, attributed to lower levels of health literacy combined with the stigma associated with this diagnosis (Hilland and Anthun, 2024; Jason et al., 2020; Solomon and Reeves, 2004).
Data quality
Online recruitment involves challenges in implementing the double-incentive system key to the original RDS method. In traditional RDS surveys, respondents receive one incentive to participate and another to recruit new respondents. We chose to forgo incentives in this survey because (a) there was no need to compensate for relocation costs to survey sites in an online survey and (b) we could not identify the respondents face-to-face online, and incentives could have introduced bias in attracting ineligible individuals motivated by the reward. We were less concerned with potentially lowered response rates, assuming a sense of solidarity or mission to speak out would drive participation in this population. Thus, we relied on a combination of topic interest and support as incentives to encourage participation and recruitment throughout the survey period (Roose et al., 2007).
Even without traditional incentives, approaching this patient group with an RDS survey proved successful in terms of response rate. We attribute this accomplishment mainly to our investment in patient communication before and during the survey, earning the community’s trust. The sample size of 660 was good for estimating sample distributions, although more cases could have reduced standard errors. Equilibrium in responses was generally obtained after 150–250 participants on key variables, and there were no detectable bottlenecks (Kielland et al., 2023). The polarization in the ME debate seems sharp in the media, often involving patient organizations on one side and part of the medical community on the other. Such a divide, however, was not apparent among the research participants; NMEF members and non-members systematically recruited each other.
The RDS method has traditionally been used for face-to-face interviews. However, an online RDS was preferable for an ME-affected population. Calling persons with ME into specific locations for face-to-face interviews would be hard on them and especially exclude those with moderate to severe illness. Physical RDS also geographically constrains recruitment: Distance and travel time to the survey site are assumed to correlate inversely with respondents’ willingness to participate. An online RDS can be used to obtain a nationwide sample when networks are distributed nationwide, as they would be for a primarily digital population.
Population groups vary in the degree to which they are digital. In Norway, previous studies indicated that ME-affected groups are among the most active patient groups on social media as the disease leaves most members with few other accessible social arenas, and one study suggested the online fatigue syndrome forums had more than 10 times the relative activity of similar forums (Knudsen et al., 2012; Ytre-Arne, 2016). However, replicating the method in less technologically developed societies or with substantial populations living off-grid would require caution in assessing risks for subgroup exclusion.
The external validity of the obtained survey sample is associated with three types of caution. First, its inclusion criteria explicitly excluded participants capable of full-time work or study. Because the survey intended to utilize the DSQ-1 algorithms to identify subpopulations that met the CCC and Fukuda criteria, individuals able to work full time would likely not have met either criteria at the time of the survey. It implies, however, that the sample excludes cases of potential recovery between illness onset and the time of the survey. Nevertheless, a recent Norwegian register data study reaffirmed the assumption that recovery to full-time work is very rare in the patient group (Kielland and Liu, 2024) and supported Cairns and Hotopf’s (2005) metastudy, assuming a recovery rate of approximately 5%.
The second and, we believe, most significant limitation of our sample concerned persons who were too sick to respond and had no one to help or complete the questionnaire on their behalf. The recruitment chains most likely stopped when they reached these patients. This group is hard to reach with any sampling approach. However, recruitment by someone in their social network may have encouraged more members of this group to participate than a standard online survey or being drawn from a register would have. It is reasonable to assume that the observed over-representation of NMEA members in the sample is closely related to the patients’ capacity challenges and that the capabilities to complete a lengthy survey and to organize are closely associated.
Relative network size is one issue RDS can deal with through the estimator algorithms. However, persons in the third group—those with no acquaintances or social media contacts with fatigue illness—fall victim to the RDS methodology because they would have zero probability of being recruited. In addition to socially isolated patients, this could be the case for persons who consider ME to be maintained by social contagion and, thus, actively avoid contact with other affected persons or any activities focused on the illness and its symptoms—such as answering a survey like this. Minimal research substantiates such a phenomenon, and no concrete data support the assumption that such a group of any significant size exists. However, some of the most critically ill patients may not have any interaction with others in the target group, and these most severely ill patients remain our primary concern.
Patient communication
Engaging with the target group before and during the survey became essential to reduce non-response rates and increase the target population’s willingness to complete the form. Although time-consuming, such communication paid off professionally in improved participation and rich contextualization. It was reassuring to experience how concern and initial criticism turned to support as we took the time to listen to and explain why our somewhat untraditional research approach had methodological rationale and strengths—and admitted its weaknesses.
A YouTube informational video explaining the survey approach, purpose, and content to potential participants was viewed 568 times; a shorter excerpt was viewed an additional 81 times. The project’s Facebook page had approximately 1200 followers. The 14 FAQs with answers posted as we received new queries were each shared by different patient groups to sites unavailable to the research team. We had 32 messenger exchanges with ME-affected persons and their caregivers and additional email and phone exchanges.
The community shared four types of concerns. The first was related to the broad eligibility criteria for participation—persons with severe fatigue. They communicated that such broad inclusion criteria in earlier studies had contributed to trivializing the experiences and outcomes of those who met the stricter case-definition criteria for ME. Their questions allowed us to underscore that the collected data would later be reclassified on diagnostic criteria.
The second category was concerns, some well-founded, that the criteria would exclude certain groups and individuals. Like most surveys, we had no way to obtain participation from the sickest and loneliest, who had no one to help them complete questionnaires. Further, we would miss those with no social contact, physically or online, with others with fatigue because they had no one to recruit them.
The third type was concerns that certain segments of the ME population, notably those within the NMEF, would deliberately exclude non-members from participating for ideological reasons. Here, our rationale was harder to explain: We knew that RDS surveys tended to cross subgroup boundaries and converge toward population representativity and that RDS estimators can adjust for in-group recruitment unless there is a bottleneck. However, we were reassured because we could document this happening also in this survey (Figures 1 and 2).
The last group of concerns came from persons who would have liked to participate and felt excluded when not recruited. The NMEF regularly publicizes user surveys in which anyone can take part. It was challenging to explain in plain language that getting representative estimates does not require asking everybody but following a systematic approach to data collection. Reassuringly, concerns about possible exclusions came from presumably both “sides” of the debate.
Conclusion
We would like to highlight five implications of this study. First, assessing ME prevalence based mainly on population health-register data for ICD-11 code G93.3 will produce significant underestimates because many who meet the case definition criteria have not (yet) received the diagnosis. Importantly, health-register data are likely to under-report on more socially disadvantaged persons.
The second implication relates to the healthcare system’s efficiency vis-a-vis this patient group. Erroneous and late diagnosing may waste public resources and lead to misguided and sometimes harmful recommendations, potentially producing worsened health outcomes for those concerned. Caution should be exercised, especially before giving persons with possible ME a psychiatric diagnosis without being certain. Misdiagnoses may delay correct diagnosing and lead to treatment advice counterproductive to stabilizing the illness.
Third, the positive association between education level and diagnosis, illness features held constant, indicates a healthcare system that discriminates between patient groups based on sociodemographic background. This should raise a red flag to the public services about an illness disproportionally affecting an already discriminated patient group—women.
The fourth is a recommendation for practice. The results broadly suggest the usefulness of institutionalizing a collaboration of multi-clinician care teams comprised of professionals, such as psychiatrists, therapists, immunologists, general practitioners, and neurologists, who can cross-check the patient early in the diagnostic process. Such a multi-disciplinary approach could ensure better patient assessment, lead to better treatment over time, and ultimately help identify a biomarker for ME.
Finally, we recommend that researchers focus especially on the discriminated lower socioeconomic groups identified as underserved. Such research could help strengthen knowledge of how disadvantaged patient groups—beyond those affected by ME—can be better represented in research and made more visible to healthcare professionals and other providers. Unorthodox sampling approaches like RDS may prove valuable in this endeavor.
Footnotes
Acknowledgements
We would like to thank the Research Council of Norway for generous funding under the program BEHOV-ME, our person-protection ombudsman, the Norwegian Center for Research Data (now SIKT), and the Regional Committees for Medical and Health Research Ethics, for advice and support. We also thank Dr. Karl E. Conroy for quality checking all DSQ algorithms estimates, and Donna Magnani for editing.
Data sharing statement
The current article is accompanied by the relevant raw data generated during and/or analysed during the study, including files detailing the analyses and either the complete database or other relevant raw data. These files are available in the Figshare repository and accessible as Supplemental Material via the Sage Journals platform. Ethics approval, participant permissions, and all other relevant approvals were granted for this data sharing.
Declaration of conflicting interests
The authors declared no potential conflicts of interest with respect to the research, authorship, and/or publication of this article.
Funding
The authors disclosed receipt of the following financial support for the research, authorship, and/or publication of this article: The Research Council of Norway (NFR# 272674).
Ethics approval
Person-protection ombudsman The Norwegian Center for Research Data (NSD#391132), The Regional Committees for Medical and Health Research Ethics (REK #7345).
Informed consent
Informed consent for participation was requested based on provided information about project/publication objectives.
References
Supplementary Material
Please find the following supplemental material available below.
For Open Access articles published under a Creative Commons License, all supplemental material carries the same license as the article it is associated with.
For non-Open Access articles published, all supplemental material carries a non-exclusive license, and permission requests for re-use of supplemental material or any part of supplemental material shall be sent directly to the copyright owner as specified in the copyright notice associated with the article.