
Abstract
Smart device apps can be used to promote physical activity, decrease sedentariness, or increase self-efficacy to get active in college students, possibly reducing their obesity risk. This study assessed associations of college students’ smart device use with body mass index (BMI), expecting associations between physical activity parameters and self-efficacy with BMI, moderated by app type. In an online survey, app data of a week from student’s devices, weight, height, physical activity, and self-efficacy to get active were collected from 120 students. Apps were categorized “physical activity,” “physical activity with a self-efficacy component,” or “unrelated.” Use time of physical activity apps is not associated with BMI, while self-efficacy app time show negative and unrelated app time positive associations. Self-efficacy may be an important component in app design for obesity risk reduction of college students. Test economy was low, which is why future studies need to concentrate on better data extraction methods.
The “Internet of Things” or “Internet of Everything” is created by the interconnectedness of the rapidly rising number of smart devices (Atzori et al., 2010; Evans, 2011; Masoud et al., 2019; Van Kranenburg, 2008). Among smart devices, smartphones have gained such popularity that almost every adult carries and uses one (Massoomi and Handberg, 2019). Around 6.4 billion people were in the possession of a smartphone in 2022, predicting 7.7 billion for 2028 (Statista, 2023). Due to similar characteristics and functionalities, smartphones, smartwatches, and tablet PCs can be considered to belong to the same sub-group of smart devices (Masoud et al., 2019). They have several built-in sensors that allow for extensive data collection (Masoud et al., 2019) and that their functions can be personalized by installing different applications, that is, “apps” (Castledine et al., 2011). However, their use can have negative outcomes: college students’ smartphone use is associated with higher sedentariness and lower physical activity and low activity levels are more likely to increase smartphone use (Grimaldi-Puyana et al., 2020). More than 60% of young adults between 20 and 39 years are overweight or obese with a BMI higher than 25 (Ogden et al., 2014). Excess weight gain happens most rapidly in young adults (Sheehan et al., 2003), showing associations with future weight gain (Malhotra et al., 2013), cardiovascular risk factors, diabetes (Lloyd-Jones et al., 2007), and psychological distress (Carr and Jaffe, 2012). This body of research indicates that young adults are prone to having low physical activity levels and high sedentariness levels possibly caused by the use of smart devices.
Physical activity and smart device use of college students
University students form a specific subgroup of young adults, as the college years often leads to the adoption of unhealthy behavior and negative consequences for body composition. These include low physical activity levels, increased sedentariness, poor sleep, and diet quality (Huang et al., 2020; Keating et al., 2005; Nelson et al., 2008). Associations between low physical activity levels of students and a high body mass index (BMI) were shown (Küchelová et al., 2014), with smartphone use being both a barrier to physical activity (Penglee et al., 2019) and being associated with overweight (Hammoudi et al., 2021). Interventions to tackle obesity in this population are needed (Fedewa et al., 2014). These need to promote physical activity, decrease sedentariness, counteract, and prevent obesity, using the technologies that are pervasive in the student population (Smith et al., 2011). As digital natives, college students report regular smartphone use (Bennett et al., 2008). However, this does not always mean that this leads to obesity. Fitness apps have the potential to impact public health (Sullivan and Lachman, 2017). Apps can be designed to promote healthy behavior, for example, by using the camera to take pictures of food items and the accelerometer to track physical activity (Gao et al., 2009). In a 2-year randomized controlled trial on overweight college students, the use of social and mobile tools led to short term fat loss after 6 months compared to a control group. However, no significant effects were obtained after 12 and 24 months (Godino et al., 2016). In line with this, mobile phone interventions were effective in increasing physical activity and decreasing sedentariness of adults (Kendzor et al., 2016). To successfully promote physical activity, feelings of confidence to initiate activity have been used (Quinn et al., 2015; Sports Council and Health Education Authority, 1992). Furthermore, self-regulatory techniques, for example, self-monitoring, goal setting, action planning, and feedback, show positive associations with behavior changes regarding physical activity (Michie et al., 2009, 2013). This makes “self-efficacy” important for promoting physical activity and decreasing sedentariness of college students (Barkley et al., 2017).
Perceived app classification
The existing literature suggests that smart device use can have positive effects on body composition via self-efficacy and/or physical activity promotion and a reduction of sedentariness. However, these studies focused on specific interventions or smartphone use in general. With the emergence of apps dedicated to healthy behavior (Gao et al., 2009), students may use a variety of apps with different functionalities that promote physical activity, decrease sedentariness, or improve self-efficacy to get active. What has not been considered is that students may use apps in the context of physical activity or derive self-efficacy benefits from apps, not clearly intended as such. For instance, social media can increase activity by being a social motivator to reach one’s goals (Foster et al., 2010). In this study, apps students perceive as self-efficacy-promoting are defined as “apps with a self-efficacy component.” Self-perception is central for the definition, since apps and their content can have different intended uses for different students. Some may derive self-efficacy boosting effects from social media apps (Foster et al., 2010), while others may use them solely for entertainment. By making a subjective distinction between physical activity apps, apps that promote self-efficacy to get active and other general apps, different effects on activity, sedentary behavior, and self-efficacy can be expected depending on the perceived app category. This gap in the current research needs to be addressed, in order to broaden the understanding of app design for college students in obesity management and activity promotion.
Aim and hypotheses
This study’s aim is to answer the question whether app use is associated with body mass index of college students depending on the type of apps used. The time and frequency of activation of apps used in a physical activity context (“PA”) and the time and frequency of activation of apps used in a physical activity context with a self-efficacy component (“PA-SE”) can negatively explain variance of BMI, while the time and frequency of activation of unrelated apps does positively. Physical activity parameters negatively explain variance of BMI, while sedentariness does positively. Self-efficacy to get active negatively predicts BMI. A mediation between BMI and app use is assumed: (1) The time of PA apps and PA-SE can positively explain variance of physical activity parameters, while use time of unrelated apps do negatively. (2) The activation time of PA apps does not explain variance of self-efficacy, time of PA-SE apps do positively and parameters for unrelated apps negatively. (3) The activation time of PA apps and of PA-SE apps used negatively explain variance of sedentariness, while the time of unrelated apps positively explains variance of sedentariness.
Methods
Data background and sample characteristics
Recruitment of participants was accomplished between January and October of 2023 via an online survey. The main distribution channels were internal e-mailing lists of the University of Graz (Austria, Europe), social media (Facebook, Instagram), and word-of-mouth advertising. The University of Graz being the main institution this research was conducted, an internal service for distributing surveys to all students was used twice, in January and in May. By word-of-mouth advertising, additional students in two master’s degree programs of the Carinthian University of Applied Sciences (Austria) were recruited. These programs were part time programs, adding exclusively working students as sub-population to the sample, compared to the general student population at the University of Graz. Due to primarily focusing recruitment on these two institutions, the majority of the sample possibly consists of students from those two institutions, with only a small percentage of other students coming from other Austrian, German, or Swiss universities, which were reached via social media. No item in the survey asked for students’ institutional affiliation, as the initial recruitment strategy was focused on the University of Graz alone. Since test economy had to be ranked a less important priority over getting complete app-data from participants, the questionnaire had a mean time of 33.82 minutes to be completed. Since no compensation was offered to students, involvement was low; also explaining the recruitment timeframe from January to October. Although not planned at the beginning, other channels and institutions were added to the strategy, resulting in the sample analyzed in this study. Due to the recruitment difficulties, inclusion criteria only involved confirming the informed consent and data security statement as well as having a valid enrollment at one university. The sampling technique can be described as non-probability sampling, due to word-of-mouth recruiting and selected social media groups not giving each student at the target institutions the same chance to participate.
Minimum sample size was calculated via a priori power analysis. Effect sizes were assumed based on literature reviews and meta-analyses, which focused on determinants of physical activity, including self-efficacy (Amireault et al., 2013) as well as relationships between obesity and physical activity (Stoner et al., 2016). Studies involving self-efficacy and physical activity were in the moderate-to-large span for effects, while others showed small-to-moderate effects according to Cohen (1992). The overall adjusted model R2 in studies on physical activity and self-efficacy was 0.20, 95% CI = 0.14–0.27, with a high variability between studies (Amireault et al., 2013). Total effects as standardized mean differences in weight loss measures and BMI in relation to interventions such as physical activity were moderate at 0.41, 95% CI = 0.25–0.57 (Stoner et al., 2016). Following these studies, moderate effects of R2 = 0.30 were used for the power analysis of this study. Holding power constant at 0.80, regression analyses with three predictors result in a minimum sample size of 41 participants. To get a representative sample, the target minimum sample size was defined at 100 students.
Following the abovementioned recruitment strategies, 328 students clicked on the link and were forwarded to the survey’s landing page. Filtering by students agreeing to the informed consent and data security statements, 120 participants were left in the final dataset with 109 complete cases with no missing values. In this sample, 80 students were female (75%) and 30 were male (25%), with a mean age of 33 years (SD = 9.21 years). Due to the master’s programs at the Carinthian University of Applied Sciences being part time programs, a number of students in second-chance education were part of the sample. Around 23% of students were 25 years old or younger, 18% between 26 and 30, and 49% were older than 30 years; 10% of participants did not enter an age. Due to these sample characteristics, 53% of the students were working full-time, 13% part-time, 12% had no job, and others were either freelancing, only working during the holidays or being marginally employed. Out of 120 students, six participants did not enter smartphone data. This means there was no app-data available for those participants. Since they provided data on the other questionnaires, they were kept in the dataset. Among those 114 students, who filled in the app-data questions, 49% self-classified at least one of their apps as PA apps and 29% (35) of the same group classified at least one of their apps as a PA-SE app. Counting the number of entries among all students and for all week days, Instagram was the app with the highest relative number of mentions (26%). Facebook (6%), Youtube (5%), Safari (5%), and Studo (3%) followed up. Among those apps, known in an international context, Studo is an organizer app for students. Other apps with less than 3% among the mentions were Google, Chrome, Spotify, Snapchat, Phone, Camera, TikTok, E-Mail, Clock, Calendar, Gallery, Willhaben (a digital marketplace), Signal, and others (below 1%).
Procedure
This study is part of a larger research project centered on the use of smart devices among students and their physical activity and sedentary behaviors. After clicking on the link in the invitation e-mail, students were forwarded to the landing page of the survey, welcoming them to the questionnaire. The second page contained information on the study, informed consent, and data privacy statements. Continuation was only possible after confirming both.
The main block of the survey consisted of a site collecting app data. Three mandatory questions screened for having (1) a smartphone, (2) a smart watch, and a (3) tablet PC. This means participants were instructed only to fill in data for those devices they owned. By confirming, another level appeared, with input on the operating systems of the devices (IOs, Android, or other). By choosing either IOs or Android, a written and visualized instruction for accessing app-data appeared depending on the system. Several pictures screenshotted from either device showed how to access the device settings to find the app information for the last completed week (Monday to Sunday) for the top-10 apps in use. Below these instructions, a matrix to enter the app data was provided. Columns ranged from app 1 to app 10 and rows were structured on the two levels day of the week and app-information. For Monday to Sunday, participants were instructed to fill in the following parameters per app in the top-10 list: name of the app, app usage time in hours and minutes and the number of activations. Possible typos were corrected manually before data analyses on the raw data. Due to the survey software having a non-adjustable timeout issue somewhere between 20 and 30 minutes, a minority of potential participants was not able to complete the questionnaire within this time, with the consequence that data that has already been entered was deleted. They showed up as incomplete cases and were filtered, as mentioned above.
Each of the app-data input matrices had two additional questions on app usage: “Please tell us whether you use the above apps in the context of physical activity/training/sports (e.g. fitness apps, motivation from social media) and whether the content and functionality of the apps make you feel capable of being physically active (e.g. through motivating text overlays). To do this, write the names of the apps in the empty boxes provided.” Two rows with 10 fields each for “apps used in a physical activity context” (PA) and “apps used in a physical activity context with a self-efficacy component” (PA-SE) were used as input options.
Smart device data input was followed by the German short version of the IPAQ questionnaire (Gauthier et al., 2009). Focusing on the last 7 days, students were asked to fill in the hours and minutes they spent doing vigorous, moderate, and light physical activity (walking) as well as the number of days per week they spent at least 10 minutes in each of the categories. An additional question asked them about the time spent sedentary. On the next page, a questionnaire on self-efficacy in being physically active was presented to the participants. It had a scale from 1—applies very well to 6—does not apply at all. At the end of the questionnaire, sociodemographic and physiological variables (gender, age, height, weight) were assessed. Not relevant for this study, they received two additional questionnaires. The first one asked them on transportation preferences, that is, the weekly frequency of car and motorcycle use, going by foot, etc. The second questionnaire assessed the subjective environment characteristics of students’ home and study environment, asking them about how green and natural they perceive these environments.
Variables
The main outcome variable in the analyses was students’ BMI. It was calculated from height and weight measures via weight in kilograms/height in meters2.
App time and activation was calculated per app category (PA, PA-SE, unrelated). App time input was in hours and minutes. The final measures were transformed into minutes and summarized. The app parameters were averaged per app category, resulting in the variables “app time” and “n activations” for each category. Apps that were mentioned in both physical activity categories were only used for the self-efficacy measures, in order to minimize shared variance that could influence the statistical models due to collinearity.
Self-efficacy was calculated as the mean of 18 self-efficacy questions, which were developed for this research project. Reliability analyses showed a Cronbach’s alpha of 0.91. Removal of single questions did not improve the scale. Questions included “In general, I am capable of living an active lifestyle.” “I am sure that I am able to implement regular physical activity into my everyday life.” “I know how to use apps on my smart devices (e.g. smartphone) to reduce sedentary time.” “I feel capable of compensating long times spent sitting with physical activity.” or “Taking the stairs instead of an elevator is no problem for me.” The scale from 1—applies very well to 6—does not apply at all was not reversed. In the interpretation of the results, lower values correspond to higher self-efficacy.
The variables “time physically active” and “time sedentary” were calculated from the questions of the IPAQ questionnaire. This questionnaire is a standardized tool for assessing physical activity (Gauthier et al., 2009). Activity times in the format hh:mm were transformed into minutes per day and summed up across all intensity categories. Time spent sedentary was retrieved from the according question and also transformed into minutes per day. It is the equivalent to 1 MET, that is, being at rest. Based on the activity times and intensity levels, METmin/day were calculated from the questionnaire by multiplying the intensity levels’ time measures with the following factors and summing up the results: vigorous: 8, moderate: 4, light: 3.3 (IPAQ Research Committee, 2005).
Descriptive statistics for all variables are listed in the Table S1. App time and n activation variables were used as predictors in the subsequent analyses. BMI, self-efficacy to get active, METmin, time physically active, and time sedentary were used as outcomes, using the aforementioned predictors. Except BMI, these variables were also used as predictor variables in secondary analyses with BMI as outcome.
Apparatus
The online survey was set up using LimeSurvey®. Data curation was done using R (R Core Team, 2022), visualization via the ggplot2 package (Wickham et al., 2023), analyses in IBM SPSS 29®.
Statistical analyses
Pearson correlations with pairwise case completion setting were calculated. A correlation diagram is provided with color shading indicating the strength of the coefficients (Figure S1). The color scale was calculated between yellow and gray. Yellow stands for positive coefficients (r = 1) and gray for negative ones (r = −1).
Multivariate linear regression models with BMI as outcome were performed. In two models, app time and activation parameters were used as predictors, represented as three variables each for PA apps, PA-SE apps, and unrelated apps. To check for stability of the results, non-parametric bootstrapping on 1000 samples was added to the models and treated as the final results.
The same procedure was applied to regression models with BMI as outcome and physical activity and sedentary behavior as predictors. Two models were set up using either METmin or the time physically active as physical activity measure and the time spent sedentary as predictors. Since METmin were retrieved from activity time measures, the predictors were separated due to multicollinearity. Self-efficacy to get active was used as a predictor in a bivariate linear regression model.
To check for influences of app time on physical activity behavior, the app time variables were used as predictors in separate multivariate linear regression models with outcome variables METmin, time physically active, time sedentary, and self-efficacy. These models served as mediation checks for activity parameters and self-efficacy as potential moderators between app use and BMI.
Results
Correlation analyses
Pearson correlations for all variables were added and a correlation diagram was created. It is depicted in the Figure S1. Time physically active correlated perfectly with METmin, due to their variable interdependency. Strong correlations were found between n activations unrelated and time sedentary, r = 0.72, p < 0.001, PA app time physical activity and PA-SE app time, r = 0.61, p < 0.001, n activations PA and n activations PA-SE, r = 0.59, p < 0.001, and PA app time and n activations PA, r = 0.57, p < 0.001. Moderate correlations were obtained for app time unrelated and n activations unrelated, r = 0.43, p < 0.001, PA-SE app time and n activations PA-SE, r = 0.37, p < 0.001, PA-SE app time and n activations PA, r = 0.36, p < 0.001, n activations unrelated and BMI, r = 0.29, p = 0.005, and app time unrelated and BMI, r = 0.23, p = 0.026. Moderately negative correlations was found between self-efficacy to get active and time sedentary, r = −0.31, p = 0.001, n activations PA and app time unrelated, r = −0.29, p = 0.004, n activations PA-SE and app time unrelated, r = −0.22, p = 0.030, and n activations unrelated and self-efficacy to get active, r = −0.21, p = 0.044. A small effect was obtained between self-efficacy to get active and BMI, r = −0.20, p = 0.034. Other correlation analyses revealed no significant results.
Regression analyses
A multivariate linear regression model with BMI as outcome and PA app time, PA-SE app time, and the app time of unrelated apps as predictors was calculated. In a second model, the time variables were replaced by the number of activations per app category as predictors. For both models, non-parametric bootstrapping was conducted. The results can be found in Table 1. In the first regular model, app time unrelated positively explains variance of BMI, but not PA app time and PA-SE app time. Higher app time of unrelated apps is associated with higher BMI and vice versa, with no association of PA app time and PA-SE app time. In the bootstrapped first model, PA-SE app time negatively explains variance of BMI, but not PA app time and app time unrelated. No variance of BMI can be explained by the predictors of the variables n activations in the second model.
Multivariate regression models predicting BMI of students, using app-time variables as predictors.
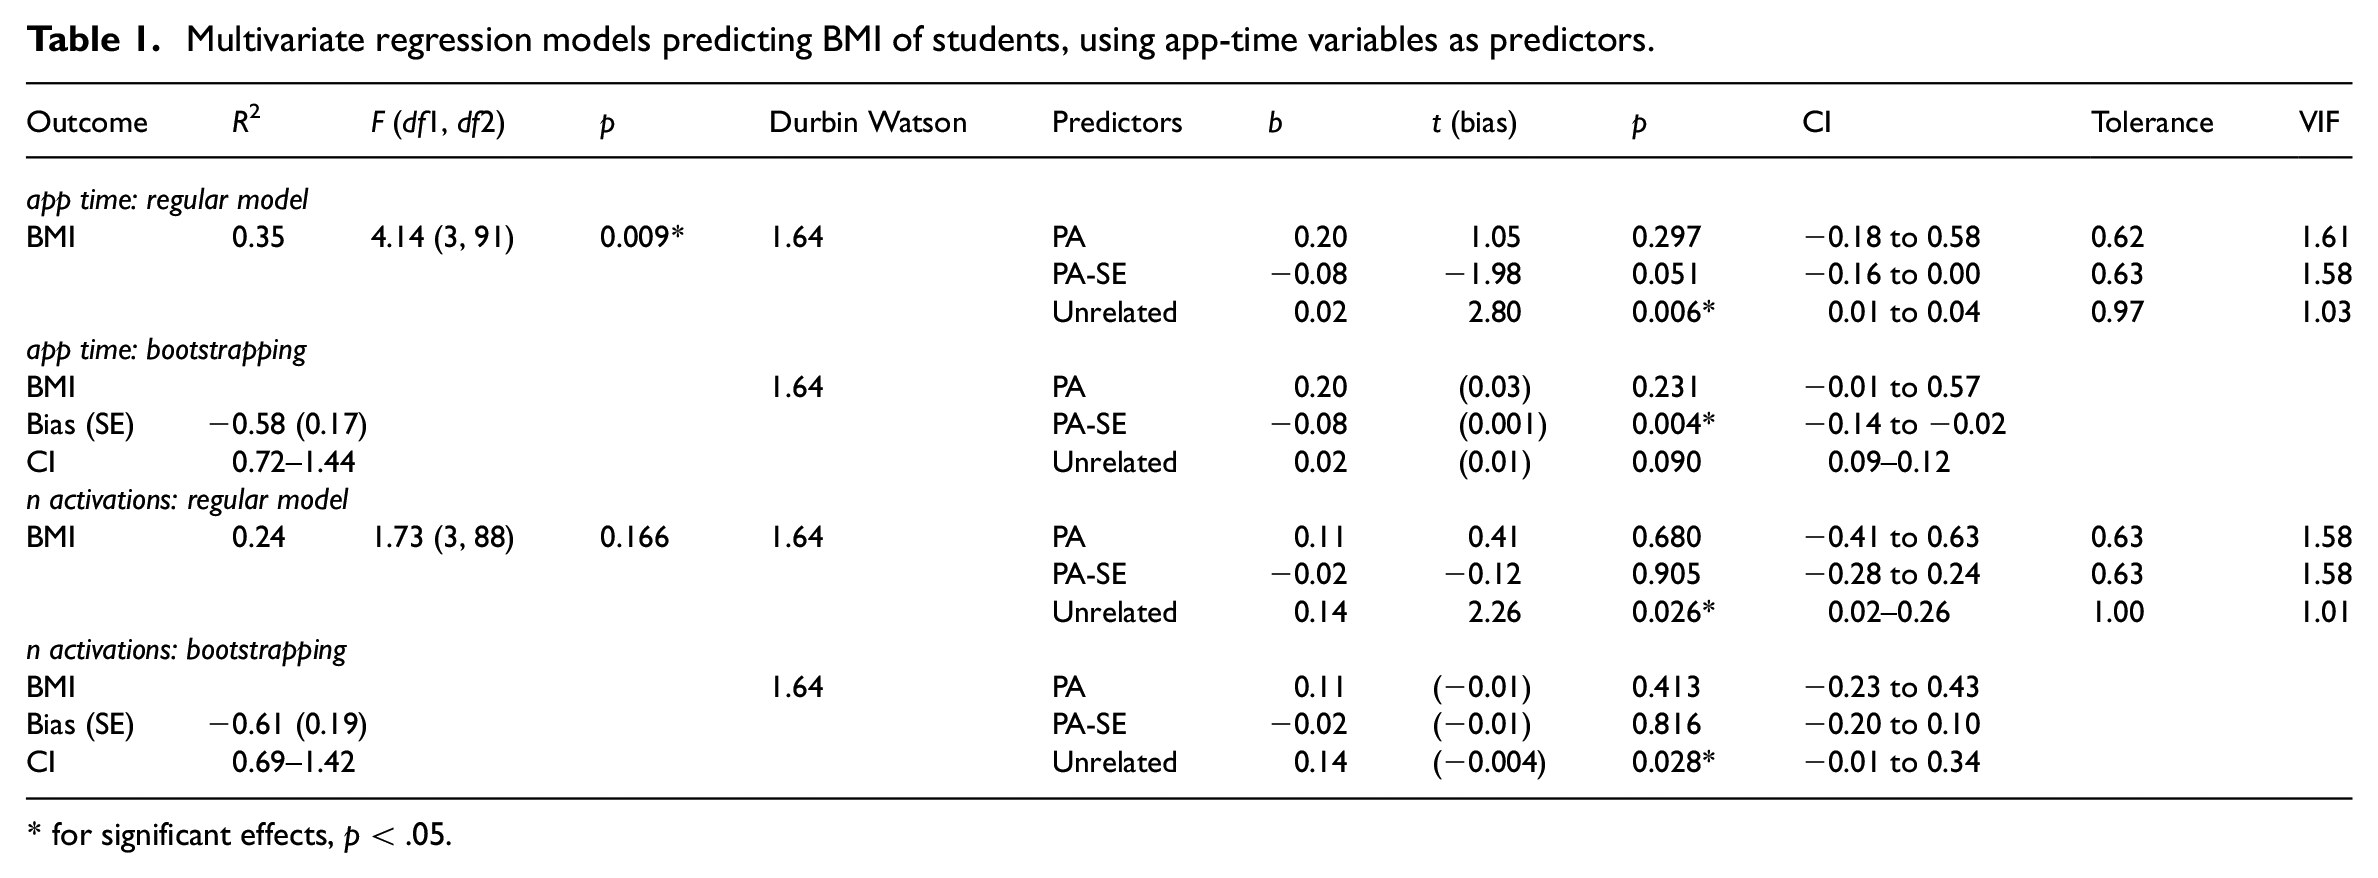
for significant effects, p < .05.
Multivariate regression models with BMI as outcome were calculated. The activity variables time sedentary and either time physically active or METmin were used as predictors. A bivariate linear regression model with self-efficacy as predictor was added. Bootstrapping was performed for each model. The results are shown in Table 2. No variance of BMI can be explained by time sedentary, time physically active and METmin. Self-efficacy to get active negatively predicts BMI in the regular model, but does not in the bootstrapped model. In the regular model, app time unrelated positively explains variance of time sedentary, but not PA app time and app time unrelated. The bootstrapped model does not show any significant influences. In three models, no variance of (1) time physically active, (2) METmin, and (3) self-efficacy to get active can be explained by PA app time, PA-SE app time, and app time unrelated.
Multivariate regression models using activity parameters and self-efficacy either as predictors or outcomes.
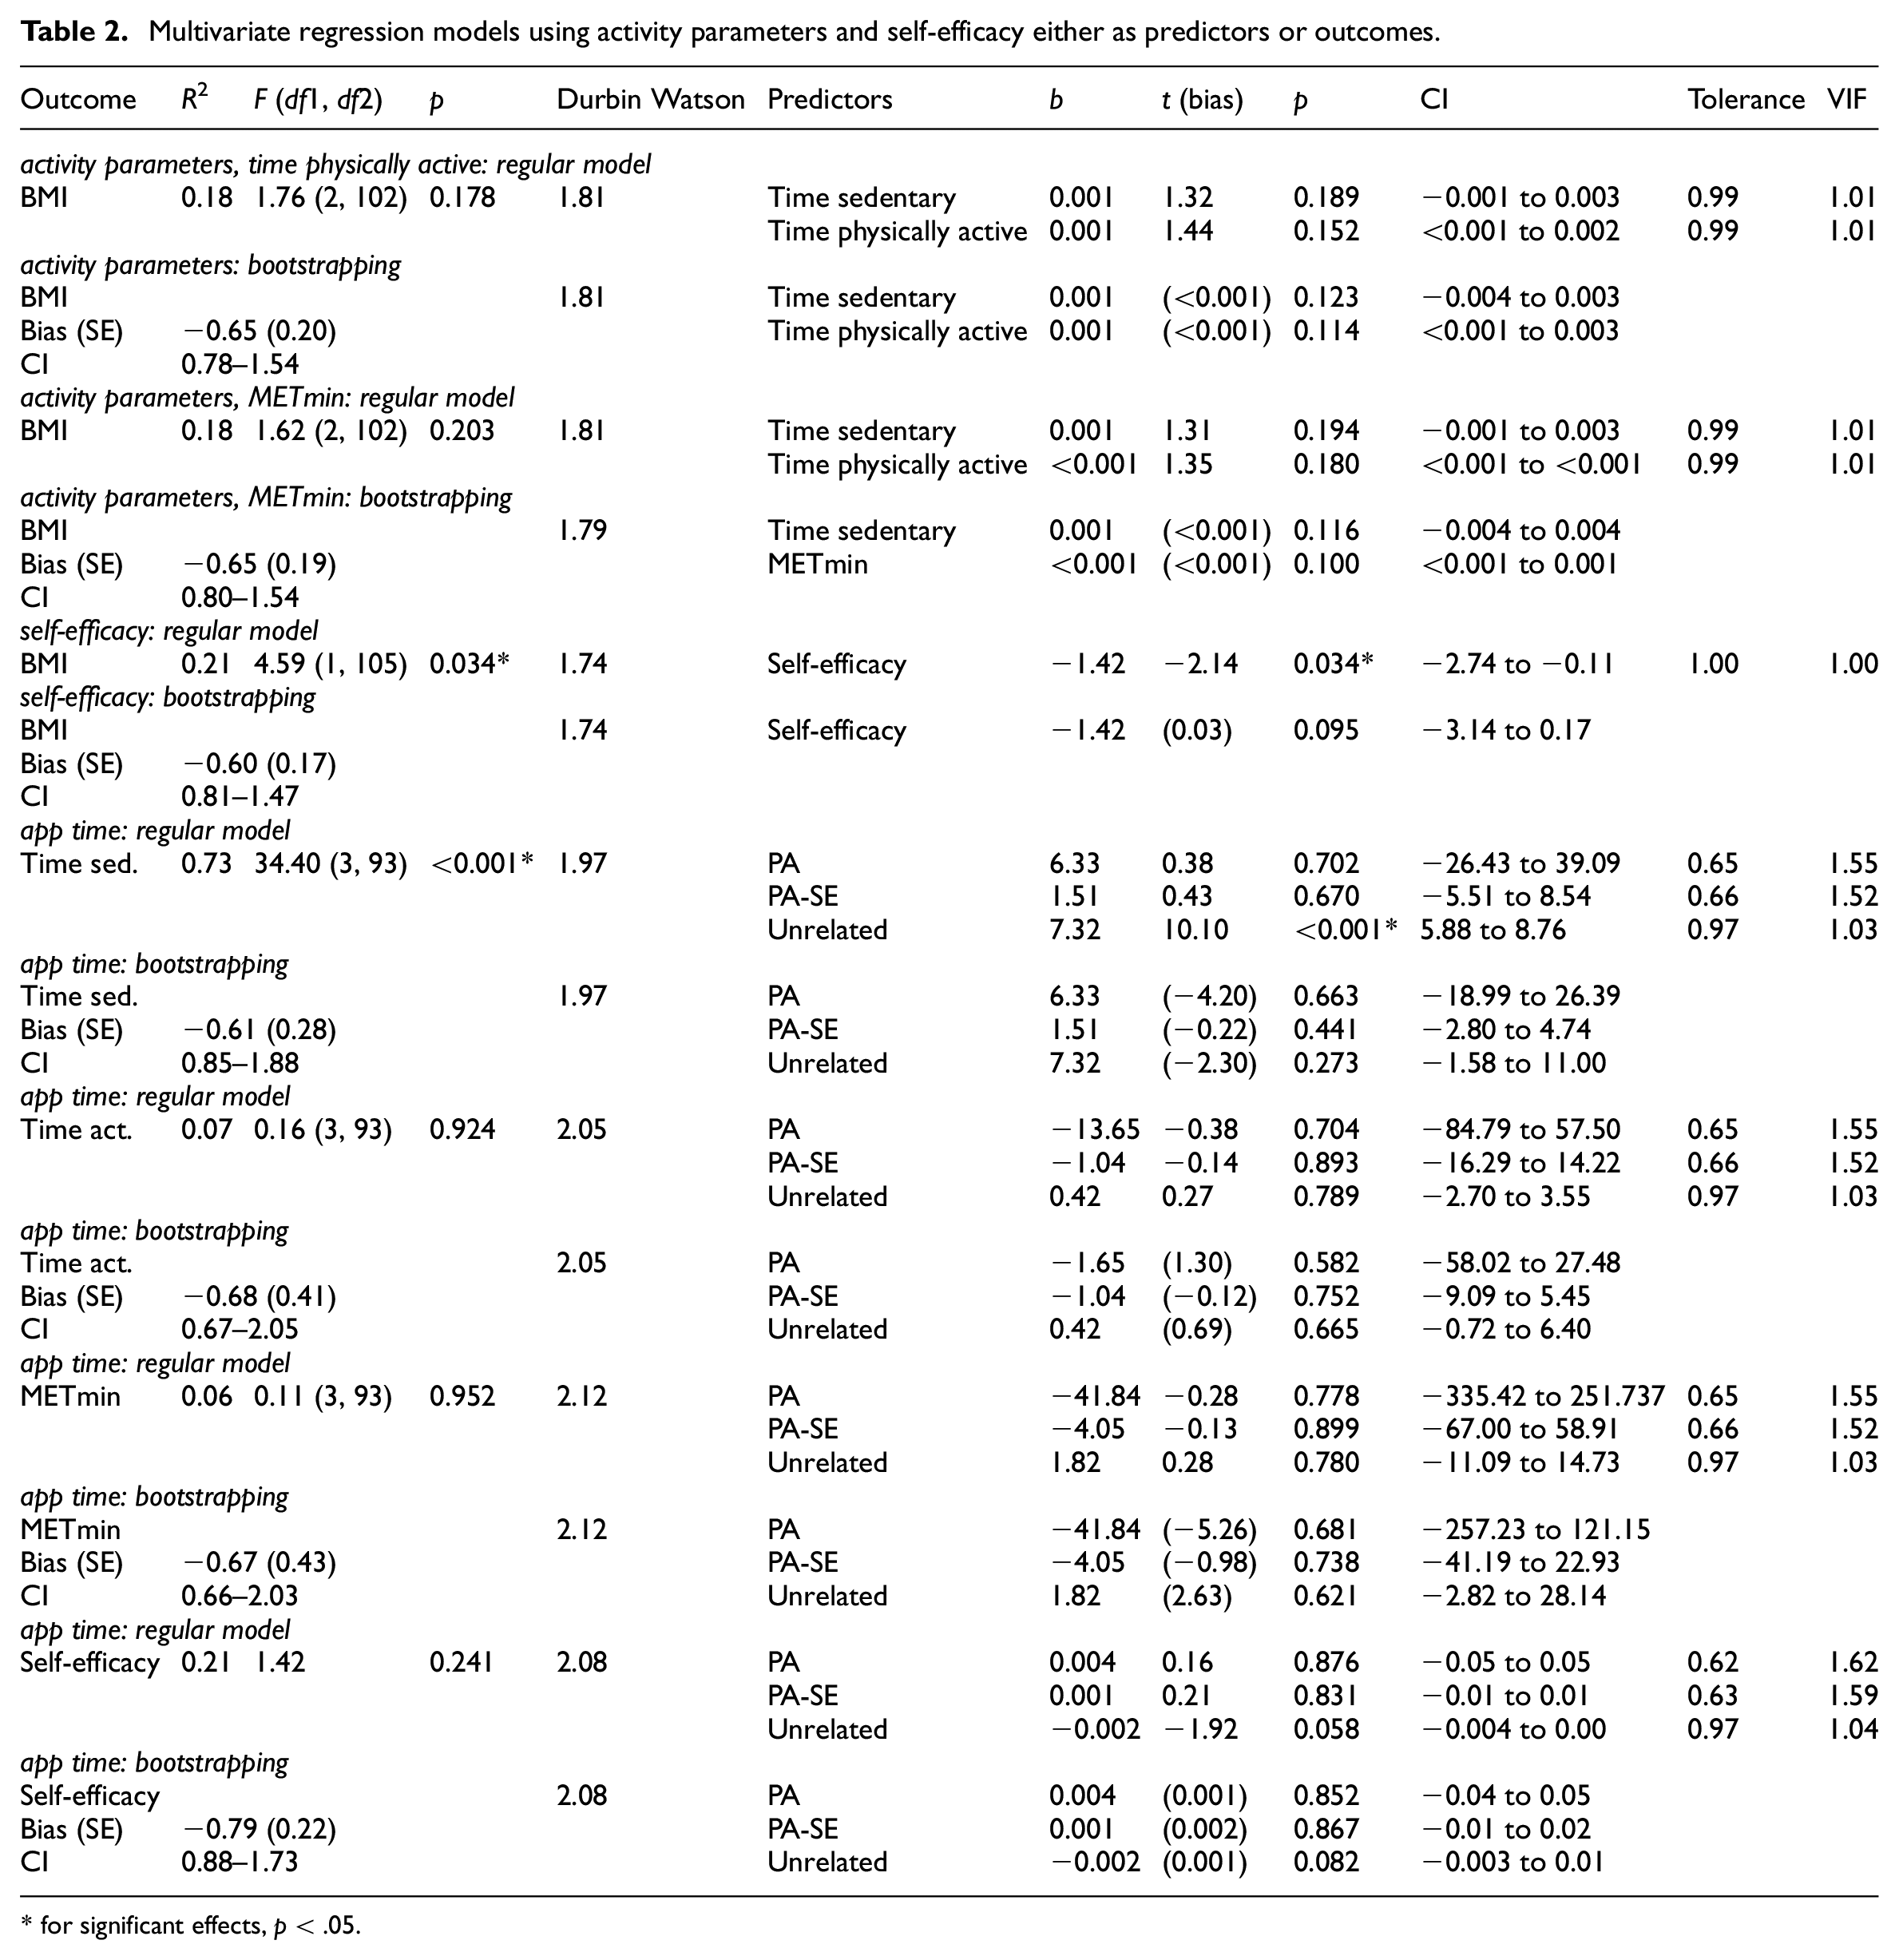
for significant effects, p < .05.
Discussion
App usage and BMI
This study’s goal was gathering information on the association of app use with BMI of college students depending on the app category. This was done by having college students access the app data in their smart devices and to enter it into an online survey.
Contrary to the expectations, the PA app time did not explain variance of BMI. Time of PA-SE apps was negatively associated with BMI, marginally before bootstrapping and significantly after bootstrapping. Unrelated app tie was positively associated with BMI only before bootstrapping. Therefore, it is assumed that PA-SE app time has an influence on BMI, while the time using unrelated apps has none. However, in the models using the number of app activations as predictors, only the number of activations of unrelated apps was positively associated with BMI. Use time of unrelated apps seems to be less important for BMI than how often students pick up their devices to open unrelated apps. This makes sense, as previous findings show that people use apps repeatedly, but for brief moments, between other activities (Morrison et al., 2014).
In general, these results may be explained by smart devices tracking screen time instead of true app activation time. It needs to be considered how smart devices generate their time readings. In the operating systems covered in this study (Android and IOs), the time an app was used represents the screen time of an app. This means that the time is only captured as long as the screen is on. Especially PA apps rely on passive tracking functions, for example, GPS tracking during a run (Antón and Rodríguez, 2016). To activate and use such passive functions, using one or a low number of activations prior to activity can be enough to set up the apps’ functions. The screen then goes to standby during the actual activity, while no further screen time or activations are registered. As comparison, to make a PA-SE app work, there needs to be a way to give users feedback, potentially using the screen; for instance, for displaying motivating text messages (Nurmi et al., 2020). Therefore, screen time for PA apps is a worse predictor in regression models than for PA-SE apps.
Physical activity parameters and self-efficacy
The physical activity parameters METmin, time physically active and time sedentary could not explain variance of BMI, both before and after bootstrapping. Self-efficacy to get active in a separate model was negatively associated with BMI, but only before bootstrapping. Based on previously reported associations of physical activity and sedentariness with obesity (e.g. Hu, 2003; Rippe and Hess, 1998) as well as self-efficacy to promote activity as mediator in physical activity interventions (e.g. Olander et al., 2013), associations were expected in this study. The lack of associations cannot fully be explained, but one influencing factor may have been the sample composition. With the majority of participants working full-time and only around 12% having no job, variance may be compromised in that workers show higher times sitting and a higher obesity risk than others (Brown et al., 2003; Mummery et al., 2005). The high number of working students in the sample may sit more than others, lacking physical activity and influencing the results.
The app use time in any of the categories was not related to physical activity parameters or self-efficacy after bootstrapping. However, app use time of unrelated apps had a very strong significant association with the time spent sitting with an R2 = 0.71 in the overall model, which was absent after bootstrapping. This would indicate the lack of mediation of the associations of physical activity parameters and self-efficacy with BMI through app use (app use à physical activity à BMI). Since the outcome variables may suffer from limitations attributable to the sample composition, a possible mediation effect cannot be ruled out.
Limitations
Due to the low-test economy in this study, recruitment had to be extended over several months and institutions, affecting sample size and composition. The mean age of 33 years reflects the atypical student characteristics in this study. In Austria, students graduate from secondary school somewhere between 18 and 20 years, entering the university system between 18 and 21 years. In 2022 at the Austrian general universities (universities of applied sciences excluded), around 25% of men and 20% of women were in the age group of 30 years+ (Federal Ministry of Education, Science and Research, 2023). This means that 75%–80% of the students were younger than this. In the sample, the number of working students was high, affecting the results due to the possible multimodality of distributions in the variables. Generalization of the results should still be possible to a greater student population than 20%–25% as reflected by the age groups.
Using the effect sizes found in this study at R2 = 0.35 and 0.20, power in linear regression analyses with three predictors in a sample of 120 students was at 0.99 and 0.98 respectively. Degrees of freedom in the analyses show lower values for complete cases (min = 88), with an effective sample of around 90 in most analyses. Inserting the same values with a sample size of 90 this results in a power of 0.99 and 0.95. This is still high enough to detect effects of this size. A possibility to account for the atypical sample would be removing full-time working students. Filtering those and narrowing down the sample to half the students would have compromised power to 0.74 (assuming around 60 students) and 0.61 (assuming around 45 students) to obtain an effect size of R2 = 0.20. Therefore, systematically removing cases was not considered meaningful. The main reason for the missing values may be due to test economy, which may have been responsible for missing entries. Since the app information boxes were displayed at the beginning of the survey, most of the time was spent filling them in via repetitive tasks, possibly affecting students’ motivation to continue. Therefore, the IPAQ or the self-efficacy questionnaire may not have been completed, leaving missing values for the according variables.
Theoretically, the timeout issue could have affected the database and results in that only people, who were quickly enough, could fill in the questionnaire. Among the 328 students, who clicked on the survey link, 139 questionnaire entries ended on the app data entry screen and 10 people had a timestamp, that indicates that they spent more than 5 minutes on this page. About 117 students spent 1 minute or less on this page. It is not clear, whether the timeout error affected the generation of the timestamps. Assuming that the timestamps are somewhat correct when the timeout occurred, only a minority of around ten people was affected. This means data of 10 students, who spent too much time filling in the questionnaire, is missing. Reasons are not clear why it took some students longer than others to fill in the questions. Although it can be assumed that some of them did not have the technical skills, it also makes sense that they just had to leave the screen, for instance due to a phone call or other people in the room, which made them pass time and the timeout error more likely to occur. After all, due to a potentially smaller number than 10 students, who could not finish the survey because of their technical abilities, no substantial changes in the results are expected.
The study was cross-sectional, making it impossible to assess the direction of causality. Therefore, we cannot establish whether app use has an influence on physical activity parameters and BMI. It can also not be concluded whether physically active or leaner people have differences in their app use (time).
It needs to be considered that other variables not assessed in this study can have an impact on BMI. Studies on college students identified factors such as academic stress (Chen et al., 2020), consciously avoiding fat and cholesterol, smoking, childhood physical abuse (Desai et al., 2008), low dietary risk knowledge, suffering from depression, sleep duration, and younger age (Pengpid and Peltzer, 2014), which show differences per gender (Desai et al., 2008; Pengpid and Peltzer, 2014). Each dimension may be present to a different degree among the participants, for example, younger age is less common than in other samples, but can be expected at a random rate. Although these factors may add to the variance not explained in this study, most of them may not have a systematic impact on the results, for example, smoking, or are similar among most participants, for example, academic stress.
Future outlook
Data collection was done using an online survey platform. In order to get reliable measurements, participants had to gather app data of the top-10 apps they used for each day of the week. With a mean duration of more than 30 minutes to complete the survey, what is needed are technologies to directly export the app data from devices in order to improve data extraction and test economy. By being able to focus on more typical students than in this sample, more of the expected effects may be observed. Future works should concentrate on said extraction methods and look at more representative student samples as well as sub-groups in the student population. As this study suggests, there may be differences between working students and general students in their physical activity behavior depending on app usage.
Conclusion
This study aimed at gaining insights into app use and BMI of college students depending on app category. Results showed that time of using PA apps, PA-SE apps, and unrelated apps can have different associations with BMI. This study suggests that self-efficacy may be an important component of app design to decrease the obesity risk of college students. Future works will need to focus on both a more efficient data extraction technique for smart-device based app data and more representative samples as well as different sub-groups of the general student population.
Supplemental Material
sj-docx-1-hpq-10.1177_13591053241258254 – Supplemental material for Associations of smart device apps with and without a perceived self-efficacy component in a physical activity context with BMI
Supplemental material, sj-docx-1-hpq-10.1177_13591053241258254 for Associations of smart device apps with and without a perceived self-efficacy component in a physical activity context with BMI by Alexander Karl Ferdinand Loder and Mireille Nicoline Maria van Poppel in Journal of Health Psychology
Footnotes
Author contributions
Alexander Karl Ferdinand Loder: Conceptualization; Data curation; Formal analysis; Investigation; Methodology; Project administration; Resources; Software; Supervision; Validation; Visualization; Roles/Writing—original draft. Mireille Nicoline Maria van Poppel: Writing—review & editing.
Data sharing statement
The data that support the findings of this study are available from the corresponding author upon reasonable request.
Declaration of conflicting interests
The authors declared no potential conflicts of interest with respect to the research, authorship, and/or publication of this article.
Funding
The authors disclosed receipt of the following financial support for the research, authorship, and/or publication of this article: the authors acknowledge the financial support by the University of Graz.
Ethics approval
This study has been approved by the ethics committee of the University of Graz; GZ. 39/31/63 ex 2022/23.
Informed consent
All students were informed about the study and agreed with informed consent and data protection.
References
Supplementary Material
Please find the following supplemental material available below.
For Open Access articles published under a Creative Commons License, all supplemental material carries the same license as the article it is associated with.
For non-Open Access articles published, all supplemental material carries a non-exclusive license, and permission requests for re-use of supplemental material or any part of supplemental material shall be sent directly to the copyright owner as specified in the copyright notice associated with the article.