
Abstract
In addition to biological sex, the impact of gender on health outcomes is now well-recognized. Gender norms are changing rapidly, demanding contemporary gender assessment tools. This study sought to validate the recent US-based Stanford Gender-Related Variables for Health Research (SGVHR) scale in Canada. We also aimed to improve gender prediction by including socio-demographic information on education, income and occupations. We recruited 2445 Canadian online participants (~50% female; mean age: 49.3). Multigroup confirmatory factor analyses confirmed the SGVHR factor structure in our sample, indicating its generalizability beyond the USA. Regression analyses indicated that the SGVHR subscales were moderately predictive of self-reported gender. Incorporating socio-demographic factors Significantly enhanced gender prediction via the SGVHR. This study underscores the SGVHR’s applicability in diverse Western populations and encourages the inclusion of easily accessible sociodemographic variables to approximate a gender metric. Future studies should test the health-relevance of such indicators along with the SGVHR.
Introduction
Sex refers to characteristics of women and men that are biologically determined, while gender refers to those that are constructed by social norms and expectations (World Health Organization, n.d.). Gender is increasingly recognized as an important factor that can influence risk factors, prevalence and outcomes in human health (Mauvais-Jarvis et al., 2020). Examples include findings in acute coronary syndrome (Pelletier et al., 2015), type 2 diabetes (Gouni-Berthold et al., 2008), influenza (Morgan and Klein, 2019) and chronic kidney disease (Kausz et al., 2000). Biological sex has complex interactions with a person’s social and political identities, including their gender, race, class, sexual orientation, etc. to influence health-related advantages and disadvantages (Veenstra, 2011). Among these, gender-based marginalization is known to influence disparities in healthcare delivery/access, inequities living with chronic diseases, and ultimately, health outcomes (Baah et al., 2019). Unlike sex, gender-effects in health point to changeable risk factors and provide opportunities for addressing existing inequalities. Gender norms, traits and relations vary across and within cultures, and evolve over time (Garg et al., 2018). For example, gender-stereotypical traits have recently undergone substantial evolution (Bhatia and Bhatia, 2021; Eagly et al., 2020). Thus, it is important to assess gender effects in health research and this requires contemporary, reliable and valid tools for the sociocultural context in which the research takes place.
A recently published scale is the Stanford Gender-Related Variables for Health Research (SGVHR) (Nielsen et al., 2021). Based on an extensive literature review, the authors developed 44 initial items covering gender norms (cultural expectations of behaviours appropriate for specific genders, e.g. working outside the home, caregiving), gender-related traits (personality traits interacting with gender norms, e.g. risk-taking, competitiveness, independence) and gender relations (relational aspects of gender, e.g. social support, discrimination). In a development cohort of over 2000 participants, the scale was reduced to 35 items, which were then validated and further reduced through two additional cohorts to the final version of the SGVHR. The final SGVHR contains 25 items and seven subscales assessing: Discrimination, Work Strain, Caregiver Strain, Risk Taking, Social Support, Emotional Intelligence and Independence. Confirmatory factor analyses replicated this structure across the three cohorts, satisfying measurement invariance (configural, metric, scalar), although some subscales had lower reliability (e.g. in all three samples, the Emotional Intelligence subscale showed Raykov’s rho = 0.65) than others (Caregiver Strain, rho > 0.9 in all samples).
Scores in all but the Independence subscale of the SGVHR showed clear separation between individuals identifying as men, women or gender-fluid/non-binary, with strongest differences in Discrimination (gender-fluid/non-binary > women > men), Risk-Taking (men > women > gender-fluid/non-binary) and Caregiver Strain (women > men = gender-fluid/non-binary). Scores in the SGVHR subscales were also predictive of several health-related variables (e.g. BMI, smoking, binge drinking), in conjunction with sex at birth, emphasizing the importance of assessing gender-related variables in understanding sex differences in human health.
The SGVHR was developed and validated in three US-based cohorts (Nielsen et al., 2021) and to our knowledge, the SGVHR has not been tested in a cohort outside the USA. In addition to biological sex, including gender considerations in health research is now mandated by many funders. Promoting precise operationalization of gender (and other intersectional factors) via novel tools like the SGVHR requires wider validation of gender assessment instruments to increase our shared understanding of what we consider gender to be, a prerequisite before inclusion of such tools can improve precision health and healthcare in diverse settings (Greaves and Ritz, 2022). Apart from socio-cultural and economic differences between the USA and Canada, for example, in racial and religious composition of both countries’ population (Statistics Canada, 2024; U.S. Census Bureau, 2020), the SGVHR was designed to ‘shed light on how specific gender-related behaviors and attitudes contribute to health and disease processes’ (Nielsen et al., 2021). Since different healthcare systems in Canada compared to the USA impact how people access and experience healthcare (Escobar et al., 2019), it is important to understand Canadians’ responses in the SGVHR in their own right. Thus, we conducted a validation study of the SGVHR in Canada.
If the SGVHR were to be used to triangulate health-relevant gender variables, it is paramount to explore other, possibly easier to access gender-related variables. To that effect, we queried participants’ educational attainment, income levels and occupations, that is, variables that have previously been shown to covary with gender and can be easily collected in most clinical and public health settings. For example, there is growing evidence for a diminished or reversed gender gap in educational attainment (Bossavie and Kanninen, 2018), including in Canada (Leclerc, 2022). However, pay inequality in favour of men continues to exist across all age groups and remained persistent over the past three decades (Bishu and Alkadry, 2017). In addition, we derived occupational segregation to approximate gender based on Canadian Labour Force Survey (LFS) population data (Smith and Koehoorn, 2016). Briefly, Smith and Koehoorn proposed a gender index querying LFS data on several areas similar to content of the SGVHR subscales (i.e. childcare responsibilities and work hours). Their index also included proportions of men and women working in specific occupational classes as per National Occupational Classification (NOC). For example, based on Canadian LFS data in 2018 (Statistics Canada), 82.34% of individuals working in occupations captured as ‘Harvesting, landscaping and natural resources labourers’ identified as men, compared to 10.22% of individuals working in ‘Professional occupations in nursing’. Therefore, occupational classes can carry gender-diagnostic value of being ‘more masculine’ or ‘more feminine’, based on population statistics, and we included such occupational segregation here.
In this study, we aimed to test the structure and generalizability of the SGVHR and its value in predicting self-reported gender in a representative Canadian cohort. We hypothesized that the SGVHR structure would replicate in our cohort. We also expected that demographic information on income, education and occupations would improve gender prediction through the SGVHR.
Methods
Participants
This study was conducted with institutional ethics review board approval, in accordance with the Declaration of Helsinki. All participants gave online consent and were provided with the opportunity to have their data not be used in our study. Participants for the current study were recruited from various locations across Canada using the online panel provided by Qualtrics XM. This service provides a stratified convenience sampling approach allowing for demographic quotas and achieving national probability samples with geographic/demographic representativeness (Boas et al., 2020), including in Canada (Belanger et al., 2021). The survey was programmed and delivered using Qualtrics survey software and participants completed it online (PC, mobile).
Sampling requirements for participants in this study were (a) equal proportions of male and female participants, allowing participants with other gender designations as well; (b) a representative distribution of participants across Canadian provinces, (c) minimum age 18 years, (d) residing in Canada. Approximating based on the sample size of Nielsen et al.’s sample 1, the target sample size we requested from Qualtrics XM was 2500 participants (~50% women and men), conservatively estimating data loss, and permitting samples above 2500 for alternative genders.
A total of 2527 respondents provided SGVHR data. Initial data integrity check removed 21 responses from the datasets due to duplications, fraud IDs and speeded responses. Furthermore, 21 datasets that were incomplete or had missing items were also removed. We processed the remaining 2458 datasets in several ways. Following Nielsen et al. (2021), we replaced missing data for participants who reported not currently working or having caregiving duties in all items asking for work- or caregiving-related strains with ‘1’ (no impact). Inspecting the answers to the two items asking for an estimate of daily hours spent on either work (‘timework’) or caregiving activities (‘timecare’), some answers exceeded 24 hours. Inspecting these answers, it appeared some participants may have misunderstood these estimates to ask for weekly (not daily) estimates. For example, 137 participants reported ‘40 hours’ of work-related activities, presumably providing a weekly work-hour estimate. To correct misreported weekly estimates, we divided all responses exceeding 24 hours by 7 (N = 339 for item ‘timework’ and N = 64 for item ‘timecare’). Then we deleted cases whose responses were above 2 standard deviations of the sample mean within either or both items, excluding a total of eight datasets. Since our core questions concerned gender-related predictions, we also excluded datasets from five participants who preferred not to state their gender. These steps resulted in a total of 2445 participants in the final sample.
Measures
The SGVHR scale was self-reported and delivered in the context of a larger survey study. The questionnaire includes 25-items summarized into seven subscales, with 23 items judged on 5-point Likert scales and two items asking for an open-ended numerical estimate of daily hours spent on certain activities. The Discrimination subscale (six items) measures perceived frequency of gender-based systemic unfair treatment. Example: ‘Because of your gender, how often have you felt discriminated against when getting hired?’ Work Strain (five items, including one time estimate of daily time spent on work-related activities) measures perceived job strain and emotional job demands. Example: ‘How often does your job require working fast?’ Caregiver Strain (four items, including one time estimate of daily time spent on caregiving-related activities) measures perceived consequences of responsibility for unpaid long-term caregiving. Example: ‘In the past year, how often did you feel physically exhausted because of your caretaking responsibilities?’ Risk Taking (three items) measures propensity for physical and behavioural risk taking. Example: ‘How prepared are you to take risks when making financial decisions?’ Social Support (two items) measures the availability and level of social support. Example: ‘In the past year, how often have you had someone to show you love and affection?’ Emotional Intelligence (three items) measures an individual’s ability to recognize what they feel, manage those emotions and use emotions in problem solving. Example: ‘How easy is it for you to express what you are feeling to others?’ Independence (two items) assesses the perceived importance of being independent and solving one’s problems alone. Example: ‘How important is it for you to solve your problems on your own?’. Labelled answers for the Likert-scaled items of the Discrimination, Work Strain, Caregiver Strain, Social Support and Emotional Intelligence subscales range from 1 = ‘Never’ to 5 = ‘Always’. Answers on Risk-Taking range from 1 = ‘Not at all prepared’ to 5 = ‘Completely prepared’; and answers for the Independence subscale range from 1 = ‘Not at all important’ to 5 = ‘Extremely important’. To derive subscale scores, we followed the same steps as the original authors, calculating mean-item subscale scores and for the two subscales including continuous variables (time spent on care and work), mean-item scores were calculated based on z-scores.
In addition to the SGVHR, we queried: gender (‘man’, ‘woman’, ‘gender fluid/non-binary’, ‘other’, ‘prefer not to state’), age (in years), highest educational attainment level (12 response categories, including ‘Some high school’, ‘High school diploma’, ‘Vocational training’, ‘Some college’, ‘Associates degree (AA)’, ‘Bachelors degree (e.g. BA, BSc, BFA)’, ‘Some post undergraduate work’, ‘Masters degree (e.g. MA, MBA, MSc, MSW)’, ‘Specialist degree (e.g. Eds)’, ‘Applied or professional doctorate degree (e.g. MD, JD, PharmD)’, ‘Doctorate degree (e.g. EdD, PhD)’, ‘Other’ (free text) and their personal (not household) income (eight categories, in CAD$: ‘Less than $15,000’, ‘$15,000–$29,000’, ‘$30,000–$49,000’, ‘$50,000–$69,000’, ‘$70,000–$99,000’, ‘More than $100,000’, ‘Do not know’, ‘Do not wish to answer’). Three questions queried occupations (Smith and Koehoorn, 2016): Following the categories of the 2016 National Occupation Classification (Employment and Social Development Canada (ESDC) SC, 2019), participants selected one of 10 broad occupational categories, one of 46 major groups and wrote their job title in free text (‘What is your current job title? If you stopped working or are retired, what was your job title before? If you are self-employed, please provide the field you’re working in’). Manual corrections of selected NOCs were as follows: 212 participants who endorsed no NOC also reported their work status as ‘employed’, or ‘retired’. In these cases, we consulted participants’ job title and replaced their missing NOC, ensuring they had the minimum educational qualification required for the job title they reported. Furthermore, 898 participants chose an incorrect NOC based on their job title. For example, a customer service representative would fall into NOC 65 ‘Service representatives and other customer and personal service occupations’, and not NOC 64 ‘Sales representatives and salespersons – wholesale and retail trade’. A total of 214 NOCs could not be resolved (71 individuals who never worked, 73 in training and 70 reporting no interpretable job title). Participants’ major group NOC was then cross-referenced with Canadian Labour Force Survey data (Statistics Canada, 2019) from which we calculated the percentage of women working in each major group NOC in 2018. For example, according to LSF data from 2018 a total of 351,600 individuals in Canada worked in NOC group 30 ‘Professional occupations in nursing’. Of these, 315,500 (89.73%) were female, that is, a participant with this NOC would receive a score of 89.73%. Therefore, NOC-based percentages were assigned to each participant, with values above 50% representing a population-based occupation with a predominance of women compared to men. The 214 missing NOCs were replaced by 50%, that is, representing no gender-based occupational segregation (see Table S1 for more details).
Statistical analyses
To compare our participants with Nielsen’s et al.’s sample 1 (Nielsen, 2021: osf.io/7yje9), univariate comparisons on the cohorts’ characteristics were carried out first (independent t-tests; χ2 tests). Secondly, to test if the structure of the SGVHR replicated, a multi-group confirmatory factor analysis with maximum likelihood estimation (MG-CFA) using the seven original SGVHR factors was fit to both the current sample and sample 1 from Nielsen et al. (2021), starting with examining configural invariance overall model fit. Configural invariance tests if the number of factors and pattern of loadings of individual items is the same for both groups. This was followed by increasingly restrictive tests; metric invariance, testing if each item contributes similarly to its factor across groups and scalar invariance, testing if differences in item means contribute similarly to mean differences in the factors across samples. The χ2-difference test is sensitive to minute departures from exact fit in large samples (Schermelleh-Engel et al., 2003). Therefore, alternative fit indices were used to determine overall model fit and invariance. The criteria for good model fit were Tucker-Lewis index (TLI) and comparative fit index (CFI) > 0.95; root mean square error of approximation (RMSEA) < 0.06; and standardized root mean squared residual (SRMR) < 0.08 (Hu and Bentler, 1999). Metric invariance followed by scalar invariance were determined by (1) reasonable overall model fits based on model fit indices and (2) a change in CFI no larger than −0.01 along with a change in RMSEA less than or equal to 0.010 (Chen, 2007). As recommended by Putnick and Bornstein (2016) to understand partial scalar invariance, differences in means of individual questionnaire items were assessed to identify potential deviations from invariance and group differences. Differences in item means between samples were tested using independent t-tests. The reliability of the SGVHR subscales was assessed with Raykov’s rho coefficient, which accounts for the correlated errors. A value of ρ > 0.6 was considered as indicators of acceptable reliability (Hair et al., 2021).
To test relationships between SGVHR scores and self-reported gender, two hierarchical logistic regressions were conducted: (a) comparing those who identified as women (dummy-coded as ‘1’) versus all others (reference: men and gender-fluid/non-binary), and (b) comparing men (‘1’) versus others (reference: women and gender-fluid/non-binary). Examining predictors of gender-fluid/non-binary participants was precluded due to small sample size (see results). In each of the two regressions, the first predictor block included mean scores in the seven SGVHR subscales. The second block included the three socio-demographic variables (educational attainment, income level, occupational segregation). To avoid very small response categories, educational attainment levels were combined into three levels, testing the effect of having attained a bachelor’s degree (N = 708) or postsecondary degree (N = 297) against having attained a lower education level than a bachelor’s degree (N = 1439; reference). Similarly, income levels were simplified by testing annual income levels between CAD $30,000–$69,999 (N = 953) or more than CAD $70,000 (N = 646) against having an annual income of CAD $29,999 or less (N = 697; reference). As described above, occupational data were percentages with higher scores representing more women than men working in this occupation in Canada in 2018 (Statistics Canada, 2019). A total of 146 participants did not report their income and therefore the regression analyses were conducted with 2299 of the 2445 participants. Univariate statistical analyses and hierarchical regressions were carried out with SPSS v.28 (IBM SPSS Statistics, 2021). Confirmatory factor analyses and factor reliabilities were carried out with R version 4.2.2 (R Core Team, 2022).
Results
Characteristics of our cohort compared to Nielsen et al.’s (2021) sample 1 are shown in Table 1. The two cohorts differed significantly. Specifically, our participants were almost 15 years older, reported higher rates of heterosexual and lower rates of bisexual/asexual orientation. While most participants identified as White in both cohorts, Asian, Middle Eastern or Mediterranean descent was more commonly endorsed in our cohort, whereas Black/African American and Hispanic, Latinx or Spanish descent was more common in the US-cohort. Our cohort also had higher rates of individuals not currently working in paid employment. While the majority in our cohort stated they were ‘currently working’ (N = 1379, 56.4%), a total of 607 participants (24%) were ‘retired’, 121 (4.9%) were ‘homemakers’, 26 (1.1%) were ‘volunteers’, 98 (4.0%) were ‘students’, 147 (6.0%) were ‘unemployed’ and 102 (4.2%) reported being on a ‘leave of absence or disability’. Our participants also reported higher rates of having full- or part-time caregiver status (1085 participants, 44.4%), and their educational attainment was lower. Our cohort had fewer individuals falling into the lower income brackets, compared to Nielsen et al.’s sample 1. It should be noted that income was assessed in income brackets in CAD in the current cohort compared to in USD in Nielsen et al. (2021); therefore, reported income levels are not directly comparable (cf. Table 1).
Characteristics of the current cohort and sample 1 from Nielsen et al. (2021).
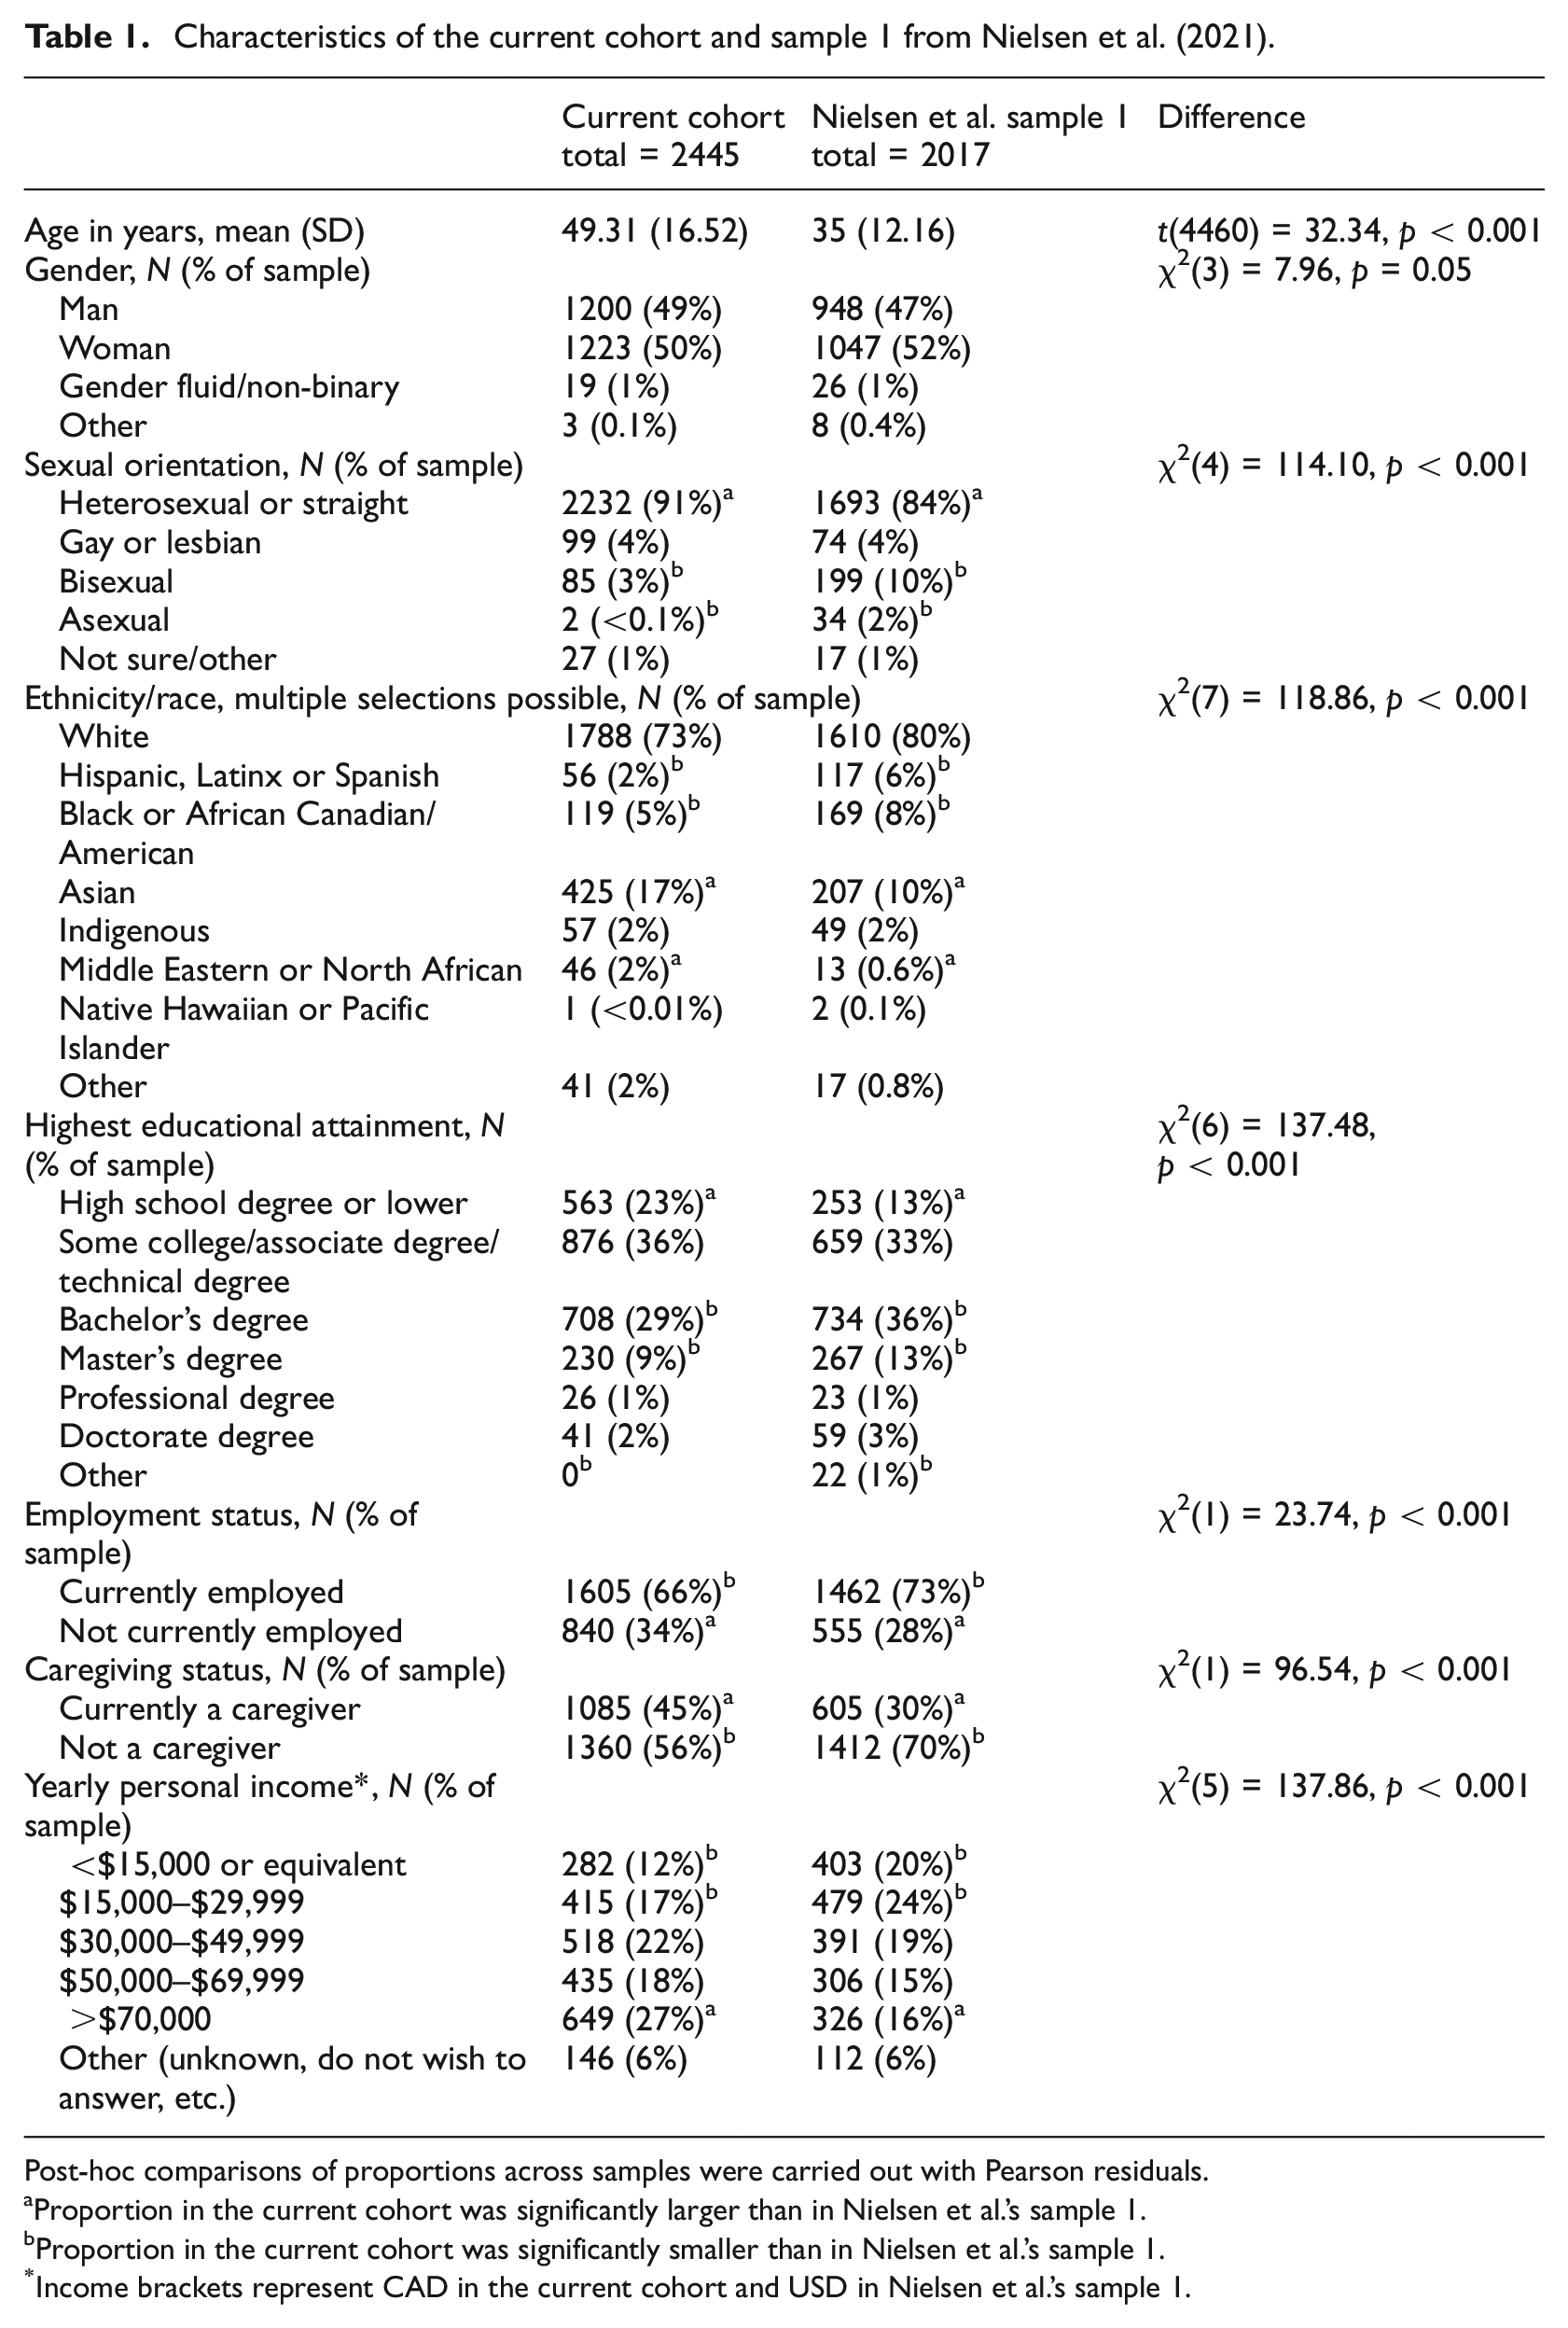
Post-hoc comparisons of proportions across samples were carried out with Pearson residuals.
Proportion in the current cohort was significantly larger than in Nielsen et al.’s sample 1.
Proportion in the current cohort was significantly smaller than in Nielsen et al.’s sample 1.
Income brackets represent CAD in the current cohort and USD in Nielsen et al.’s sample 1.
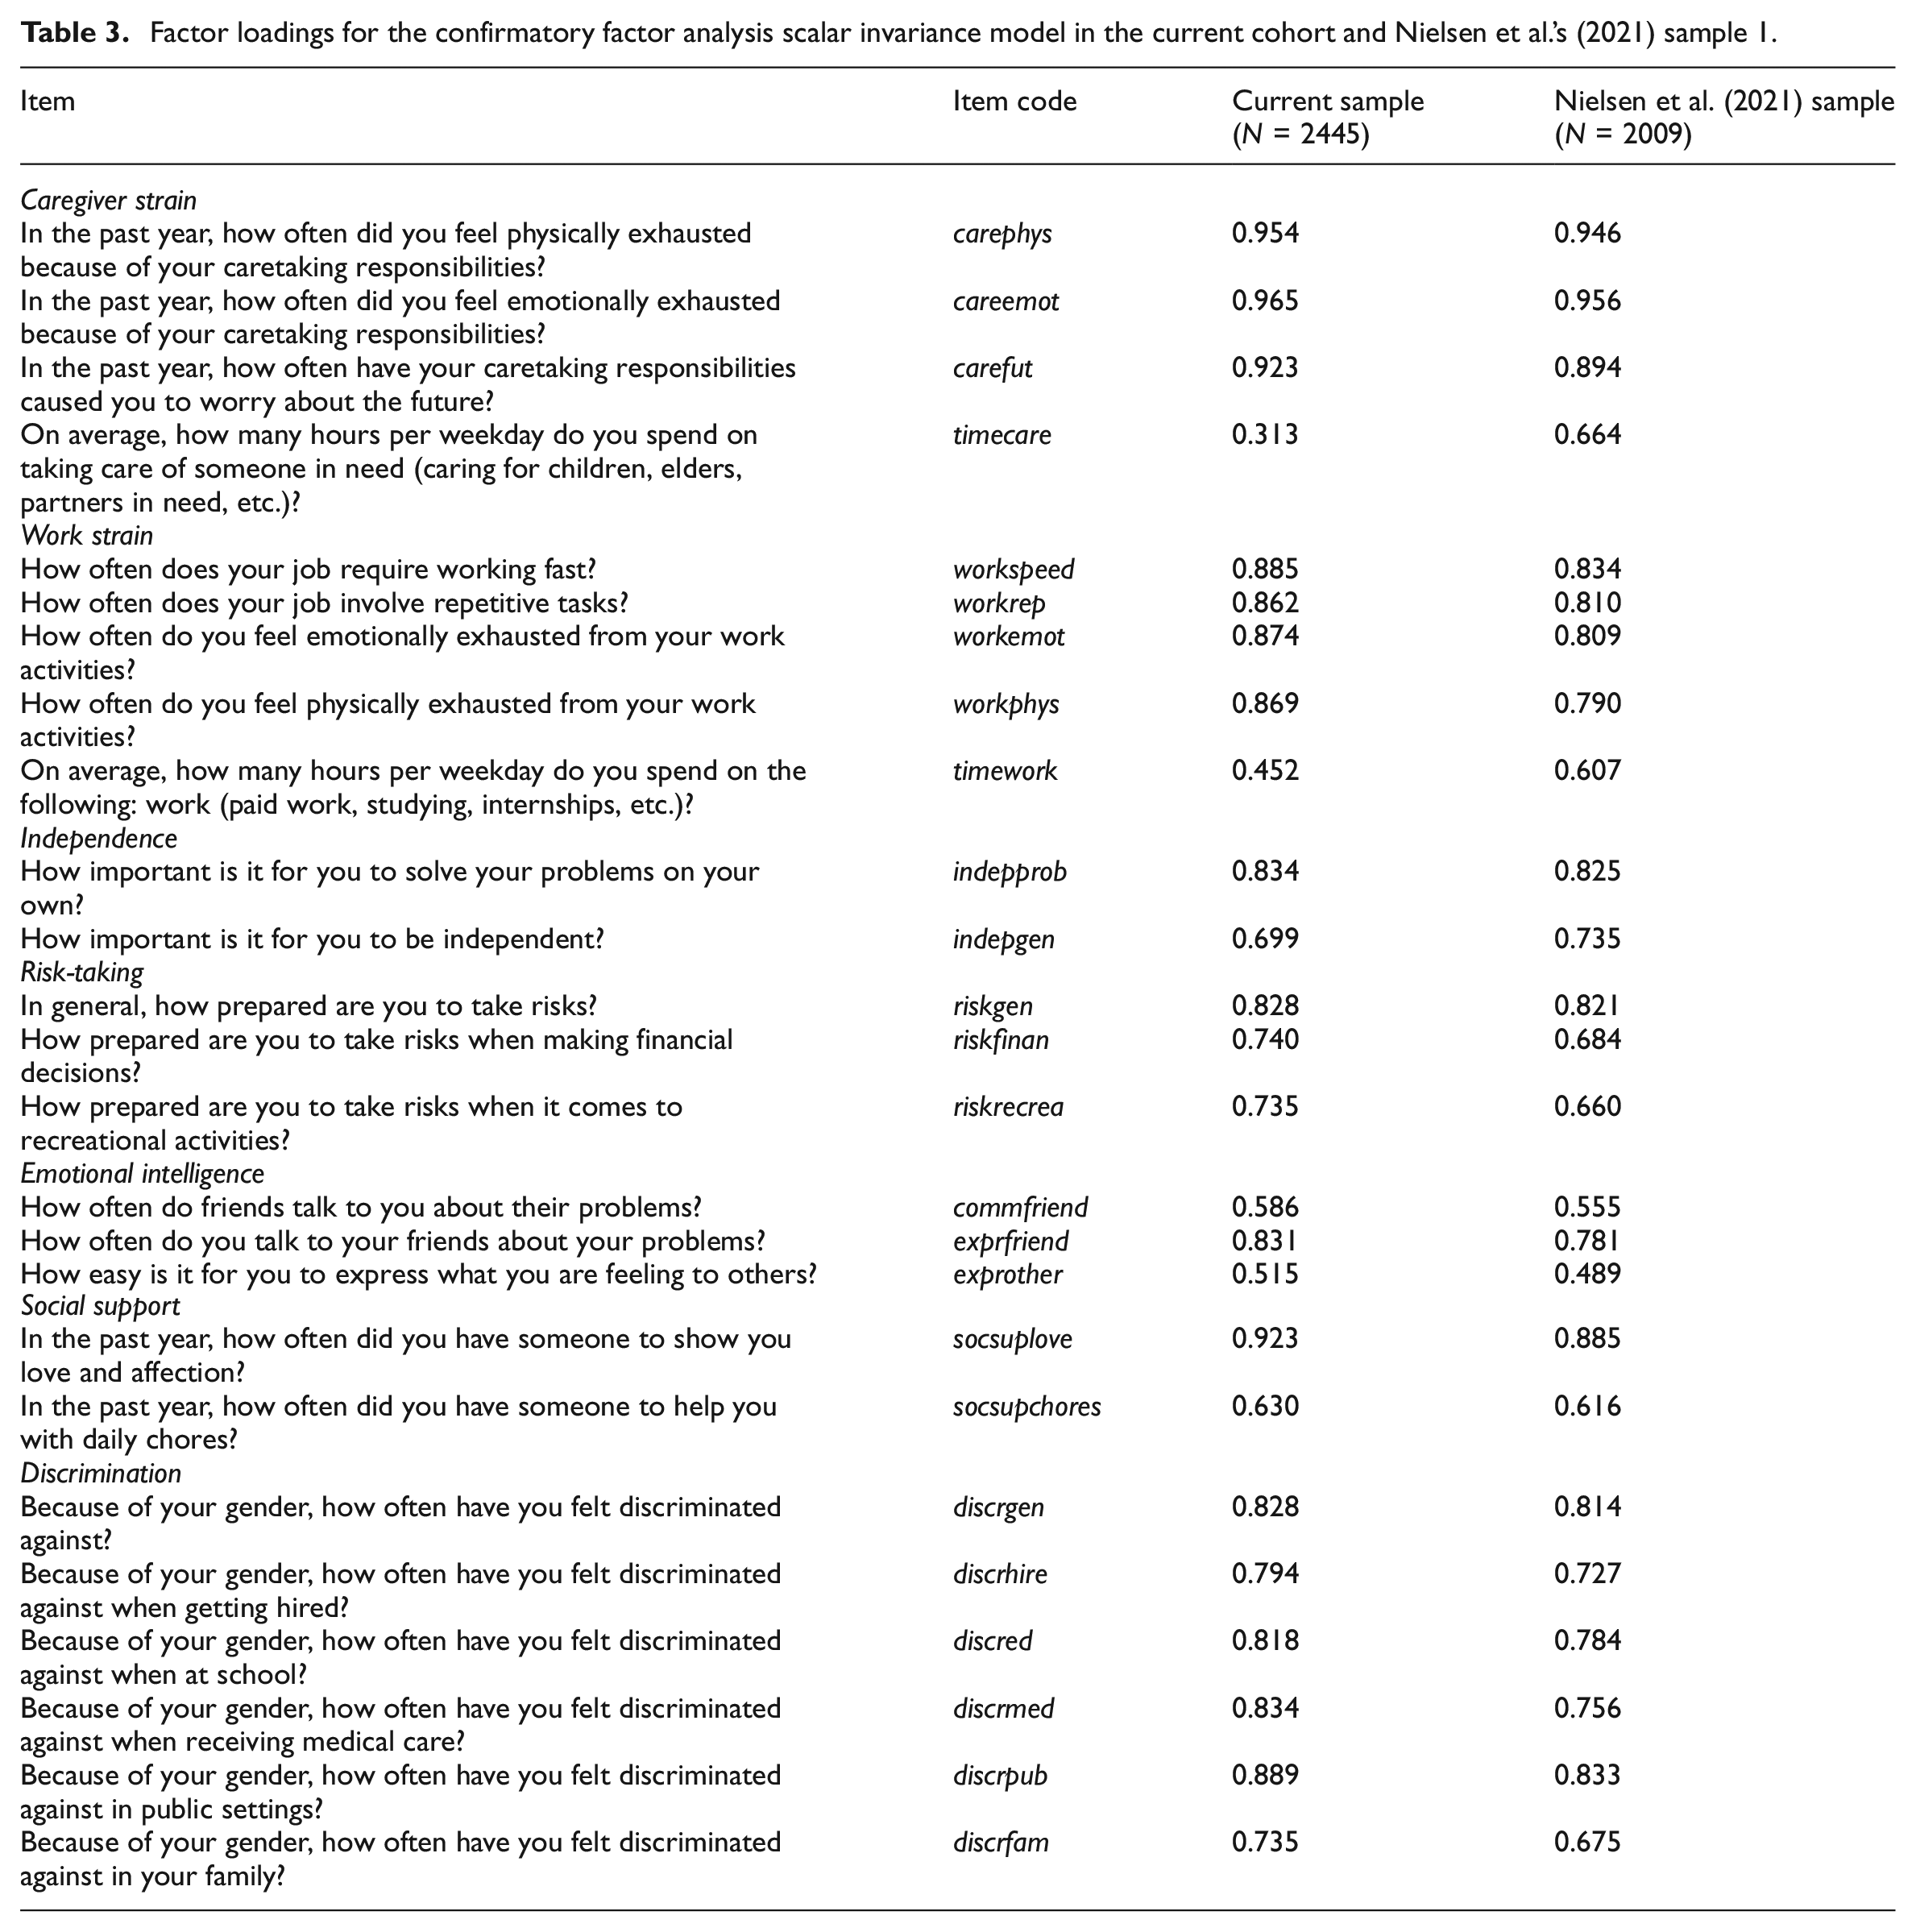
Outcomes of testing the factor structure of the SGVHR in our cohort are summarized in Table 2. The configural invariance model showed good model fit, suggesting the observed SGVHR item responses could be structured similarly to Nielsen et al.’s proposed 7-factor solution (see Table S2 for factor loadings/reliabilities). While most factors yielded reasonable reliabilities in our data (ρs > 0.6), Caregiver Strain had lower internal reliability. Constraining factor loadings to equality also yielded a good model fit and marginal changes in CFI and RMSEA, supporting metric invariance (Chen, 2007) (Table S3). Testing scalar invariance, that is, whether factor means represent similar item means across samples revealed acceptable model fit but changes in CFI and RMSEA did not meet the cutoff values for invariance (Table 2), indicating partial scalar invariance (factor loadings/reliabilities in Table 3). Thus, mean differences in at least some of the factors did not capture mean differences in the shared variance of the items equally across the two cohorts. All but five item means differed across cohorts (Figure 1; see Table S4 for statistical comparisons), with most substantial differences in the two questions requiring time estimates, timecare and timework, with mean scores of 3.45 hours/day of caretaking and 5.82 hours/day of work-related activity in our sample compared to 1.67 and 6.73 hours/day, respectively, in the US-cohort (see Table S5 for a re-analysis with similar outcomes, excluding the 365 cases whose time estimates we had manually adjusted).
Model fit results of multigroup confirmatory factor analyses.
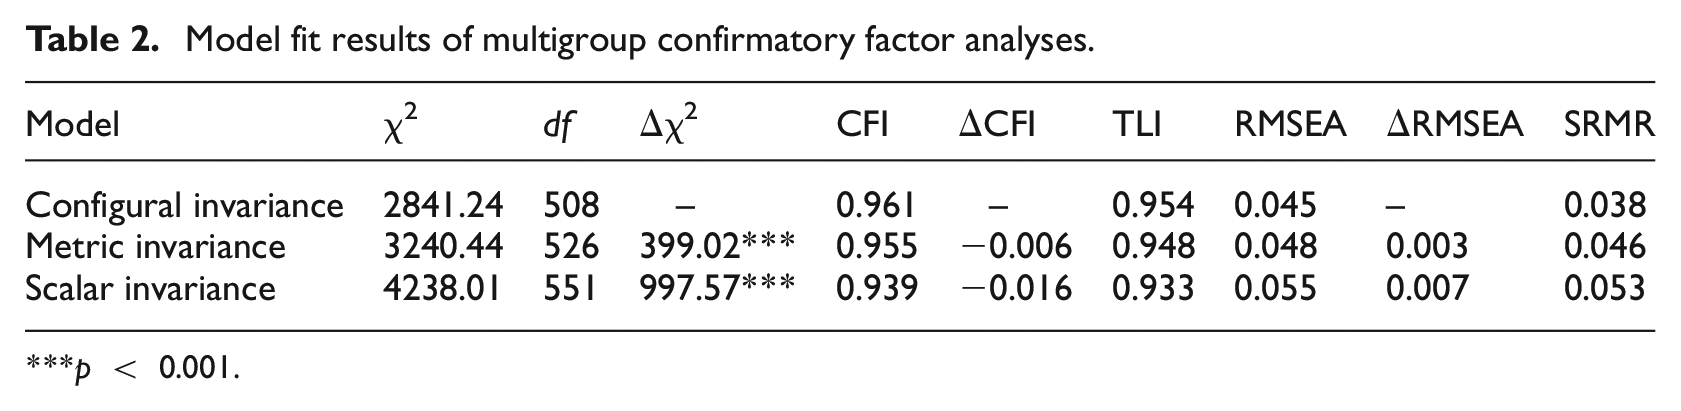
p < 0.001.
Factor loadings for the confirmatory factor analysis scalar invariance model in the current cohort and Nielsen et al.’s (2021) sample 1.
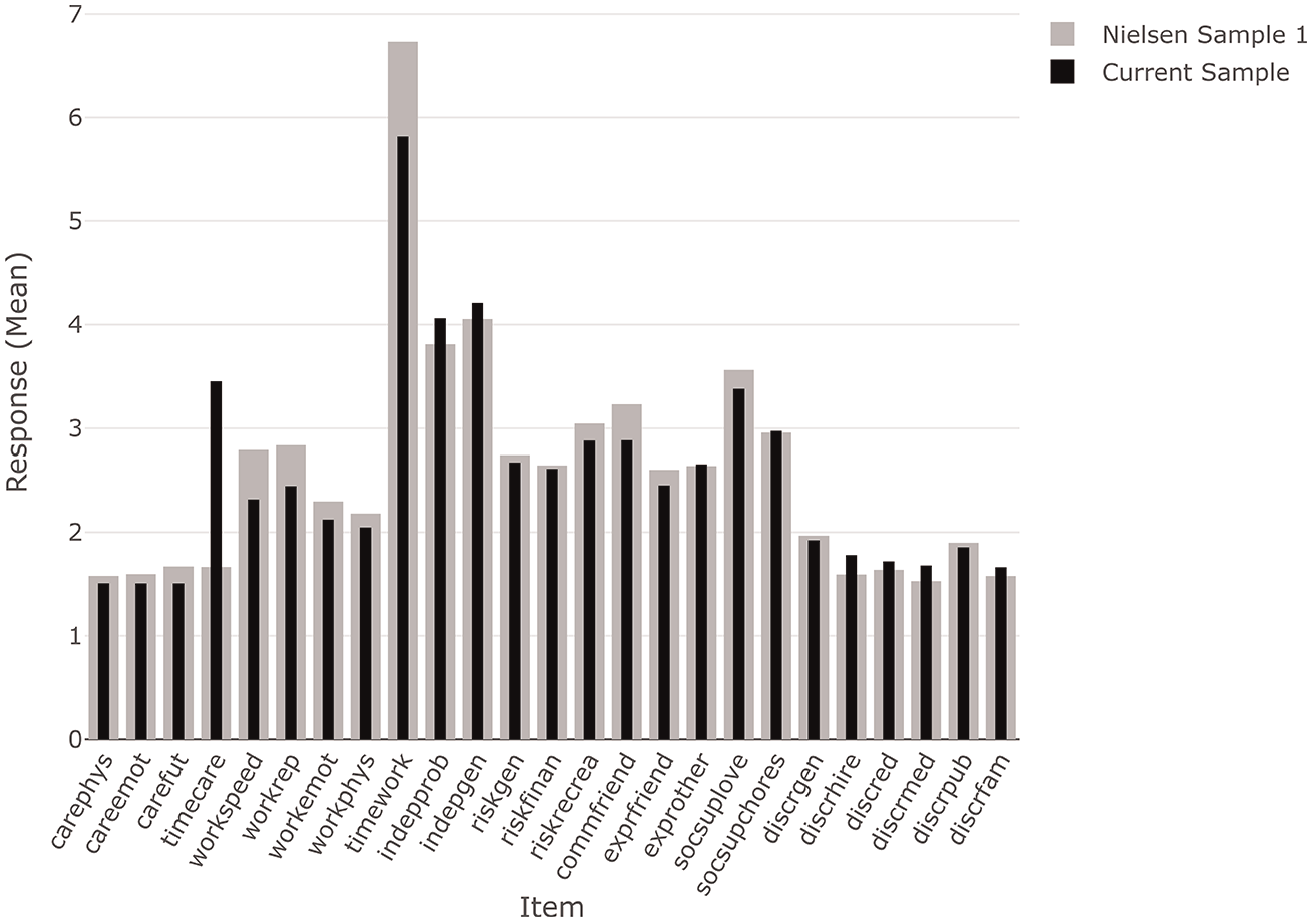
Mean item responses of the current sample (black) compared to Nielsen et al.’s (2021) sample 1 (grey).
Outcomes of the hierarchical regressions testing relationships between gender, SGVHR and socio-demographic predictors revealed that in block 1, the SGVHR alone successfully predicted participants identifying as women (compared to men and gender-fluid/non-binary), model χ2(7) = 317.09, p < 0.001, Nagelkerke R2 = 0.17, correct classifications: 66.2%. Similar outcomes emerged for the model predicting men (compared to women and gender-fluid/non-binary), model χ2(7) = 331.14, p < 0.001, Nagelkerke R2 = 0.18, correct classifications: 67.4%. Including information on educational attainment, income and occupations in block 2 substantially improved these models (women: model χ2(7) = 648.47, p < 0.001, Δχ2(5) = 331.39, pchange < 0.001, Nagelkerke R2 = 0.33, correct classifications: 72.2%; men: model χ2(7) = 677.53, p < 0.001, Δχ2(5) = 346.39, pchange < 0.001, Nagelkerke R2 = 0.34, correct classifications: 73.4%). Figure 2 shows the odd-ratios for each of the 10 predictors from the final models. Higher scores in Discrimination, Emotional Intelligence, Work Strain, Independence and Caregiver Strain were related to female gender, higher scores in Risk-Taking predicted men. Social Support was not associated with gender. Regarding the socio-demographic variables, having attained postsecondary education (vs high-school or lower educational attainment), earning $70,000 or more per year (vs <$15,000) and having less ‘female’ occupations was associated with male gender, with findings in the reverse direction for female gender. For example, relative to earning less than $15,000 per year, someone reporting an income of $70,000 or more/year was about half as likely to identify as a woman than a man.
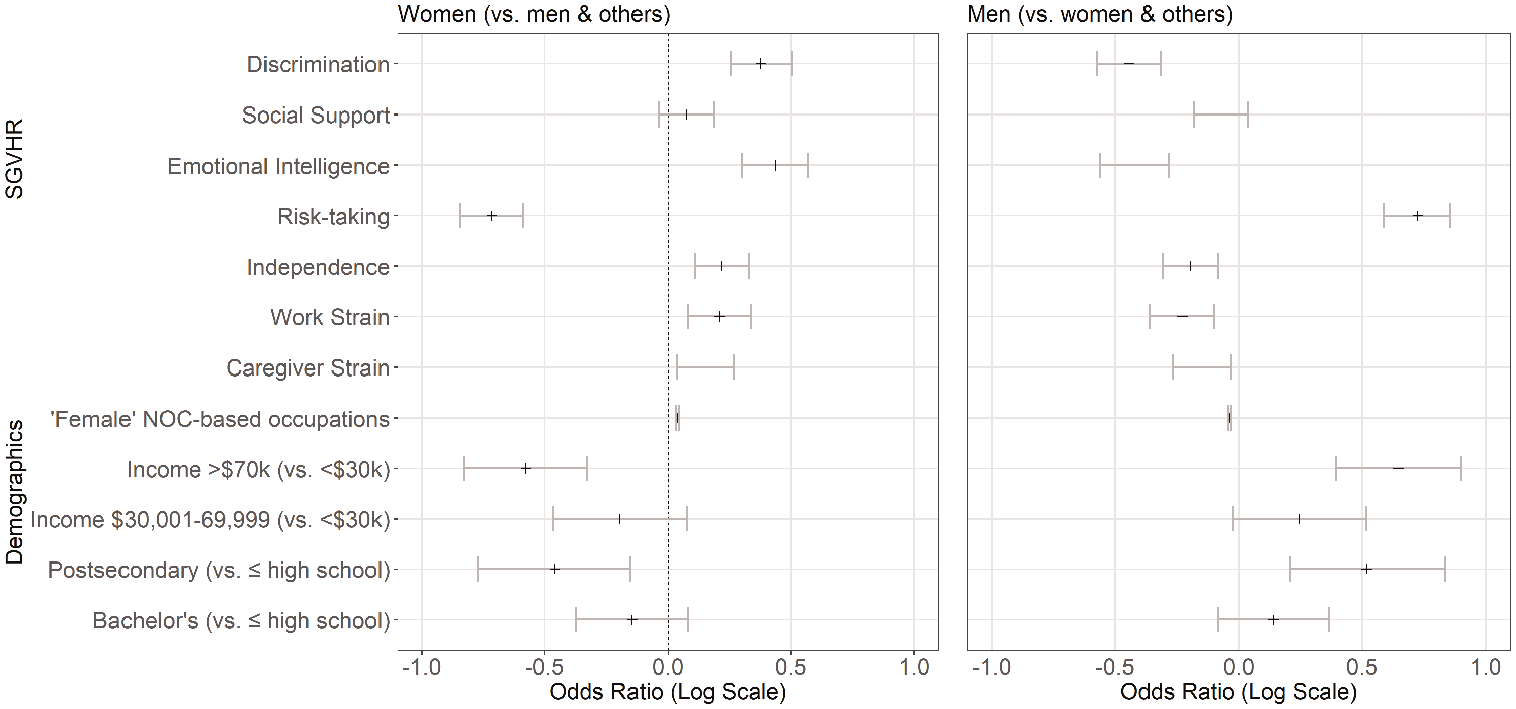
Odds-ratios from final hierarchical regression models predicting women (vs men and gender-fluid/non-binary) or men (vs women and gender-fluid/non-binary) by SGVHR subscale scores, income, education and occupational segregation.
Discussion
Confirmatory factor analyses validated the structure of the Stanford Gender-Related Variables for Health Research (SGVHR) (Nielsen et al., 2021) scale in this Canadian cohort, with minor limitations. Relationships between gender and four of the seven SGVHR subscales were similar to findings from the original cohort, again with some variations for the remaining subscales. We further showed that self-reported gender was substantially related to educational attainment, income levels and occupations over and above SGVHR scores alone. Thus, our study suggests that the SGVHR captured gender dimensions in our cohort that were comparable to the original cohorts from the USA, making it a useful tool to measure gender-related variables in the USA and Canada, and potentially additional Western populations.
Importantly, we observed partial scalar invariance, indicating sample differences in mean scores for individual items. Partial scalar invariance is a common observation in large-scale multi-cohort studies and complete scalar invariance is often unattainable in practice (Byrne and van de Vijver, 2017; Marsh et al., 2018). Invariance could be due to cultural differences between cohorts (Marsh et al., 2018) or the specific ways items are interpreted in different countries and cultures (Van de Vijver and Leung, 1997). Partial scalar variance still allowed valid comparisons across groups previously (Pokropek et al., 2019) and did not produce significant bias in parameter estimates (Guenole and Brown, 2014). Thus, despite partial scalar invariance, we maintain that the current data provide a meaningful comparison to the original cohort from the USA.
Some of the socio-demographic differences between our cohort and Nielsen et al.’s sample 1 should be noted. We recruited participants through the Qualtrics survey panel, whereas Nielsen et al. (2021) used Prolific (for sample 1). Survey panels target the recruitment of demographically/geographically representative samples that are not achievable through online platforms without using specific filters (Boas et al., 2020) and cohorts recruited through Qualtrics are often older than unselected samples (Douglas et al., 2023). Our cohorts’ age differences likely caused other sociodemographic differences. For example, lower employment rates here reflected a higher number of retired individuals, more part-time work and caregiver roles (e.g. for elderly parents), all of which likely contributed to the differences in some of the individual items (time spent on work and caregiving activities). Thus, differences in cohort recruitment and demographic composition likely caused the partial scalar invariance.
We found relationships between gender and four of the SGVHR subscales that were similar to findings from Nielsen et al. (2021) in their cohort 1: Higher scores in Discrimination, Emotional Intelligence and Caregiver Strain predicted individuals identifying as women (vs men/non-binary), Risk-Taking predicted men (vs women/non-binary), and Nielsen et al. (2021) showed analogue differences in the average scores in these subscales between women and men. Two subscales were related to women/female gender in only one of the two cohorts: Social Support in Nielsen et al., and Independence in our cohort. Finally, Work Strain – gender relationships were reversed, with stronger association to female gender here compared to male gender in Nielsen et al. These differences were not tested or predicted, complicating their post-hoc interpretation. However, to speculate, unlike the other SGVHR subscales, Independence does not assess the estimated frequency of certain behaviours or experiences, but the personal importance of being independent, that is, a choice or desire. Economic independence of women pursuing careers continues to increase (Croft et al., 2019; Meeussen et al., 2019) and a younger cohort (like cohort 1 in Nielsen et al. (2021) may include more women who already achieved financial independence through full-time work. It is also possible that a higher number of Prolific participants compared to Qualtrics survey panel participants use the service out of economic necessity rather than personal choice, in which case Independence may not reflect potential gender differences in valuing (financial) independence. Aside from these speculations, Social Support and Independence each only contain two items, which limits testing of internal consistency and interpretability of the underlying constructs these items are intended to measure (Rammstedt and Beierlein, 2014; Schweizer, 2011). Even though we confirmed the structure of the SGVHR including these subscales, from a statistical view, both should ideally include at least one more item to increase their stability. Since the goal of the SGVHR is not to differentiate genders but to measure gender-associated sociocultural behaviours and attitudes that are health-relevant, the associations of scores in the current SGVHR should be validated against health-related variables and outcomes in future studies.
Our outcomes also emphasize the potential value of including commonly available socio-demographic data known to covary with gender: Educational attainment (Bossavie and Kanninen, 2018; Leclerc, 2022), income levels (Bishu and Alkadry, 2017; Moyser, 2019) and occupational segregation (Smith and Koehoorn, 2016). Incorporating these variables in our hierarchical regressions led to a substantial increase in predicting self-reported gender. The more objective nature and relative ease of acquiring of such information compared to survey data supports their inclusion. Again, relationships of these variables, alone or in combination with the SGVHR, and health-related variables remain to be tested.
Among the limitations of the current study is the recruitment of online participants. Although this is a practical and increasingly more common way of large-scale survey studies, with similar data quality between platforms (Douglas et al., 2023; Smith et al., 2016), concerns have been raised as well (Peer et al., 2022). We tried to minimize data errors by including initial integrity checks by the service provider, conservative removal of participants, manual corrections and re-analysis of some of the results without corrected values. Notably, unlike Nielsen et al. (2021), we only queried gender at the current time, that is, not sex at birth. Although current self-reported gender and sex at birth were very similar in the original cohort (of all males at birth, 98.6% also currently self-identified as men; of all females at birth, 99.4% self-identified as women in Nielsen et al., 2021), this must be considered in the interpretation of relationships between the SGVHR, gender/sex-at-birth and health outcomes in future studies. Finally, the small number of gender-fluid/non-binary participants limited our ability to analyse this subgroup’s patterns in the SGVHR. Future studies should strive to include larger samples of gender-fluid/non-binary individuals to explore their unique experiences on the dimensions of the SGVHR. Despite these limitations, our findings support the use of the SGVHR for capturing multiple dimensions of gender, with similar associations to self-reported gender for four of its subscales specifically: Discrimination, Emotional Intelligence, Caregiver Strain and Risk-Taking.
In conclusion, our study provides support for the validity of the SGVHR scale in a Canadian cohort and highlights the added value of including socio-demographic variables in predicting gender. Our findings suggest that the SGVHR is a useful tool for assessing gender-related variables in diverse Western populations, but researchers should remain mindful of cultural and contextual differences when applying the scale. As gender continues to gain recognition as a crucial factor in human health, the SGVHR can play a vital role in advancing our understanding of the complex interplay between gender, biology and health outcomes. By recognizing and assessing gender as a complex construct, researchers and healthcare professionals can develop more targeted interventions and policies to address gender-specific health disparities and promote health equity.
Supplemental Material
sj-docx-1-hpq-10.1177_13591053241247376 – Supplemental material for Validating the Stanford Gender-Related Variables for Health Research (SGVHR) in a Canadian population
Supplemental material, sj-docx-1-hpq-10.1177_13591053241247376 for Validating the Stanford Gender-Related Variables for Health Research (SGVHR) in a Canadian population by Ahmed Abdel-sayyed, Kim Ngan Hoang, Tarek Turk, Lujie Xu and Esther Fujiwara in Journal of Health Psychology
Footnotes
Data sharing statement
The current article is accompanied by the relevant raw data generated during and/or analysed during the study, including files detailing the analyses and either the complete database or other relevant raw data. These files are available in the Figshare repository and accessible as Supplemental Material via the Sage Journals platform. Ethics approval, participant permissions, and all other relevant approvals were granted for this data sharing. The data files from the current study are also available in the OSF repository at ![]() .
.
Declaration of conflicting interests
The authors declared no potential conflicts of interest with respect to the research, authorship, and/or publication of this article.
Funding
The authors disclosed receipt of the following financial support for the research, authorship, and/or publication of this article: This study was supported by the Canadian Institutes of Health Research (FRN 201803).
Ethics approval
This study received ethics approval from the University of Alberta, Research Ethics Board 2, Pro00086704 ‘Gender roles and health’.
Informed consent
The participants all provided informed consent to participate in the study and for us to use their data, the consent form was part of the online survey.
References
Supplementary Material
Please find the following supplemental material available below.
For Open Access articles published under a Creative Commons License, all supplemental material carries the same license as the article it is associated with.
For non-Open Access articles published, all supplemental material carries a non-exclusive license, and permission requests for re-use of supplemental material or any part of supplemental material shall be sent directly to the copyright owner as specified in the copyright notice associated with the article.