
Abstract
Introduction
Universal screening using measures of mental health symptoms is discounted by UK schools due to stakeholder concerns. This is a preliminary study of the psychometric properties of a new Brief Positive School Experiences (B-PSEs) scale, devised to assess associations between cumulative positive school experiences (PSEs) and adolescent mental health as part of a PhD project that explored PSEs count as a potential proxy measure of adolescent mental health risk.
Methods
Five teachers developed a brief 19-item PSEs measure. 460 adolescents (aged 14–16) completed a survey based on these items and items measuring mental health (N = 460). Exploratory factor analysis and measures of internal consistency assessed the scale’s preliminary psychometric properties.
Results
The B-PSEs scale demonstrated a three-factor structure; (1) Coping with school demands; (2) School belonging, safety and support; and (3) Equity and low social adversity. Composite reliability was measured at 0.91.
Conclusion
The B-PSEs scale is a reliable measure with a robust factor structure and PSEs scores measured using the scale have demonstrated associations with adolescent mental health outcomes.
Plain language summary
The Development of a Brief Positive School Experiences Scale: Universal screening using measures of mental health symptoms is discounted by UK schools due to stakeholder concerns. This is a study about the development of a new Brief Positive School Experiences (B-PSEs) scale, devised to assess associations between cumulative positive school experiences (PSEs) and adolescent mental health.
Keywords
Introduction
According to Walsh et al. (2020) adolescent mental well-being has never been more at risk. However, only 15% of UK schools use universal mental health screening to assess student mental health (Marshall et al., 2017) due to consent, privacy and stigmatisation concerns (Friedman, 2006; Levitt et al., 2007; Waite & Atkinson, 2021). Burns and Rapee (2019) have suggested that screening for social factors, in this case PSEs, may warn school staff to the risk of mental health problems.
Cumulative positive childhood experiences and adolescent mental health
The Benevolent Childhood Experiences scale (BCEs; Narayan et al., 2018) measures individual, family and community level factors that may ameliorate adversity related outcomes. Positive childhood experiences (PCEs) that are predictive of better mental health as measured by the BCEs scale include having had at least one secure caregiver, one good friend, positive self-concept, a teacher who cares, and having had a good neighbour (Narayan et al., 2018). Interestingly, the effect of PCEs on health seem separate from the effect of adverse childhood experiences (ACEs) (Crandall et al., 2020). For example, Bunting et al. (2023) reported direct independent relationships between ACEs and PCEs in relation to youth mental health outcomes. They reported that ACEs heightened the risk of mood and anxiety issues, self-injury and suicide ideation, whilst PCEs acted as promotive factors that reduced the risk of these deleterious mental health problems. Bunting et al. (2023) noted that PCEs did not moderate the relationships between ACEs and poor youth mental health, suggesting that PCEs act independently of ACEs. Qu et al. (2022) also found that cumulative PCEs were negatively associated with the risk of adolescent depression and anxiety, with an inverse does-response relationship between PCEs score and risk of depression. Similarly, Zhang et al. (2021) reported that early poly-victimisation adversities were highly predictive of oppositional defiant disorder and depressive symptoms, whilst adolescents with increased levels of PCEs demonstrated significantly lower psychopathological symptoms which were equal to peers with low victimisation levels (Zhang et al., 2021).
Positive and adverse school experiences and adolescent mental health
Leurent et al. (2021) found that reduced emotional problems and better student wellbeing were associated with school-based sense of belonging and positive school relationships. Moreover, Nie et al. (2020) established that adolescents who had increased perceptions of positive school-based relationships reported decreased symptoms of depression when compared to those who perceived a more negative school climate. Conversely, adverse experiences at school, such as feeling unsafe, witnessing violence and being bullied have been associated with poor mental health, emotional problems and suicidal behaviour (Janosz et al., 2008; Long et al., 2021; Moore et al., 2017; Mori et al., 2021; Nijs et al., 2014).
A brief positive school experiences scale
Concerns about using clinical measures of mental health symptoms as school-based screeners have been noted (Chafouleas et al., 2010). Parents may have fears relating to infringements of family privacy and the stigmatisation of youth identified by such measures (Friedman, 2006; Levitt et al., 2007). Consent issues, screening tool practicality and school time constraints are problematic in relation to the use of clinical measures (Dever et al., 2012; Waite & Atkinson, 2021). Interestingly however, Burns and Rapee (2019) suggested that the screening of social factors (e.g., school experiences) could help school staff in recognising mental health problems within the school setting. Thus, the B-PSEs scale was conceived to measures unintrusive school experiences as a proxy measure of adolescent mental health risk that circumvents mental health privacy and stigmatisation concerns. Burns and Rapee (2019) suggested that screening for issues that school staff can understand and relate to may also be more socially acceptable than symptom screening. The non-symptom-based approach used in the development of the B-PSEs scale could also support schools in identifying strengths-based characteristics of mental health and wellbeing which may mitigate the effect of adversities experienced by adolescents (Humphrey & Wigelsworth, 2016). Crucially, the B-PSEs measure was designed to permit completion in a short timeframe using an online survey tool within a school ICT suite, helping alleviate the practicality concerns of mental health screening in schools (Dever et al., 2012).
Whilst a range of school climate and experience measures exist (See Supplemental Table 1S), no brief and psychometrically robust scale (<20 items) that focuses on the measurement of positive social experiences in school that are most likely to have a positive impact on adolescent mental health has yet been developed. For example, whilst Anderson-Butcher et al. (2012) developed a brief and psychometrically robust measure of perceived school experiences, it was designed to support social workers in assessing important youth protective factors, without a mental health focus.
Grazia and Molinari (2021), in a systematic review of school climate measurement, highlighted that the school climate construct is multidimensional and that consensus on the number of school climate dimensions, as well as their labels, has not been found. For example, some studies suggest that there are four dimensions (e.g. Cohen et al., 2009; Wang & Degol, 2016), whilst others have suggested five dimensions (e.g. Thapa et al., 2013; Zullig et al., 2010). The B-PSEs scale was developed to be comprised of a relatively small number of items, selected and further developed from a range of previously validated measures and based on specific criteria relating to their potential impact on adolescent mental health (See Method). Thus, given the specific aims of this study and the present ambiguity in relation to school climate dimensions, it was difficult to hypothesise factor structure quantities and labels for the new B-PSEs measure a priori.
Present study
This study describes the development and piloting of the Brief Positive School Experiences scale (B-PSEs). This scale was conceived as part of a PhD project that developed a measure with robust psychometric properties to permit the investigation of associations between PSEs and adolescent mental health so that future studies can assess a potential rational for screening PSEs social factors within schools to support the assessment of adolescent mental health risk.
This study aimed to: (1) Develop a brief PSEs scale via consultation with secondary school teachers that can be practically administered by schools. (2) Provide an initial exploration of the psychometric properties of the new B-PSEs scale.
Research questions: (1) Can an interpretable factor structure for the B-PSEs scale be obtained via exploratory factor analysis? (2) If so, does the factor structure and dimensions show similarities with those in previous studies? (3) Is the B-PSEs scale measuring the same construct as demonstrated by acceptable internal consistency? (4) Does the B-PSEs scale demonstrate correlations with adolescent mental health outcomes?
Method
Study design
Measurement development involved consultation with five post-primary school teachers. 460 school-going adolescents (aged 14–16) completed an online survey in school based on the newly developed items (N = 460).
Measure development
A thorough literature review of school experiences and climate measures was initially undertaken via searches of the ERIC, Scopus, Web of Science and Psycinfo databases to develop an item pool, identifying 33 subscales from 16 measures (See Supplemental Table 1S).
Due to COVID-19 related difficulties, an informal online video consultation with five secondary school teachers was undertaken using a convenience sampling method. Consultations with teachers allowed for discussions on the PSEs construct with those who are likely to have agency in promoting PSEs in the future. Critically however, whilst engaging the actual populations targeted by new measures in group discussions represents an ideal method of gaining important information to identify, select and refine items (Nassar-McMillan & Borders, 2002), engaging with an adolescent student focus group during the lockdown phase of the COVID-19 pandemic was unfeasible.
Teacher participants were engaged with via mobile app message to assess interest in participating in the consultations. Those who confirmed an interest in participating were invited to participate via a courtesy telephone call. Participants were then provided with the details of the study and consent was granted. A convenient time to carry out the group session was then organised with all participants via mobile app message. Teachers involved in the consultation were employed in a range of school types (e.g., Mixed-sex secondary, all-girls secondary and mixed-sex grammar), and across several NI Education Authority Regions, therefore increasing representativeness.
Participants were presented with the list of the school experience and climate measure subscales. Participants reduced the number of subscale themes gathered by literature review from 33 to 15 via a simple collaborative ranking. Subscales were retained based on the following criteria: (1) most likely to have a positive impact on adolescent mental health; (2) relevance for school staff; and (3) potential for schools and / or families to positively influence the subscale theme. The selected subscales are presented in Supplemental Table 2S. Participants then examined the items associated with each subscale theme and using a deductive method they selected, adapted or generated 19 of their own PSEs with the previous criteria in mind. Using an inductive approach, participants also included PSEs they considered important that may not have been included in previous measures. Poorly worded items were modified giving the final items a Flesch–Kincaid Grade Level of 5.5, suggesting the questionnaire was appropriate for 7th grade readers (i.e., appropriate for 12 years +).
Measure testing
Data collection
Adolescent participants were recruited through five secondary schools in Northern Ireland (NI). Due to COVID-19 recruitment difficulties, a convenience sampling method was utilised. Schools based across three of the five NI Education Authority regions participated. Schools were invited to participate via email and a variety of school types were included. Participating schools disseminated a parent and student study information pack to all students which contained parent and student informed consent forms. A total of 715 participants were invited to participate in the study of which four hundred and sixty consented to participate (64% response rate). Participants completed a 10-to-15-min online survey in school which measured PSEs, PCEs, adolescent mental health and demographic data. Participation was voluntary and all data were collected anonymously. Ethical approval for the study was provided by the University Ethics Board on September 18th, 2020. The survey was administered between October 5TH 2020 to June 22ND 2021.
Participants
Participating teachers’ age ranged from 39 to 62 years. Teachers were 60% female, 40% male. Participating adolescent students’ age ranged from 14 to 16 years. Students were 56.7% female, 43.3% male. 92.4% of students were born in NI.
Measures
Depression symptoms
Depressive symptoms were measured using the validated 8-item Patient Health Questionnaire (PHQ-8; Kroenke et al., 2009). PHQ-8 items were rated from 0 (not at all) to 3 (nearly every day), assessing the frequency of depressive symptoms experienced, such as sleep problems, concentration issues, lethargy and low self-esteem, over a 14-day period prior to answering. Scores range from 0 to 24. Previous Cronbach’s alpha of 0.91 has been measured in an adolescent sample (Peh et al., 2017).
Anxiety symptoms
Anxiety symptoms were measured using the validated 7-item Generalized Anxiety Disorder scale (GAD-7; Spitzer et al., 2006). GAD-7 items were rated from 0 (not at all) to 3 (nearly every day), assessing the frequency of anxiety symptoms experienced, such as feeling nervous or on edge, irritable, and feeling afraid that something awful might happen, over a 14-day period prior to answering. Scores range from 0 to 21. Previous Cronbach’s alpha of 0.91 has been measured in an adolescent sample (Tiirikainen et al., 2019).
Data analysis
Initial item deletion
Lamping et al. (2002) suggest that items with 5% or greater missing data should be removed and that any item with 80% or more endorsement in one category be eliminated to prevent ceiling effects. However, high endorsement (
Descriptive statistics
Total endorsement for each of the PSE items, and endorsement stratified by gender was calculated. Chi square tests of independence between male and female PSEs endorsement scores were undertaken.
Exploratory factor analysis
In phase one, the factorability of the data was assessed using the Kaiser–Meyer–Olkin (KMO) measure of sampling adequacy and Bartlett’s test of sphericity. A KMO minimum for factor analysis of .60 has been suggested (Tabachnick & Fidell, 2013) and a significant (p < .05) probability value for Bartlett’s test of sphericity indicates that the data are suitable for factor analysis. Phase two determined the optimal number of factors using exploratory factor analysis (EFA) and parallel test. EFA was conducted to identify items for elimination due to weak psychometric performance. A series of five EFA models, with one through to five correlated factors, were specified and tested using Mplus 8.2 (Muthén & Muthén, 2017). An oblique rotation was used for all models with more than one factor, given the likelihood that any distinct factors comprised of items relating to individuals’ school experiences would correlate. Oblique rotation thus permits factor intercorrelations to emerge (Watkins, 2018). The Geomin rotation method was utilised in Mplus 8.2 as it tolerates small cross-loadings and minimises the number of high loadings, therefore helping prevent overly complex or simple results. As all 19 items of the B-PSEs item pool were binary, they were modelled as categorical variables using the mean and variance adjusted weighted least squares estimator (WLSMV) based on the tetrachoric correlation matrix of latent continuous response variables. The WLSMV estimator is the most appropriate statistical treatment of categorical indicators in an EFA context. Other methods of analysis, such as maximum likelihood estimation, tend to produce incorrect standard errors, attenuate the relationships between observed variables, and produce possible pseudo-factors (Brown, 2006). The WLSMV estimator has been shown to produce correct parameter estimates, standard errors and test statistics (Flora & Curran, 2004 in Lambek et al., 2017).
The goodness of fit for each model was assessed using the WLSMV chi-square (Muthén & Muthén, 2017), the comparative fit index (CFI; Bentler, 1990) and the Tucker-Lewis Index (TFI; Tucker & Lewis, 1973). A non-significant chi-square and values greater than .90 for the CFI and TLI are considered to reflect acceptable fit. Additionally, the Root Mean Square Error of Approximation (RMSEA; Steiger, 1980) and the Standardised Root Mean Residual (SRMR; Bentler, 1995) were reported, where a value less than .05 indicates close fit and values up to .08 indicates reasonable errors of approximation (Jöreskog & Sörbom, 1993). The optimal number of factors was also assessed in the FACTOR Programme Version 12 (Lorenzo-Seva & Ferrando, 2021) using a parallel test for ordered polytomous items (Timmerman & Lorenzo-Seva, 2011). This generated 500 random data sets that were factor analysed, and the eigenvalues obtained and recorded. The mean and 95th percentile eigenvalues from the ‘parallel data’ are then compared to those from the original data. If the eigenvalue of a factor from the original data is greater than the 95th percentile eigenvalue of the parallel factor, that factor is retained. There was no missing data.
Reliability analysis
Composite reliability was calculated.
Correlation analysis
The total PSE scale and subscale scores were correlated with the criterion variables.
Results
Descriptive statistics
Total PSE scores ranged from 5 to 19 with a mean of 14.16 (SD = 3.03). 12.1% of participants had 10 or less PSEs. 46.7% endorsed 15 or more PSEs. 26.3% of participants reported 17 or more PSEs. Supplemental Table 3S shows the total endorsement of each of the PSE items, and endorsement stratified by gender.
Initial item elimination
Several of the PSEs items showed high endorsement levels (≥80%) but were not removed as high endorsement was expected. For example, the item relating to having at least one good friend in school was considered critical to include given the potential mental health repercussions of not having at least one good friend in school, as well as the necessity for schools to be able to identify such students who may require interventional support.
Exploratory factor analysis
Fit statistics for exploratory factor analysis of the positive school experiences scale.
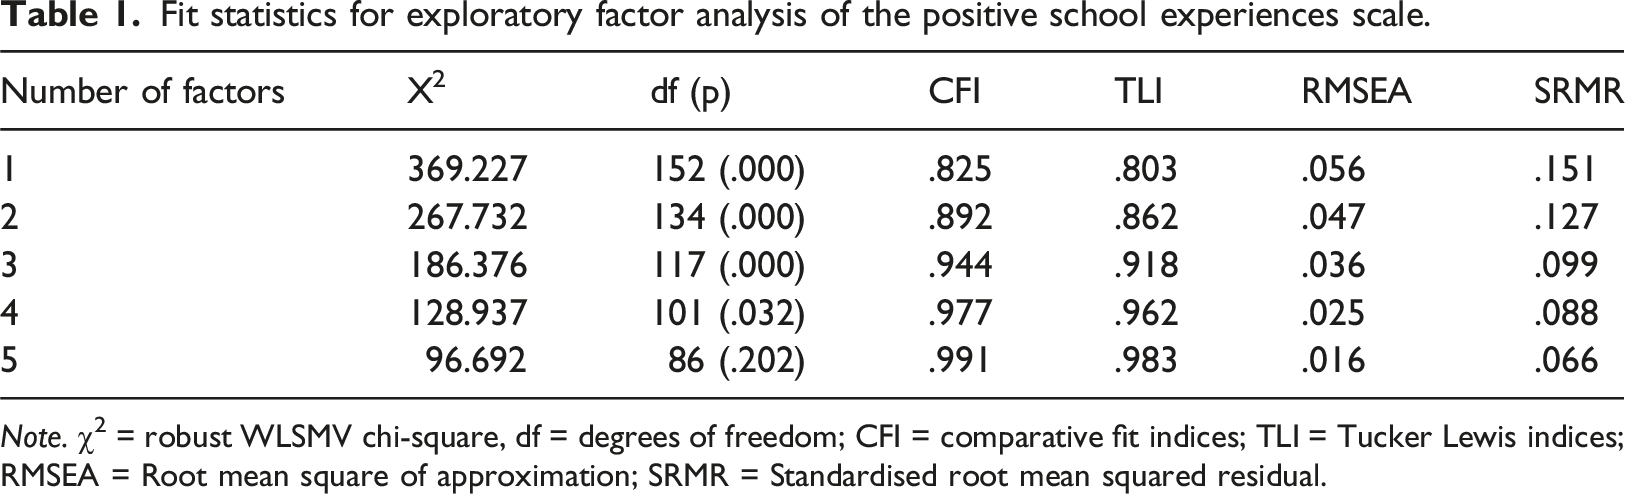
Note. χ2 = robust WLSMV chi-square, df = degrees of freedom; CFI = comparative fit indices; TLI = Tucker Lewis indices; RMSEA = Root mean square of approximation; SRMR = Standardised root mean squared residual.
The parallel analysis further supported the three-factor solution as the percentages of variance explained by only the first three factors were larger than the estimated 95th percentile of the first three factors based on random data (Factor 1: Real 30.40, Random = 12.62; Factor 2: Real 11.64, Random = 11.11; Factor 3: Real 10.67, Random = 9.94).
Standardised Factor Loadings for 3-Factor Solution.
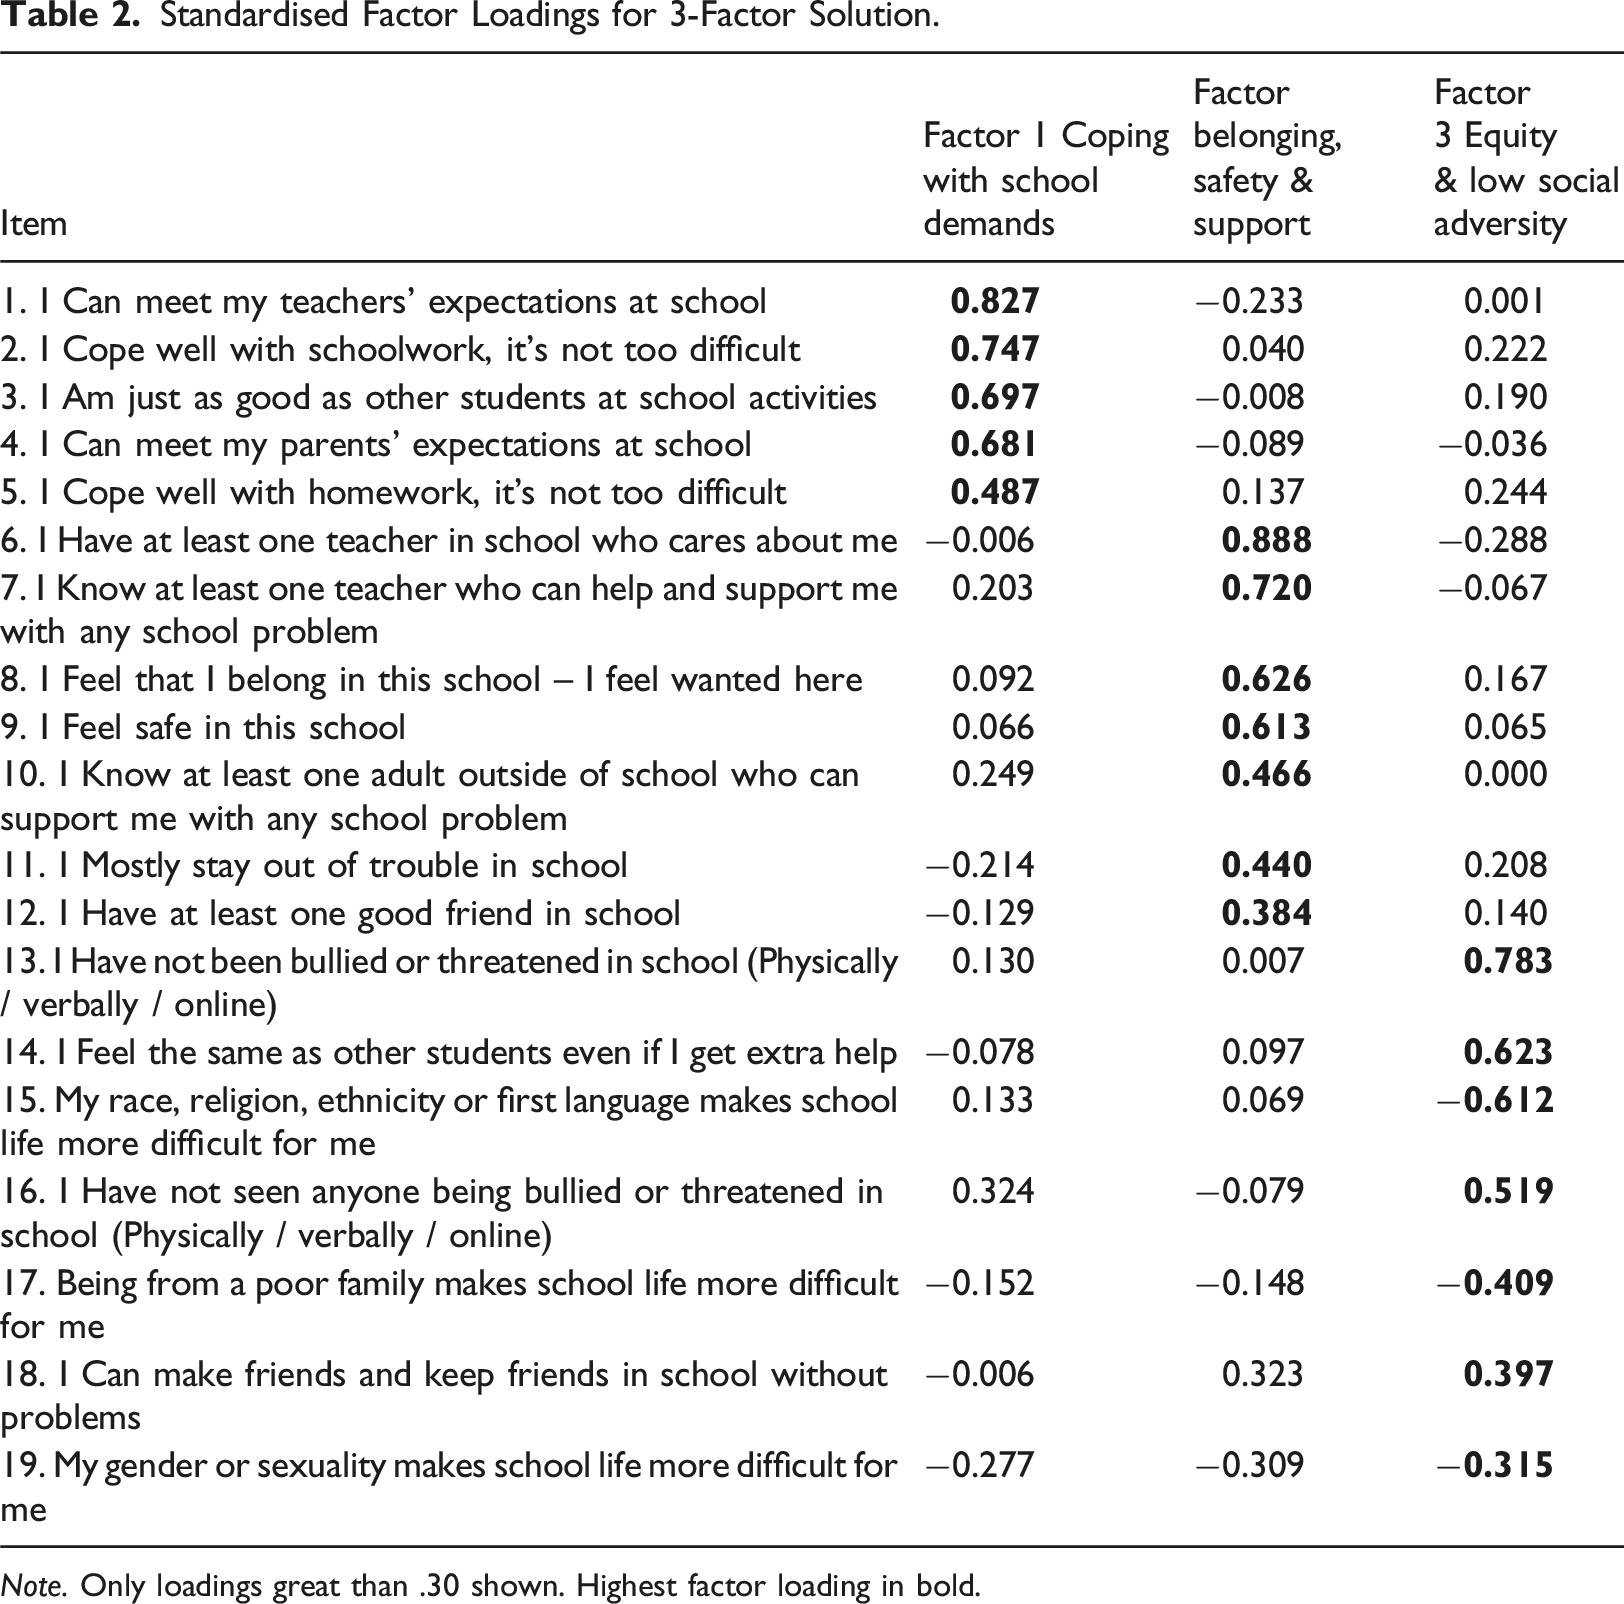
Note. Only loadings great than .30 shown. Highest factor loading in bold.
Reliability Analysis
Composite reliability (CR) was deemed acceptable for the total scale (CR = .91) and all subscales: Coping with school demands (CR = .82), school belonging, safety and support (CR = .80), and equity and low social adversity (CR = .73).
Correlation analysis
Means (SD) and Bi-Variate Correlations for Total and Subscale PSEs Scores and Adolescent Mental Health.
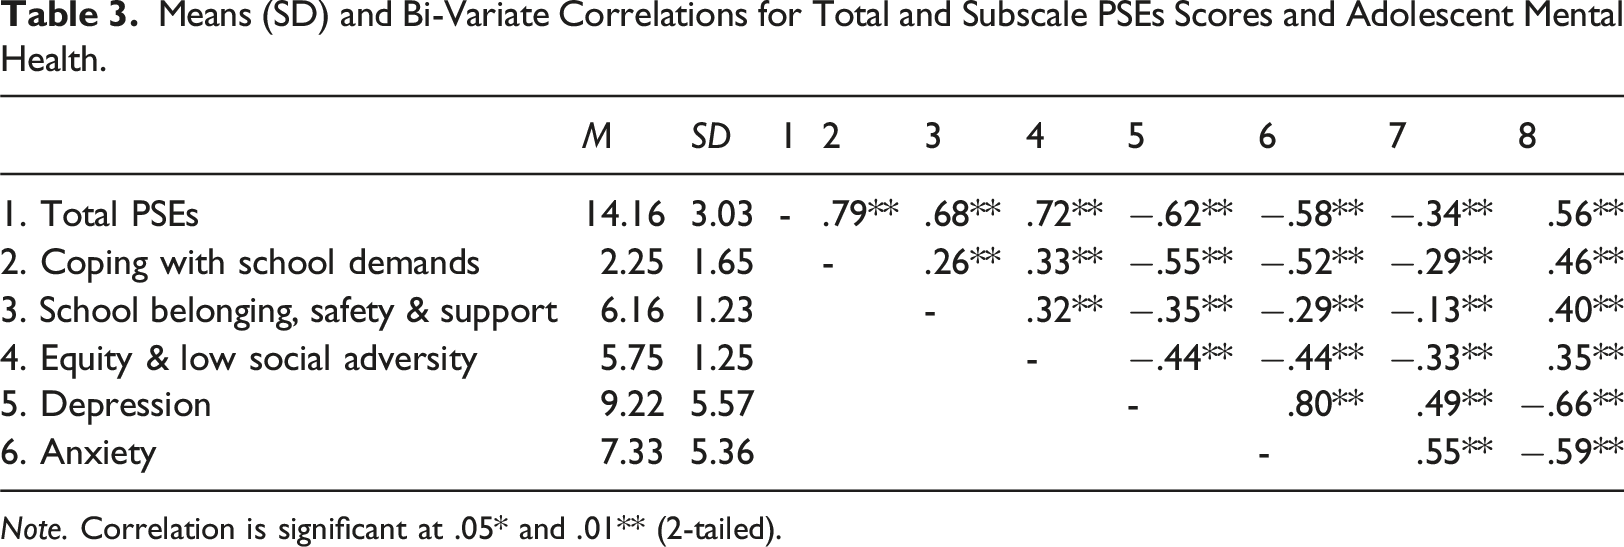
Note. Correlation is significant at .05* and .01** (2-tailed).
Discussion
This study identified an interpretable three-factor solution; (1) Coping with school demands; (2) Perceived school belonging, safety and support; and (3) Equity and low social adversity. Whilst the coping with school demands and perceived school belonging, safety and support dimensions can easily be equated with the safety, social relationships and academic related dimensions reported in previous literature (e.g., Cohen et al., 2009; Wang & Degol, 2016; Zullig et al., 2010), the separation of the equity and low social adversity dimension from the safety and relationships dimensions was noted as novel. This finding suggests that equity and low social adversity items used in this study are measuring a construct distinct from perceptions of security and support. This suggests that despite adolescents’ sense of school belonging and perceptions of safety and support, there is an independent equity and low social adversity dimension which encompasses experiences of bullying, school difficulties related to race, religion, ethnicity, gender, sexuality and subjective poverty, and issues with forming friendships. Interestingly, this dimension showed moderate to strong correlations with adolescent mental health outcomes and thus appears an important dimension to include in social factor school-based measures that may be under development to support the screening of adolescent mental health outcomes. Critically, three of the items related to specific social difficulties in the equity and low social adversity dimension showed negative factor loadings. Namely, the ‘My race, religion, ethnicity or first language makes school life more difficult for me’, ‘Being from a poor family makes school life more difficult for me’ and ‘My gender or sexuality makes school life more difficult for me’ items loaded negatively and this issue highlighted that these items require positive rephrasing in order to avoid the negative factor loadings demonstrated, as well as maintain the conceptual integrity of the scale as a measure of positive school experiences. Similarly, the two items related to having not been bullied or not seen bullying in school require rephrasing to maintain the conceptual integrity of the scale as a measure of positive school experiences. Item rephrasing that encompasses the presence of school bullying preventative measures, the necessary support to deal with bullying, or the individual’s ability to cope after bullying may be beneficial.
Two items from factor three related to making friends and keeping friends in school (item 18), and gender or sexuality making school life more difficult (item 19), cross-loaded on multiple factors. Firstly, these items were retained based on their individual associations with adolescent mental health outcomes, face validity and obvious utility in a measure of cumulative adolescent PSEs. For example, given that rates of friendship stability are relatively low after the primary – secondary school transitioning phase and that maintaining friendships during the transition to post-primary school may contribute to better adolescent mental health (Ng-Knight et al., 2019), the item related to making friends and keeping friends in school was deemed particularly important to retain to provide schools with PSEs data for adolescents transitioning between schools. Similarly, the item related to gender or sexuality making school life more difficult was viewed as important to retain in a measure of PSEs given potential gender variations in relation to resilient outcomes (Afek et al., 2021), and the mental health disparities for sexual/gender minority youth such as increased anxiety and depression symptoms (Kosciw et al., 2020). Thus, the omission of such PSEs data at this preliminary stage of investigation appeared imprudent. Secondly, rephrasing of these items in follow up studies that further refine the items and probe the psychometric properties of the B-PSEs scale may help attenuate these cross-loading issues.
Significantly large discrepancies in the percentage of item positive endorsement between males and females were also noted. Significant differences in male versus female positive endorsement frequency scores were recorded for items relating to meeting teachers’ expectations, coping well with schoolwork, and feeling just as good as other students at school activities, with males endorsing these items more often. As with Campbell et al.’s (2021) ubiquitous finding of poorer mental outcomes for girls in a comprehensive cross-national study across 73 countries, the findings in this study suggest that gender differences exist in relation to certain PSEs and that school efforts to promote specific PSEs amongst their students should take these gender related differences into account.
It is also important to note that socioeconomic or cultural factors can influence how adolescents respond to a school experience or climate measure. Students from lower socioeconomic backgrounds may face stressors such as financial insecurity or reduced access to educational resources, influencing their perceptions of school climate and school belonging which can lead to more negative responses. Additionally, students from minority or immigrant backgrounds may experience language barriers that can affect their understanding of items in school climate measures which could lead to misinterpretation and potentially under-reporting or over-reporting of positive experiences.
Importantly, the new 19 PSEs item scale showed excellent composite reliability, whilst the PSEs subscales (Coping with school demands; school belonging, safety and support, and equity and low social adversity) also demonstrated good reliability. Together these reliability findings suggest that the B-PSEs scale and subscale items are consistent and that the items are indeed measuring the same construct. This finding should provide confidence to researchers who wish to assess predictive associations between cumulative PSEs and adolescent mental health outcomes in the future, which now appears prudent given that the B-PSEs full scale and subscales have shown correlations with adolescent anxiety and depression symptoms.
Limitations
As the development of a measurement scale was not the primary intention of the original PhD study, the preliminary nature of the psychometric exploration of the B-PSEs scale should be considered a limitation. Whilst it has been shown that the scale is a reliable measure of the PSEs construct, the study is limited by the cross-sectional nature of data collection due to COVID-19 and time constraints. Test-retest reliability, confirmatory factor analysis and assessments of concurrent validity with established measures of school climate were not undertaken and future studies should now do so. Future studies should also consider the post hoc refinement of items that demonstrated negative and problematic cross-loading. Should problematic item cross-loadings still persist, the removal of these items must be considered. Another limitation includes the administration of the B-PSEs scale to a specific adolescent age group, as its psychometrics properties cannot be assumed for other ages. The initial item pool development that was collated via teacher consultation did not include adolescent student input due to COVID-19 restrictions, which may have uncovered other relevant items. Adolescent student contributions on the refinement of items, or development of further items, should be included in the next stage of scale development.
Conclusion
Descriptive statistics show that the B-PSEs scale can practically and reliably identify students with low PSEs scores and evaluate the prevalence of specific PSEs in school cohorts and may therefore be used to support schools in the promotion of specific PSEs that they consider deficient as part of mental health interventions. The B-PSEs scale requires further psychometric evaluation. However, given the evidenced predictive associations between B-PSEs scale scores and adolescent mental health outcomes whilst accounting for relevant covariates, (Hamill et al., 2024; manuscript submitted for publication), the B-PSEs scale appears worthy of further psychometric investigation. Siceloff et al. (2017) suggest that universal mental health screeners should include protective factors associated with mental health outcomes to support the identification of youth who would benefit from targeted preventative mental health assistance. PSEs as a potential screener of mental health risk and wellbeing by proxy is likely to be accepted by schools in NI and would complement the observational identification of youth with mental health needs by school staff. Crucially, there is no statutory formal training in the recognition of poor adolescent mental health for school staff in NI, therefore this study also posits that an acceptable universal mental health risk screening measure based on PSEs would be greatly valued by schools, particularly if it has practical qualities. Given that a small portion of UK schools use universal mental health screening to assess student mental health (Marshall et al., 2017), the B-PSEs scale shows early promise in supporting adolescent mental health screening in UK schools and could easily be integrated into ongoing mental health interventions and programmes based on its practicality in administration.
Evidence relating to B-PSEs scale sensitivity and specificity in identifying adolescent mental health outcomes should now be gathered. This may provide evidence of the potential for schools to use the B-PSEs measure to screen for adolescent mental health risk or to support the development and selection of appropriate interventions.
Supplemental Material
Supplemental Material - A preliminary psychometric investigation of a brief positive school experiences scale
Supplemental Material for A preliminary psychometric investigation of a brief positive school experiences scale by Ryan Hamill, Lisa Bunting and Mark Shevlin in Clinical Child Psychology and Psychiatry
Footnotes
Declaration of conflicting interests
The author(s) declared no potential conflicts of interest with respect to the research, authorship, and/or publication of this article.
Funding
The author(s) disclosed receipt of the following financial support for the research, authorship, and/or publication of this article: This research was undertaken as part of a PhD project that was funded by the Department for the Economy Northern Ireland.
Ethical statement
Data Availability Statement
The data are not publicly available due to restrictions to protect the privacy of research participants.
Supplemental Material
Supplemental material for this article is available online.
Author Biographies
References
Supplementary Material
Please find the following supplemental material available below.
For Open Access articles published under a Creative Commons License, all supplemental material carries the same license as the article it is associated with.
For non-Open Access articles published, all supplemental material carries a non-exclusive license, and permission requests for re-use of supplemental material or any part of supplemental material shall be sent directly to the copyright owner as specified in the copyright notice associated with the article.