
Abstract
Introduction:
Patients with chronic limb-threatening ischemia (CLTI) have high mortality rates after revascularization. Risk stratification for short-term outcomes is challenging. We aimed to develop machine-learning models to rank predictive variables for 30-day and 90-day all-cause mortality after peripheral vascular intervention (PVI).
Methods:
Patients undergoing PVI for CLTI in the Medicare-linked Vascular Quality Initiative were included. Sixty-six preprocedural variables were included. Random survival forest (RSF) models were constructed for 30-day and 90-day all-cause mortality in the training sample and evaluated in the testing sample. Predictive variables were ranked based on the frequency that they caused branch splitting nearest the root node by importance-weighted relative importance plots. Model performance was assessed by the Brier score, continuous ranked probability score, out-of-bag error rate, and Harrell’s C-index.
Results:
A total of 10,114 patients were included. The crude mortality rate was 4.4% at 30 days and 10.6% at 90 days. RSF models commonly identified stage 5 chronic kidney disease (CKD), dementia, congestive heart failure (CHF), age, urgent procedures, and need for assisted care as the most predictive variables. For both models, eight of the top 10 variables were either medical comorbidities or functional status variables. Models showed good discrimination (C-statistic 0.72 and 0.73) and calibration (Brier score 0.03 and 0.10).
Conclusion:
RSF models for 30-day and 90-day all-cause mortality commonly identified CKD, dementia, CHF, need for assisted care at home, urgent procedures, and age as the most predictive variables as critical factors in CLTI. Results may help guide individualized risk-benefit treatment conversations regarding PVI.
Keywords
Introduction
Chronic limb-threatening ischemia (CLTI) presents as resting ischemic leg pain and/or tissue loss. CLTI has increased in prevalence, affecting 5–18% of the global population, due to the rise in rates of obesity, diabetes, mental health disorders, and chronic kidney disease (CKD).1,2 Management of CLTI has continued to challenge clinicians due to the advanced nature of disease at presentation and the complex comorbid profiles of patients. Current treatment strategies include cardiovascular risk factor management and revascularization, either lower-extremity bypass surgery (LEB) or endovascular peripheral vascular intervention (PVI), to improve symptoms and prevent amputation. However, all-cause mortality rates are high after PVI, with nearly 10% of patients dying within 3 months.3–5 Balancing the short-term mortality risk after revascularization against limb salvage and quality of life gains is crucial for determining who should undergo revascularization.
Although debate remains about the optimal method of revascularization for CLTI in the wake of recent randomized controlled trial data,3,4 guideline recommendations for selection of a revascularization strategy recommend an individualized approach tailored to patient preference and individual risk factors. 2 However, it remains unclear which patient-level factors, as assessed by clinicians prior to making a decision on a revascularization strategy, are associated with the risk of mortality after revascularization. As the number of PVIs has continued to grow, particularly for patients with CLTI determined to be at high risk for revascularization procedures, it has become increasingly important to accurately risk stratify patients prior to pursuing an endovascular approach.2,6 The existing survival prognostication models7–10 developed from registry data or clinical trials may no longer reflect contemporary patient characteristics, have limited or incomplete short-term mortality outcomes data, and are not specific to PVI as PVI and LEB are grouped together for risk estimation.
To bridge this gap, we aimed to create a contemporary risk prediction model in patients undergoing PVI for CLTI for (1) 30-day all-cause mortality and (2) 90-day all-cause mortality using Medicare claims-linked outcomes data in the Vascular Quality Initiative (VQI).
Methods
Study procedures
Lower-extremity vascular procedures from the PVI module in the VQI were included. 11 Patient demographics and characteristics were linked with Medicare claims-linked outcomes data through the Vascular Implant Surveillance and Interventional Outcomes Network (VISION) platform to provide for high-quality outcomes data. 12 Linkage methods have been previously described and validated, with high matching results and accuracy rate. Direct linkage, by social security number, and indirect linkage, by a variety of patient and site characteristics, with 93% matching results and > 99% accuracy rate, were used to merge the VQI data with the Medicare data.13,14
Study population
The population of interest was patients with lower-extremity CLTI undergoing PVI. Inclusion criteria were: (1) procedure for PVI for lower-extremity CLTI performed between January 1, 2017 and December 31, 2018; (2) age ⩾ 18 years; (3) Rutherford category 4, 5, or 6; and (4) first procedure performed if there were more than one procedures performed per patient. Exclusion criteria were: (1) acute limb ischemia; (2) patients with high rates of missing data (the upper limit for high rates of missing data was defined as the 3rd quartile + 1.5 * interquartile); and (3) patients not eligible for Medicare. This study was deemed exempt by the Yale University Institutional Review Board because of the deidentified nature of the VQI data.
Candidate predictor variables
Sixty-six candidate variables were selected for inclusion in random survival forest (RSF) models. Variables included preprocedural patient demographics, medical comorbidities and preprocedural medications, peripheral vascular characteristics and history including prior procedures and amputation, behavioral health comorbidities, and functional status variables. Demographic, medical comorbidities and medications, peripheral vascular history, and functional status were identified in the VQI. Behavioral health comorbidities were identified in the VISION database based on International Classification of Diseases (ICD)-9 and ICD-10 codes. Though the accuracy of ICD-9 and ICD-10 codes has not been formally assessed in the VQI, analysis in other administrative databases has shown few errors in administrative datasets. 15 A complete list of candidates can be found in online Supplemental Table 1. We used only preprocedural variables in our models as risk prognostication based on these variables provides clinically relevant information that is available to providers at the time that patients are evaluated, and a decision is made about revascularization. The level of arterial disease was included in the model as a predictor variable as information on involved arterial beds, assessed by noninvasive testing or diagnostic angiography, is frequently available to providers at the time of evaluation. Predictive candidate variables with a frequency of < 1% were combined to form a single rare characteristics covariate that was included in the model. A full list of variables included under the ‘rare characteristics’ variable can be found in online Supplemental Table 2. Candidate variables with > 20% of data missing were not included in the model.
Outcomes
The primary outcomes were (1) risk of 30-day all-cause mortality and (2) risk of 90-day all-cause mortality. All-cause mortality data were derived from the Centers for Medicare and Medicaid Services’ vital status files. Claims-linked data have been shown to accurately predict trial-adjudicated deaths, 16 and Medicare data have been demonstrated to capture 30% more deaths than VQI alone. 17 Patients were followed for 90 days after the index procedure, until December 31, 2019, or until death, whichever occurred first.
Statistical analysis
Patient characteristics were summarized as means (SD) or frequencies (%) for the overall cohort. Then, we constructed a RSF model for 30-day all-cause mortality. A RSF algorithm is a machine-learning method that builds many decision trees from random samples of the data and uses the averaged prediction from individual trees to rank the most important predictive variables for the outcome of interest. 18 RSF algorithms have been used in other cardiovascular populations, such as congestive heart failure (CHF), and have performed as well as traditional regression models while incorporating more than three times the number of variables that traditional models were able to use. 19 Candidate variables with > 20% of data missing were excluded from the model. All other missing data were managed by imputation using random forest imputation. 20 Data were split into a training sample (80% of data) to build the RSF and a testing sample (20% of data) to evaluate the RSF.
We further described the cohort by the training and testing samples to ensure similar baseline characteristics between the two datasets. Standard differences were calculated to measure effect sizes between groups, with an absolute standard difference lower than 0.1 considered negligible. 21
Next, the nodesize and mtry hyperparameters of the RSF were tuned as parameters minimizing the error rate from a grid search using 85% of the training sample.22 –24 Using the overall training sample, RSFs of 2000 decision trees were grown from bootstrapped samples with replacement. Ten candidate variables (mtry) were randomly chosen to split each branch based on the log-rank test statistic. Splitting of the branches continued until terminal branches had no fewer than 70 deaths (nodesize).
We then used the testing sample to determine the variables of importance based on how frequently the variable split branches near the origin of the tree, with importance weighted by variable relative importance plots, 25 as well as by minimal relative depth from the origin of the tree. 26
Lastly, the performance of the model was evaluated in the out-of-bag training sample and in the testing sample using the Brier score calculated over time, with scores ranging from 0 to 1 and scores ⩾ 0.25 indicating poor performance 27 ; continuous ranked probability score (CRPS), with scores ⩾ 0.25 indicating poor performance 27 ; out-of-bag error rate, with values ⩽ 0.5 indicating poor performance; and Harrel’s C-index, with values ⩽ 0.5 indicating poor performance.18,28 These steps were then repeated to train and validate the 90-day all-cause mortality model (with mtry = 10 and nodesize = 60).
All statistical analyses were performed using Stata Statistical Software, Release 16 (StataCorp LLC, College Station, TX, USA) and RSF models were built using the package randomForestSRC in R Statistical Software (v4.1.2; R Foundation for Statistical Computing, Vienna, Austria).
Results
Study population
The final cohort included 10,114 patients, with 10,091 patients (99.8%) undergoing PVI for occlusive CLTI. A STROBE (Strengthening the Reporting of Observational Studies in Epidemiology) diagram is presented in Figure 1. The mean age was 72 ± 11, 59% of patients were men, and 74% of patients were White. Overall, the most common comorbidities were hypertension (92%), diabetes (65%), and CKD (49% overall and 21% stage 5 CKD). Most patients presented with tissue loss (75%). Rates of guideline-directed medical therapy (GDMT) 2 were low with only one in three patients on an antiplatelet agent, statin, and angiotensin-converting enzyme inhibitor or angiotensin receptor blocker if hypertensive. The most frequently involved arteries were the superficial femoral and popliteal arteries (63%), and below-the-knee disease was present in 46% of patients. Patient characteristics (Table 1) and and peripheral vascular characteristics (Table 2) were similar between the training and testing samples, with standardized differences less than 0.1.
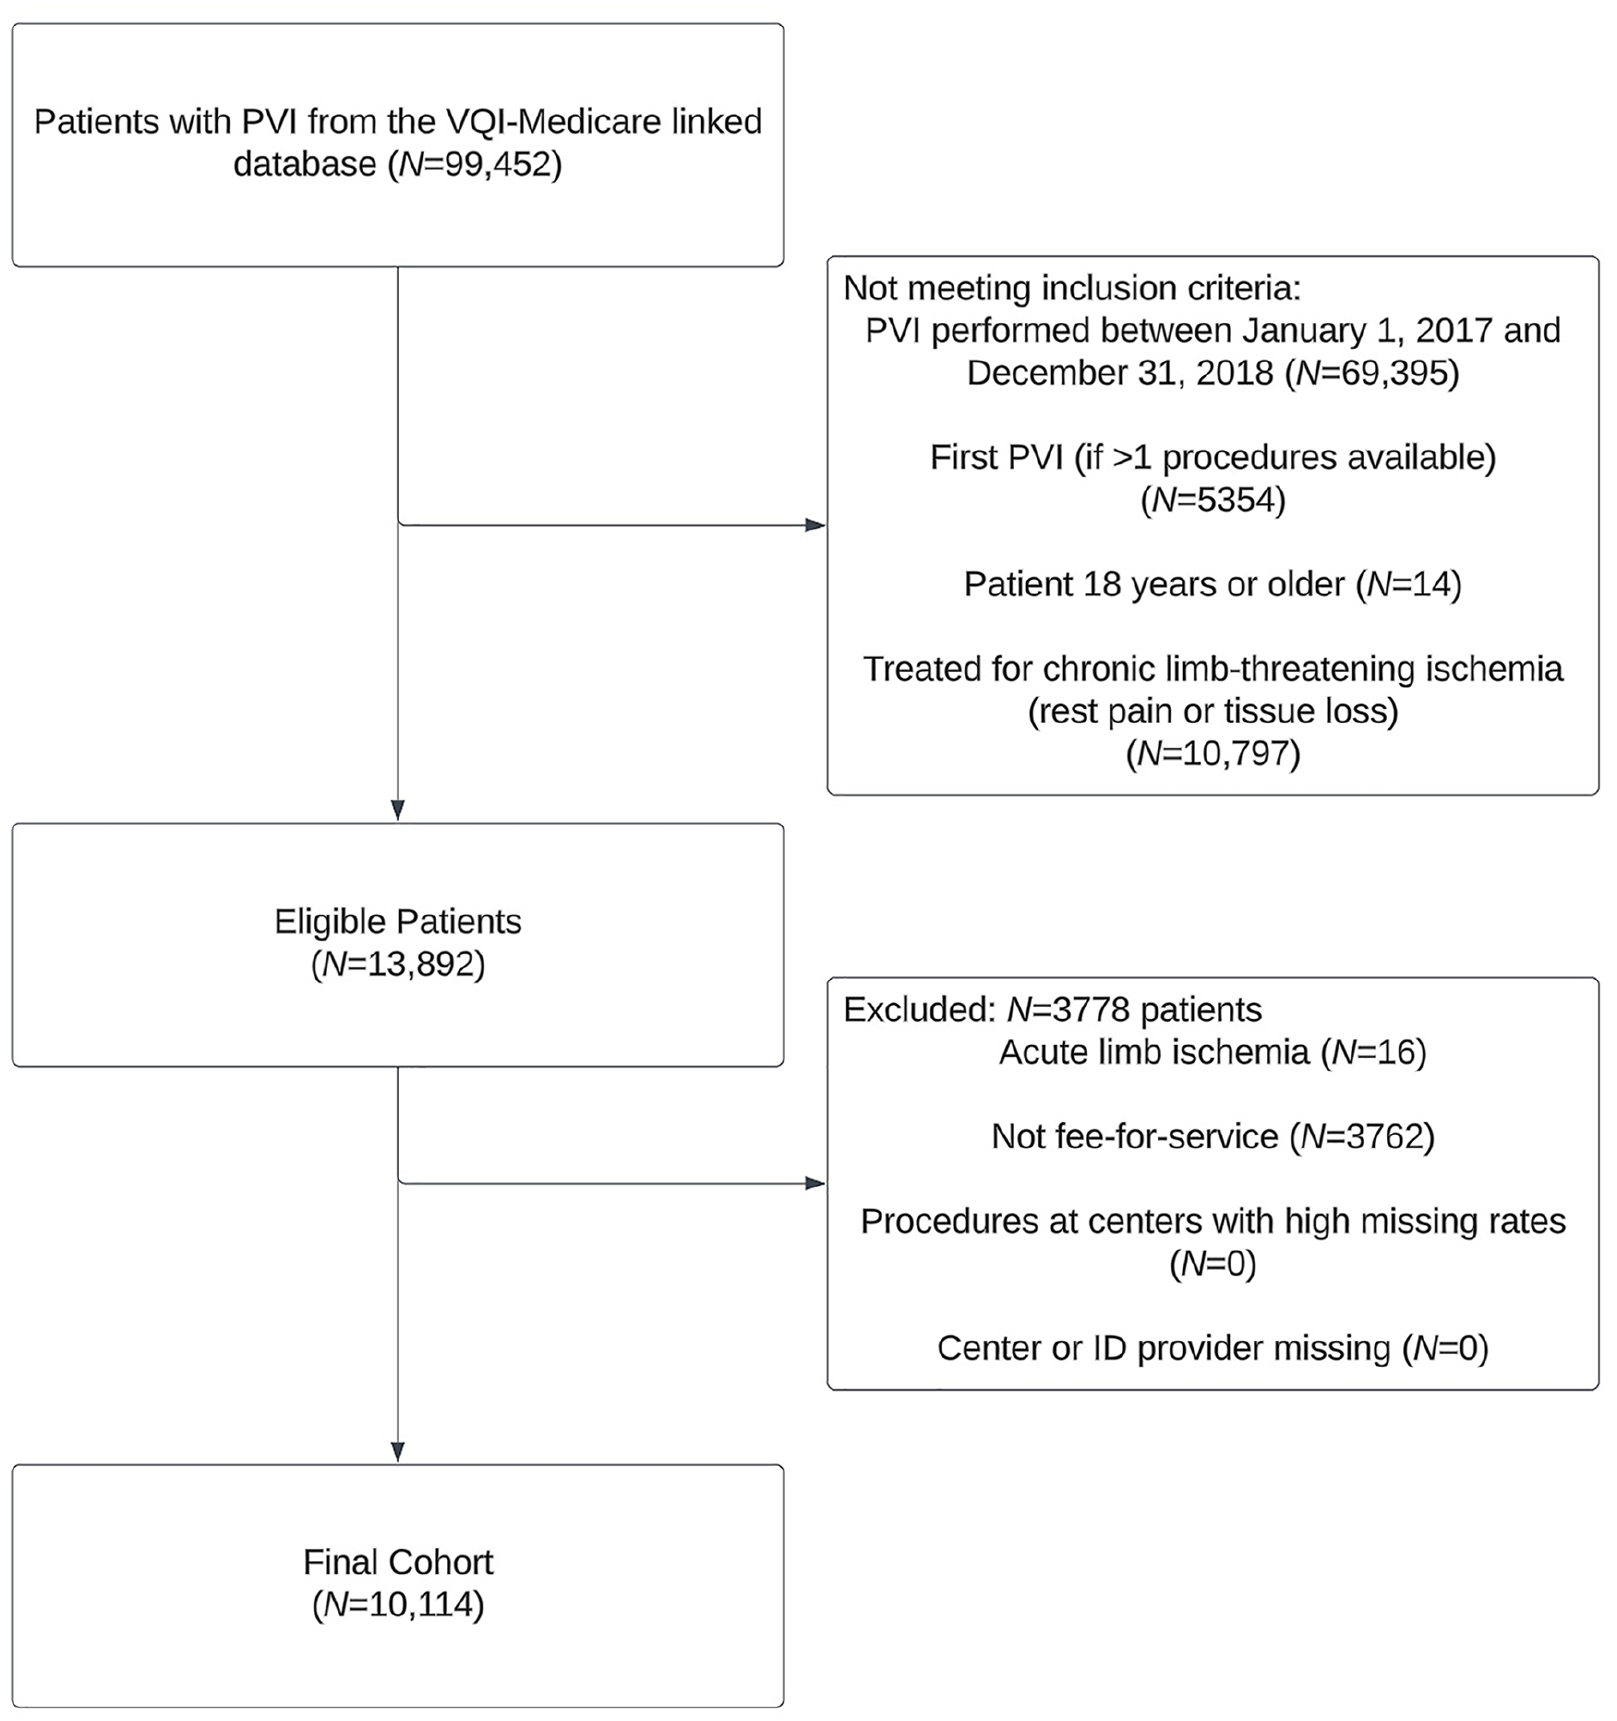
STROBE diagram of the study cohort. STROBE, Strengthening the Reporting of Observational Studies in Epidemiology.
Baseline characteristics of patients included from the Vascular Quality Initiative.
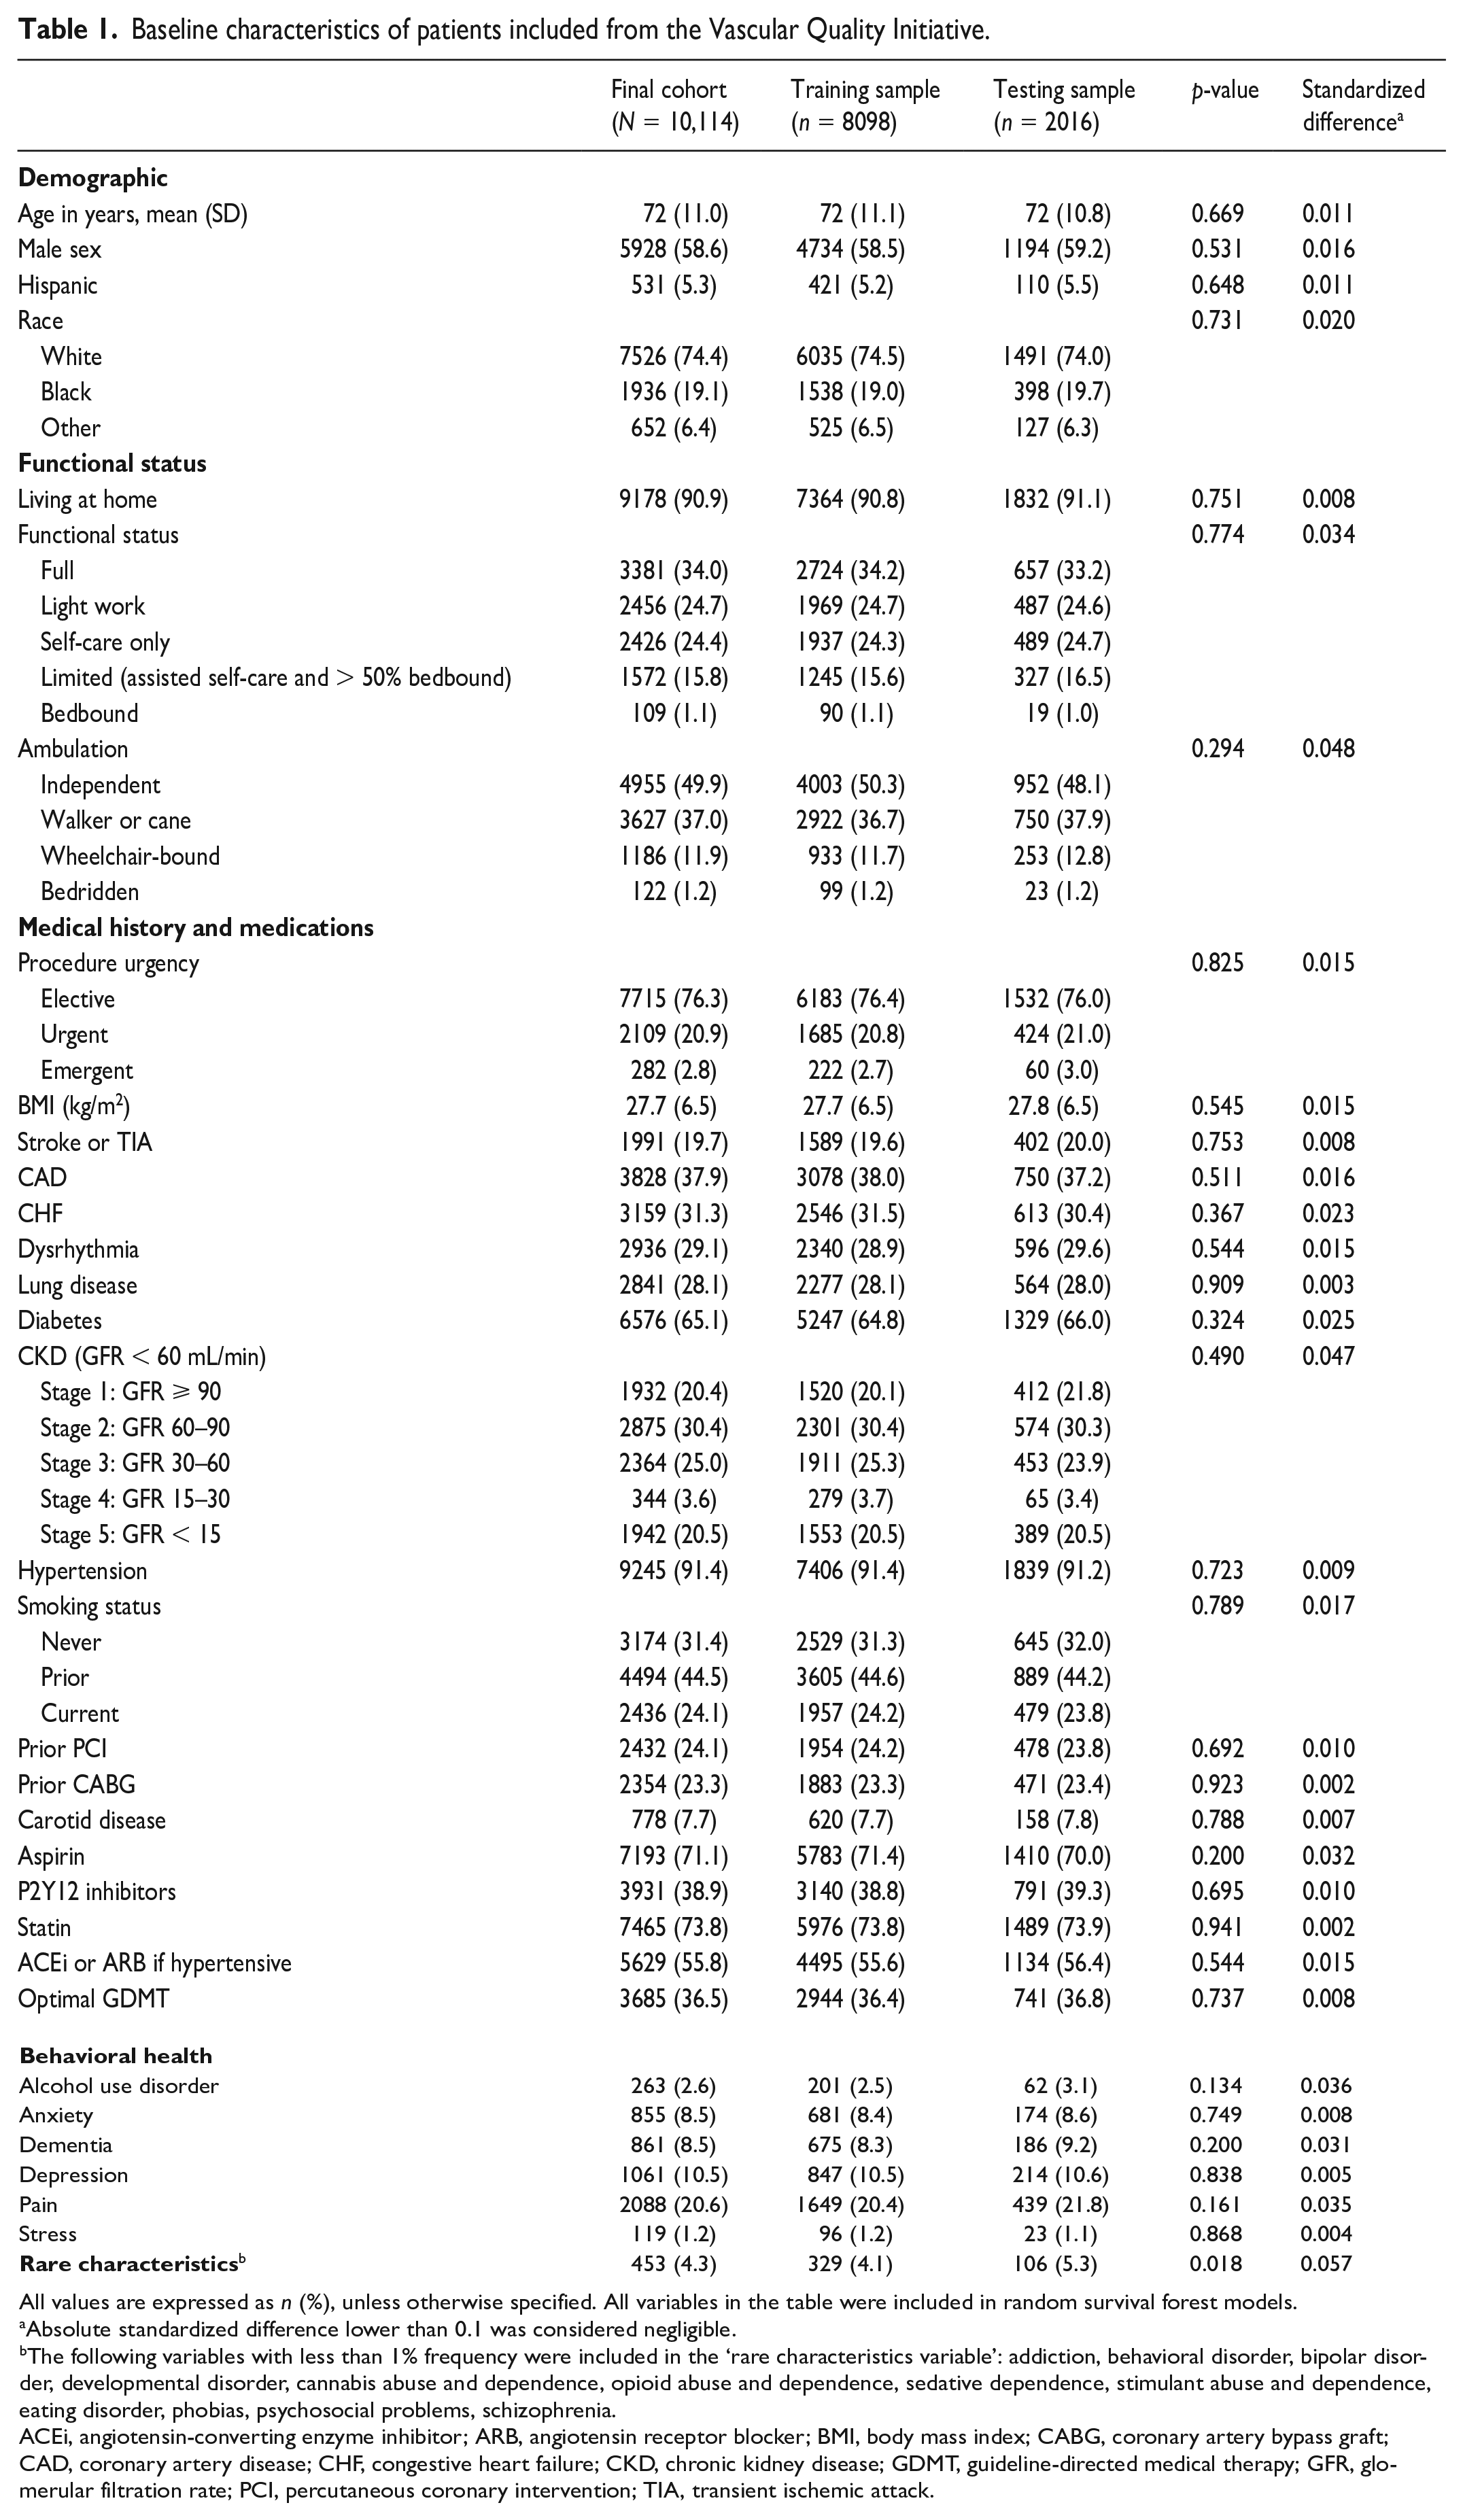
All values are expressed as n (%), unless otherwise specified.
All variables in the table were included in random survival forest models.
Absolute standardized difference lower than 0.1 was considered negligible.
The following variables with less than 1% frequency were included in the ‘rare characteristics variable’: addiction, behavioral disorder, bipolar disorder, developmental disorder, cannabis abuse and dependence, opioid abuse and dependence, sedative dependence, stimulant abuse and dependence, eating disorder, phobias, psychosocial problems, schizophrenia.
ACEi, angiotensin-converting enzyme inhibitor; ARB, angiotensin receptor blocker; BMI, body mass index; CABG, coronary artery bypass graft; CAD, coronary artery disease; CHF, congestive heart failure; CKD, chronic kidney disease; GDMT, guideline-directed medical therapy; GFR, glomerular filtration rate; PCI, percutaneous coronary intervention; TIA, transient ischemic attack.
Baseline peripheral vascular history and characteristics of patients included from the Vascular Quality Initiative.
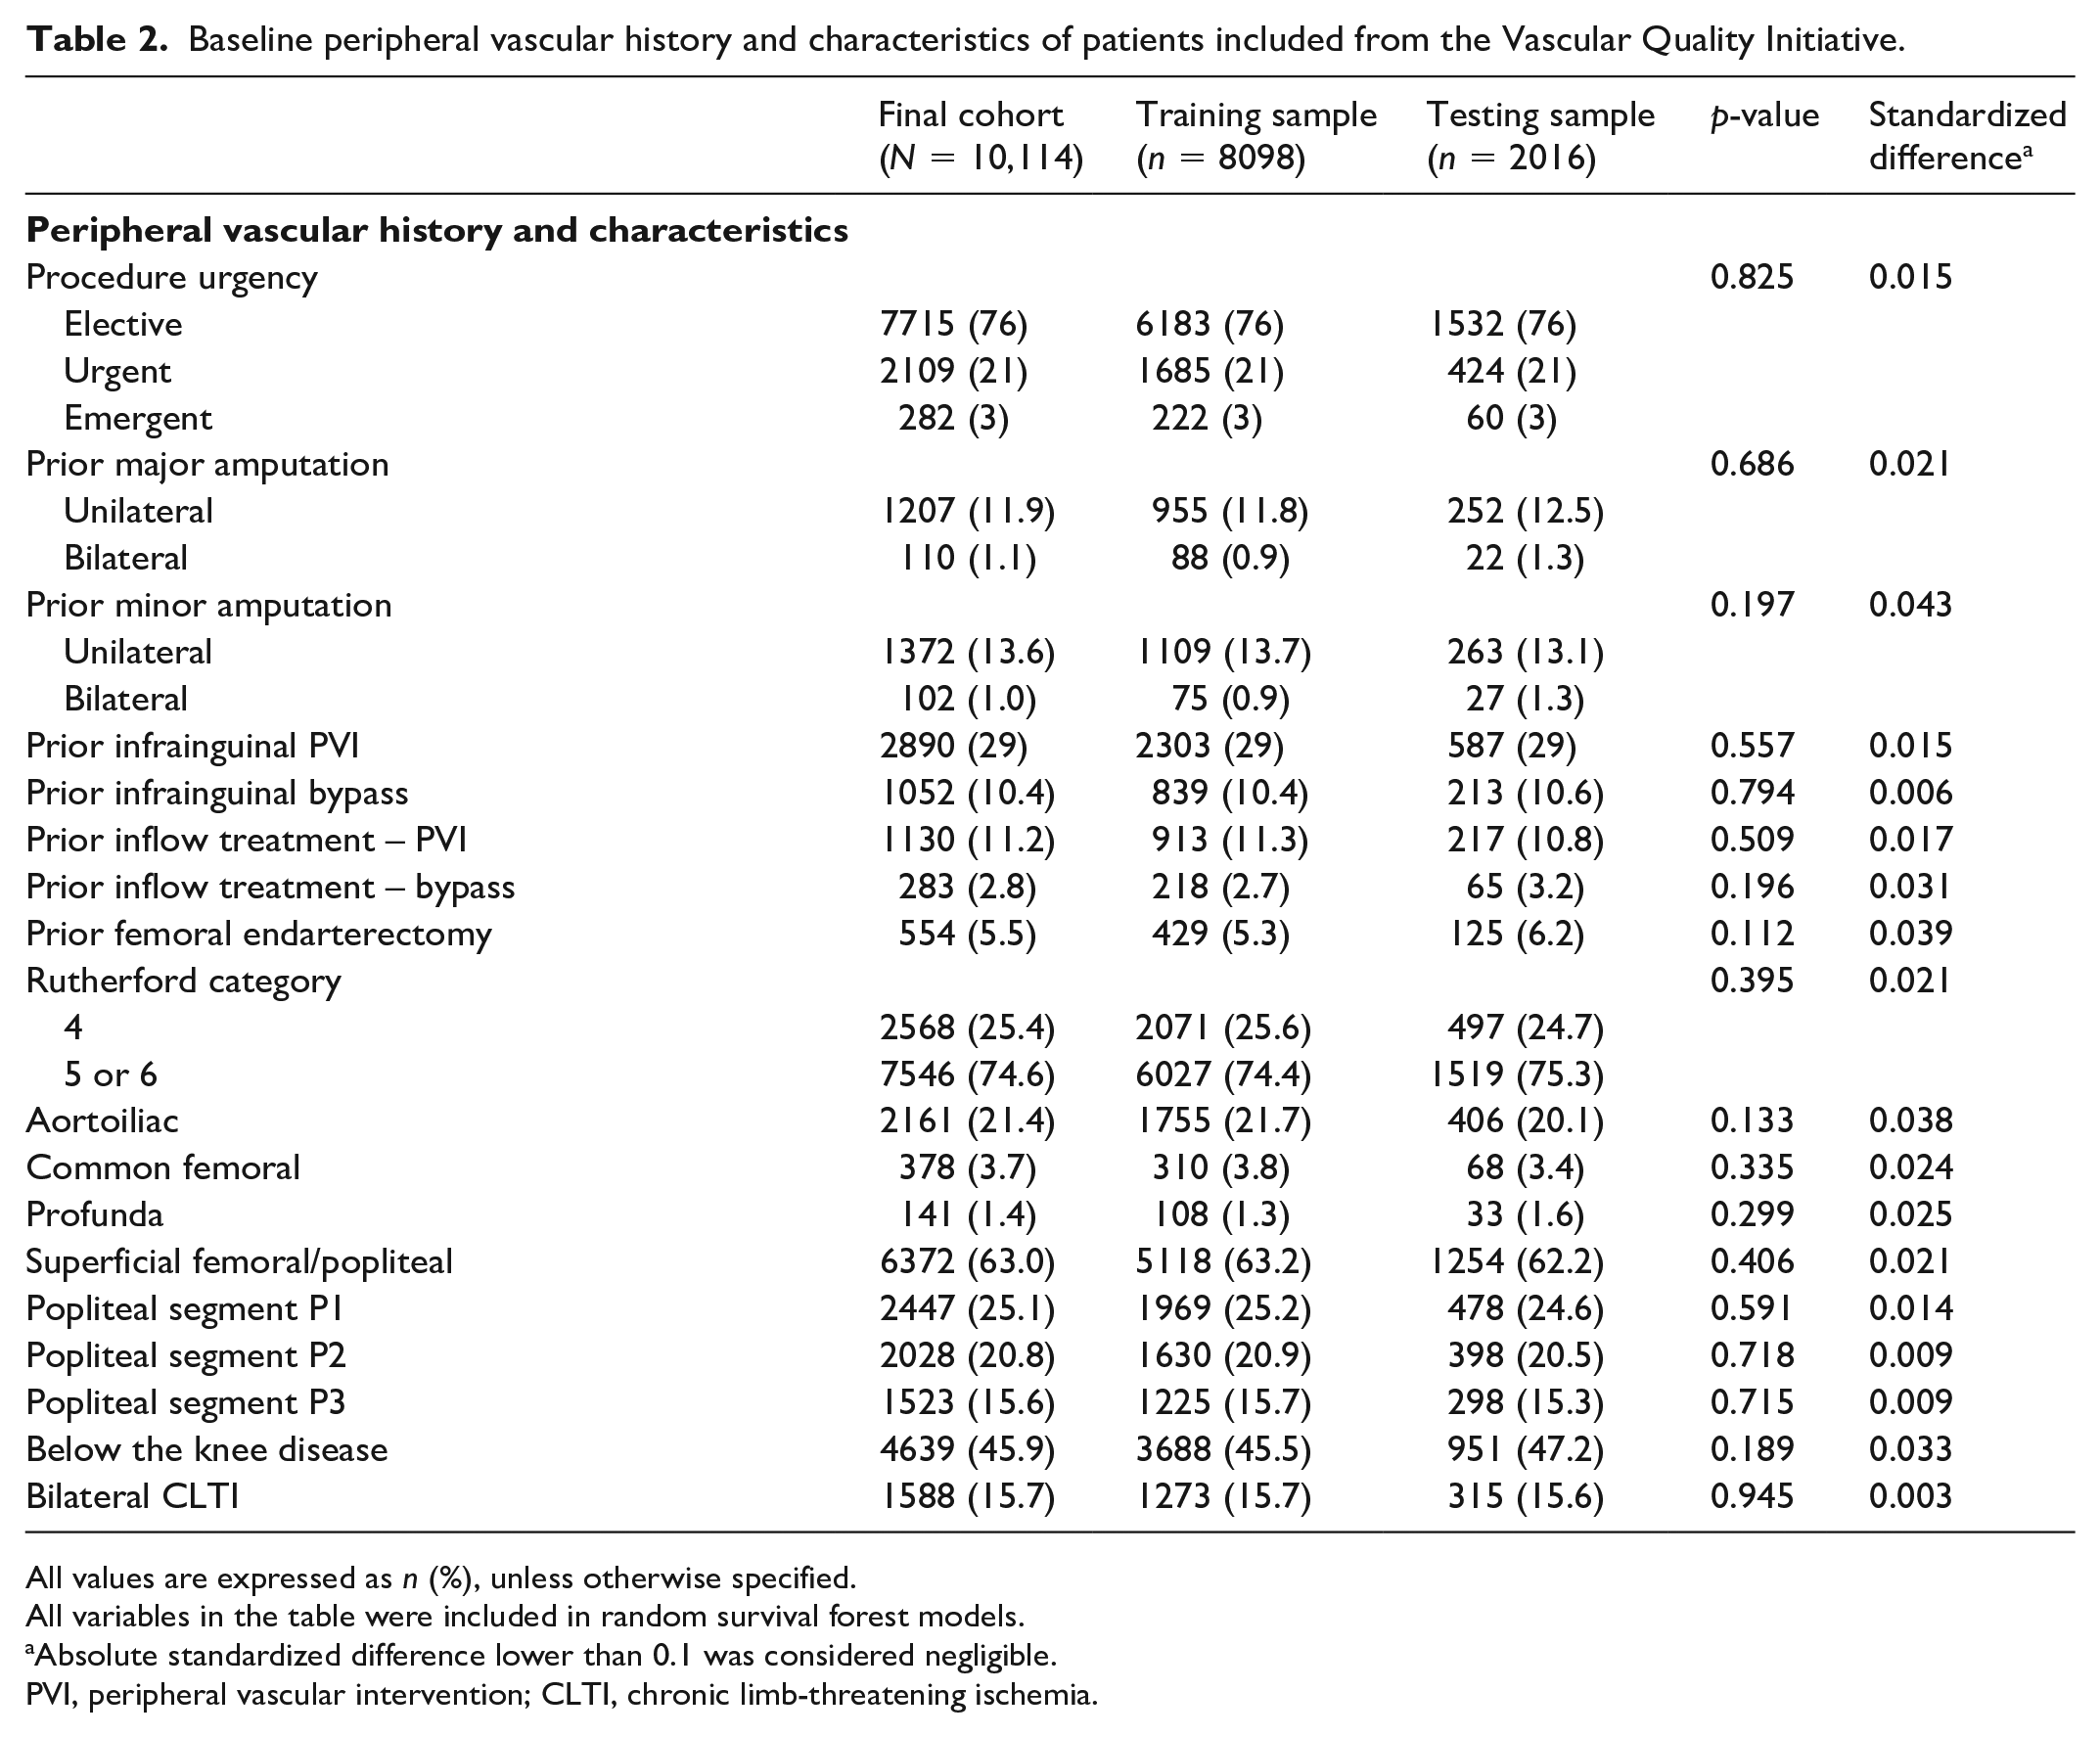
All values are expressed as n (%), unless otherwise specified.
All variables in the table were included in random survival forest models.
Absolute standardized difference lower than 0.1 was considered negligible.
PVI, peripheral vascular intervention; CLTI, chronic limb-threatening ischemia.
Missing covariate information before multiple imputation ranged from 0% to 6.5% (CKD). Ankle–brachial and toe–brachial indexes had high rates of missing data and were not included in the RSF models. The median follow up was 1.4 years (IQR 0.7–2.0). At 30 days, 43 patients (0.4%) were lost to follow up, and at 90 days, 119 patients (1.2%) were lost to follow up.
Thirty-day all-cause mortality
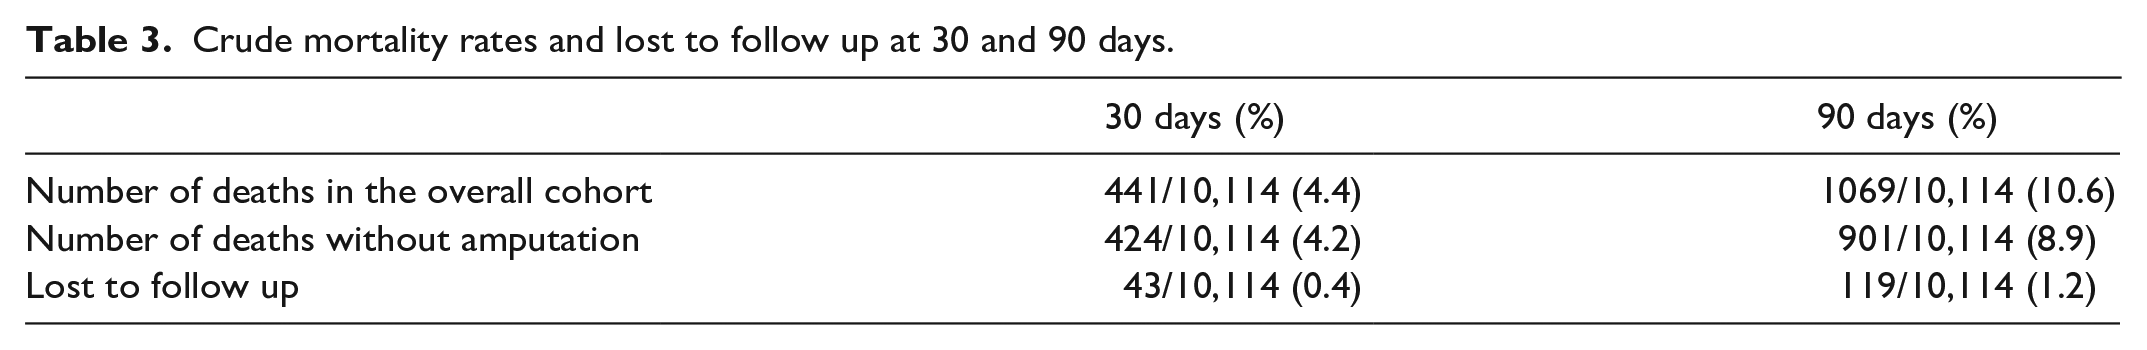
At 30 days, 441 patients (4.4%) died, 424 patients (4.2%) died without an amputation, and 43 (0.4%) were lost to follow up (Table 3). Variables with the highest importance (top five variables, ⩾ 25% relative variable importance) were stage 5 CKD, dementia, urgent procedures, need for assisted care at home (limited self-care, bedbound > 50% of the time), and poor ambulatory status (needing to use a cane or walker). Figure 2 shows the relative importance plots for all candidate variables. The variable importance plot by minimal depth is included as online Supplemental Figure 1. Variables with the highest relative importance for 30-day all-cause mortality included cardiovascular risk factors, poor functional status, and more advanced peripheral vascular disease. Of the top 20 variables, 10 were medical comorbidities and medical history variables, five were related to functional status, four were peripheral vascular characteristics and history, and one was a demographic variable. The performance of the RSF was good to excellent. In the testing sample, the Brier score at 30 days was 0.03, the CRPS was 0.02, the error rate was 28%, and Harrell’s C-index was 0.72.
Crude mortality rates and lost to follow up at 30 and 90 days.
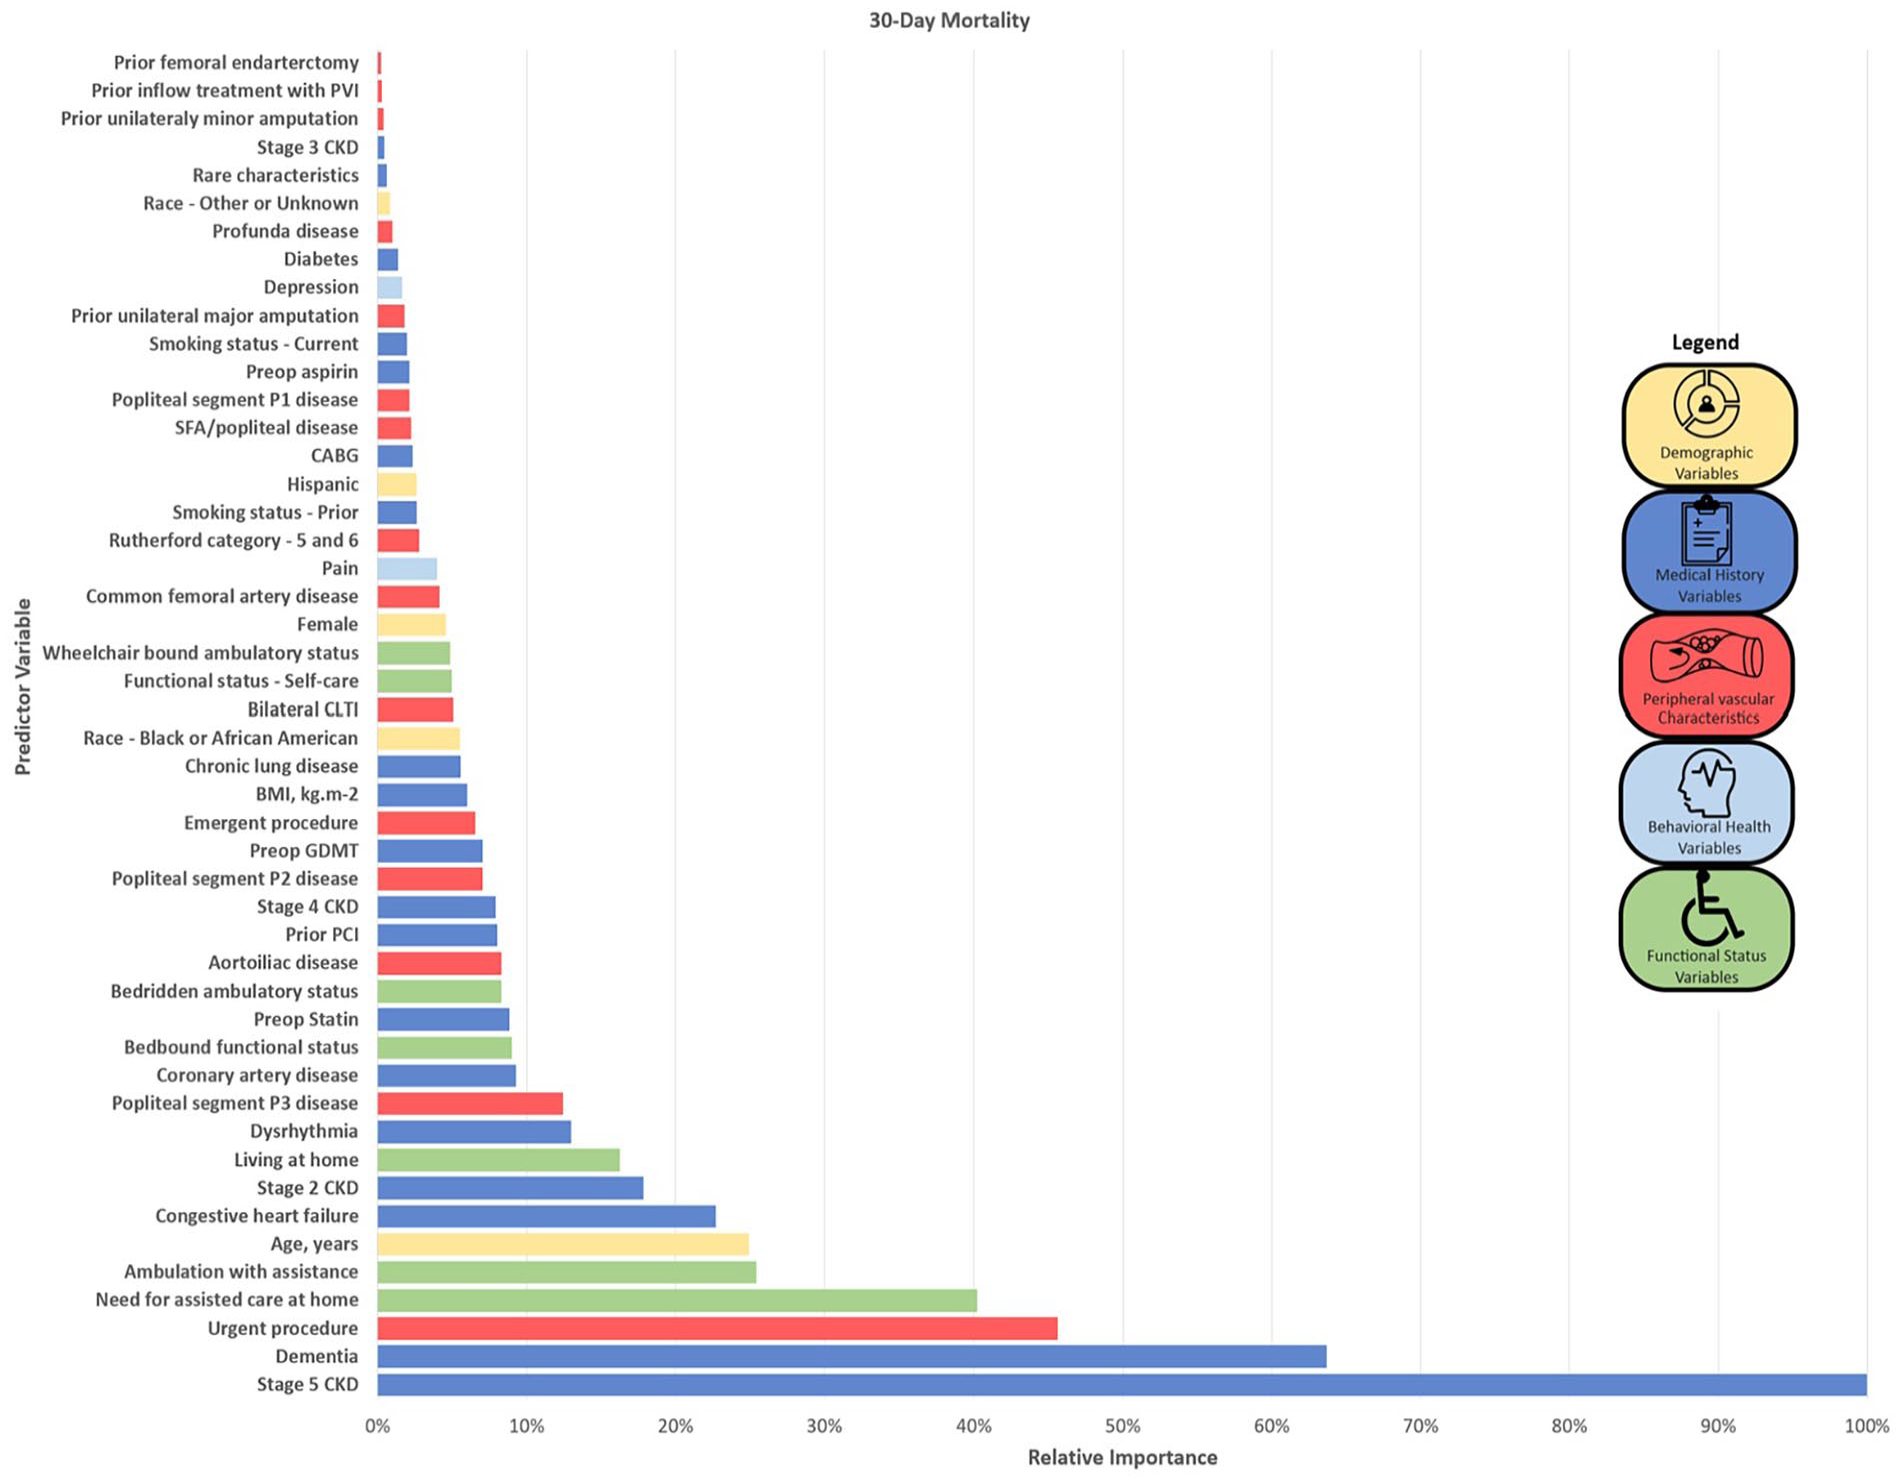
Random forest survival model variable importance plots for 30-day all-cause mortality.
Predictors of 90-day all-cause mortality
At 90 days, 1069 patients (10.6%) died, 901 patients (8.9%) died without an amputation, and 119 (1.2%) were lost to follow up (Table 3). Variables with the highest importance (top five variables, ⩾ 32% relative importance) in the RSF were stage 5 CKD, dementia, need for assisted care at home (limited self-care, bedbound > 50% of the time), CHF, and age. Figure 3 shows the variable relative importance plot. The variable importance plot by minimal average depth of splitting from origin of the tree is included as online Supplemental Figure 2. Variables with the highest relative importance for 90-day all-cause mortality included traditional cardiovascular risk factors, poor functional status, more advanced peripheral vascular disease, demographic variables, and behavioral health comorbidities. The top 20 predictive variables included 10 medical comorbidity and medical history variables, four variables related to functional status, three peripheral vascular characteristic variables, two demographic variables, and one behavioral health variable. The RSF had good to excellent performance in the testing sample. The Brier score at 90 days was 0.10, the CRPS was 0.05, the error rate was 27%, and the C-index was 0.73.
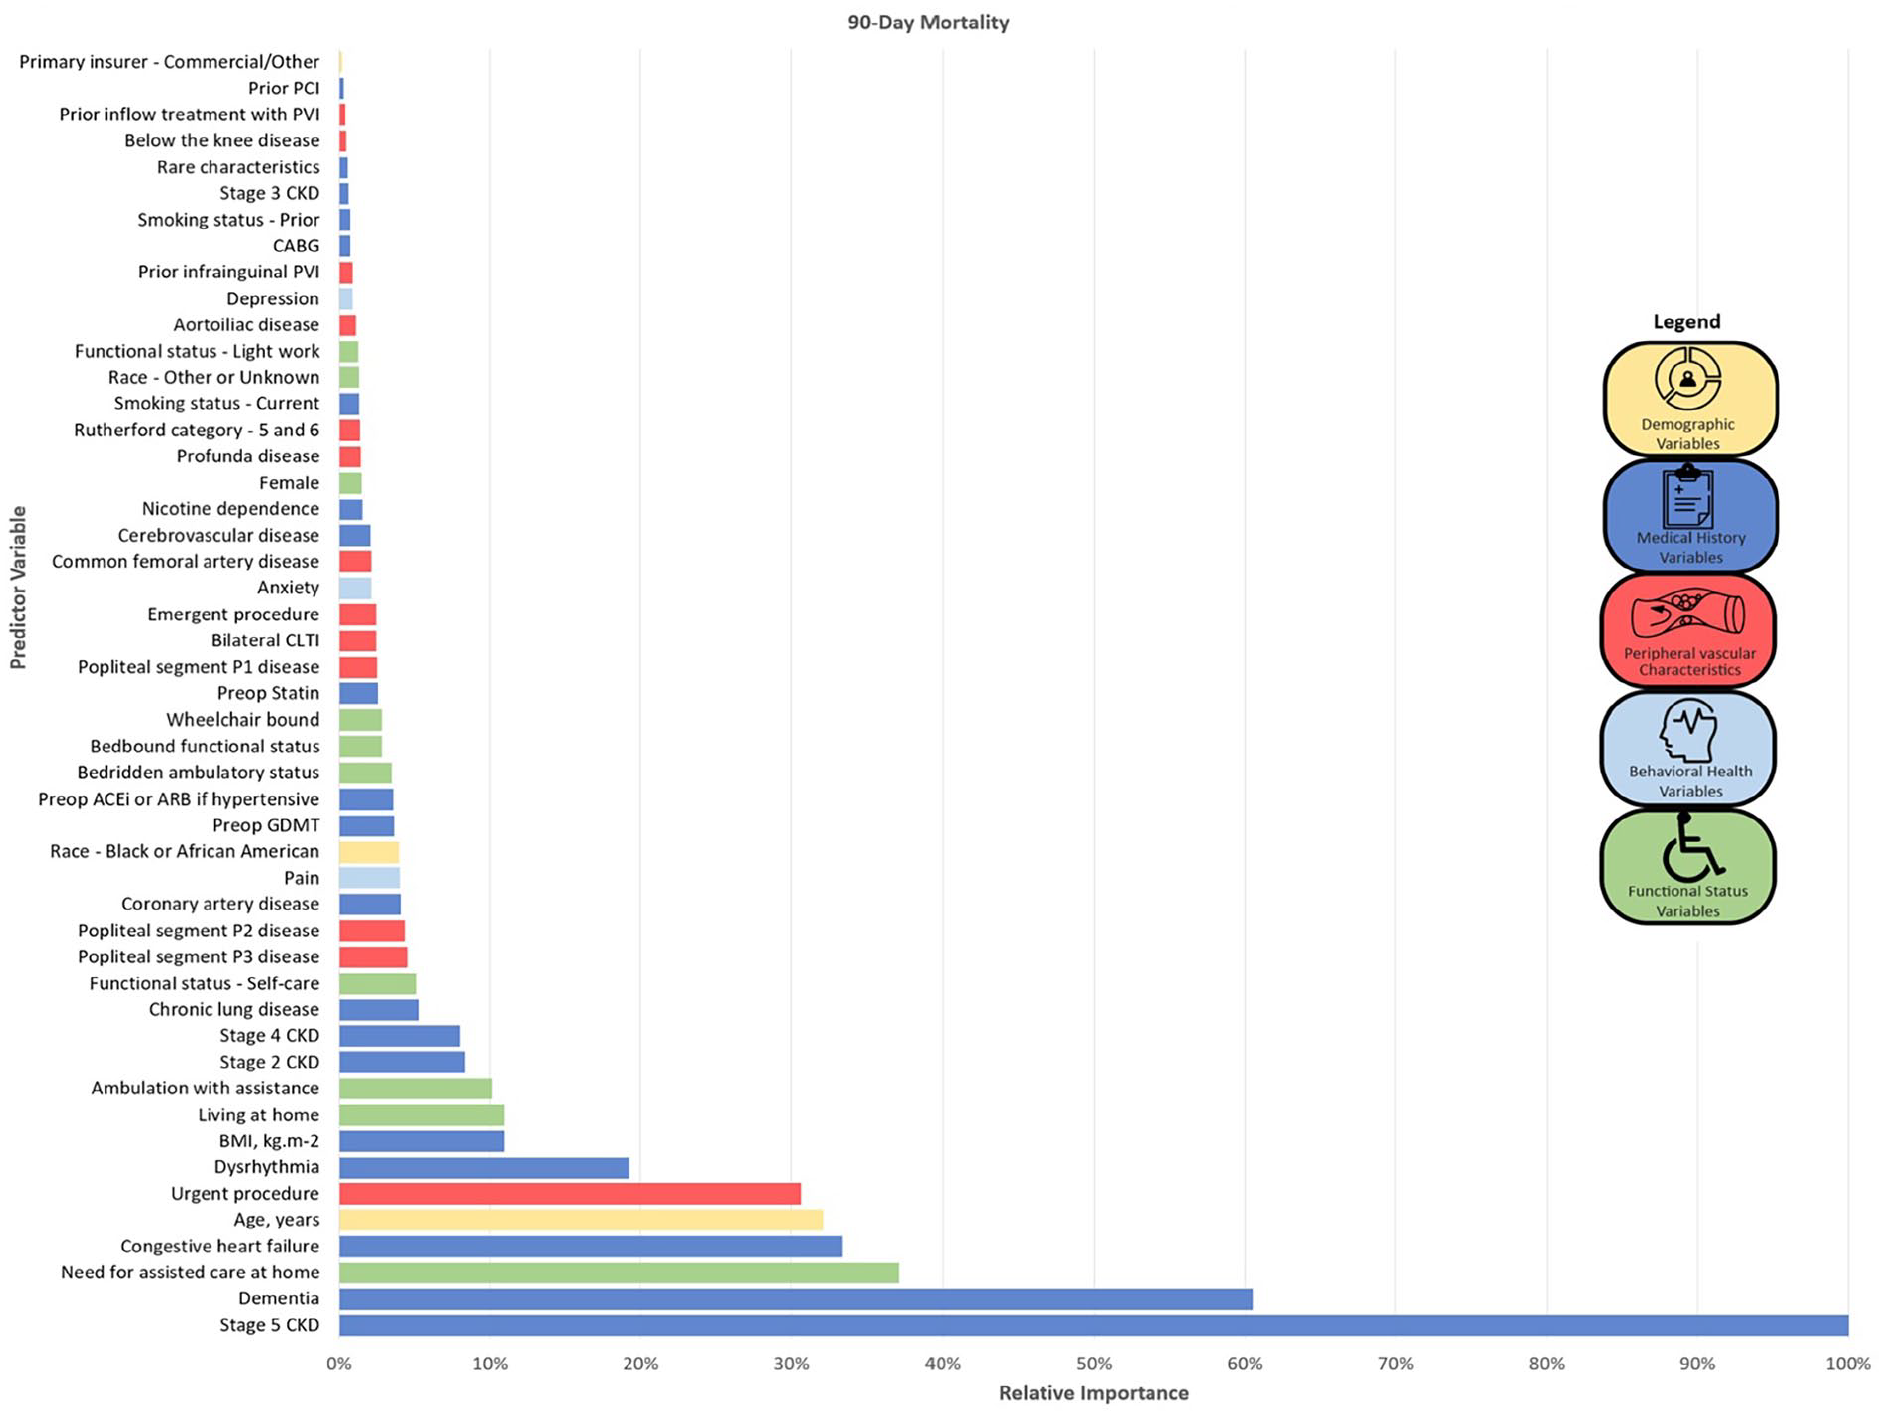
Random forest survival model variable importance plots for 90-day all-cause mortality.
Discussion
In this contemporary evaluation of preprocedural risk factors for PVI using Medicare claims-linked VQI registry data, CKD, CHF, advancing age, urgent procedures, dementia, and need for assisted care at home were among the top 10 predictor variables for both 30- and 90-day all-cause mortality RSF models in patients undergoing PVI for CLTI (Figure 4). Medical comorbidities and functional status variables were most predictive of all-cause mortality in both models, accounting for nearly three in four of the top 20 predictive variables. The burden of mortality was high and even more so at 90 days, with over 10% of patients dying within the 90-day window. Independent predictors of death were similar for the 30-day and 90-day models, although their predictive ranking was different. Accuracy and model fit was excellent for both models.
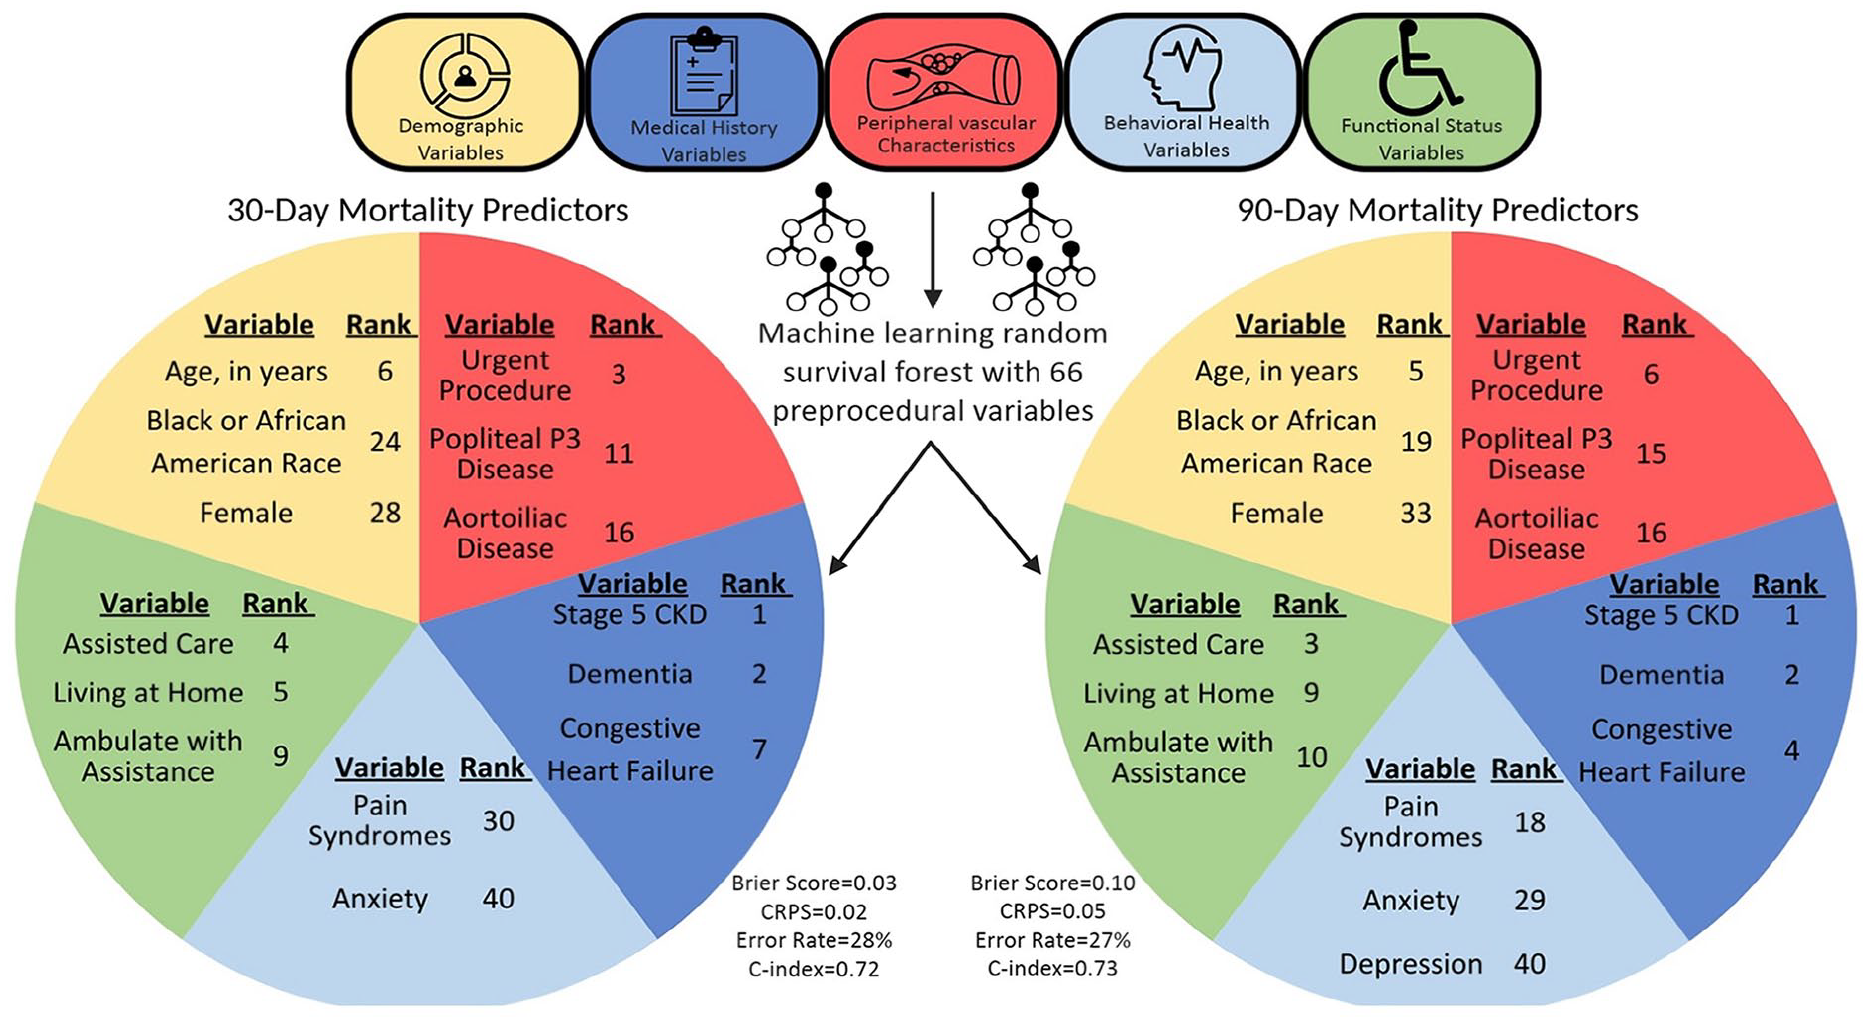
Schematic of a machine-learning risk stratification model for mortality after peripheral vascular intervention.
This study provides novel information on which preprocedural characteristics may best predict short-term all-cause mortality after PVI and provides novel data on 90-day crude mortality in a real-world cohort. We used a wide range of patient characteristics including psychosocial and behavioral health factors, allowing for a more holistic assessment of patients’ risk factors that are readily available to providers at the time of evaluation of a patient, and uniquely provided robust Medicare claims-linked outcomes data. Additionally, we used a well-known and highly used machine-learning method that has been shown to frequently outperform parametric survival models.18,19,26 Prior work has evaluated periprocedural mortality at 30 days;3,4,7,29–33 however, this study uniquely provides short-term mortality outcomes at 90 days.
Compared with crude mortality at 30 days, we observed a substantial increase in crude mortality at 90 days. This steep rise in crude mortality occurred in the absence of concurrent amputation as most patients died without having an amputation. This emphasizes that we may be underestimating periprocedural mortality in patients with CLTI undergoing PVI, and, for higher-risk patients with CLTI, may be exposing them to more harm than benefit. In patients at higher risk for periprocedural mortality, a more conservative approach, such as with medical management or palliation depending on goals of care, may be warranted, after balancing the tradeoff of limb salvage or symptom improvement with short-term mortality.
In our machine-learning models, we identified medical comorbidities and functional status as major predictive variables for 30-day and 90-day all-cause mortality. On clinical grounds, the independent prognostic utility of variables such as advanced age or advanced renal disease is expected. 7 However, it is notable that nontraditional risk factors such as pain syndromes, anxiety, and depression rank as more important predictors of mortality than many classic risk factors. Despite high rates of behavioral health comorbidities and drastically worse outcomes associated with concomitant behavioral health disease, 34 patients with peripheral artery disease (PAD) are not frequently evaluated for anxiety, depression, or pain syndromes. This represents a lost opportunity—results from this study not only advocate for routine screening for behavioral health comorbidities, but also for establishing interdisciplinary PAD-care teams including behavioral health professionals to mitigate risk.
One of the challenges that remains in providing high-quality individualized care for patients with CLTI is access to high-fidelity risk stratification models that capture the typical medical complexity seen in contemporary patients with CLTI. Existing models for assessing the risk of mortality with LEB or PVI for CLTI using traditional regression modeling have shown excellent performance in the VQI, 7 but validation in a tertiary real-world center was limited due to higher comorbidity burdens and resultant difficulty with calibration at higher risk leading to underestimation of mortality. 35 Leveraging flexible machine-learning models, such as RSF algorithms, that can incorporate a multitude of potential risk factors in disease states with high comorbidity burdens such as CLTI may allow for more accurate individualized risk categorization in real-world practice. However, most care delivery systems are not equipped to implement real-time risk stratification and would require additional clinician education on the use of risk models and incorporation of models into the electronic health record for real-time use.
Study limitations
This study has the following limitations. First, variables that may be accepted as predictors of survival, such as ejection fraction or degree of tissue loss, 8 are not captured by the VQI and not included in our models. Second, we cannot account for variables that change over time, such as renal function. However, we note that many of the risk factors identified in the models for 30-day and 90-day all-cause mortality would be unlikely to change substantially over short time intervals. Third, RSF models rank predictor variables based on importance, but we are not able to quantify the degree of risk using these models. Further work is necessary to accurately quantify the risk associated with identified predictor variables. Fourth, cause-specific mortality data are not available in the claims-linked VQI registry, and interpretation of the reason for the rise in crude mortality rate at 90 days compared with 30 days is limited. Lastly, results from the models were internally validated in the validation dataset, and these results will need to be validated in an independent dataset.
Conclusion
Using data from the claims-linked VQI registry, traditional risk factors such as stage 5 CKD and dementia as well as nontraditional risk factors such as pain syndromes and depression were identified as predictive variables for 30-day and 90-day all-cause mortality using machine-learning models. Results may help guide individualized risk–benefit treatment conversations regarding PVI versus conservative therapy.
Supplemental Material
sj-pdf-1-vmj-10.1177_1358863X231224335 – Supplemental material for Evaluation of short-term mortality in patients with Medicare undergoing endovascular interventions for chronic limb-threatening ischemia
Supplemental material, sj-pdf-1-vmj-10.1177_1358863X231224335 for Evaluation of short-term mortality in patients with Medicare undergoing endovascular interventions for chronic limb-threatening ischemia by Jacob Cleman, Gaëlle Romain, Santiago Callegari, Lindsey Scierka, Francky Jacque, Kim G Smolderen and Carlos Mena-Hurtado in Vascular Medicine
Footnotes
Declaration of conflicting interests
The authors declared the following potential conflicts of interest with respect to the research, authorship, and/or publication of this article: Dr Mena-Hurtado reports unrestricted research grants from Philips and Shockwave, and is a consultant for Abbott Vascular, Cook, Medtronic, and Optum Labs; Dr Smolderen reports unrestricted research grants from Philips, Merck, Shockwave, and Johnson & Johnson; she is a consultant for Optum Labs, Cook, Tegus, Twill Inc., and Abbott Vascular. The other authors report no competing interests.
Funding
Research reported in this publication was supported by the National Heart, Lung, and Blood Institute of the National Institutes of Health under Award Number T32HL155000. The content is solely the responsibility of the authors and does not necessarily represent the official views of the National Institutes of Health.
Data availability statement
The data that support the findings of this study are proprietary and available from the Vascular Quality Initiative. Restrictions apply to the availability of these data. Data used for this study are available from the corresponding author with the permission of the Vascular Quality Initiative.
Supplementary material
The supplementary material is available online with the article.
References
Supplementary Material
Please find the following supplemental material available below.
For Open Access articles published under a Creative Commons License, all supplemental material carries the same license as the article it is associated with.
For non-Open Access articles published, all supplemental material carries a non-exclusive license, and permission requests for re-use of supplemental material or any part of supplemental material shall be sent directly to the copyright owner as specified in the copyright notice associated with the article.