
Abstract
Background:
False lumen changes (FLCs) are the main reference for the prognosis judgment and treatment plan selection for type IIa superior mesenteric artery dissection (SMAD).
Methods:
For this retrospective study, 55 patients with symptomatic type IIa SMAD were included. Computational fluid dynamics (CFD) analysis was used to explore the hemodynamic basis of FLCs. Correlation and multiple linear regression analyses were performed to identify clinical, morphological and hemodynamic factors associated with FLCs.
Results:
The FLCs of patients with successful conservative treatment (n = 29) are significantly higher than those with failed conservative treatment (n = 26) (58.5 ± 21.1% vs 10.9 ± 17.4%, p < 0.0001). Positive correlations were seen between FLCs and the morphological parameters false lumen length (FLL)/dissection entrance length (DEL) and FLL. In terms of hemodynamic parameters, negative correlations were seen between FLCs and time-averaged wall shear stress (TAWSS), vorticity, and high areas of TAWSS and vorticity, whereas positive correlations were seen between FLCs and oscillatory shear index (OSI), relative residence time (RRT), and high areas of OSI and RRT. Multiple linear regression analysis identified symptom duration (odds ratio [OR], 0.93; 95% CI, 0.91–0.96; p < 0.0001), FLL/DEL (OR, 1.30; 95% CI, 1.01–1.67; p = 0.044), and high RRT area (OR, 2.03; 95% CI, 1.48–2.78; p < 0.0001) as predictors of FLCs.
Conclusion:
The clinical predictor symptom duration, morphological factor FLL/DEL, and the hemodynamic factor high RRT area can serve as predictors of FLCs in patients with symptomatic type IIa SMAD.
Background
As imaging techniques have continued to evolve, the number of cases of superior mesenteric artery dissection (SMAD) identified on imaging has increased. 1 Compared with other types of SMAD (type I: with both entry and re-entry site in true and false lumen, the morphological structure of dissection tends to be stable; type IIb: with thrombus in false lumen, most of this type recovers smoothly; type III: with the occlusion of SMA trunk, the risk of intestinal ischemic necrosis is high, early endovascular therapy and timely open surgery is proposed), type IIa with visible false lumen but no visible re-entry site (blind pouch of false lumen) has the most uncertain clinical prognosis, and the most effective treatment options for this condition are still under debate (Figure 1).2–6 In cases of type IIa SMAD, instability related to the blood flow in the false lumen can lead to distal propagation, rupture, or the formation of a thrombus. The enlargement or delayed reduction of the false lumen will cause progressive or persistent compression of the true lumen, and even rupture of the dissection aneurysm, leading to continuous aggravating or unrelieved symptoms in patients, ultimately resulting in the failure of conservative treatment. In addition, patients with persistent false lumens are unable to complete the remodeling of SMA for a long time, and the probability of long-term recurrence is also higher. On the contrary, patients with false lumens which shrink or thrombosis in the short-term can achieve faster SMA remodeling and always have better prognosis. Therefore, false lumen changes (FLCs) are one of the main reference standards for treatment plan selection and prognosis judgment.7–10 However, the prediction of FLCs has not been proposed.
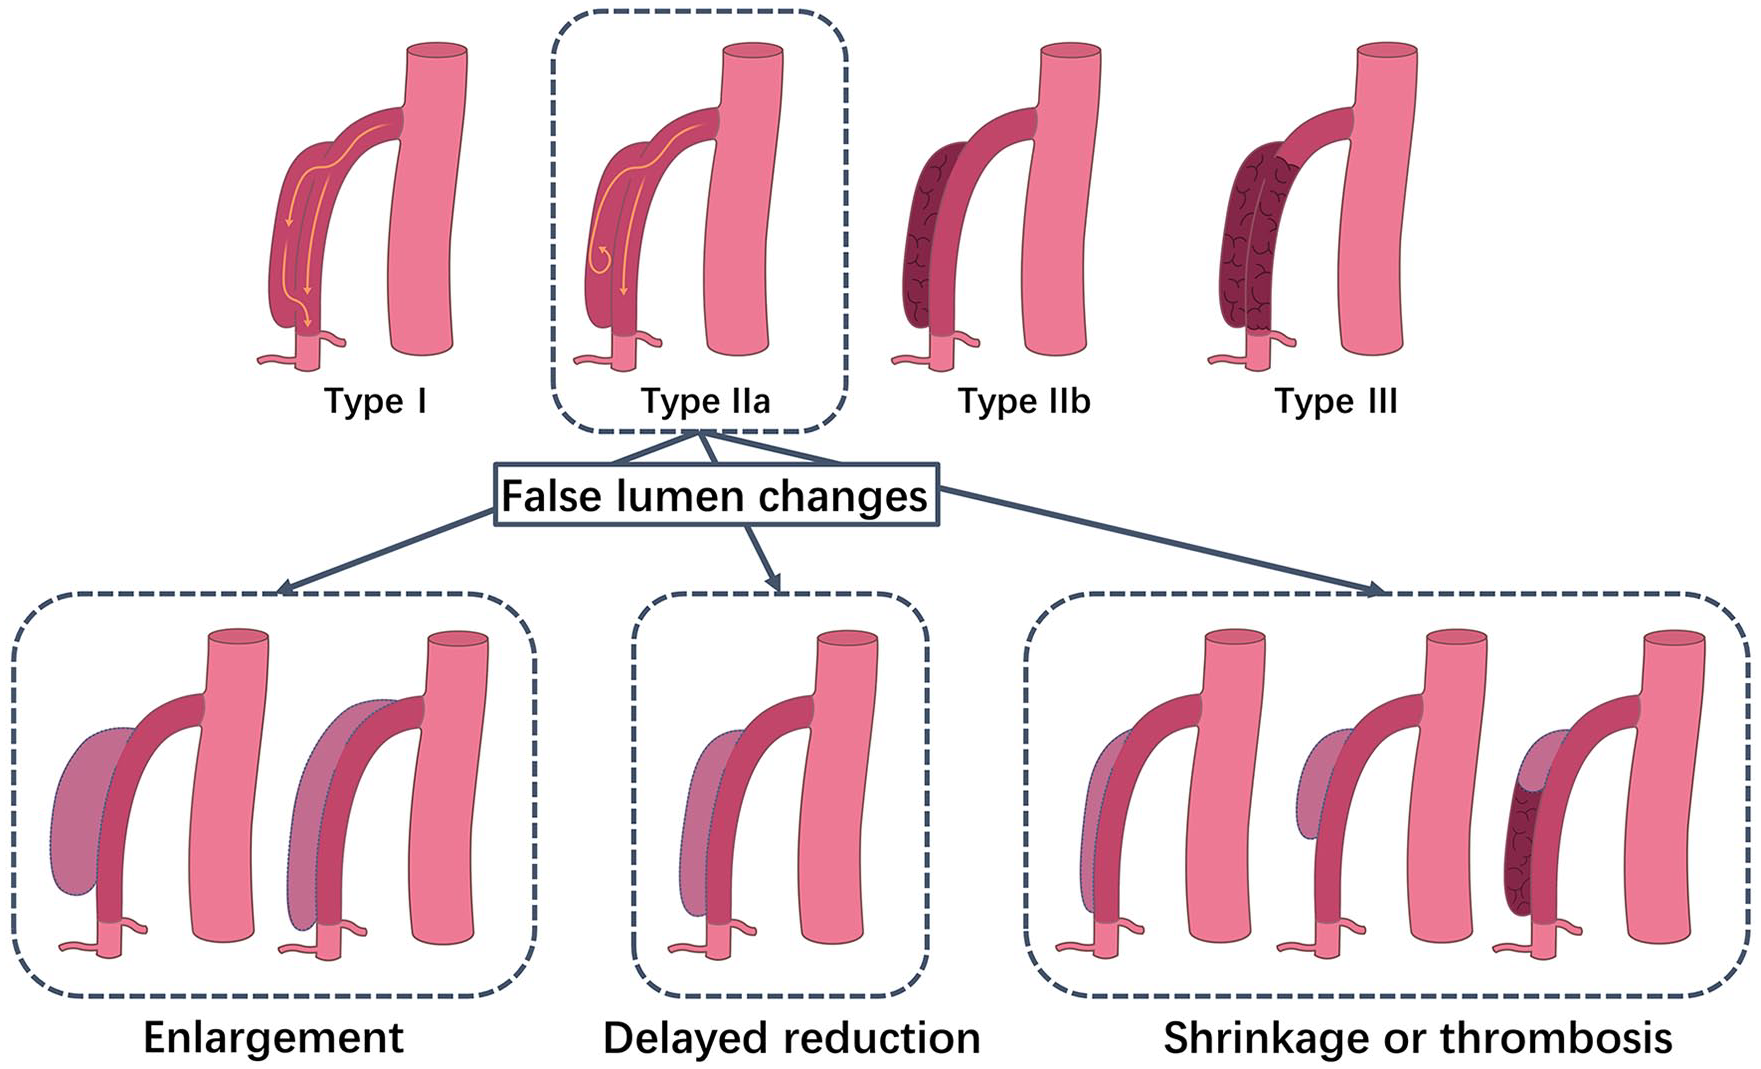
The classification of superior mesenteric artery dissection (SMAD) and the manifestation of false lumen changes in the type IIa SMAD.
In this retrospective study, morphological and hemodynamic factors in patients with type IIa SMAD were assessed using a computational fluid dynamics (CFD) simulation based on patient-specific superior mesenteric artery (SMA) geometries and individual blood flow conditions. Correlations between these factors and FLCs were identified, and potential predictors of FLCs were then determined based on these findings.
Methods
Study design
This retrospective study was approved by the participating institutional review boards with a waiver of informed consent. Yun’s classification of SMAD was applied in this study. Consecutive patients with symptomatic type Ⅱa SMAD diagnosed on computed tomography angiography (CTA) who underwent conservative therapy as first-line treatment between January 2010 and December 2022 were included in this study. Patients with other types of SMAD, those who underwent endovascular intervention or open surgery as first-line treatment, those who received anticoagulants or antiplatelet therapy during conservative treatment, those who were lost to follow up, and those with blurred CTA images were excluded from the analysis. Demographic and clinical information of enrolled patients was collected from the medical records system.
Management and follow-up
The course of therapy used in this study has been described previously. 6 The conservative management included fasting, observation, blood pressure control, and pain control. Owing to the fact that anticoagulants or antiplatelet therapy cannot prevent distal propagation and are likely to delay false lumen thrombosis, more and more evidence has appeared to support not using them as routine treatment methods during conservative treatment.11–16 The failure of conservative treatment was defined as the persistence or aggravation of symptoms and signs, continuous expansion of the false lumen, or a newly appeared dissecting aneurysm during treatment. CTA (Core 128; Philips, Rotterdam, The Netherlands) and Do-ppler sonography (Philips Ultrasound, Inc., Rotterdam, The Netherlands) were performed within 1 week after the diagnosis of SMAD, and the status of SMAD was assessed and related data were recorded. For follow up, CTA was performed at 1 month, 6 months, and 1 year after discharge.
Morphological measurements
Two radiologists and two interventional angiologists with more than 10 years of clinical experience independently determined the morphological measurements for each case. In cases of disagreement, differences were discussed until an agreement was reached.
The morphological parameters included in this study were as follows: (1) dissection entrance length (DEL), defined as the optimal diameter length of the cross-section of the false lumen entrance channel which was calculated by Mimics Research 19.0 (Materialise HQ, Louvain, Bel-gium) based on the automatically extracted centerline of the SMAD 3D model; (2) false lumen length (FLL) and diameter, defined as the long-axis diameter and the short-axis diameter of the false lumen based on the maximum cross-section of the false lumen in sagittal reconstruction of the CTA image, respectively5,17; (3) aortomesenteric angle, defined as the angle between the abdominal aorta major axis and the SMA major axis based on the sagittal reconstruction of the CTA image 18 ; (4) maximum curvature of the SMA, defined as the maximum curvature of the SMA central axis, which was automatically identified and calculated by using SOLIDWORKS 2017 (Dassault Systèmes, Paris, France) 19 ; (5) distance from the SMA ostium to the dissection origin; (6) true lumen stenosis rate, defined as the cross-sectional area at the greatest stenosis site on the true lumen divided by the proximal normal artery (the greatest stenosis location and the normal lumen diameter location at the SMA was identified by two independent interventional angiologists); and (7) the number and average diameter of side branches in the involved segment of the SMAD, quantified and measured based on a SMA 3D model extracted by Mimics Research 19.0 (Materialise, Leuven, Belgium) (Figure S1).
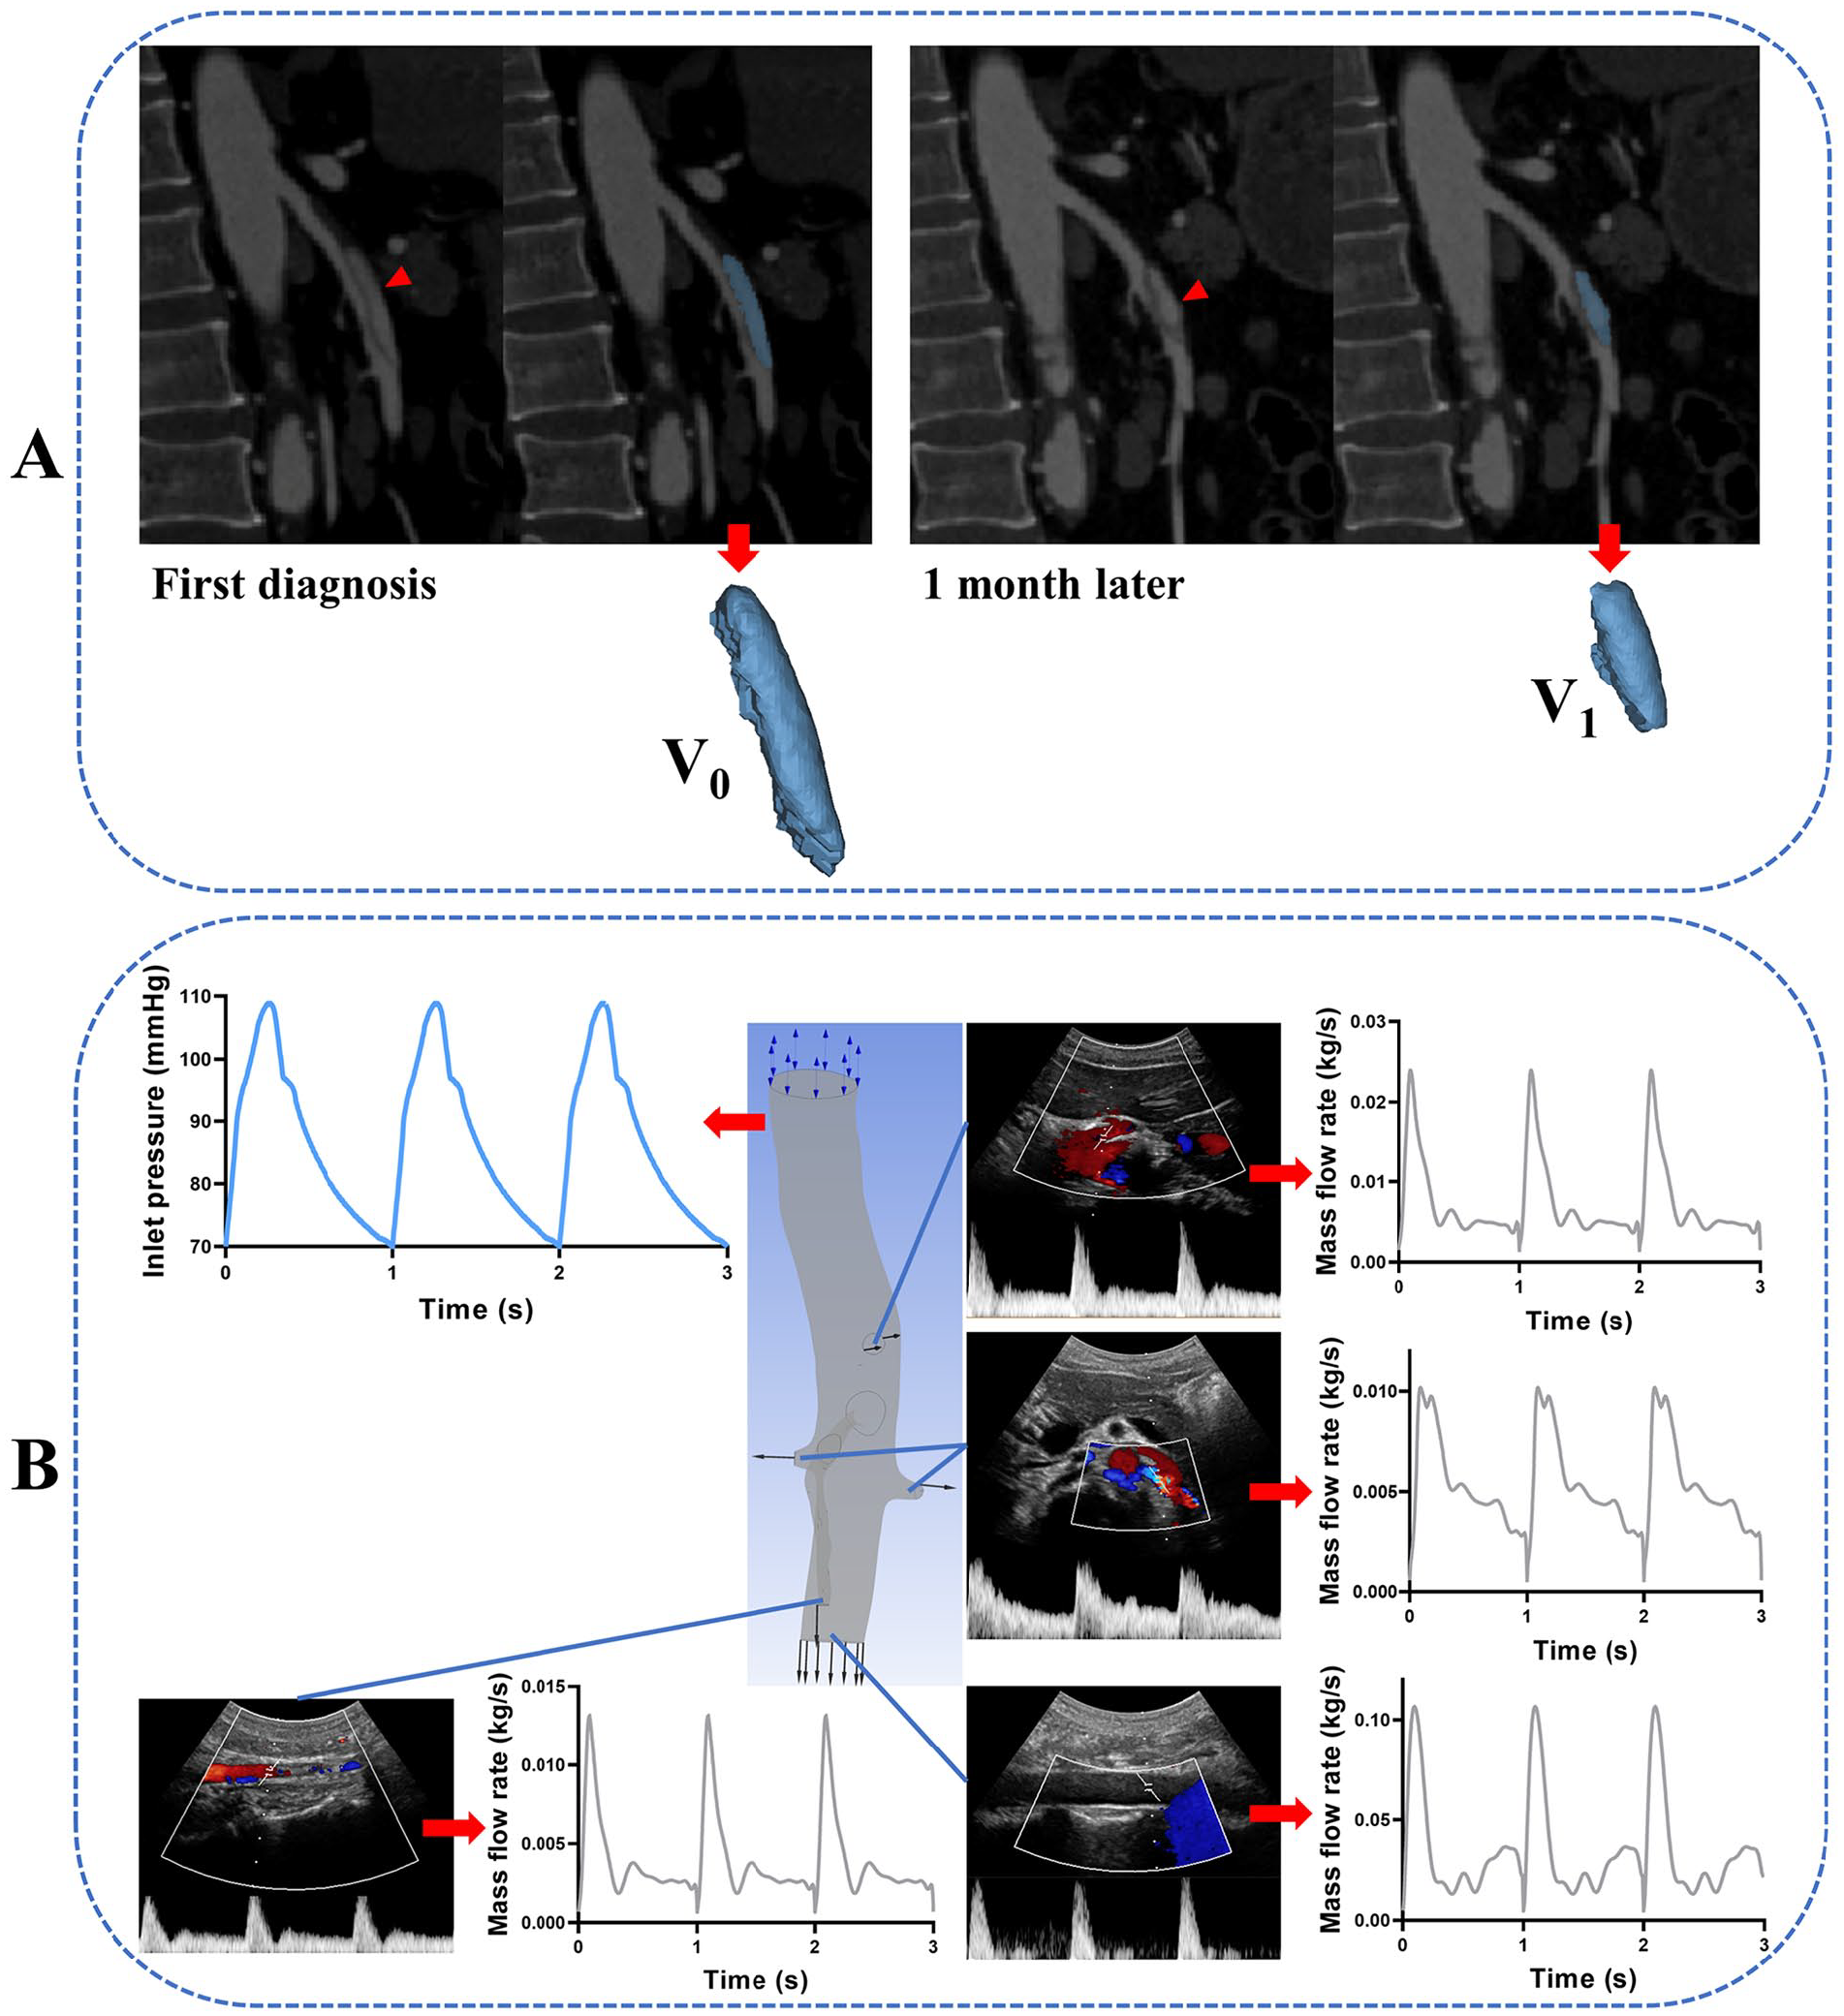
The 3D models of the false lumens were extracted and segmented based on thin-slice CTA images (slice thickness: 1.0 mm) using Mimics Research 19.0. The false lumen models were then imported into Geomagic Wrap 2017 (Raindrop Geomagic, Research Triangle Park, NC, USA) in STL format, and the volume was automatically calculated (Figure 2A).20–22 FLCs at 1 month were defined as (V0 – V1)/V0, where V0 is the false lumen volume at the time of SMAD diagnosis and V1 is the false lumen volume at 1-month follow up (or at last follow up in cases of failed treatment).
The ultrasonic Doppler blood flow spectrums for the ostium of the celiac trunk and bilateral renal artery, the distal abdominal aorta and SMA at the umbilical level, and the ostium of main branches within the range of the SMAD were collected using the Philips EPIQ 7 system (Philips Ultrasound, Inc.), as described in previous studies.23,24
Construction of SMAD geometries and computational fluid dynamics (CFD) simulation
To recreate the hemodynamic environment in the false lumen of each patient at the time of SMAD diagnosis, CFD simulations were carried out based on 55 patient-specific 3D models reconstructed from the patient’s first-time CTA data (slice thickness: 1.0 mm) by using Mimics Research 19.0 with automatic smoothing by Geomagic Wrap 2017. In addition to the trunk of the abdominal aorta and SMA (from 5 cm above the celiac trunk to the level of the umbilical cord), the ostium of the celiac trunk and bilateral renal artery, and the ostium of main branches within the range of the dissection were all preserved and reconstructed. The reconstructed geometry was then meshed in ICEM-CFD (Ansys, Canonsburg, PA, USA), and the prism layers were created. Sensitivity grid analysis was conducted for each case. When standard volume mesh (abdominal aorta mesh size: 0.5 mm; SMAD mesh size: 0.3 mm; 2.4–7.2 million tetrahedral elements) and refined volume mesh (abdominal aorta mesh size: 0.3 mm; SMAD mesh size: 0.1 mm; 11.2–17.8 million tetrahedral elements) were compared, the average difference in the time-averaged wall shear stress (TAWSS) distribution was found to be < 1%. 25
A transient simulation for each patient was performed using the CFD solver in CFX (Ansys) to solve the Navier–Stokes equations for incompressible steady flow. Blood was considered a homogeneous, incompressible Newtonian fluid with a dynamic viscosity of 0.0035 Pa·s and a density of 1045 kg/m3. 26 In terms of boundary conditions, the inlet condition used for simulations was the set of pressure wave points at the proximal end of the abdominal aorta corrected by the patient’s systolic and diastolic pressures and heart rate (the average values measured during their hospitalization).27,28 All of the outlet conditions were based on the set of mass flow points extracted and converted from ultrasonic Doppler blood flow spectrums (first measured after the diagnosis of SMAD) and the cross-sectional area of each outlet in the patient-specific geometry models (Figure 2B). A rigid wall and no-slip boundary condition were set. The hemodynamic parameters assessed were as follows: TAWSS, oscillatory shear index (OSI), relative residence time (RRT), and vorticity (all defined as the average values of the false lumen wall), as well as high TAWSS area, high OSI area, high RRT area, and high vorticity (defined as the proportion of the false lumen wall in which these parameters were higher than average). The CFD simulation results were then imported and postprocessed using CFD-POST (Ansys) to determine the flow pattern, assess the hemodynamic parameter distribution, and extract data for quantitative analysis. Two radiologists and a bioengineer performed the geometries reconstruction and CFD simulations together.
Idealized univariate model reconstruction
To analyze the influence of each particular morphological feature on hemodynamics in the false lumen while eliminating the influence of other morphological parameters, specific SMAD models were manually deformed and modified using Geomagic Wrap 2017. The FLL/DEL values of the idealized geometric models were defined as the upper quartiles and lower quartiles of that for all included patients. For the boundary conditions of the idealized geometric models’ simulation, the median values of blood pressure and corresponding vessel mass flow for all patients were used (see the online supplemental material).
Statistical analysis
SPSS 26.0 (IBM Corp., Armonk, NY, USA) was used for statistical analysis. Normally distributed continuous variables were calculated as mean ± SD. Nonnormally distributed continuous variables were calculated as median (IQR). The chi-squared test was used for categorical variables. Correlations between clinical, morphological, and hemodynamic parameters and FLCs were assessed using Spearman (nonnormally distributed continuous variables) or Pearson (normally distributed continuous variables) correlation analysis. Multicollinearity tests of all independent variables were conducted (see the online supplemental material). Multiple linear regression analysis was used to identify the most likely predictors of FLCs, with results reported as odds ratios (ORs) and corresponding 95% CIs. Statistical significance was considered to be p < 0.05.
Results
Patients
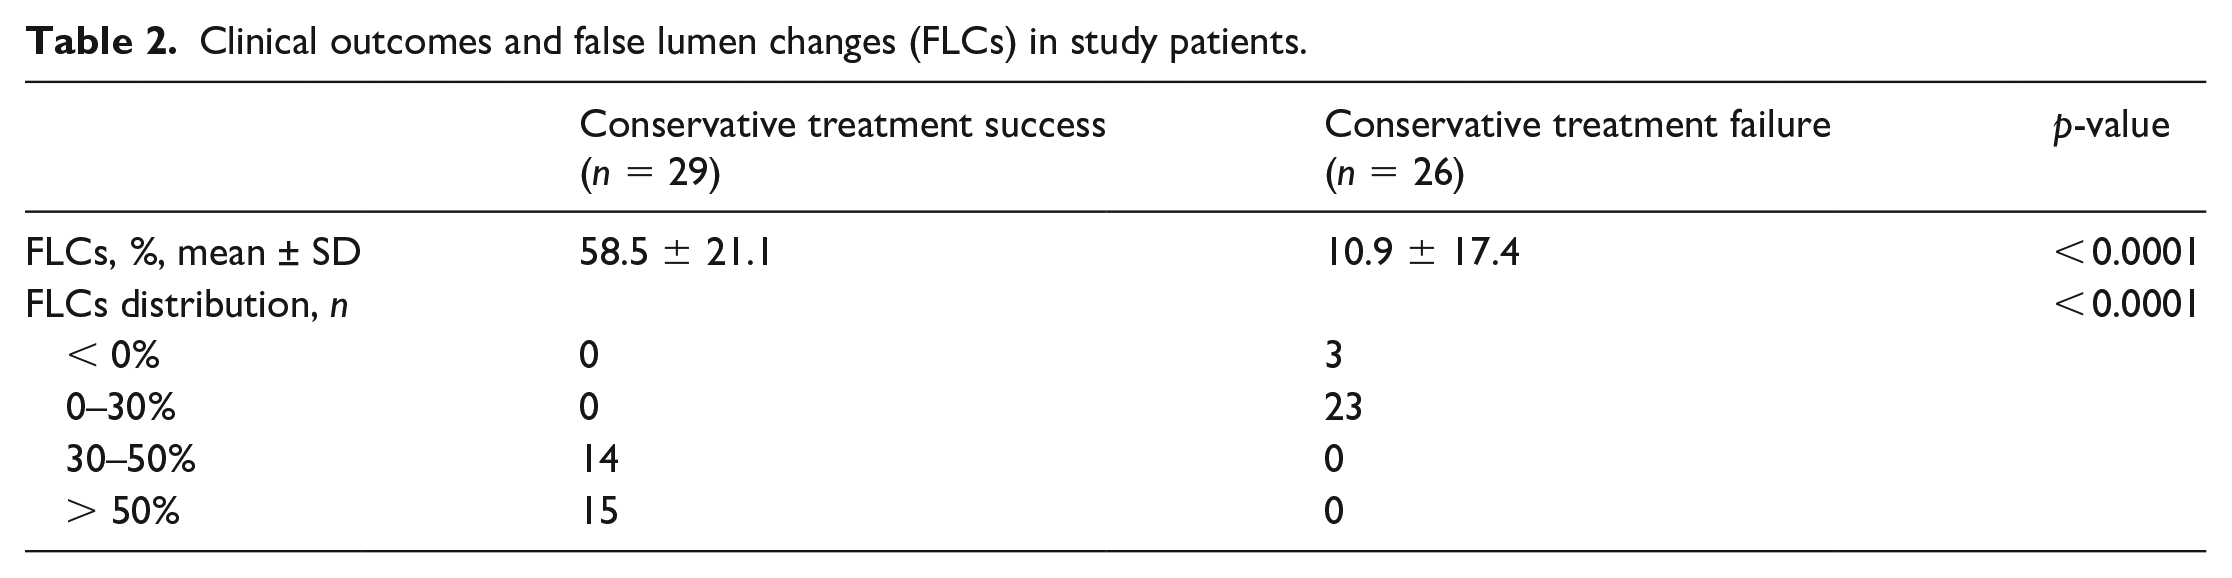
Of the 287 patients diagnosed with symptomatic SMAD during the study period, 232 (80.8%) were excluded from the study because they did not meet the inclusion criteria. Figure 3 shows the detailed inclusion process of the study population. The remaining 55 patients (51 men, four women; mean age, 54.1 ± 7.6 years; range, 41–74 years) were included in the analysis. Table 1 summarizes the clinical manifestations, imaging characteristics, and hemodynamic variables in all the study patients. Conservative treatment was succeeded in 29 (52.7%) patients and failed in 26 (47.3%) patients. The characteristics of the FLCs of all patients are shown in Table 2. The false lumen volumes of all patients during the follow-up period are shown in Figure 4.
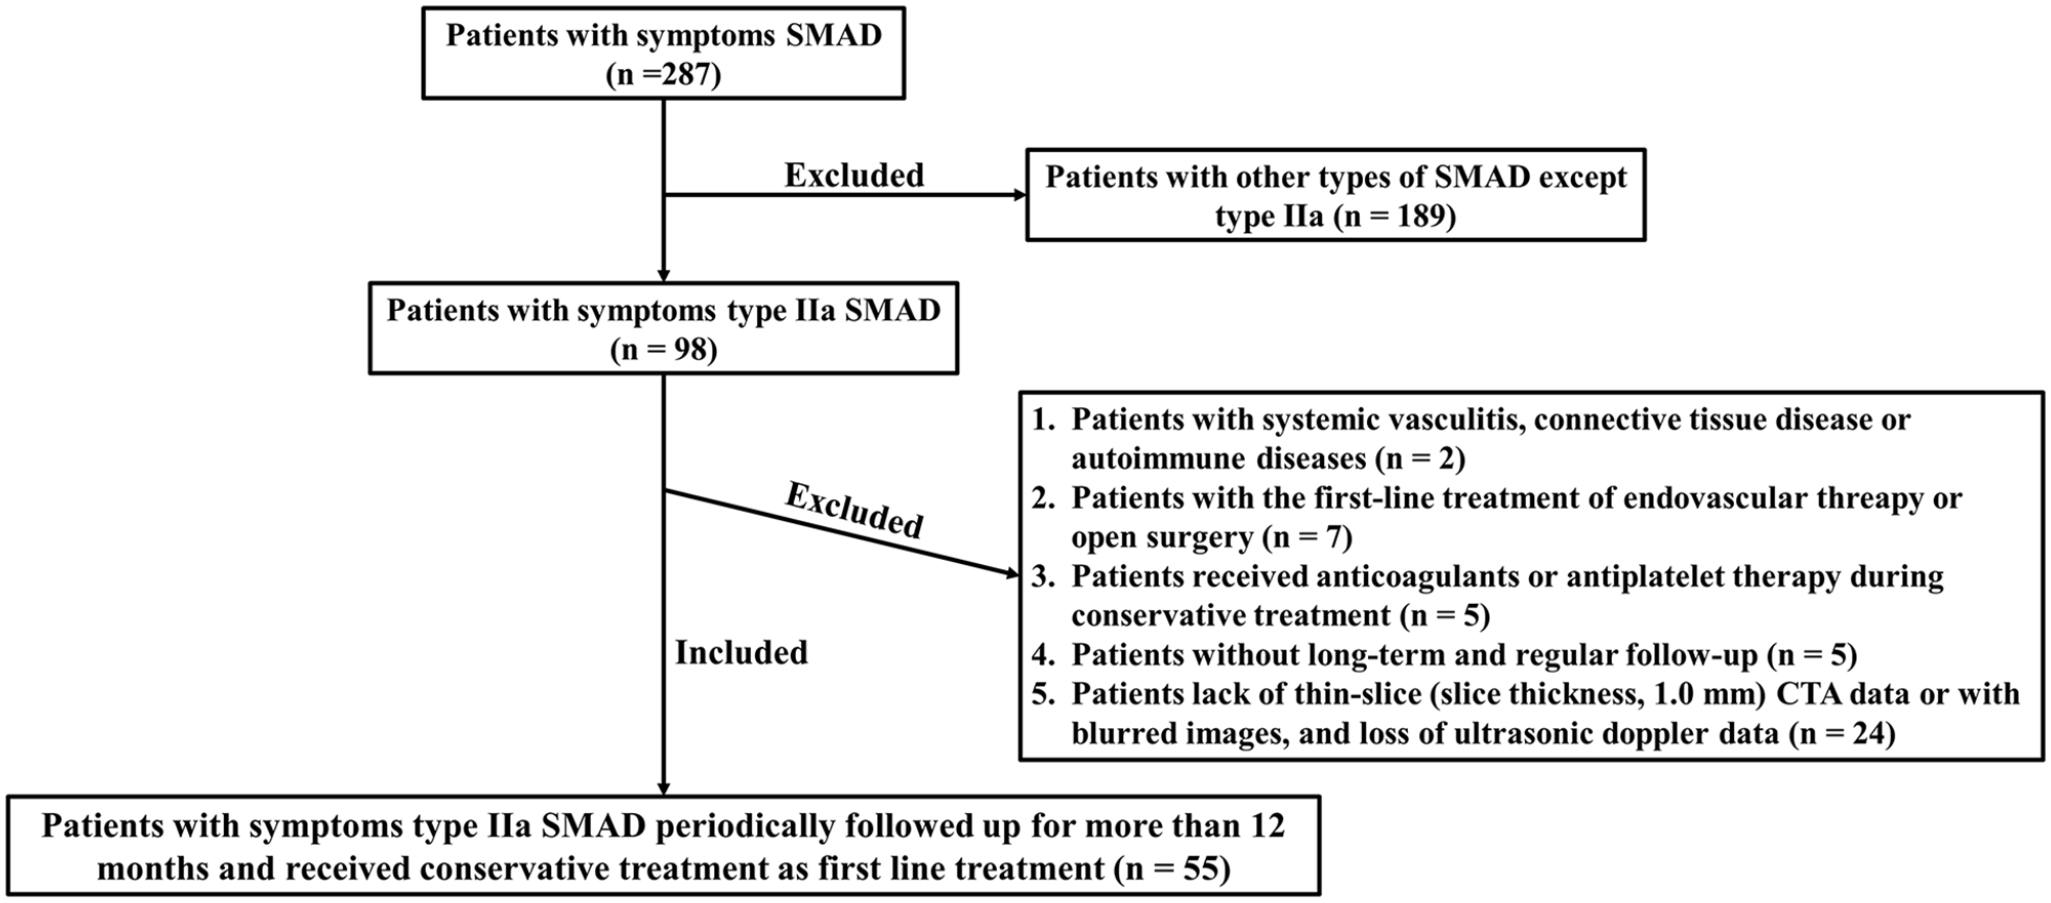
Flow chart of inclusion and exclusion in enrolled patients.
Clinical characteristics, morphological parameters, and hemodynamic variables in study patients.
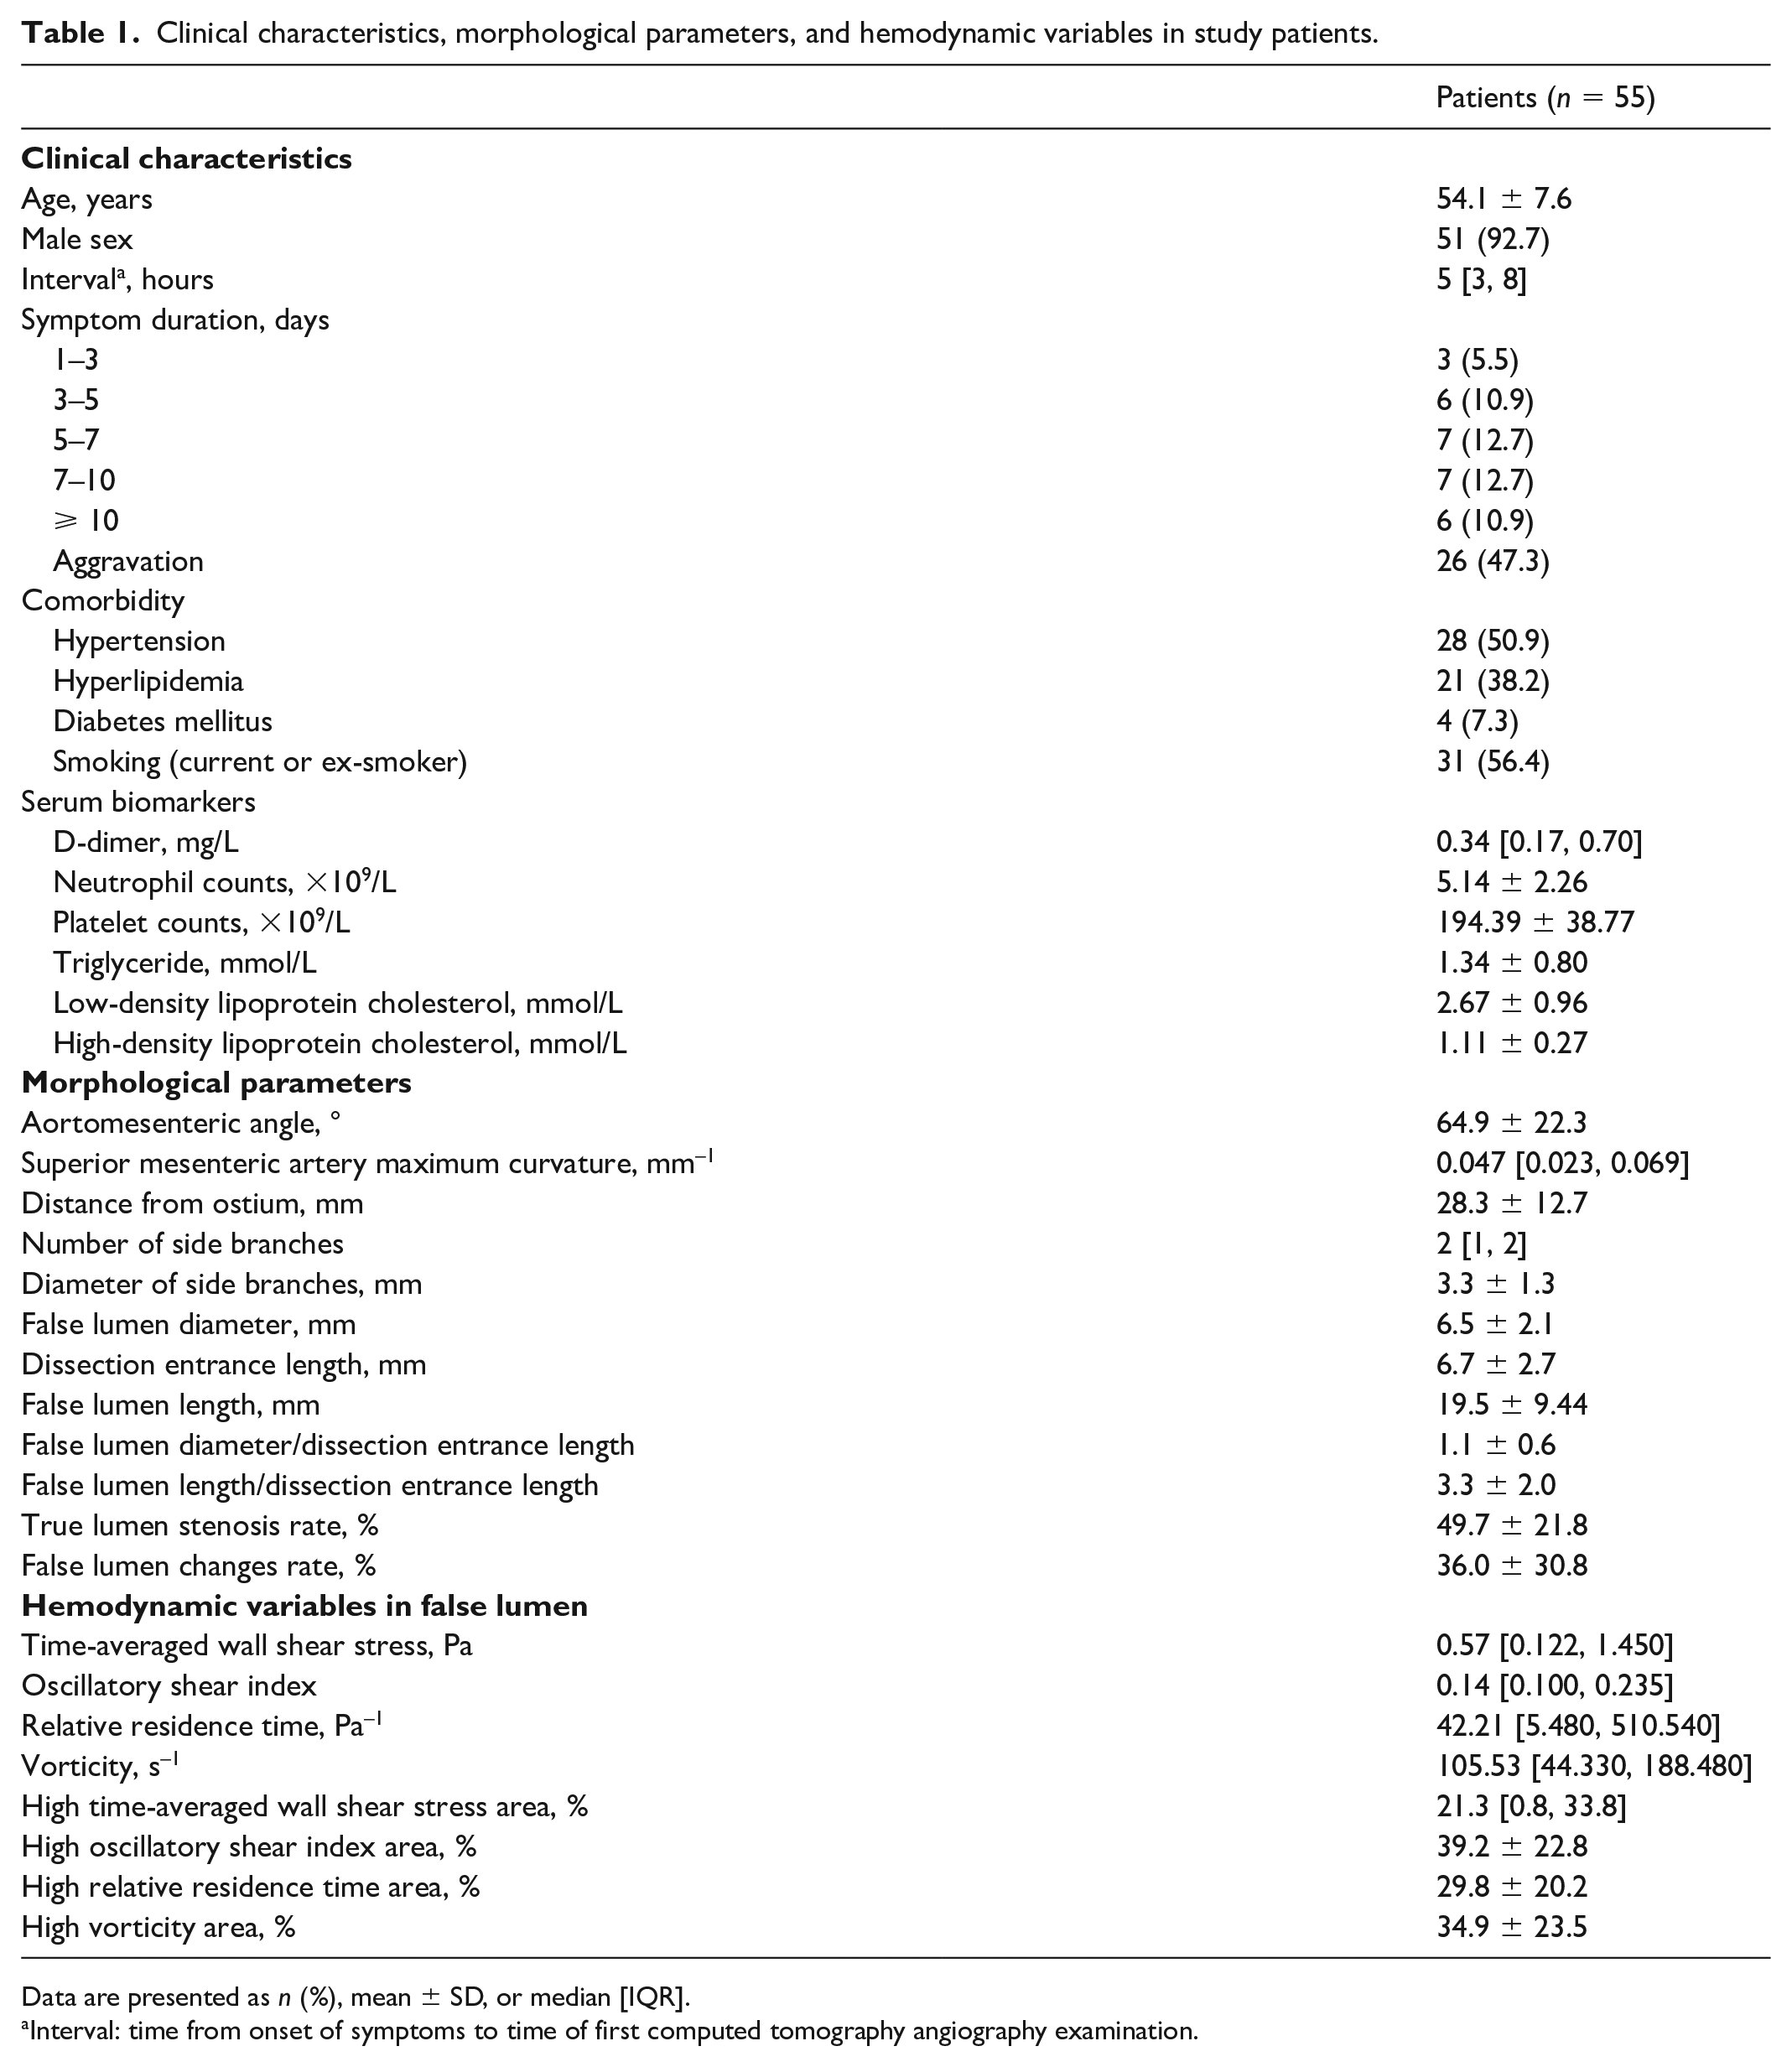
Data are presented as n (%), mean ± SD, or median [IQR].
Interval: time from onset of symptoms to time of first computed tomography angiography examination.
Clinical outcomes and false lumen changes (FLCs) in study patients.
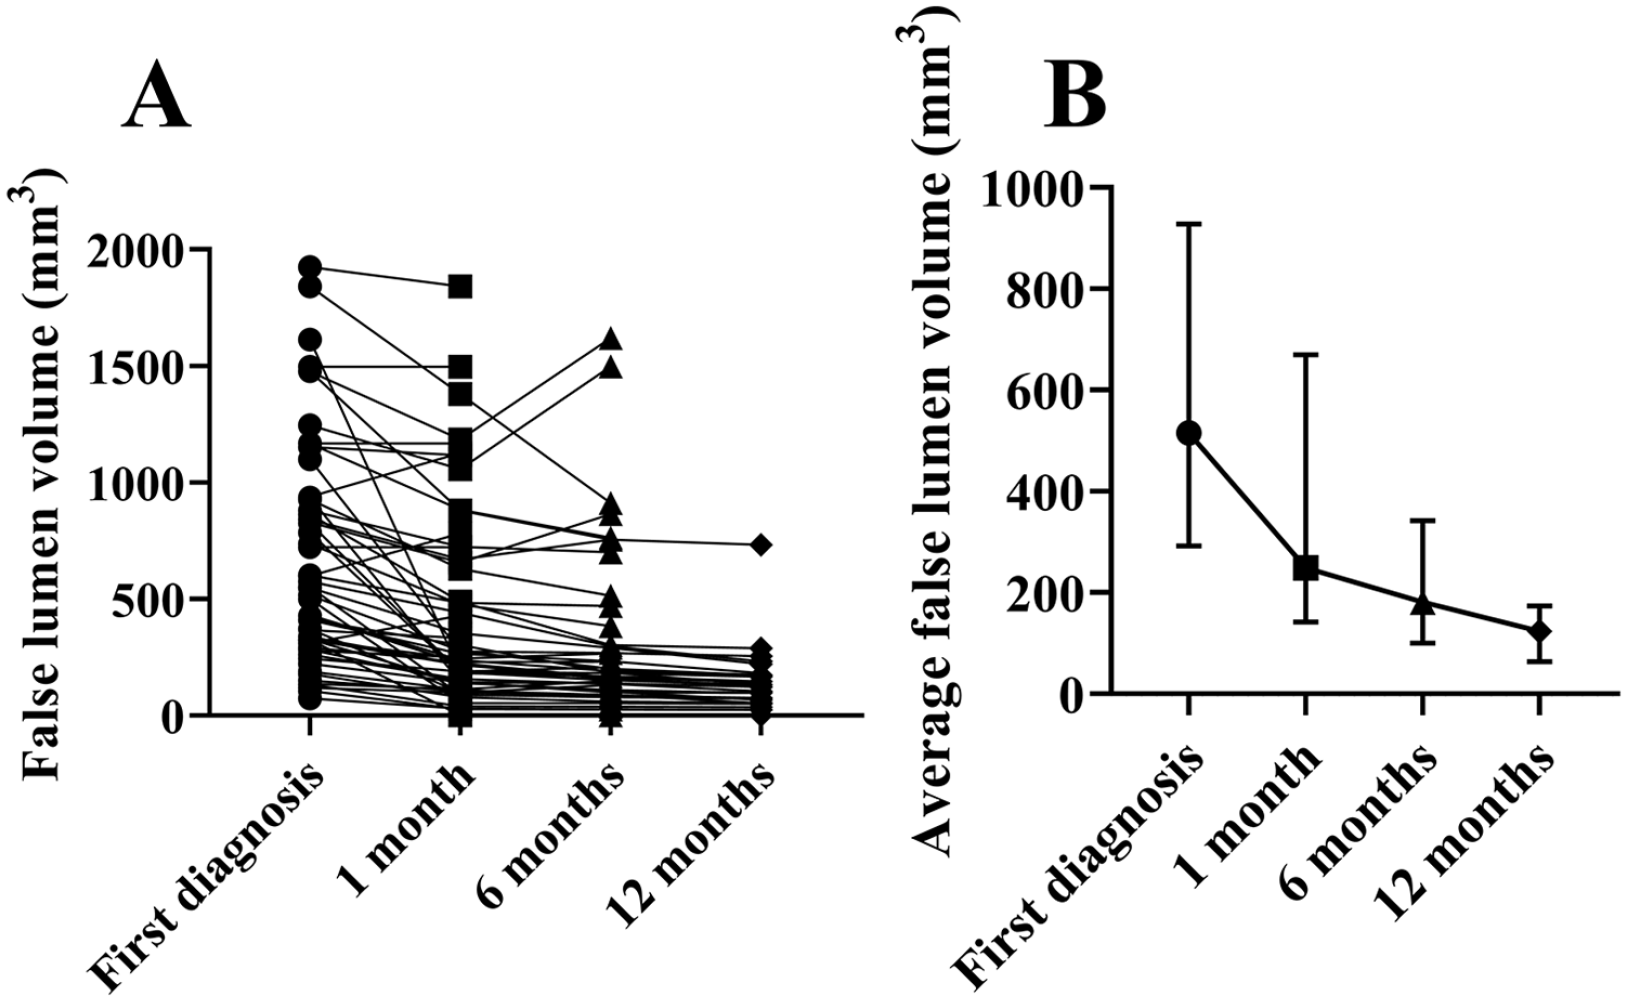
False lumen volume line charts.
Correlations between morphological and hemodynamic factors and FLCs
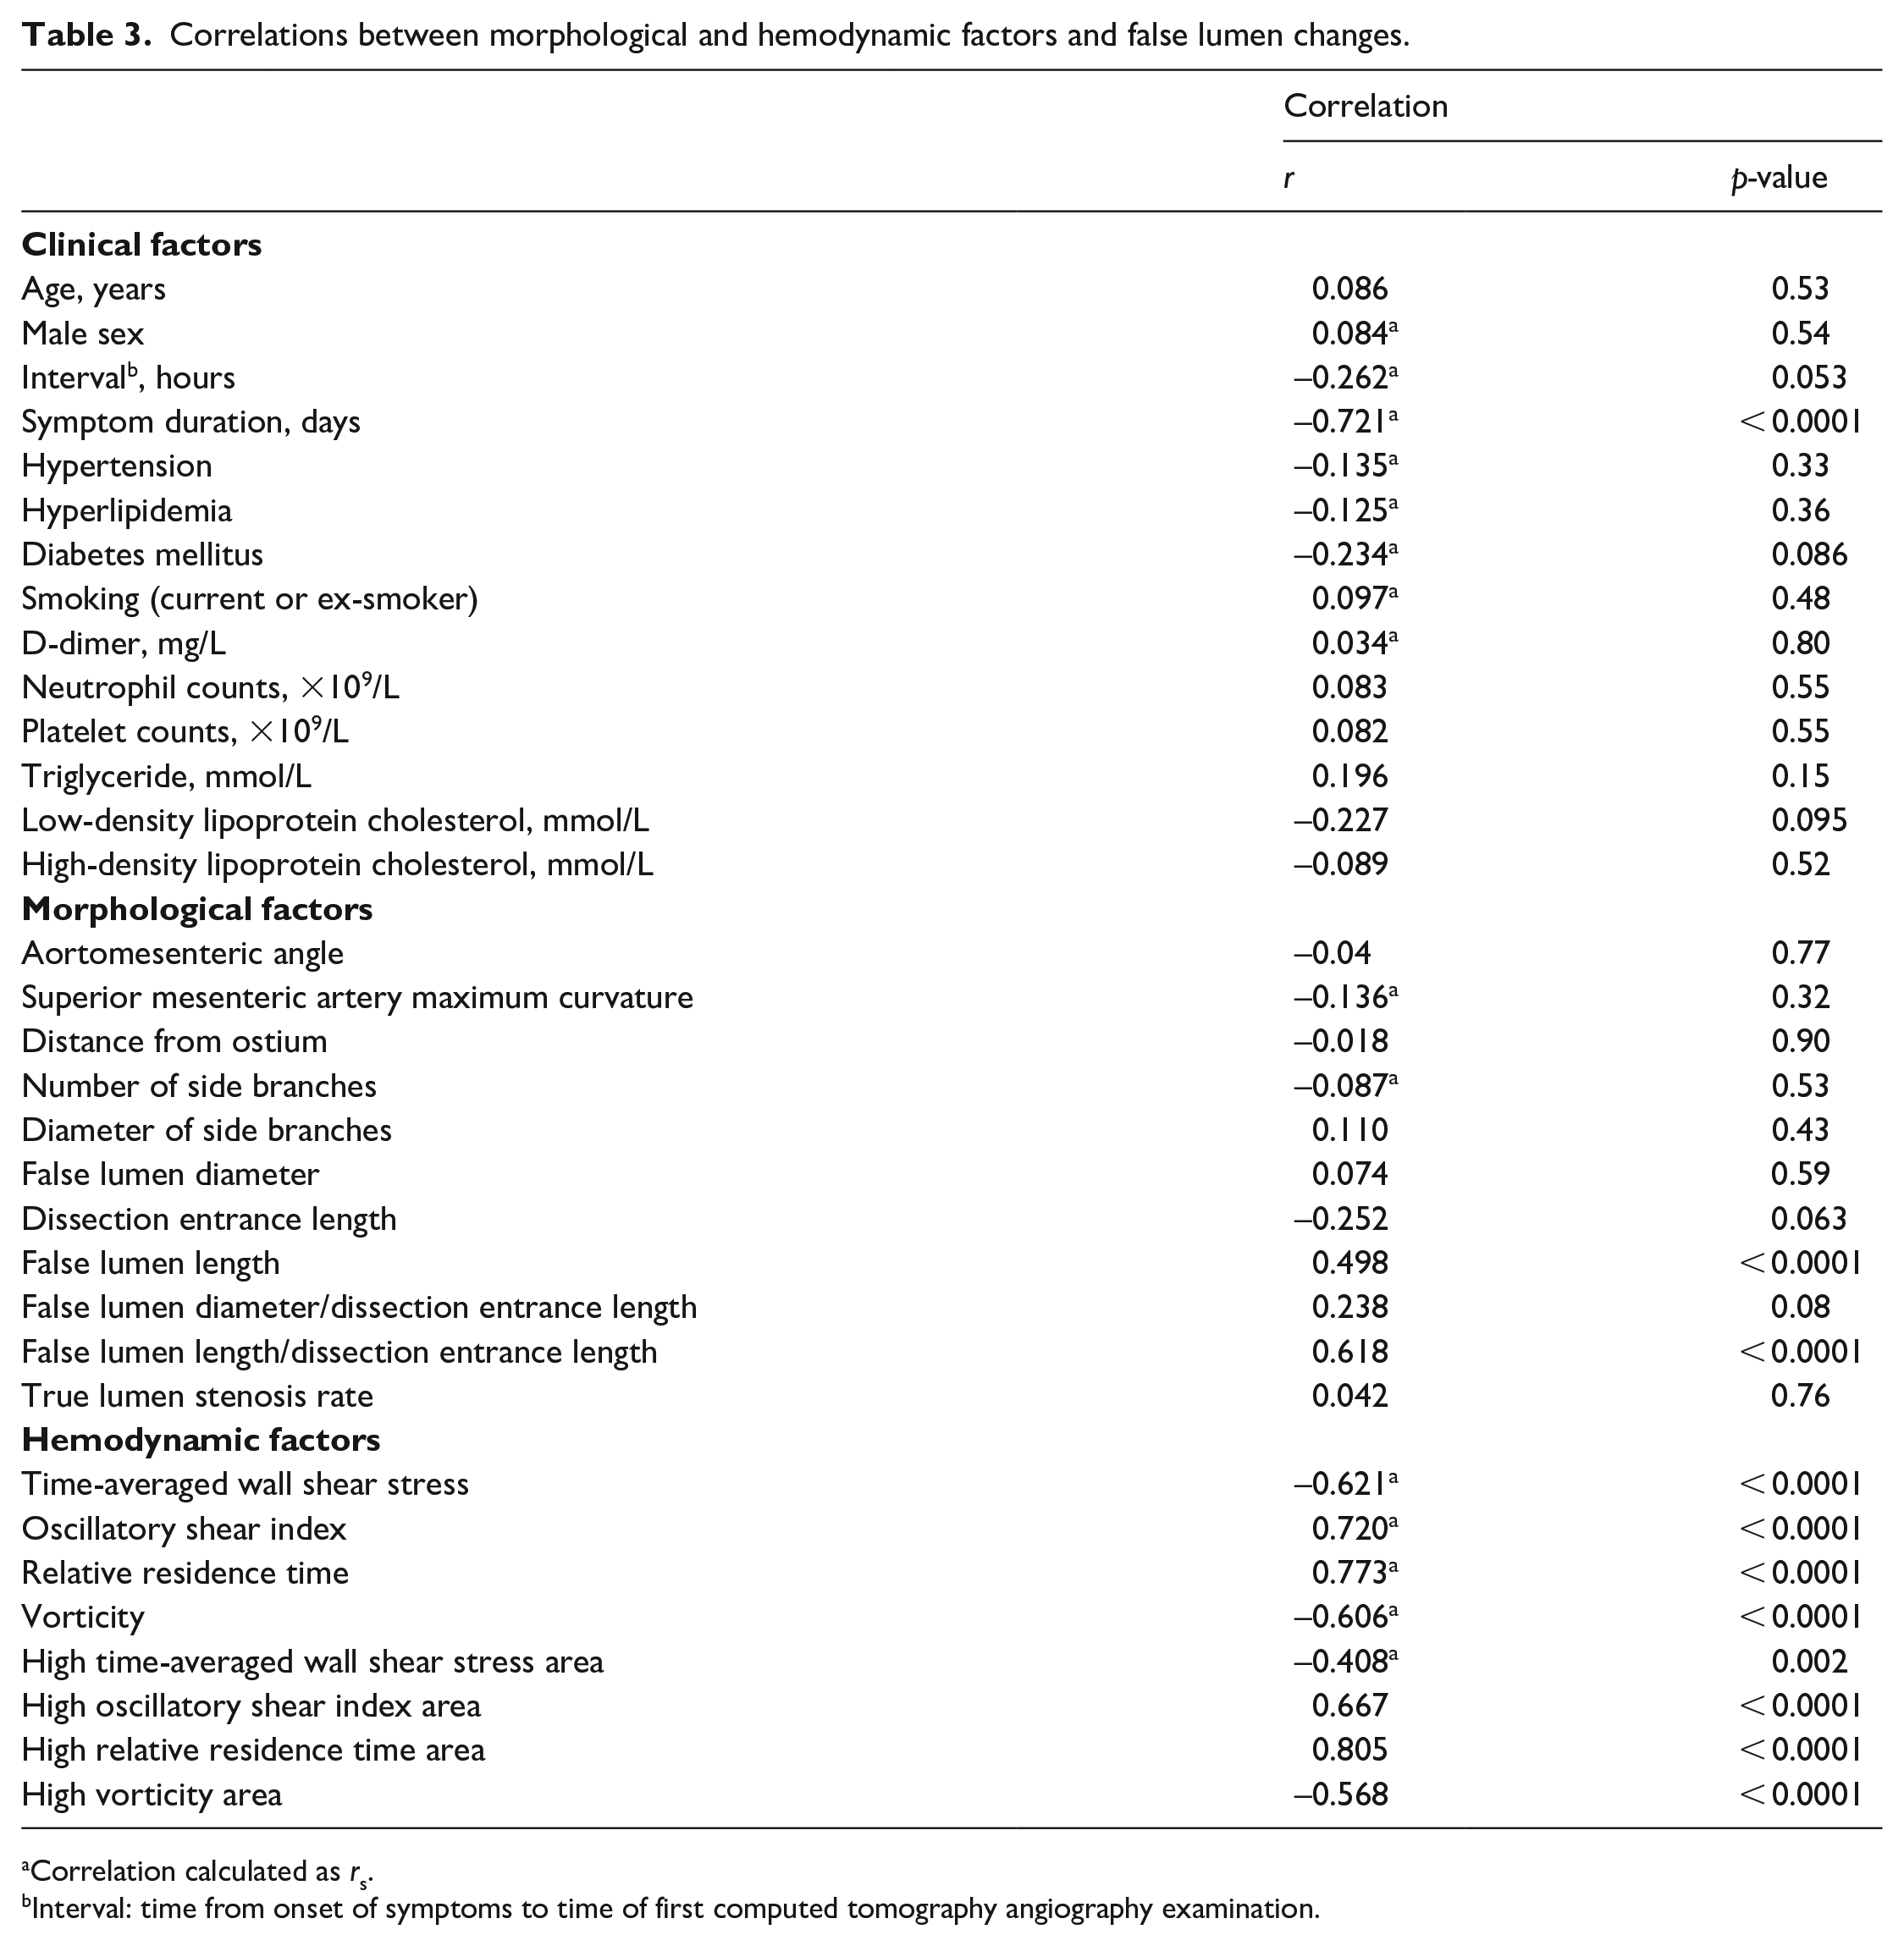
One clinical factor was found to be negatively correlated with FLCs: symptom duration (rs = −0.721; p < 0.0001). Two morphological factors were found to be positively correlated with FLCs: FLL/DEL (r = 0.618; p < 0.0001) and FLL (r = 0.498; p < 0.0001). Four hemodynamic factors were found to be negatively correlated with FLCs: TAWSS (rs = −0.621; p < 0.0001), high TAWSS area (rs = −0.408; p = 0.002), vorticity (rs = −0.606; p < 0.0001), and high vorticity area (r = −0.568; p < 0.0001). Four hemodynamic factors were found to be positively correlated with FLCs: OSI (rs = 0.720; p < 0.0001), high OSI area (r = 0.667; p < 0.0001), RRT (rs = 0.773; p < 0.0001), and high RRT area (r = 0.805; p < 0.0001) (Table 3).
Correlations between morphological and hemodynamic factors and false lumen changes.
Correlation calculated as rs.
Interval: time from onset of symptoms to time of first computed tomography angiography examination.
Predictors of false lumen changes (FLCs)
Multiple linear regression analysis demonstrated that symptom duration (OR = 0.93; 95% CI: 0.91–0.96; p < 0.0001), FLL/DEL (OR = 1.30; 95% CI: 1.01–1.67; p = 0.044), and high RRT area (OR = 2.03; 95% CI: 1.48–2.78; p < 0.0001) were significant predictors of FLCs.
Hemodynamic analysis
Figure 5 shows the hemodynamic parameters TAWSS, OSI, RRT, vorticity, and the blood flow pattern in patients with the most FLCs (P1 and P2) and in patients with the least FLCs (P3 and P4). The higher TAWSS and vorticity regions all appeared around the dissection entrance in these patients, whereas the higher OSI and RRT regions were mostly distributed in one or two poles of the false lumen away from the dissection entrance. For P1 and P2, little or no blood flow could enter the false lumen, and the flow into the false lumen could not form a loop to re-enter the true lumen; however, for P3 and P4, a large amount of blood flow could enter the false lumen. Figure 6A shows the distribution of hemodynamic parameters and the blood flow pattern in conjunction with a follow-up CTA image.
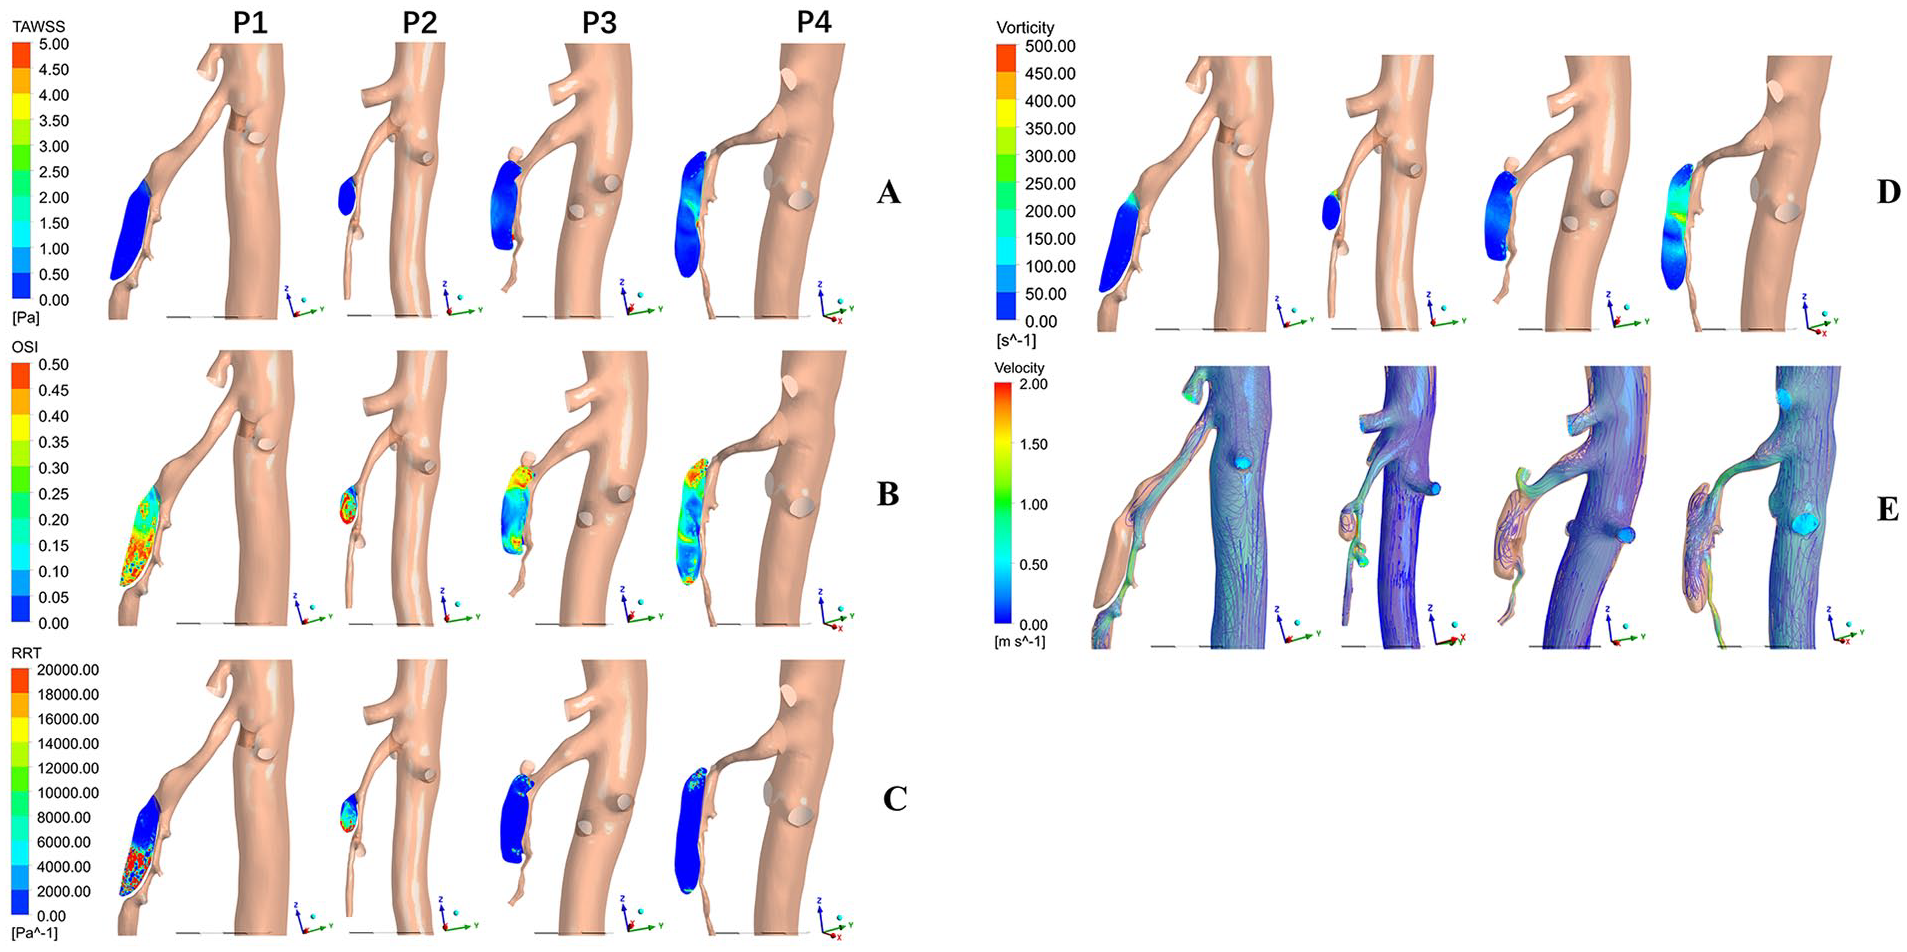
Hemodynamic parameter distribution and flow characteristics in the two patients demonstrating the most FLCs (100%; P1 and P2) and in the two patients demonstrating the least FLCs (−30.5% and −38.3%; P3 and P4).
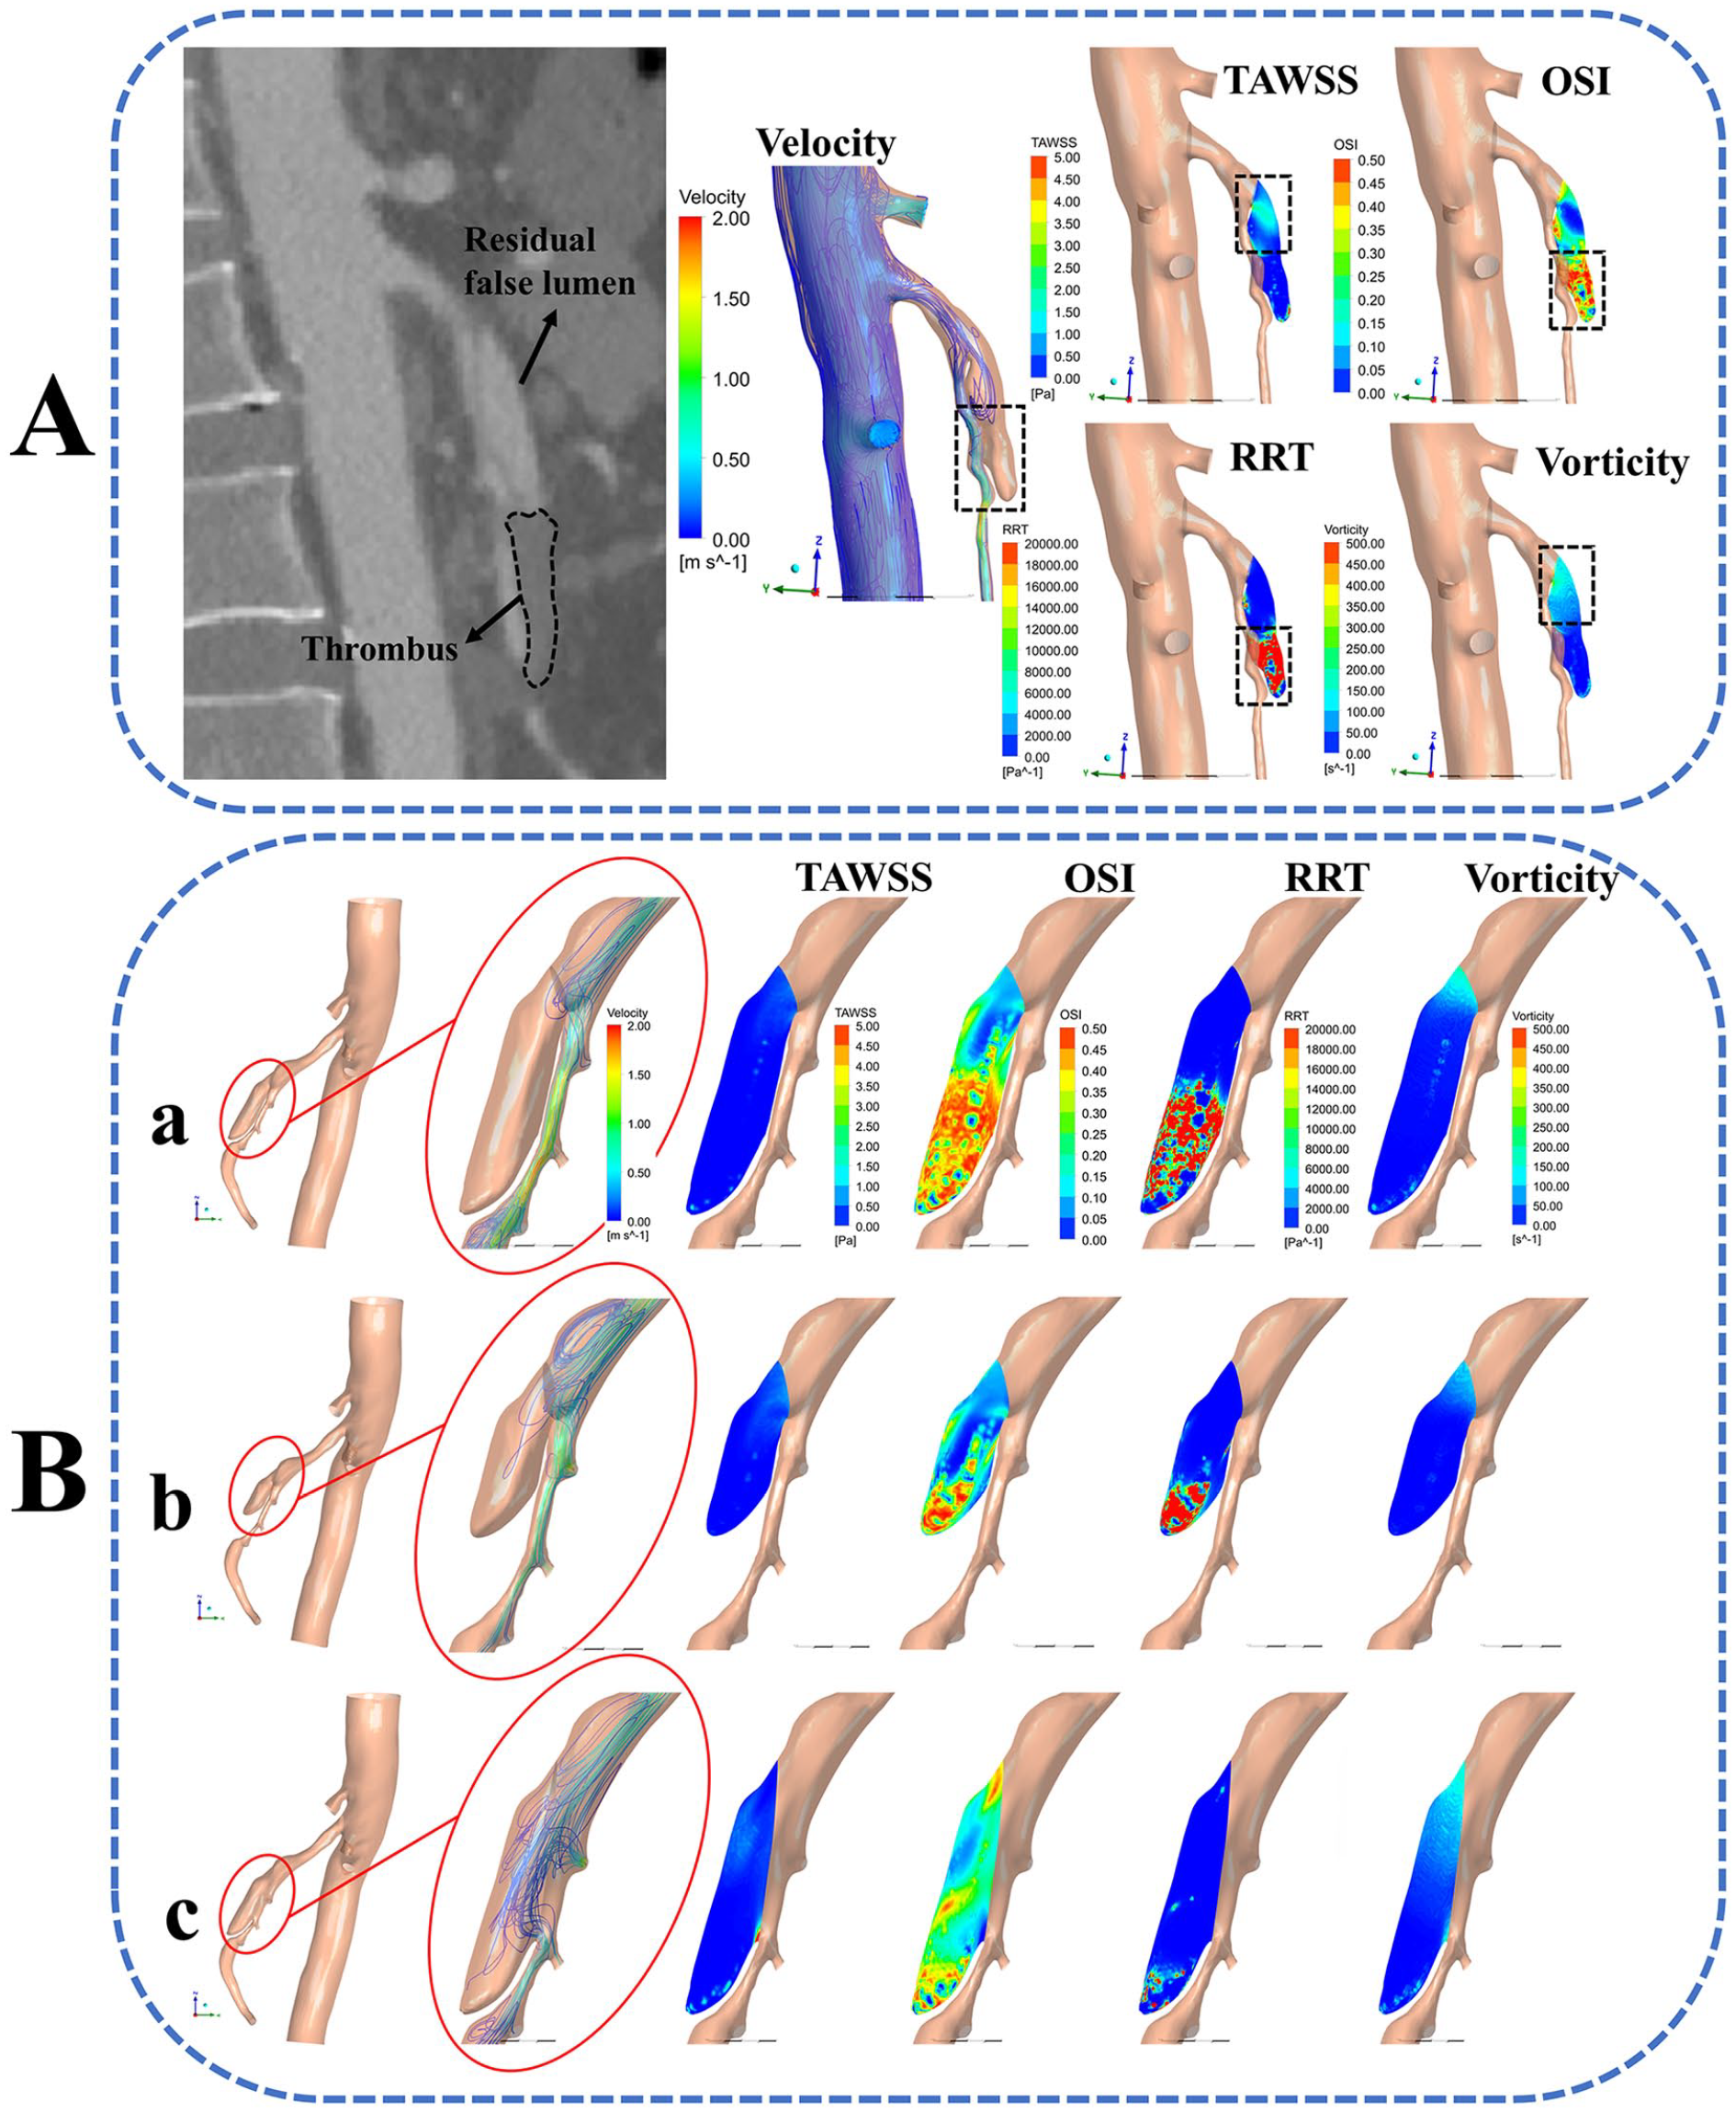
Hemodynamic changes with different false lumen length (FLL)/ dissection entrance length (DEL)
The blood flow velocity and capacity in the false lumen of models ‘a’ and ‘b’ were significantly lower than those in the false lumen of model ‘c’. The high OSI and RRT areas, which were mainly distributed in the distal end of the false lumen, were larger in models ‘a’ and ‘b’ than in model ‘c’. In model ‘c’, the high TAWSS and vorticity areas, which were concentrated near the dissection entrance, were larger than in models ‘a’ and ‘b’ (Figure 6B). The fluid simulation results under another two different boundary conditions are shown in the online supplemental material (Figure S2).
Discussion
The ability to predict FLCs early in patients with type IIa SMAD is important, as this information can affect the choice of treatment. In this study, we found that the FLCs were the most obvious during the 1-month follow up after the diagnosis of SMAD. Besides, three novel predictors of FLCs were identified: symptom duration (clinical predictor), FLL/DEL (morphological predictor), and high RRT area (hemodynamic predictor). This study also demonstrated that FLL, OSI, RRT, and high OSI area were positively correlated with FLCs, whereas TAWSS, vorticity, high TAWSS area, and high vorticity area were negatively correlated with FLCs. The higher TAWSS and vorticity areas appeared around the dissection entrance; the higher OSI and RRT areas were mostly distributed in one or two poles of the false lumen, away from the entrance, findings highly consistent with the location of thrombosis in the false lumen.
Previous studies have shown that the outcomes of type IIa SMAD are the most difficult to predict among all SMAD types and that type IIa SMAD is often associated with the failure of conservative management and delay of SMA remodeling.3,29 In cases of type I SMAD, the false lumen has both entry and re-entry sites, and blood can flow smoothly through the false lumen with a velocity similar to that seen in the true lumen. Therefore, most cases of type I SMAD tend to be stable. 5 In cases of type IIb SMAD, absorption of the formed thrombus is common and usually leads to disappearance of the false lumen.30,31 Conservative management is thus usually chosen for patients with type I or type IIb SMAD. 32 In type III SMAD, occlusion of the SMA restricts the collateral blood supply, which puts the patient at high risk of intestinal necrosis; thus, early intervention is generally recommended. 33 Based on our results, patients with type IIa SMAD often have the most obvious FLCs within the 1-month follow up after diagnosis, so it is necessary to strictly follow up and manage all patients during this period. For patients with rapid reduction of false lumen within the 1-month follow up, we could appropriately prolong the follow-up interval and reduce unnecessary CTA examination. However, for patients with enlargement or delayed reduction of false lumen within the 1-month follow up, we should follow up closely and take interventional therapy when necessary. In addition, symptom duration is the only clinical predictor of FLCs we found, which is consistent with previous studies. 29 Therefore, in clinical practice, shorter symptom duration is an important basis for evaluating FLCs and the outcomes of type IIa SMAD patients during conservative treatment.
Vorticity describes the size or speed of a vortex; TAWSS describes the time average value of blood flow-induced friction stress acting on the vascular wall; OSI reflects the oscillatory degree of WSS on the vascular wall; RRT describes the residence time of the particle, which combines the effects of TAWSS and OSI to provide more comprehensive information about the near-wall hemodynamics. 34 Based on the CFD simulation findings in this study, schematic diagrams of blood flow in three different kinds of false lumen were created (online supplemental material Figure S3). In model A, the blood flow can re-enter the true lumen; therefore, the blood flow in the false lumen forms the circulation, leading to lower OSI and RRT and higher TAWSS and vorticity. This type of local hemodynamic environment has been found to be unfavorable to the formation of thrombus, and the blood pressure gradient between the true and false lumens limi-ts the ability to shrink or stop expansion of the false lumen.35,36 In model B, which has the same FLL as model A but lower DEL, the blood flow of the false lumen cannot re-enter the true lumen, leading to formation of a local vortex zone in the false lumen. This chaotic low-speed blood flow results in higher OSI and RRT and lower TAWSS and vorticity, 37 which encourages mixing of coagulation proteins and creates a procoagulant microenvironment for platelet aggregation and fibrin formation at the false lumen wall. 38 In model C, thrombus is less likely to form in the initial and middle parts of the false lumen than in the lower pole of the false lumen, which may increase the risk of symptoms and lead to the failure of conservative management. 30
The local hemodynamic state in the false lumen therefore plays a crucial role in the occurrence of FLCs. Higher OSI and RRT regions are accompanied by the formation of thrombus in the false lumen, whereas higher TAWSS and vorticity regions probably indicate expansion of the false lumen. These findings suggest that a false lumen with lower FLL/DEL but higher FLL (model A) tends to be stable for a long time but at risk of enlargement. In these cases, conservative management and close observation are preferred. A false lumen with higher FLL/DEL (model B) can form thrombus quickly, and so these cases should be managed conservatively. In a false lumen with lower FLL/DEL and higher FLL (model C), remodeling is less likely to occur and the false lumen is more likely to expand; thus, these cases should be closely followed and endovascular therapy should be considered.
Study limitations
The main limitation of this study was its retrospective nature. Because of the rarity of SMAD, this study was also limited by its small sample size; nevertheless, this remains one of the largest patient cohorts to be reported to date in this subtype and is the first study to analyze factors associated with FLCs in patients with type IIa SMAD. Calculations of morphological parameters were performed manually, not automatically, and the reference vessel diameter was difficult to determine precisely because of the small diameter of the mesenteric artery; these factors may have biased the results. The computational prediction model of FLC was not created because of technical reasons and because the dynamic viscosity of the blood is not patient-specific. Finally, there are intrinsic relationships between various hemodynamic parameters, so they are not completely independent variables in multiple linear regression. In future studies, we hope to apply more comprehensive parameters to compensate for the interdependence of basic hemodynamic parameters and better explore the combined effects of basic hemodynamic parameters on FLCs.
Conclusion
This study suggests that symptom duration (clinical predictor), FLL/DEL (morphological factor), and high RRT area (hemodynamic factor) can serve as early predictors of FLCs in patients with symptomatic type IIa SMAD. These findings suggest that patients with type IIa SMAD with shorter symptom duration, higher FLL/DEL, and larger high RRT area tend to complete the disappearance of false lumen quickly and recovery after conservative management, whereas patients with longer symptom duration, lower FLL/DEL, and smaller high RRT area have a higher risk of false lumen enlargement and disease deterioration. Therefore, close follow up is recommended to detect any progression in SMAD and to intervene when necessary.
Supplemental Material
sj-docx-1-vmj-10.1177_1358863X231220624 – Supplemental material for Factors associated with false lumen changes in patients with superior mesenteric artery dissection
Supplemental material, sj-docx-1-vmj-10.1177_1358863X231220624 for Factors associated with false lumen changes in patients with superior mesenteric artery dissection by Junhao Mei, Yuan Yuan, Hui Yan, Xi Zhao, Tongqing Xue, Haobo Su and Zhongzhi Jia in Vascular Medicine
Footnotes
Acknowledgements
We thank Liulan Qian, biostatistician, Department of Scientific Research and Education, the Affiliated Changzhou Second People’s Hospital of Nanjing Medical University, Changzhou, China, for her help with data analysis and Megan Griffiths, scientific writer, Cleveland, Ohio, USA, for her help with revising the manuscript.
Data availability statement
The data that support the findings of this study are available from the corresponding author upon reasonable request.
Declaration of conflicting interests
The authors declared no potential conflicts of interest with respect to the research, authorship, and/or publication of this article.
Funding
This study was supported by the Changzhou Sci & Tech Program (CZ20220029), China Postdoctoral Science Foundation (2023M730371), Clinical Research Project of Changzhou Medical Center of Nanjing Medical University (CMCC202206), and the Natural Science Foundation of China (81401498). The funders had no role in study design, data collection and analysis, decision to publish, or preparation of the manuscript.
Supplementary material
The supplementary material is available online with the article.
References
Supplementary Material
Please find the following supplemental material available below.
For Open Access articles published under a Creative Commons License, all supplemental material carries the same license as the article it is associated with.
For non-Open Access articles published, all supplemental material carries a non-exclusive license, and permission requests for re-use of supplemental material or any part of supplemental material shall be sent directly to the copyright owner as specified in the copyright notice associated with the article.