
Abstract
Arterial calcification due to deficiency of CD73 (ACDC) is a rare, autosomal recessive disease marked by claudication and arterial calcification of the lower extremities that expands toward the ankles, rheumatological symptoms with episodic arthritic flares and small joint erosion,1,2 and periarticular calcification in the hands and feet. This study was approved by the institutional review board of the National Heart, Lung, and Blood Institute. All participants gave written informed consent.
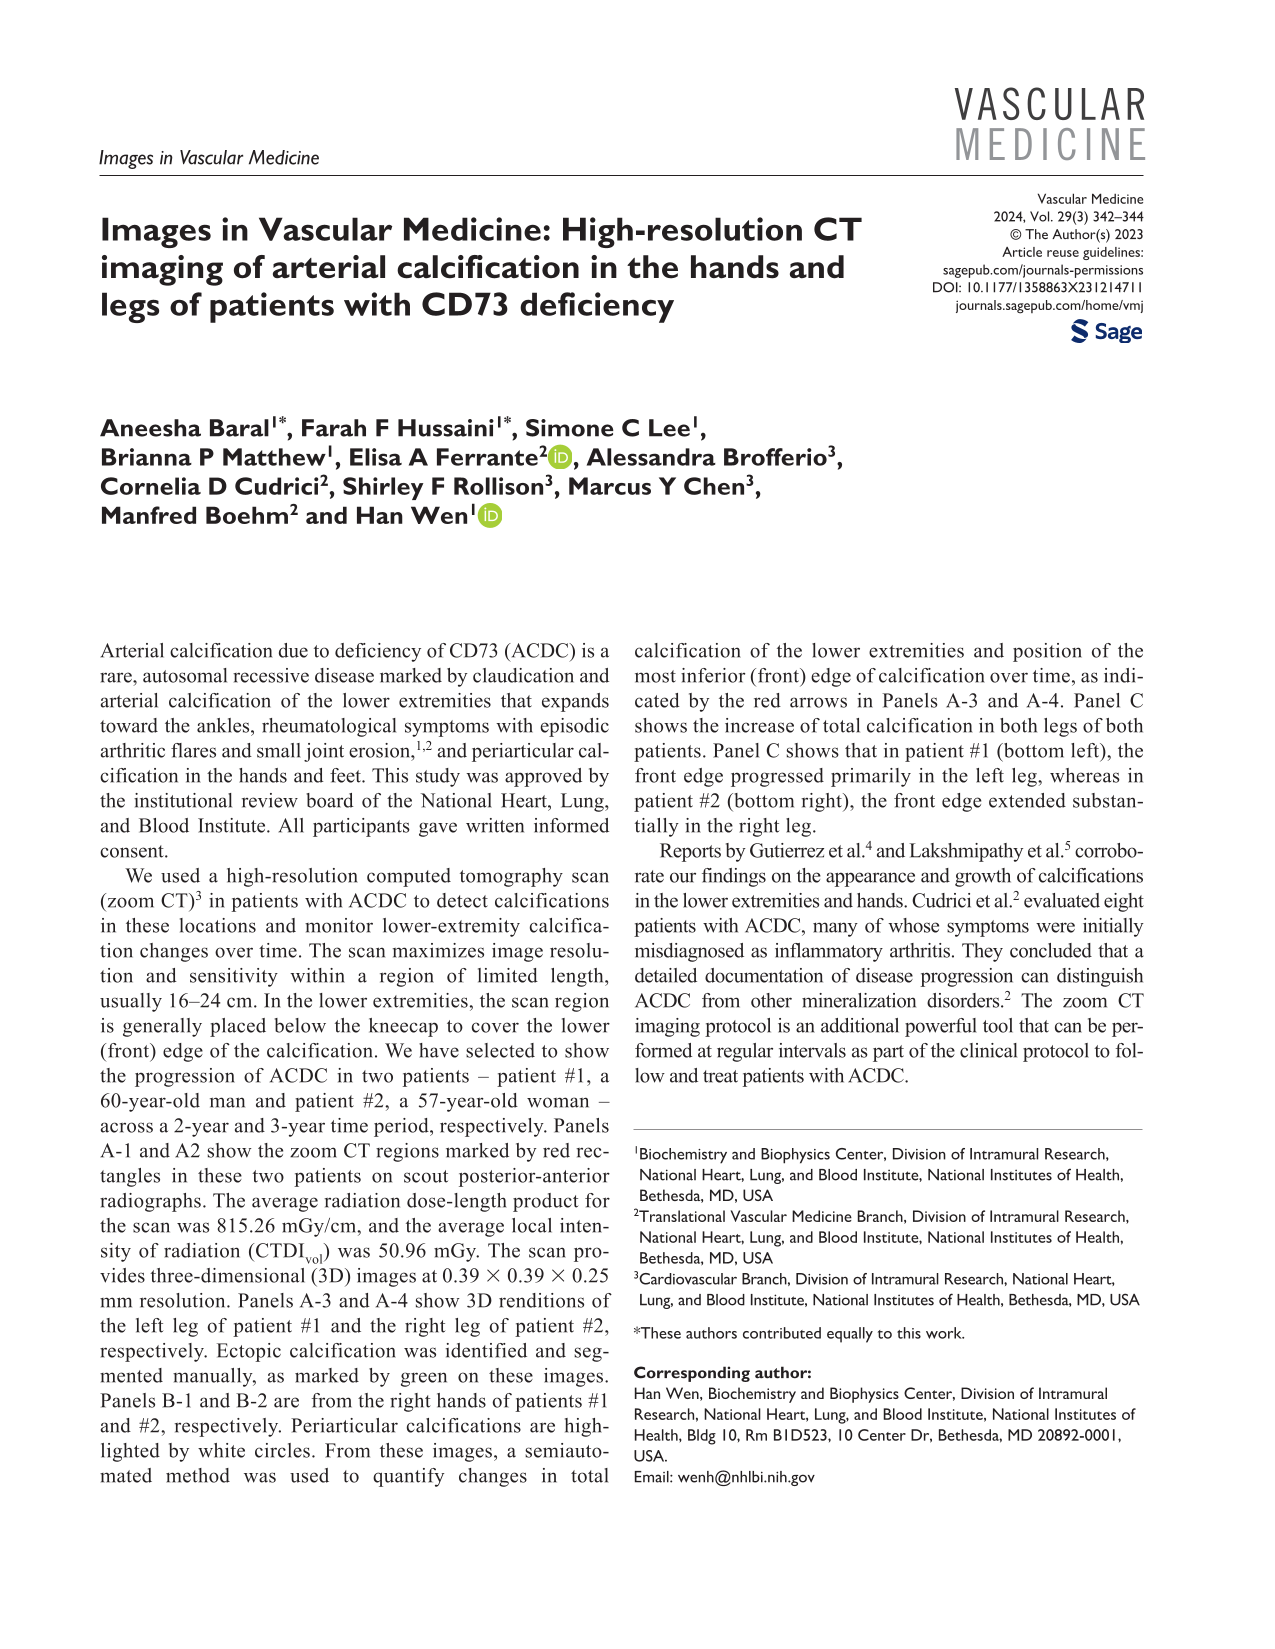
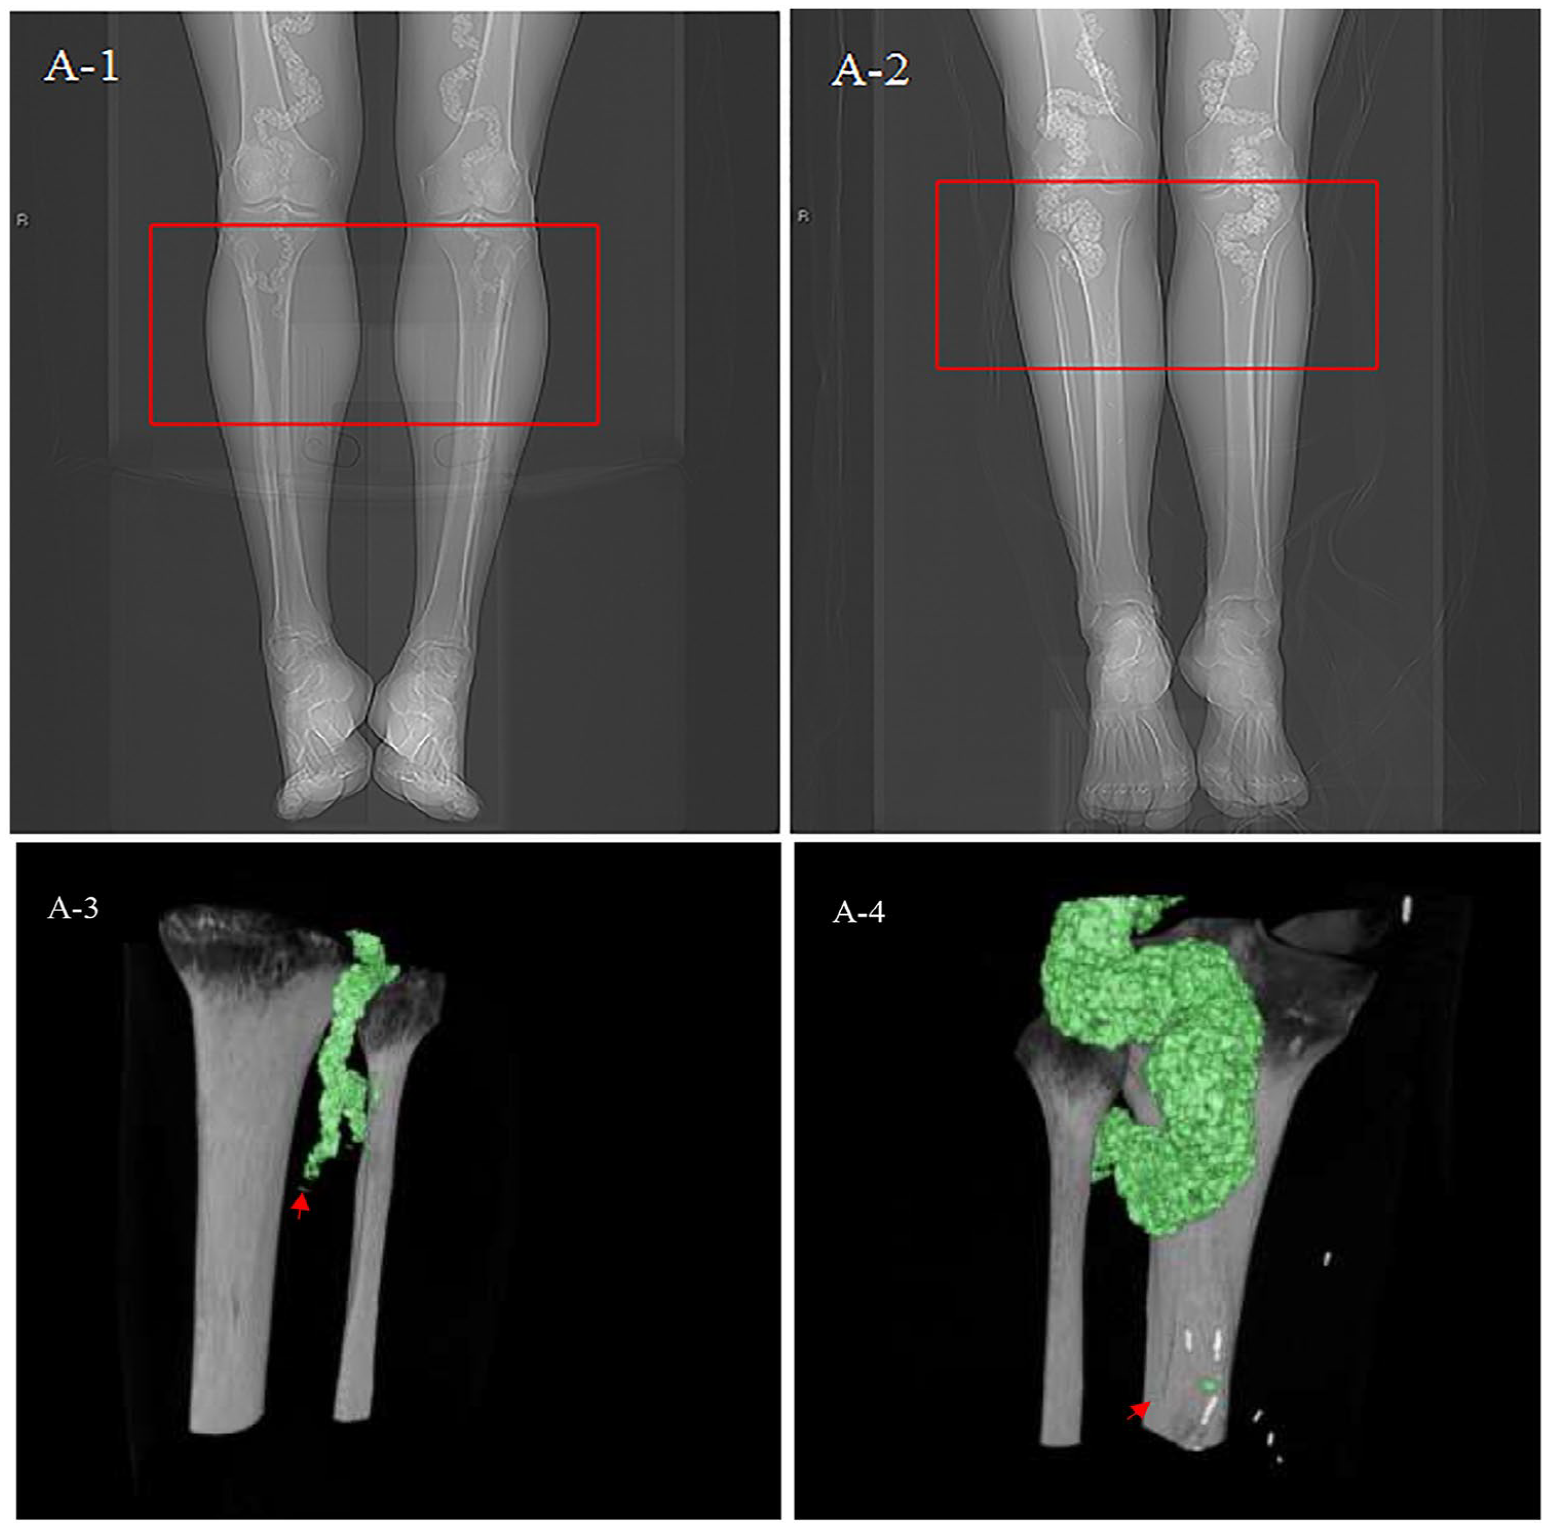
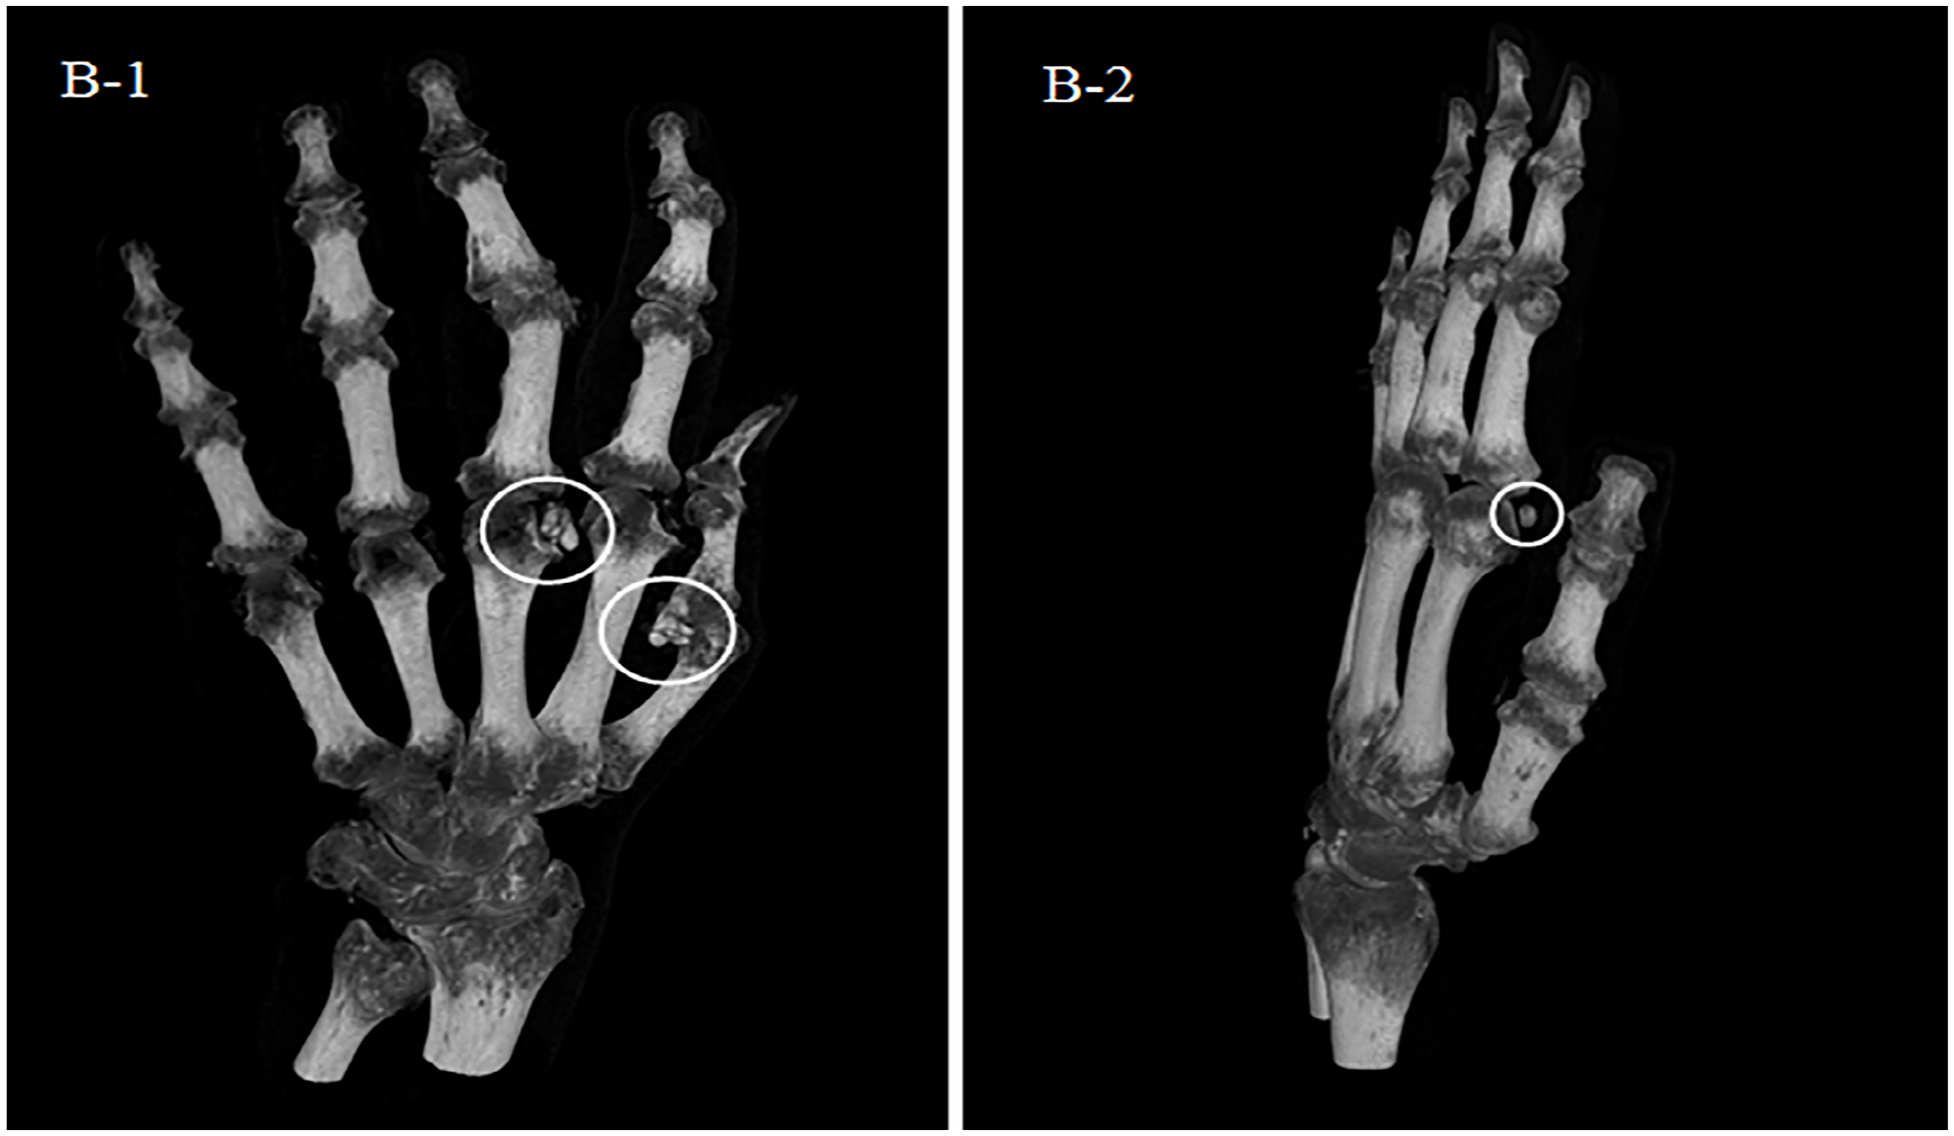
We used a high-resolution computed tomography scan (zoom CT) 3 in patients with ACDC to detect calcifications in these locations and monitor lower-extremity calcification changes over time. The scan maximizes image resolution and sensitivity within a region of limited length, usually 16–24 cm. In the lower extremities, the scan region is generally placed below the kneecap to cover the lower (front) edge of the calcification. We have selected to show the progression of ACDC in two patients – patient #1, a 60-year-old man and patient #2, a 57-year-old woman – across a 2-year and 3-year time period, respectively. Panels A-1 and A2 show the zoom CT regions marked by red rectangles in these two patients on scout posterior-anterior radiographs. The average radiation dose-length product for the scan was 815.26 mGy/cm, and the average local intensity of radiation (CTDIvol) was 50.96 mGy. The scan provides three-dimensional (3D) images at 0.39 × 0.39 × 0.25 mm resolution. Panels A-3 and A-4 show 3D renditions of the left leg of patient #1 and the right leg of patient #2, respectively. Ectopic calcification was identified and segmented manually, as marked by green on these images. Panels B-1 and B-2 are from the right hands of patients #1 and #2, respectively. Periarticular calcifications are highlighted by white circles. From these images, a semiautomated method was used to quantify changes in total calcification of the lower extremities and position of the most inferior (front) edge of calcification over time, as indicated by the red arrows in Panels A-3 and A-4. Panel C shows the increase of total calcification in both legs of both patients. Panel C shows that in patient #1 (bottom left), the front edge progressed primarily in the left leg, whereas in patient #2 (bottom right), the front edge extended substantially in the right leg.
Reports by Gutierrez et al. 4 and Lakshmipathy et al. 5 corroborate our findings on the appearance and growth of calcifications in the lower extremities and hands. Cudrici et al. 2 evaluated eight patients with ACDC, many of whose symptoms were initially misdiagnosed as inflammatory arthritis. They concluded that a detailed documentation of disease progression can distinguish ACDC from other mineralization disorders. 2 The zoom CT imaging protocol is an additional powerful tool that can be performed at regular intervals as part of the clinical protocol to follow and treat patients with ACDC.
Footnotes
Declaration of conflicting interests
The authors declared no potential conflicts of interest with respect to the research, authorship, and/or publication of this article.
Funding
The authors received no financial support for the research, authorship, and/or publication of this article.