
Abstract
Background:
Obesity is linked with heightened cardiovascular risk, especially when accompanied by metabolic abnormalities. Lipocalin (LCN) 2 and retinol-binding protein (RBP) 4, two members of the lipocalin family, may be upregulated in insulin resistance and atherosclerosis. We analyzed whether changes in circulating LCN2 and RBP4 in obese individuals relate with impaired vasodilator reactivity, an early stage in atherosclerosis.
Methods:
Obese individuals (n = 165), without (n = 48) or with (n = 117) metabolic abnormalities, and lean subjects (n = 42) participated in this study. LCN2 and RBP4 were measured by Luminex assay. Endothelium-dependent and -independent vasodilation to acetylcholine and sodium nitroprusside, respectively, was assessed by strain-gauge plethysmography.
Results:
Circulating LCN2 was higher in obese than in lean subjects (p < 0.001), whereas RBP4 was not different between the two groups (p = 0.12). The vasodilator responses to both acetylcholine and nitroprusside were impaired in obese individuals (p < 0.001 vs lean subjects), with no difference between those with metabolically healthy or unhealthy obesity (p > 0.05). In the whole population, vasodilator responses to acetylcholine (R = 0.23, p = 0.01) and nitroprusside (R = 0.38, p < 0.001) had an inverse, linear relationship with circulating LCN2; no correlation, by contrast, was observed between circulating RBP4 and vasodilator reactivity (both p > 0.05). In a subgroup of obese patients with diabetes (n = 20), treatment with metformin (n = 10) or pioglitazone (n = 10) did not modify circulating LCN2 and RBP4 or vascular reactivity (all p > 0.05).
Conclusions:
Circulating LCN2, but not RBP4, is higher in obese than in lean individuals. Interestingly, changes in LCN2 inversely relate to those in vasodilator function, thereby making this protein a potential biomarker for risk stratification in obesity.
Background
Increased and ectopic adipose tissue (AT) deposition occurring in obesity are associated with dysregulation of adipokine expression and inflammatory cell infiltration, contributing, in turn, to insulin resistance and obesity-related complications, such as type 2 diabetes (T2D) and cardiovascular disease. 1 Identifications of the molecular mechanisms favoring the transformation of the increased fat burden into a cardiometabolic disorder, therefore, is an important goal for prevention.
Among several adipokines whose production is dysregulated in obese individuals, are lipocalin (LCN) 2 (also known as neutrophil gelatinase-associated lipocalin [NGAL]) and retinol-binding protein (RBP) 4, two members of the lipocalin family, a group of peptides that, in addition to their role as carrier proteins, have been implicated in the regulation of cell function and the modulation of immune homeostasis. 2 In fact, both LCN2 and RBP4 have been associated with chronic, low-grade, systemic inflammation and insulin resistance secondary to obesity.3,4 Thus, circulating LCN2 is elevated in obese humans and bears a positive correlation with the degree of adiposity, hypertriglyceridemia, hyperglycemia, and inflammatory markers, such as high-sensitivity C-reactive protein (CRP). 5 Likewise, serum levels of RBP4 are elevated in obesity and diabetes, and seem to mediate insulin resistance by augmenting macrophage production of pro-inflammatory cytokines.6–8 Elevation of circulating levels of LCN2 or RBP4 in human obesity, however, are not undisputed findings, given that some investigations have reported similar circulating levels of these proteins in obese and lean subjects.9,10 It remains unclear whether these discrepancies might stem from, or rather impact on, different obesity-associated metabolic phenotypes, such as metabolically healthy (MHO) or unhealthy (MUO) obesity. This aspect might have clinical implications, given that, even though MHO is not an entirely innocuous condition, individuals with MHO have a lower risk of developing cardiovascular disease than those with MUO. 11
One mechanism by which obesity might influence vascular damage and cardiovascular events is impairment of endothelial function, 12 the earliest event in the atherogenic process. 13 More accurate characterization of the factors involved in this abnormality, therefore, might translate into better opportunities for treatment.
In the present study, we tested the hypotheses that obesity affects circulating concentrations of LCN2 and RBP4 according to the different metabolic phenotypes, and that LCN2 and RBP4 levels are associated with abnormalities in vasodilator reactivity. Additionally, we assessed whether, in a group of obese patients with T2D, different antidiabetic medications might impact the circulating levels of LPC2 or RBP4 and ameliorate vasodilator reactivity.
Methods
Participants
Healthy, lean volunteers (body mass index [BMI] < 25 kg/m2, normal waist circumference) and patients with central obesity (waist circumference ⩾ 102 cm for men or ⩾ 88 cm for women) attending the outpatient clinic of Policlinico A. Gemelli were included in the study. Obese patients were classified as having MHO in the absence of any of the metabolic abnormalities defining the metabolic syndrome according to the Adult Treatment Panel III (ATPIII) criteria 14 or as having MUO in the presence of at least one of those abnormalities; the MUO group included 31 patients who fulfilled the criteria set by the American Diabetes Association for the diagnosis of diabetes. 15 Exclusion criteria were history or current evidence of cardiovascular disease (coronary artery disease, cerebrovascular or peripheral occlusive arterial disease, coagulopathy, vasculitis) or any other systemic condition (neoplasms; autoimmune or inflammatory diseases; infectious disease; chronic renal, hepatic, heart, pulmonary, endocrine, or neurologic diseases). In obese and diabetic patients taking antihypertensive and/or lipid-lowering drugs, treatment was discontinued for at least 1 week prior to the study. During this time, blood pressure levels were repeatedly measured and, when needed, antihypertensive treatment was resumed and the patient excluded from the study. None of the participants was a smoker and all of them were asked to refrain from drinking alcohol and beverages containing caffeine for at least 24 hours before the study. None of the participants was taking vitamin supplements or engaged in programs of regular physical activity. The study protocol was approved by the Institutional Review Board of Catholic University (100356/16), and all participants gave written informed consent before their involvement in the study.
Analytical procedures
Participants were asked to fast for at least 8 hours before the study. Then, while the participant was supine, a deep antecubital vein was cannulated with a 20-gauge catheter (Abbott Laboratories, Abbott Park, IL, USA); blood was collected in citrated tubes and immediately spun in a refrigerated centrifuge; plasma samples were aliquoted to avoid multiple freeze/thaw cycles that may reduce the stability of the analytes and then immediately stored at −80°C; aliquots used for this study where thawed immediately before the assay and carefully inspected for their conformity, to rule out gross hemolysis or abnormalities in the preservation. Measurements of insulin, LCN2, and RBP4 were performed on stored plasma samples by Luminex assays (R&D Systems, Minneapolis, MN, USA). Insulin sensitivity was determined by use of the HOMA (homeostasis model assessment) index of insulin resistance. 16 High-sensitivity CRP was measured in diabetic patients by chemiluminescent immunoassay.
Vascular reactivity studies
Each study consisted of infusions of drugs into the brachial artery and measurement of forearm blood flow by means of strain-gauge venous occlusion plethysmography. All drugs used in this study were prepared by the hospital research pharmacy following specific procedures to ensure accurate bioavailability and sterility of the solutions. While participants were supine, a 20-gauge Teflon catheter (Arrow Inc., Limerick, PA, USA) was inserted into the brachial artery of the nondominant arm (left in most cases) for drug infusion. The extended arm was positioned slightly above the level of the right atrium and a mercury-filled strain gauge was placed around the widest part of the forearm. The strain gauge was connected to a plethysmograph (model EC-6; Hokanson Inc., Bellevue, WA, USA) calibrated to measure the percent change in volume and connected to a personal computer through an analog-to-digital converter. For each measurement, a cuff placed around the upper arm was inflated to 40 mmHg with a rapid cuff inflator (model E-10; Hokanson) to occlude venous outflow from the extremity. A wrist cuff was inflated to suprasystolic pressures 1 minute before each measurement to exclude the hand circulation. Flow measurements were recorded for approximately 7 seconds every 15 seconds; seven readings were obtained for each mean value. Blood pressure was recorded with the use of a standard mercury manometer. Throughout all studies, volumes infused were matched by administration of variable amounts of saline.
Vasodilator reactivity was tested as previously reported in detail. 17 Briefly, after the forearm was instrumented, saline was infused intra-arterially for 15 minutes, basal flow was measured, and dose–response curves to acetylcholine chloride (ACh) (Sigma-Aldrich, St Louis, MO, USA), which is known to induce vasodilation through, at least in part, endothelial release of NO, and to the exogenous NO donor sodium nitroprusside (SNP) (Malesci, Florence, Italy) were obtained.
Intervention study
After determination of eligibility at screening, 20 of the 31 obese patients with newly diagnosed, treatment-naïve T2D participated in a randomized, double-blinded, two-arm design, pilot study. Randomization was performed by use of computer-generated random numbers. In these patients, the screening visit was followed by a 2-week run-in period; during this period, blood work was performed, and plasma glucose levels were frequently monitored; after that, patients were randomized to a 6-week titration period followed by a 12-week maintenance period. At the end of the treatment period, the same blood work was repeated. In the 10 patients randomized to it, the biguanide metformin was started at a minimum dose of 500 mg daily and then titrated up to 2000 mg daily; in the 10 patients randomized to it, the peroxisome proliferator-activated receptor (PPAR)-γ agonist pioglitazone was started at a minimum dose of 15 mg daily and then titrated up to 45 mg daily. The effects of treatment on the outcome variables were calculated based on the comparison of measurements taken during the run-in and at the end of active treatment.
Statistical analyses
Group comparisons were performed by one-way and two-way ANOVA, as appropriate; the Holm–Sidak test was used for post-hoc comparisons when needed. Within-group comparisons were performed by paired t-test. Univariate and multivariate analyses of association were tested by use of standard linear regression analysis and multiple backward stepwise linear regression on variables with significant results at the univariate regression. When data were not normally distributed, nonparametric tests were applied or data were analyzed after rank transformation. All calculated probability values are two-tailed, and p < 0.05 was considered statistically significant. All group data are reported as mean ± standard error of the mean (SEM).
Results
The baseline anthropometric, hemodynamic, and biochemical characteristics of the participants are reported in Table 1. All obese patients had a measure of waist circumference above the ATPIII criteria for central obesity, 14 hence indicating the presence of visceral adiposity.
Clinical characteristics of the study population.
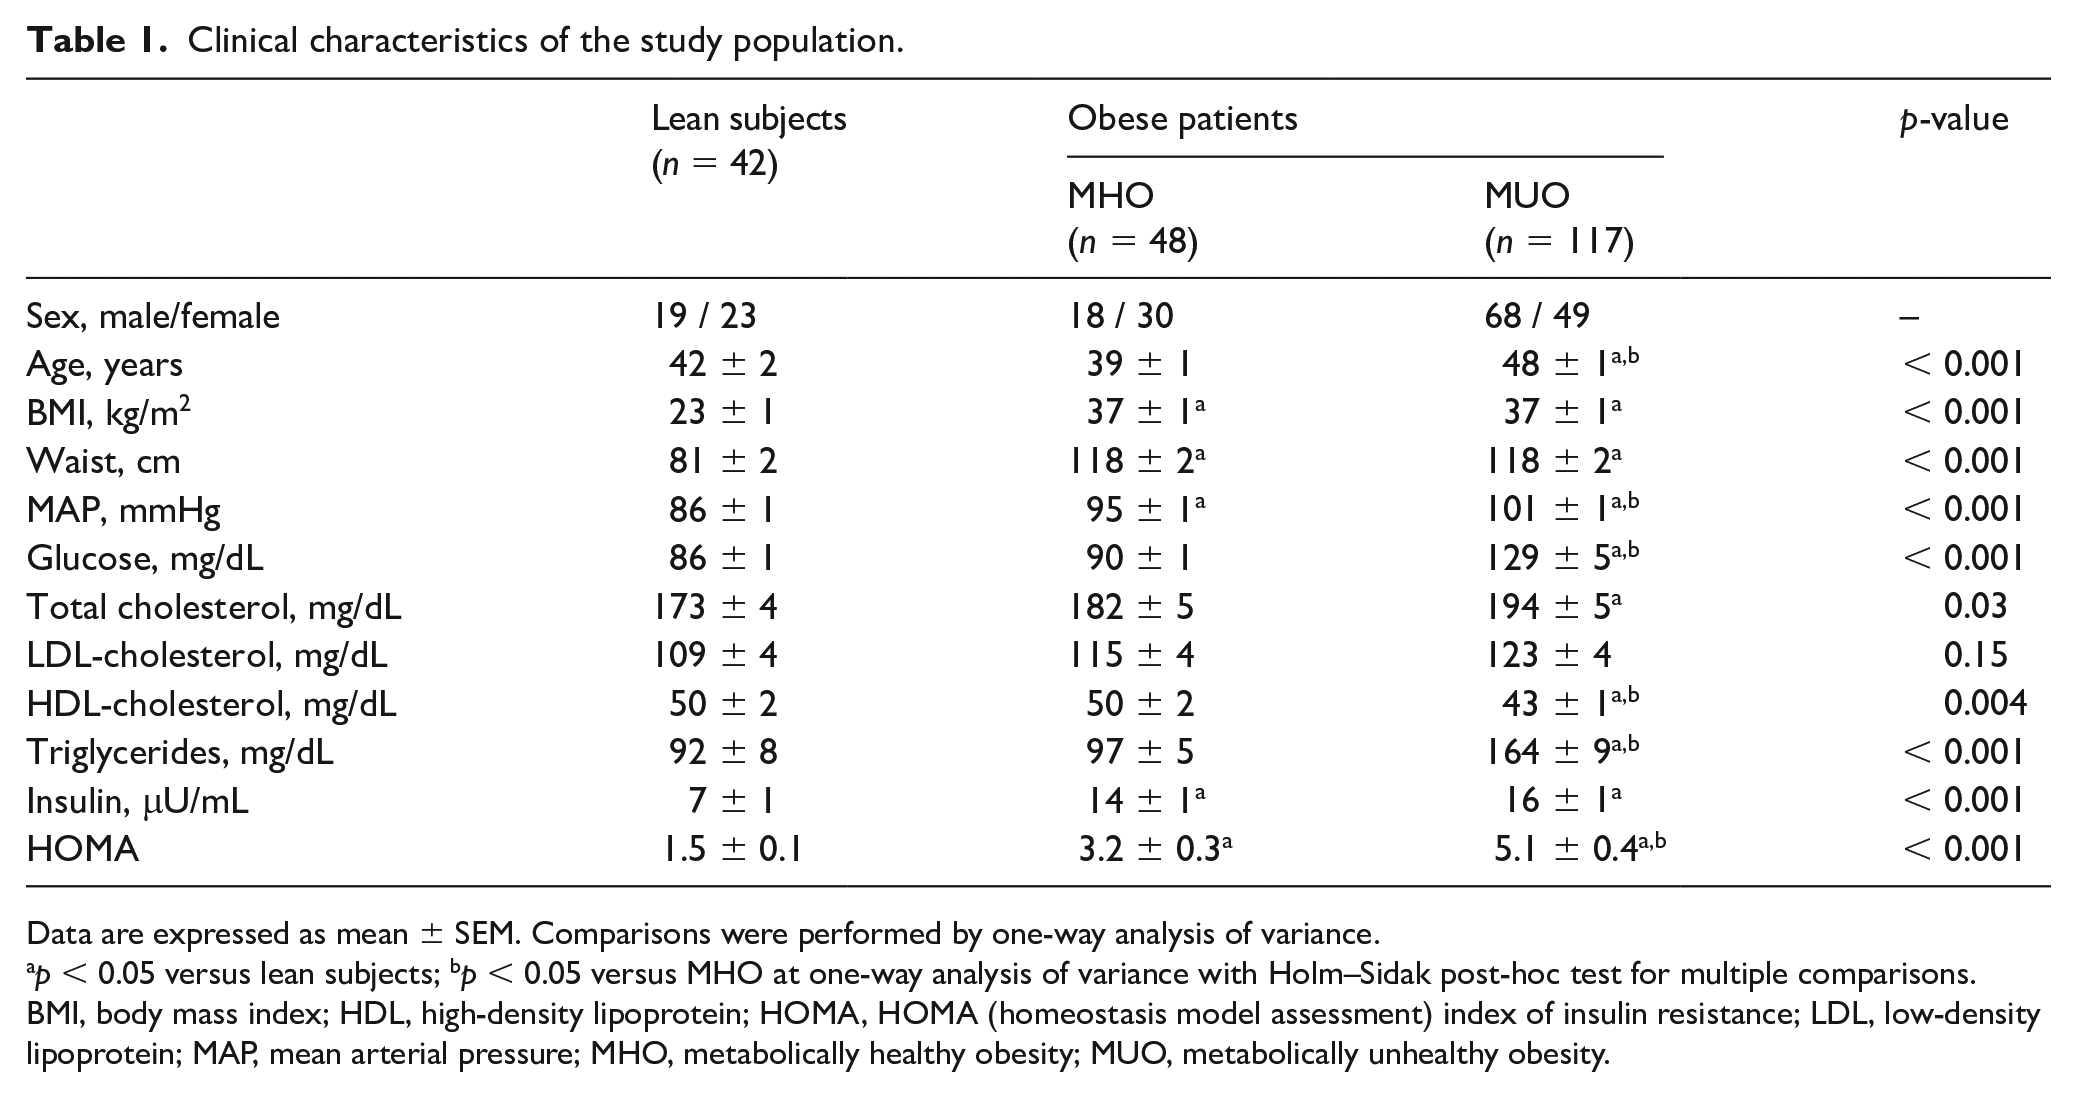
Data are expressed as mean ± SEM. Comparisons were performed by one-way analysis of variance.
p < 0.05 versus lean subjects; bp < 0.05 versus MHO at one-way analysis of variance with Holm–Sidak post-hoc test for multiple comparisons.
BMI, body mass index; HDL, high-density lipoprotein; HOMA, HOMA (homeostasis model assessment) index of insulin resistance; LDL, low-density lipoprotein; MAP, mean arterial pressure; MHO, metabolically healthy obesity; MUO, metabolically unhealthy obesity.
Group differences in circulating LCN2 and RBP4
In comparison to lean subjects, circulating levels of LCN2 were elevated in both MHO and MUO patients; in patients with MUO, however, serum LCN2 was higher than in those with MHO (Figure 1, left panel). When data of nondiabetic (n = 86) and diabetic (n = 31) patients in the MUO group were analyzed separately, circulating LCN2 was significantly higher in diabetic (59.6 ± 2,7 ng/mL) than in nondiabetic (36.2 ± 0.7 ng/mL) individuals (p < 0.001), whereas no significant difference was observed between nondiabetic MUO and MHO individuals (p > 0.05). In contrast with the LCN2 results, circulating levels of RBP4 were not significantly different in the three groups (Figure 1, right panel).
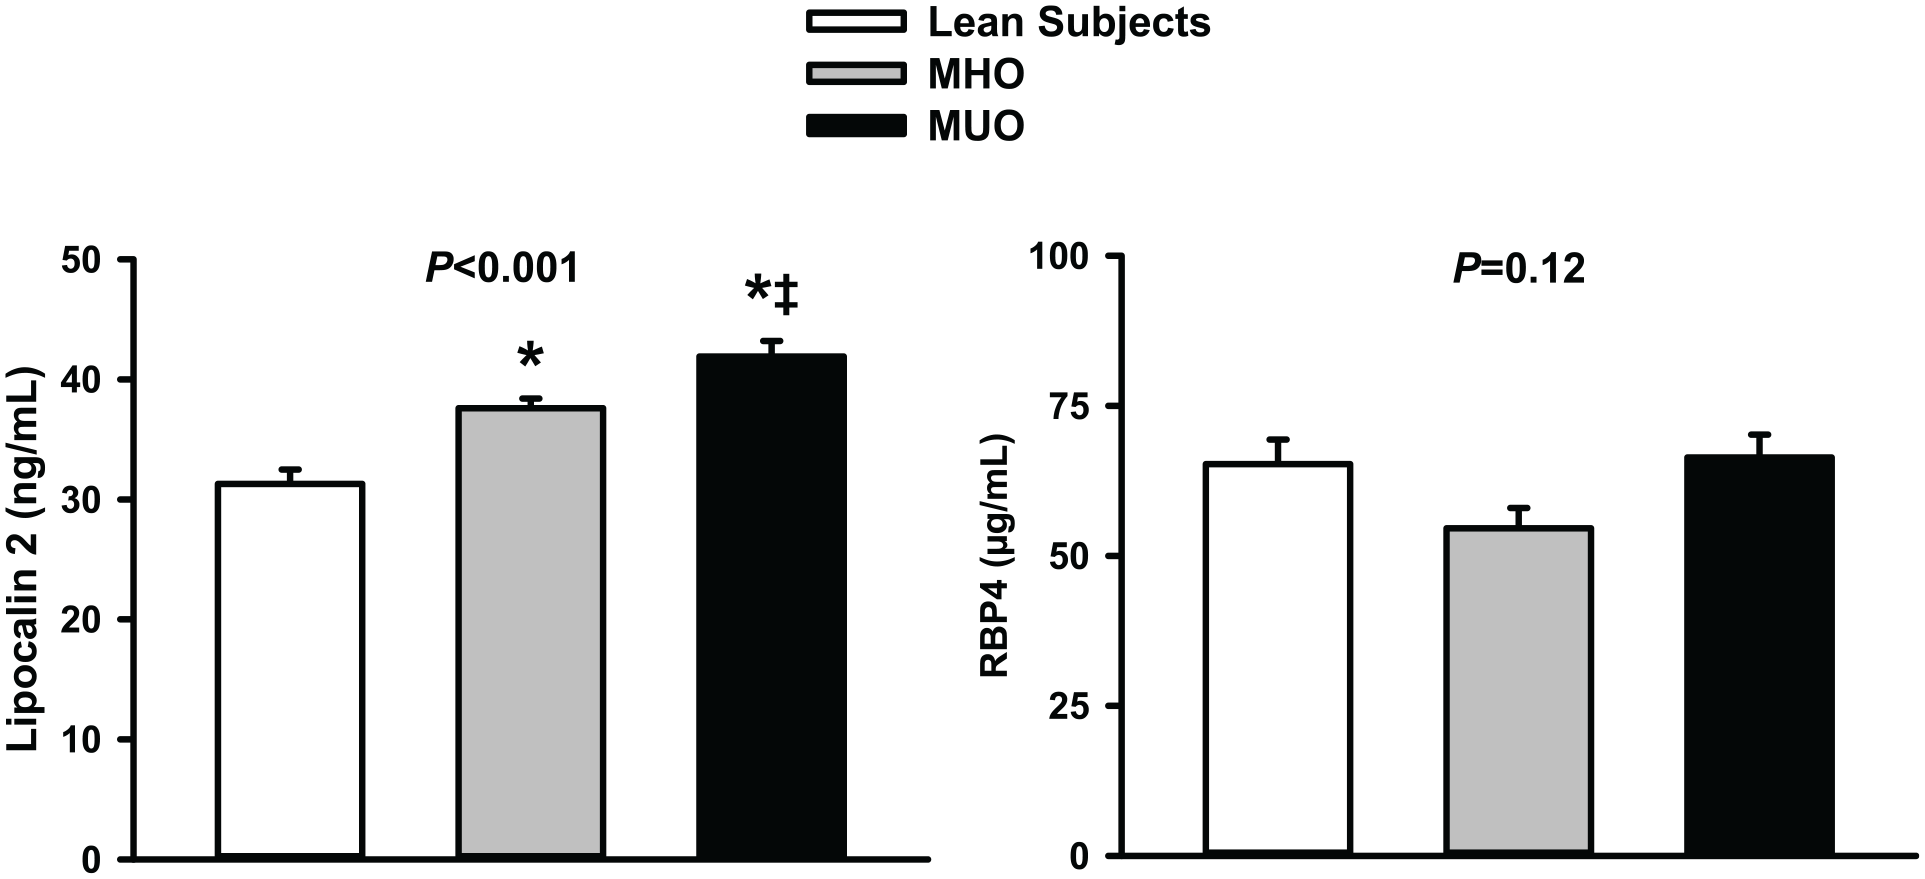
Graphs showing plasma concentrations of lipocalin-2 (left panel) and retinol-binding protein 4 (RBP4) (right panel) in lean subjects, patients with metabolically healthy obesity (MHO), and patients with metabolically unhealthy obesity (MUO).
Group differences in vasodilator reactivity
Assessment of the vascular response to ACh was obtained in 125 study participants (20 lean subjects, 24 patients with MHO, 81 patients with MUO); assessment of the vascular response to SNP was obtained in 99 study participants (19 lean subjects, 16 patients with MHO, 64 patients with MUO). Infusion of graded doses of ACh or SNP resulted in a progressive vasodilator response in all groups (all p < 0.001 vs baseline). The vasodilator reactivity to ACh, however, was significantly reduced in the two obese subgroups (MHO and MUO) compared to lean subjects, with no difference between MHO and MUO (Figure 2, left panel). Similar to the ACh results, the vasodilator response to SNP was reduced in the two obese subgroups (MHO and MUO) compared to lean participants, but no difference was observed between MHO and MUO (Figure 2, right panel).
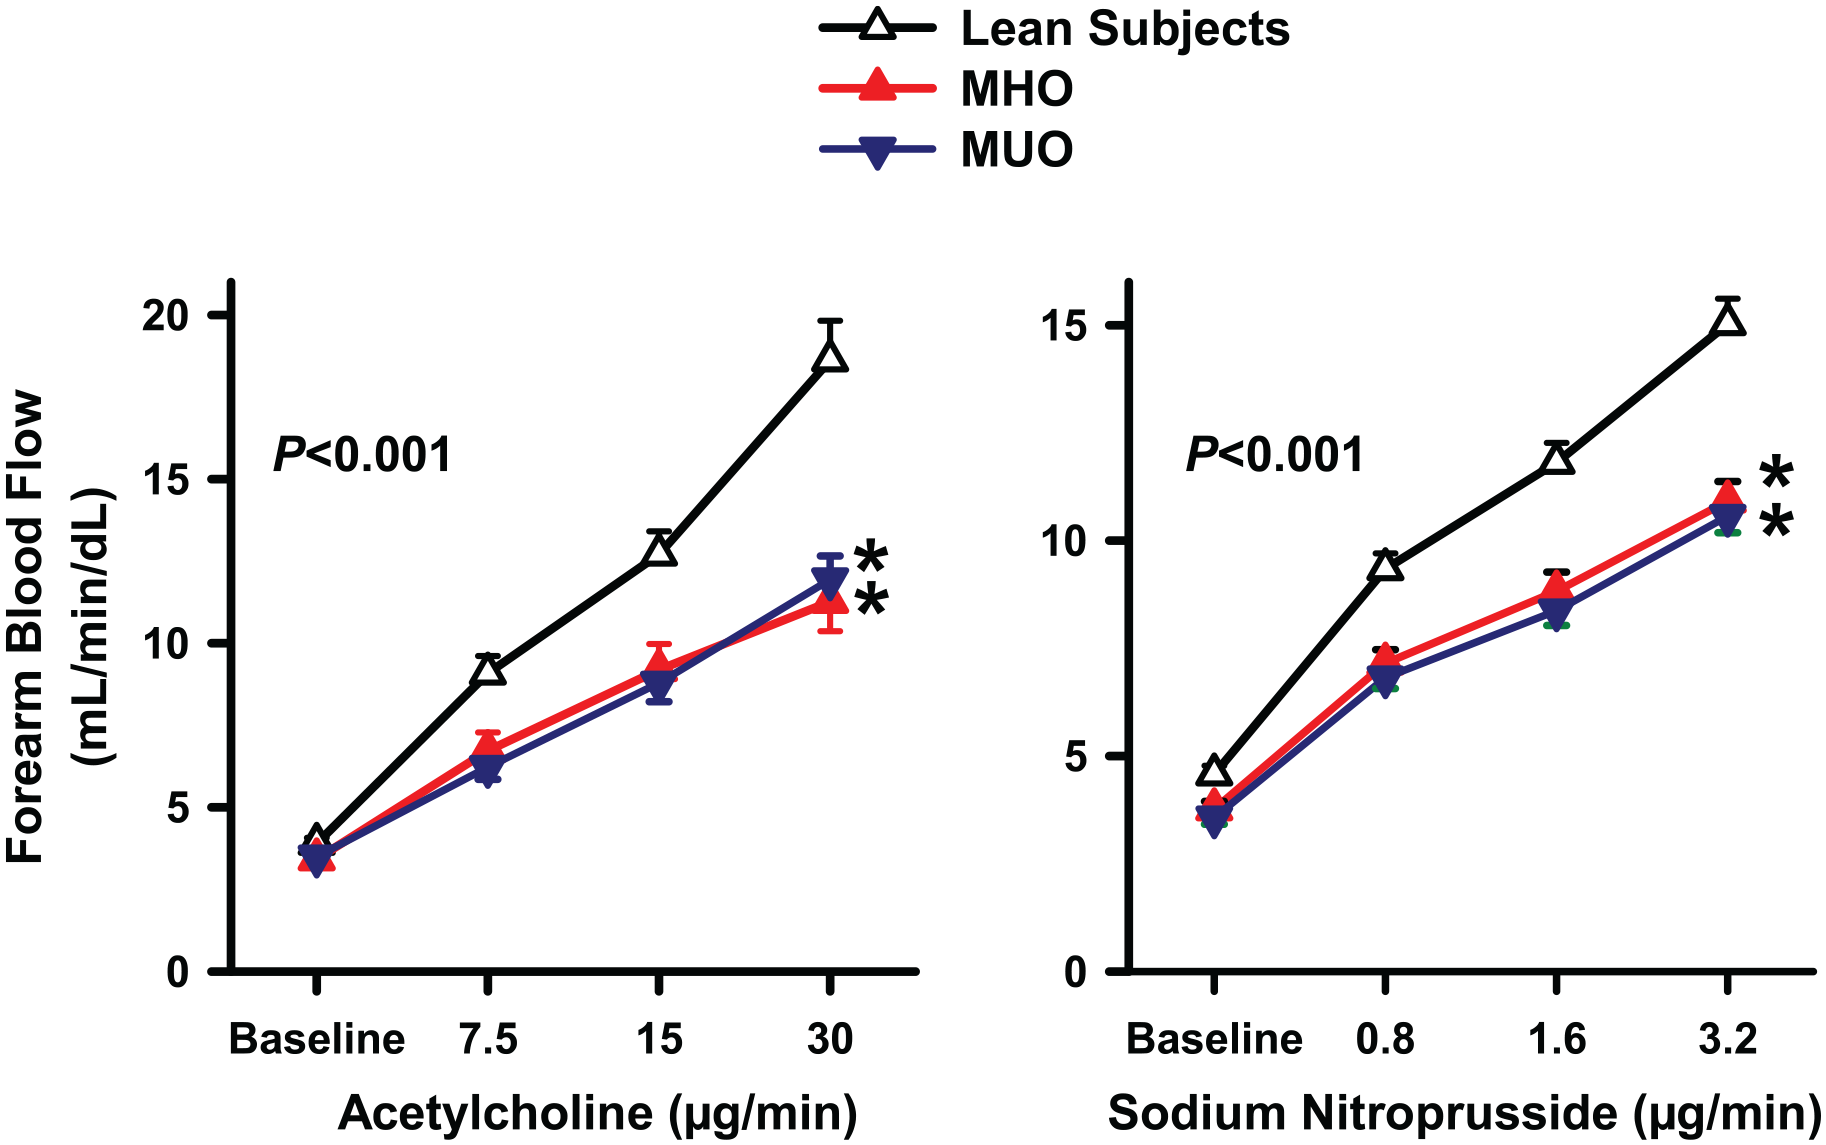
Graphs showing the forearm blood flow responses to acetylcholine (left panel) and sodium nitroprusside (right panel) in lean subjects, patients with metabolically healthy obesity (MHO), and patients with metabolically unhealthy obesity (MUO).
Relationships of circulating LCN2 and RBP4
In the whole population, circulating LCN2 had a linear, direct association with age (R = 0.23, p = 0.005), BMI (R = 0.17, p = 0.03), mean arterial pressure (R = 0.24, p = 0.004), plasma concentrations of insulin (R = 0.27, p < 0.001; Figure 3, left panel), and glucose (R = 0.31, p < 0.001; Figure 3, right panel), whereas it had an inverse, linear relationship with plasma HDL cholesterol (R = 0.15, p = 0.04); no significant association of circulating LCN2, by contrast, was observed with sex, plasma levels of triglycerides, and HDL-cholesterol (all p > 0.05). In a multivariate regression model including the variables with a significant linear relation with LCN2 at the univariate regression analysis, glucose (p < 0.001) and insulin (p = 0.005) remained associated in linear combination with circulating LCN2 (R = 0.39, p < 0.001). When lean subjects were excluded and linear regression was analyzed in obese patients only, mean arterial pressure (R = 0.42, p < 0.001), plasma glucose (R = 0.30, p > 0.001), and age (R = 0.25, p = 0005) remained significantly associated with circulating LCN2 levels; no significant association, by contrast, was observed between plasma LCN2 and sex, BMI, insulin, HDL- and LDL-cholesterol, and triglycerides (all p > 0.05).
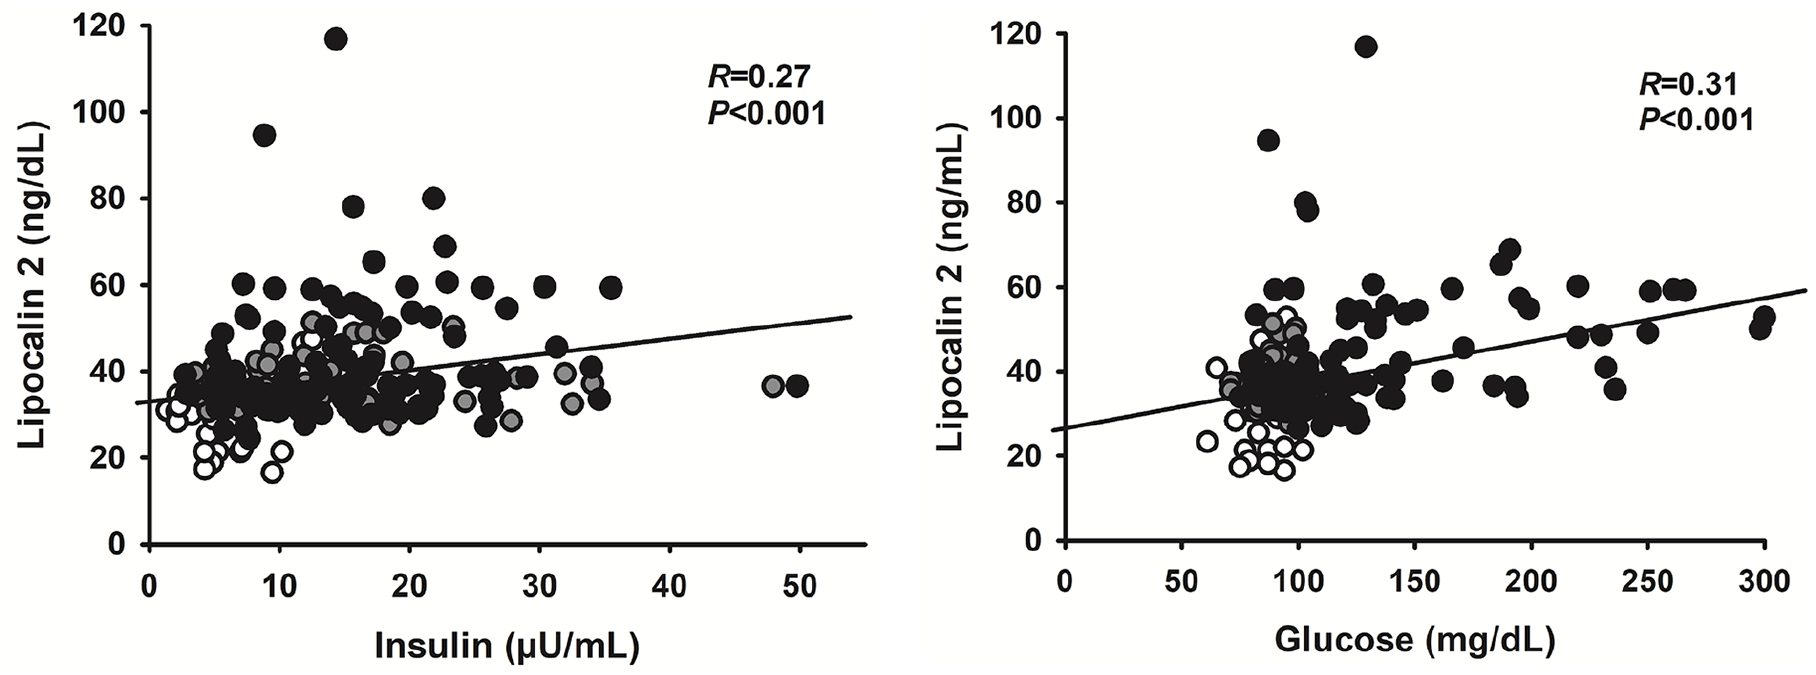
Graphs showing the linear relationships in the whole population of circulating lipocalin-2 with plasma insulin (left panel) and glucose (right panel). At the multivariate regression analysis, insulin and glucose remained the only variables bearing a significant linear association with circulating lipocalin-2.
Circulating levels of RBP4 had a linear, inverse relationship with BMI (R = 0.26, p < 0.001). In contrast, no significant association was observed between RBP4 and all the other variables tested (all p > 0.05). No relationship was observed between plasma levels of LCN2 and RBP4 (R = 0.08, p = 0.28).
In the whole population of participants in the vascular studies, serum levels of LCN2 showed an inverse linear relationship with the vasodilator response to ACh (Figure 4, left panel); similarly, an inverse linear relationship was observed between serum levels of LCN2 and the vasodilator response to SNP (Figure 4, right panel). No significant relationship, by contrast, was observed between serum levels of RBP4 and the vasodilator response to either ACh (R = 0.07, p = 0.46) or SNP (R = 0.08, p = 0.45). In a backward stepwise regression model including age, sex, BMI, mean arterial pressure, insulin, glucose, HDL-cholesterol, triglycerides, and circulating LCN2 as independent variables and forearm flow at the highest dose of ACh as a dependent variable, LCN2 remained the only variable independently associated with the vasodilator response to ACh (R = 0.28, p = 0.004). Likewise, in the regression model including the independent variables as above and forearm flow at the highest dose of SNP as a dependent variable, LCN2 remained the variable with the strongest association with the response to SNP (R = 0.49, p = 0.004), with plasma glucose maintaining a weaker, independent association (p = 0.02).
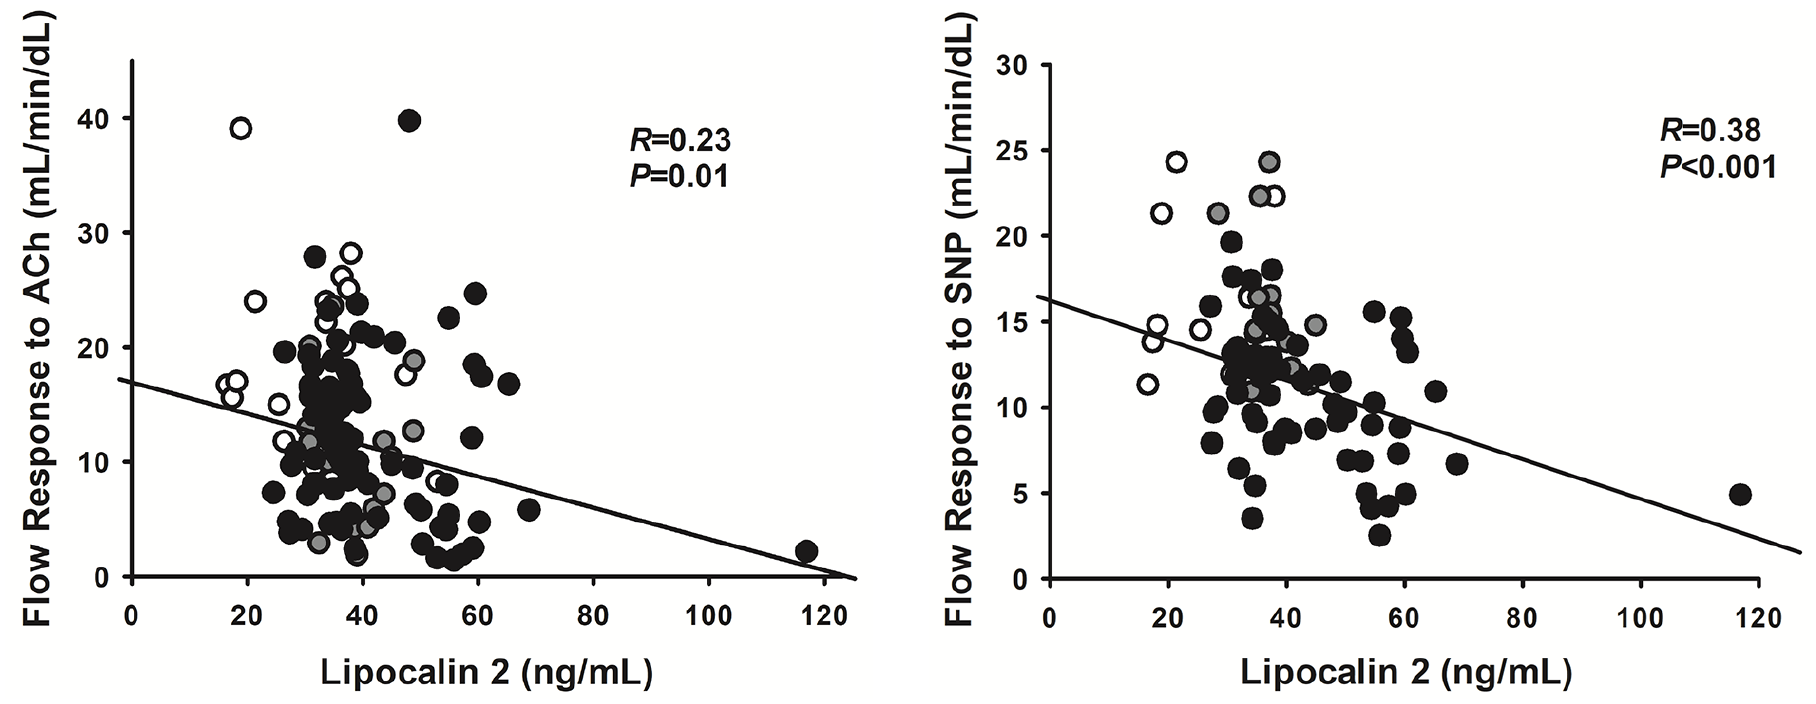
Graphs showing the linear relationships in the whole population of the forearm blood flow responses to the highest dose of acetylcholine (ACh) (left panel) or sodium nitroprusside (SNP) (right panel) with circulating lipocalin-2.
Effects of antidiabetic treatments in patients with T2D
As reported in Table 2, in patients with T2D participating in the intervention study, treatment with metformin resulted in a significant decrease in plasma glucose levels, with no significant change, however, in plasma levels of insulin, CRP, LCN2, or RBP4; similarly, no significant change in the vasodilator response to either ACh or SNP was observed following administration of metformin. Similar to the metformin results, treatment with pioglitazone resulted in a significant decrease in plasma glucose levels, with no significant change, however, in plasma levels of insulin, CRP, LCN2, or RBP4; similarly, no significant change in the vasodilator response to either ACh or SNP was observed following administration of pioglitazone. No adverse events were observed in patients participating in the intervention study.
Effects of antidiabetic treatment with metformin or pioglitazone on selected variables in patients with metabolically unhealthy obesity with type 2 diabetes.
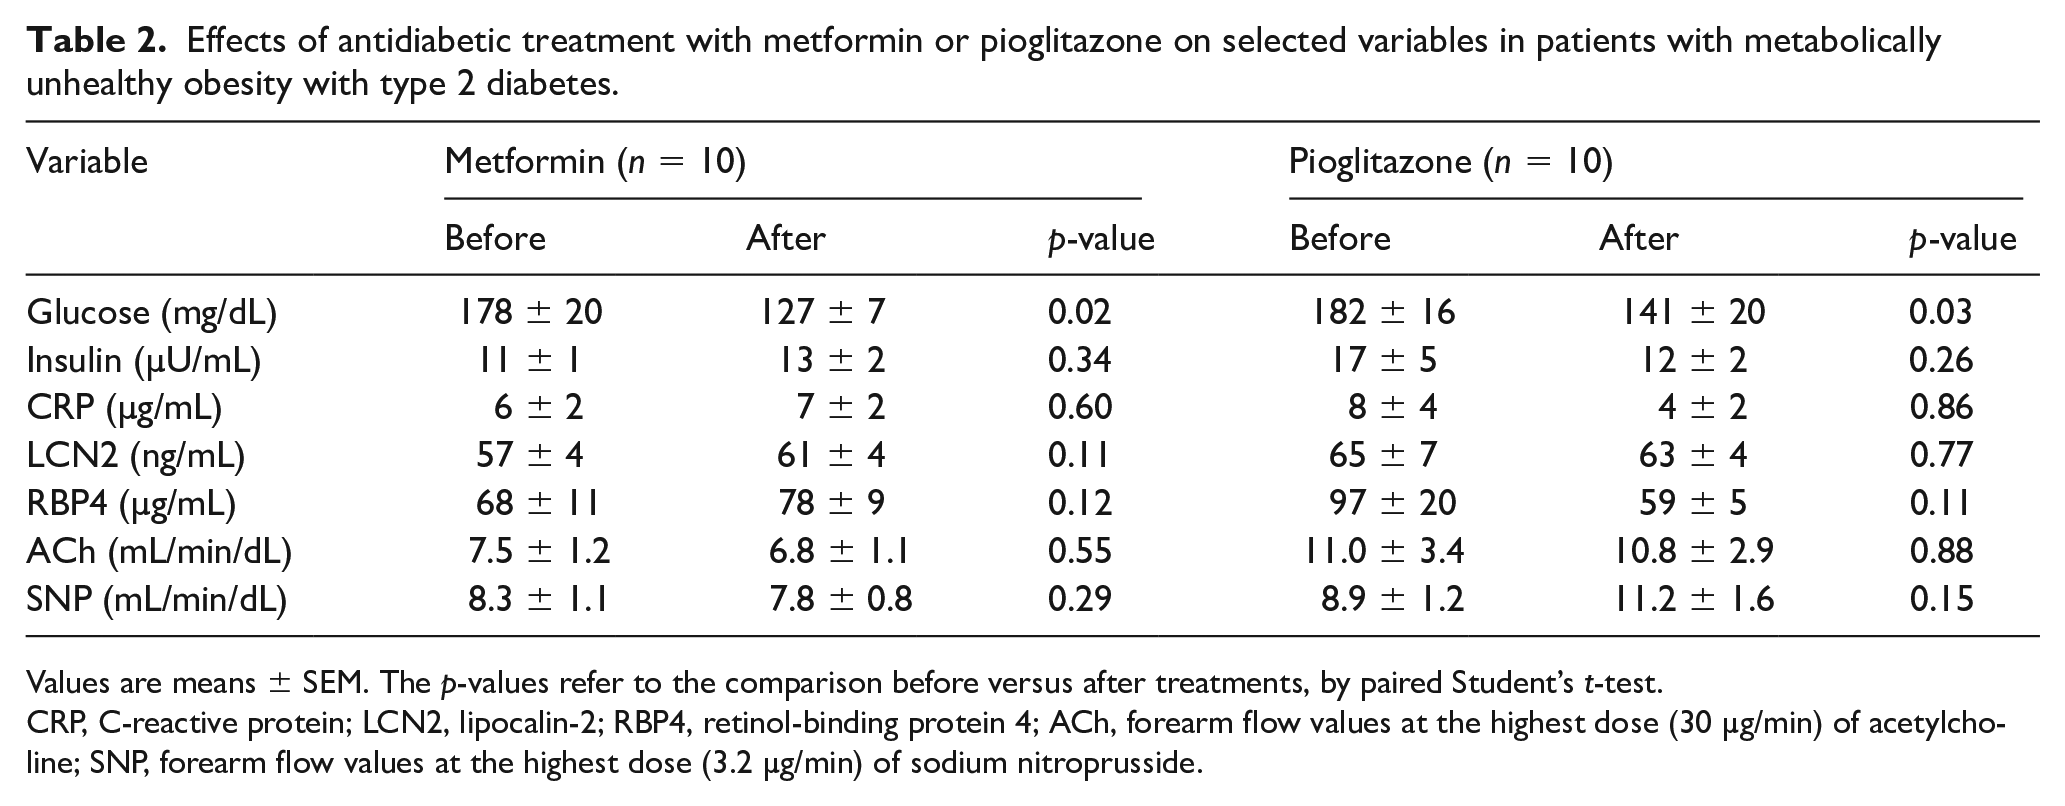
Values are means ± SEM. The p-values refer to the comparison before versus after treatments, by paired Student’s t-test.
CRP, C-reactive protein; LCN2, lipocalin-2; RBP4, retinol-binding protein 4; ACh, forearm flow values at the highest dose (30 µg/min) of acetylcholine; SNP, forearm flow values at the highest dose (3.2 µg/min) of sodium nitroprusside.
Discussion
In the present study, circulating levels of LCN2 were higher in obese subjects than in lean controls. Importantly, among individuals with MUO, circulating levels of LCN2 were higher in those with, than in those without T2D. In addition, in the multiple regression analysis, glucose and insulin were the only variables independently associated with circulating LCN2. Taken together, these findings suggest that, beyond obesity per se, the presence of metabolic abnormalities, in particular hyperglycemia, is associated with further dysregulation in the expression of LCN2. Previous studies have reported increased circulating levels of LCN2 in obesity and type 2 diabetes,5,18 albeit not universally. 19 The likely role of hyperinsulinemia and hyperglycemia in the increased circulating LCN2 levels observed in insulin-resistant states is supported by the results of a well-designed study by Tan et al., who showed that prolonged insulin-glucose infusion in humans results in increased concentrations of LCN2, both in the circulation and in omental adipose tissue explants. 20 Additional factors, however, might contribute to this phenomenon, such as up-regulation of LCN2 production in obese adipocytes by glycated end-products, 21 metabolic stress, and inflammatory cytokines. 22 Conversely, increased levels of LCN2 in adipose tissue may mechanistically influence insulin resistance and hyperglycemia in humans by interfering with intracellular insulin signaling. 23 Furthermore, experiments in animal models with loss- or gain-of-function of LCN2 have demonstrated that up-regulation of LCN2 may act as a compensatory mechanism to counteract obesity-induced glucose intolerance by inhibition of food intake and promotion of β-cell proliferation. 24
In contrast to LCN2, circulating levels of RBP4 were similar in lean and obese individuals. This argues against a significant dysregulation of this adipokine in subjects with increased adiposity, irrespective of their metabolic status. This finding is at odds with those of an earlier investigation that reported increased plasma levels of RBP4 in human obesity. 7 However, in keeping with our results, other studies found no difference in circulating RBP4 levels between obese and lean individuals.10,25,26 Of note, in our study, plasma levels of RBP4 had an inverse linear association with BMI. This finding is at odds with those reported by other investigations,6,7 but in line with the observations made by Kanaka-Gantenbein et al. in obese children and adolescents. 27 The precise reasons for these discrepancies are unclear, but differences in the demographic characteristics of study populations, methodology of RBP4 level measurements, and kidney function may be at play. 26 Of note, recent discoveries have substantially questioned the contribution of adipose tissue-derived RBP4 to its circulating levels, reporting that they depend almost exclusively on its production by hepatocytes. 28 Furthermore, previous observations that high circulating RBP4 in humans is associated with elevated liver adiposity, but not with total, subcutaneous or intramyocellular fat 29 indicate that RBP4 should be considered a hepatokine, rather than an adipokine.
The main novel finding of our study is the relationship between circulating concentrations of LCN2 and obesity-associated impairment in vasodilator reactivity to both endogenous and exogenous NO-dependent vasodilators. Compared to lean subjects, decreased vasodilator responsiveness to ACh and SNP were indeed observed in both obese subgroups, without differences between MHO and MUO. This observation is in line with previous data indicating that obesity may be associated not only with endothelial dysfunction, but also with impaired smooth muscle responsiveness to NO. 30 The linear, inverse relationship observed in our study between circulating LCN2 and the vasodilator responses to ACh and SNP supports the notion that elevation of LCN2 might play a deterministic role in the vasodilator dysfunction associated with human obesity. This concept is further strengthened by the results of our multivariate regression analysis, showing that LCN2 is the only, or the strongest, variable associated with the vasodilator responses to ACh and SNP, respectively. In this regard, our study expands previous observations in animal models, demonstrating that LCN2 deficiency prevents endothelial dysfunction secondary to diet-induced obesity 31 and that up-regulation of LCN2 in the circulation and in the arterial wall may elicit endothelial dysfunction. 32 Possible mechanisms underlying LCN2-induced endothelial dysfunction involve vascular inflammation induced by deamination of LCN2 by fatty acids 31 or uncoupling of endothelial NO synthase combined with increased expression of cyclo-oxygenase. 32 Finally, because elevated circulating LCN2 is associated with hypertension in both experimental animals 32 and humans, 33 a possible role of high blood pressure in influencing vascular dysfunction cannot be ruled out.
In the patients with diabetes participating in our intervention study, treatment with an oral antidiabetic drug (either metformin or pioglitazone) was associated with a significant reduction in plasma glucose, but did not result in any relevant change in circulating LCN2 or RBP4. Likewise, antidiabetic treatment did not produce significant changes in the vasodilator responsiveness to endogenous or exogenous NO in these patients. Our results are at odds with those of Eilenberg et al., who have reported that treatment with metformin is able to reduce the elevated serum levels of LCN2 in patients with T2D. 34 Also, experimental studies have demonstrated that PPAR-γ agonism with thiazolidinediones results in a reduced expression of Lcn2 in fat cells. 18 In addition, Yang et al. have reported that treatment with rosiglitazone decreases the elevated serum levels of RBP4 in insulin-resistant patients. 6 Takebayashi et al., however, have observed in diabetic patients with various degrees of complications that addition of pioglitazone to other antidiabetic medications does not affect plasma levels of RBP4. 35 The precise reasons for these discrepancies are unknown, but a number of potential factors might be involved, including the length of treatment, the doses of drugs, the duration of disease, and the preexistence of disease-related complications.
Study limitations
Owing to its cross-sectional design, our study does not allow deterministic insights on the cause or effect relationship of LCN2 with hyperinsulinemia and hyperglycemia to be obtained. Also, given the small number of diabetic patients included, our intervention trial might have had insufficient power to detect treatment-induced changes in the outcome variables. Finally, because our study was performed in the intact human circulation, there are some limitations inherent with its methodology: (1) inability to fully blind the study personnel assessing vascular reactivity; (2) difficulties in cannulating the brachial artery or catheter dislocation in severely obese individuals, resulting in reduced recruitment in vascular reactivity studies and differences in the number of patients completing the ACh and SNP protocols; and (3) inability to ascertain the precise molecular mechanisms underlying the blunted vasodilator responsiveness to NO-dependent vasodilators in the context of elevated LCN2 seen in obese individuals. In spite of these limitations, however, our results suggest the possibility that LCN2 may be a biomarker for risk stratification in human obesity, along with previous demonstrations of the ability of circulating LCN2 to independently predict incident cardiovascular events after adjusting for traditional risk factors, 36 as well as hospitalization and death from cardiac disease. 37
Conclusion
Our study indicates that circulating levels of LCN2 are elevated in obese patients, especially in those with metabolic complications, and are negatively related to measures of vascular dysfunction. Selective targeting of LCN2, therefore, might represent a promising strategy for cardiometabolic prevention in these patients.
Footnotes
Data availability
The data that support the findings of this study are available from the corresponding author upon reasonable request.
Declaration of conflicting interests
The authors declared no potential conflicts of interest with respect to the research, authorship, and/or publication of this article.
Funding
This work was partially supported by a ‘Beyond Borders 2019’ grant from the Università Tor Vergata to Manfredi Tesauro and by Fondi d’Ateneo grants from the Università Cattolica del Sacro Cuore to Carmine Cardillo. None of the funders had any role in the study design or in the manuscript preparation.