
Abstract
Introduction:
This study aims to evaluate changes in the arterial spectral Doppler waveform in a canine artery stenosis model.
Methods:
Canine femoral artery stenosis models were established in 12 beagle dogs. Doppler waveforms were recorded in the femoral artery preoperatively and postoperatively in the femoral artery and at the ankle after formation of a 50%, 70%, and 90% stenosis or occlusion. Major descriptors for arterial Doppler waveform were used to analyse waveforms.
Results:
The proportion of multiphasic waveforms proximal to a moderate stenosis decreased compared to normal baseline, although the difference was not statistically significant, whereas the decreases at the stenosis, distal to the stenosis, and at the ankle were significant (p < 0.05). The decreases in arteries with a more severe stenosis or occlusion were significant at all locations (p < 0.05). The proportion of high resistive waveforms decreased significantly at the ankle in the arteries with a moderate stenosis (50%) (p = 0.002), but the decreases proximal to, at, and distal to the stenosis were not significant. The decreases were significant at all locations in the arteries with a more severe stenosis (p < 0.05). The decrease was significant at the ankle in the arteries with an occlusion (p < 0.001) but not significant pre, at, and post an occlusion.
Conclusions:
Phasicity and resistance of Doppler waveforms alter in canine femoral arteries with a stenosis. Phasicity change seems more sensitive in response to an arterial stenosis than resistance change. Additional information on arterial resistance could be obtained using end-diastolic ratios, resistive indices, and potentially end-systolic notch velocity measurements.
Keywords
Introduction
Arterial spectral Doppler waveform analysis is an essential part of the noninvasive assessment of peripheral vascular disease1,2 and is recommended to be used by several international guidelines.3–5 It has been used as a stand-alone tool and as a part of arterial duplex ultrasound scanning to evaluate arterial occlusive disease in various parts of the human body for decades.6–11 However, waveform descriptors used in published literature were not standardized 12 and a lack of consistency in waveform description has been observed in surveys.13–15 Recent publication of a consensus statement from the Society for Vascular Medicine (SVM) and Society for Vascular Ultrasound (SVU) for interpretation of peripheral arterial and venous Doppler waveforms 16 has provided an opportunity to standardize Doppler waveform description and improve communication among professionals.
Peripheral arterial Doppler waveform changes are seen in some physiological conditions such as after exercise and increases in limb temperature, as well as in pathological conditions including the presence of proximal and/or distal arterial stenosis/occlusion.17,18
The aim of this study is to evaluate changes in arterial spectral Doppler waveforms in a canine femoral artery focal stenosis model using major descriptors for arterial spectral Doppler waveforms recommended by the SVM and SVU consensus statement.
Methods
The experiment study was performed between April 2020 and July 2020. The animal study was reviewed and approved by the Experimental Animal Welfare and Ethics Committee of the PLA General Hospital.
Establishment of canine femoral artery stenosis model
The canine femoral artery stenosis model creation has been described in our previous report. 19 Twelve beagle dogs aged 12–24 months were purchased from the Animal Experiment Centre of Nongnong (Beijing) Biotechnology Co. Ltd (Beijing, China). Preoperative duplex ultrasound scanning was performed to confirm that internal diameters of the canine femoral arteries were 3.0 ± 0.1 mm. The pulsed wave Doppler waveform of the femoral artery was recorded as a baseline.
Ameroid constrictors with inner diameters of 2.5 mm and length of 4.5 mm (Research Instruments SW, Escondido, CA, USA) were used to create canine femoral artery stenosis. An ameroid constrictor has an inner ring of casein that is surrounded by a stainless-steel sheath. Casein is a hygroscopic material that swells as it slowly absorbs body fluid and the stainless-steel sheath forces the casein to swell inwardly. This results in the internal diameter of the constrictor decreasing gradually over a few weeks.
Under general anaesthesia, the right canine femoral artery in the groin was dissected and applied with 3 mL lidocaine-papaverine solution (50 mg / 2.5 mL lidocaine and 15 mg / 0.5 mL papaverine) to prevent vasospasm. An ameroid constrictor ring was then placed over the artery (Figure 1).
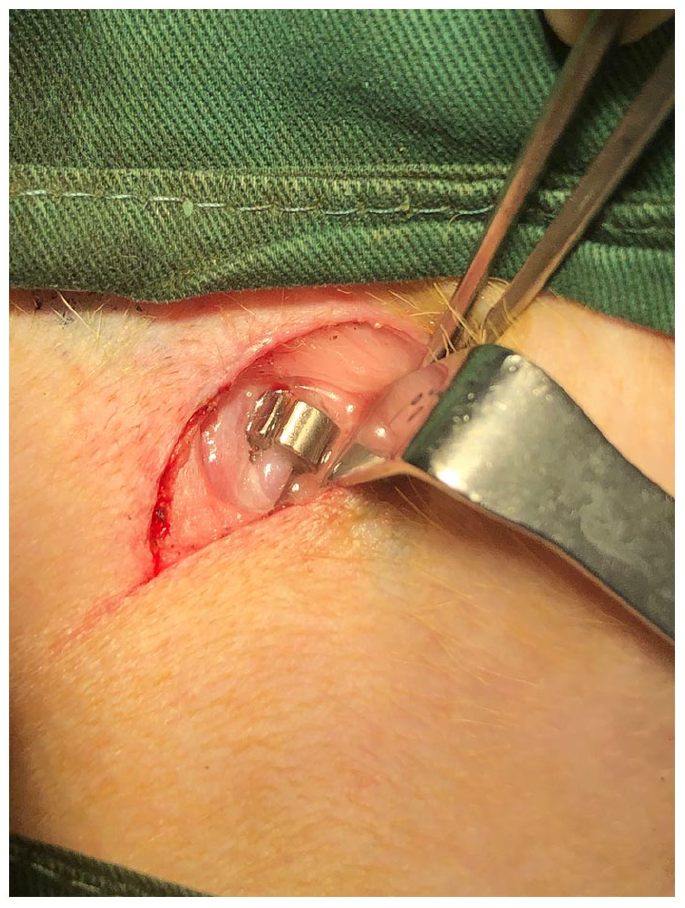
An ameroid constrictor ring around the canine femoral artery.
An arterial duplex ultrasound scan was performed 4–5 hours after the surgery to exclude femoral artery spasm. Spectral Doppler waveforms were recorded in the femoral artery 1 cm proximal to the stenosis (1 cm proximal to the upper end of the ameroid constrictor ring), at the stenosis (the lower end of the ameroid constrictor ring where the highest peak systolic velocity [PSV] was detected), 1 cm distal to the stenosis (1 cm distal to the lower end of the ameroid constrictor ring), and at the ankle. A selective right femoral artery angiogram was then performed with two perpendicular projections via left femoral artery catheterization using the OEC 9900 Elite mobile C-arm imaging system (GE Healthcare, Salt Lake City, Utah USA). The establishment of the 50% canine femoral artery stenosis using the constrictor ring was confirmed when the angiogram demonstrated 50% stenosis (45–52%). All angiograms were viewed and reported independently by two radiologists.
Postoperative arterial duplex ultrasound scans were repeated at 7–8 days. Diagnostic criterion of 70% stenosis was based on a PSV ratio (PSV at the stenosis / PSV proximal to the stenosis) of 4. 20 Spectral Doppler waveforms were recorded in the femoral artery pre, at, and post the stenosis, and downstream at the ankle. Confirmation of 70% canine femoral artery stenosis was obtained when the right femoral angiogram demonstrated an arterial stenosis of 68–72% at the site of the constrictor ring (Figure 2).
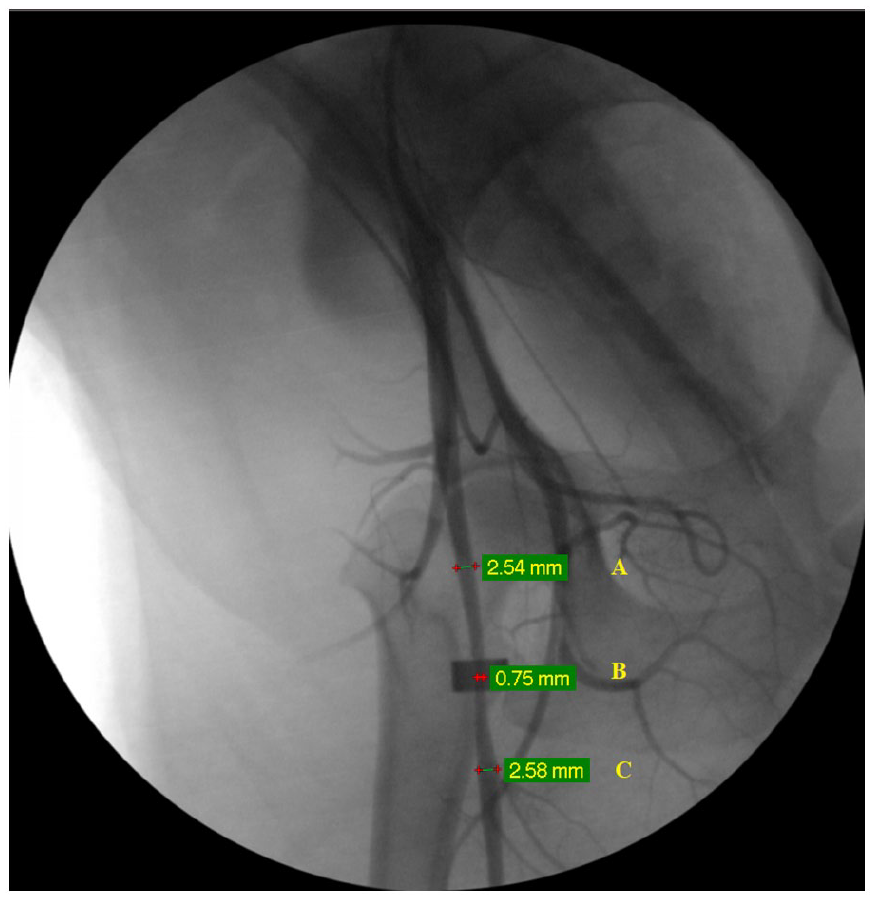
Selective right femoral artery angiogram shows a canine femoral artery stenosis (70%):
A final arterial duplex ultrasound scan was performed at 21–35 days after the operation. The canine femoral artery stenosis progressed to either more severe stenosis or occlusion. Spectral Doppler waveforms were obtained in the femoral artery 1 cm proximal to the stenosis/occlusion, at the stenosis/occlusion, 1 cm distal to the stenosis/occlusion, and at the ankle. A selective femoral angiogram was also performed in 11 of the 12 cases. The canine femoral artery segment including the site of the ameroid constrictor ring was excised in all 12 cases. They were sent to the pathology department for histological examination after removal of the ameroid ring constrictor from the artery.
Arterial spectral Doppler waveform analysis
All ultrasound assessments were performed with either the Mindray Resona 7 ultrasound system (Shenzhen Mindray Bio-Medical Electronics Co., Ltd., Shenzhen, China) or the Philips iE33 ultrasound system (Philips Ultrasound, Inc., Bothell, WA, USA). A 3–11 MHz linear array transducer (L11-3U for the Resona 7 or L11-3 for the iE33) was used for the ultrasound examination. All arterial spectral Doppler waveforms were recorded with a Doppler angle of 60° or less and sample volume of 0.5 mm.
Arterial spectral waveforms were analysed and arterial waveform nomenclature major descriptors applied as recommended by the consensus statement from the SVM and SVU. 16 These include flow direction, phasicity, and resistance.
Flow direction – the following terms and definitions were used to describe flow direction:
Antegrade: blood flows in the normal direction for the artery being examined.
Retrograde flow: blood flows opposite to the normal direction for the artery being examined.
Bidirectional: blood flow enters and leaves a contained space via the same orifice.
Absent: no blood flow is detected, with an absent spectral Doppler signal.
Phasicity – the terms multiphasic and monophasic were employed to describe phasicity and their definitions are as follows:
Multiphasic: waveform crosses the zero-flow baseline and contains both forward and reverse velocity components.
Monophasic: waveform does not cross the zero-flow baseline throughout any part of the cardiac cycle; blood flows in a single direction.
Resistance – the terms high resistive, intermediate resistive, and low resistive recommended by the consensus statement were used in this study. 16 The key definition of intermediate resistive in the consensus statement is visible presence of an end-systolic notch (Figure 3).
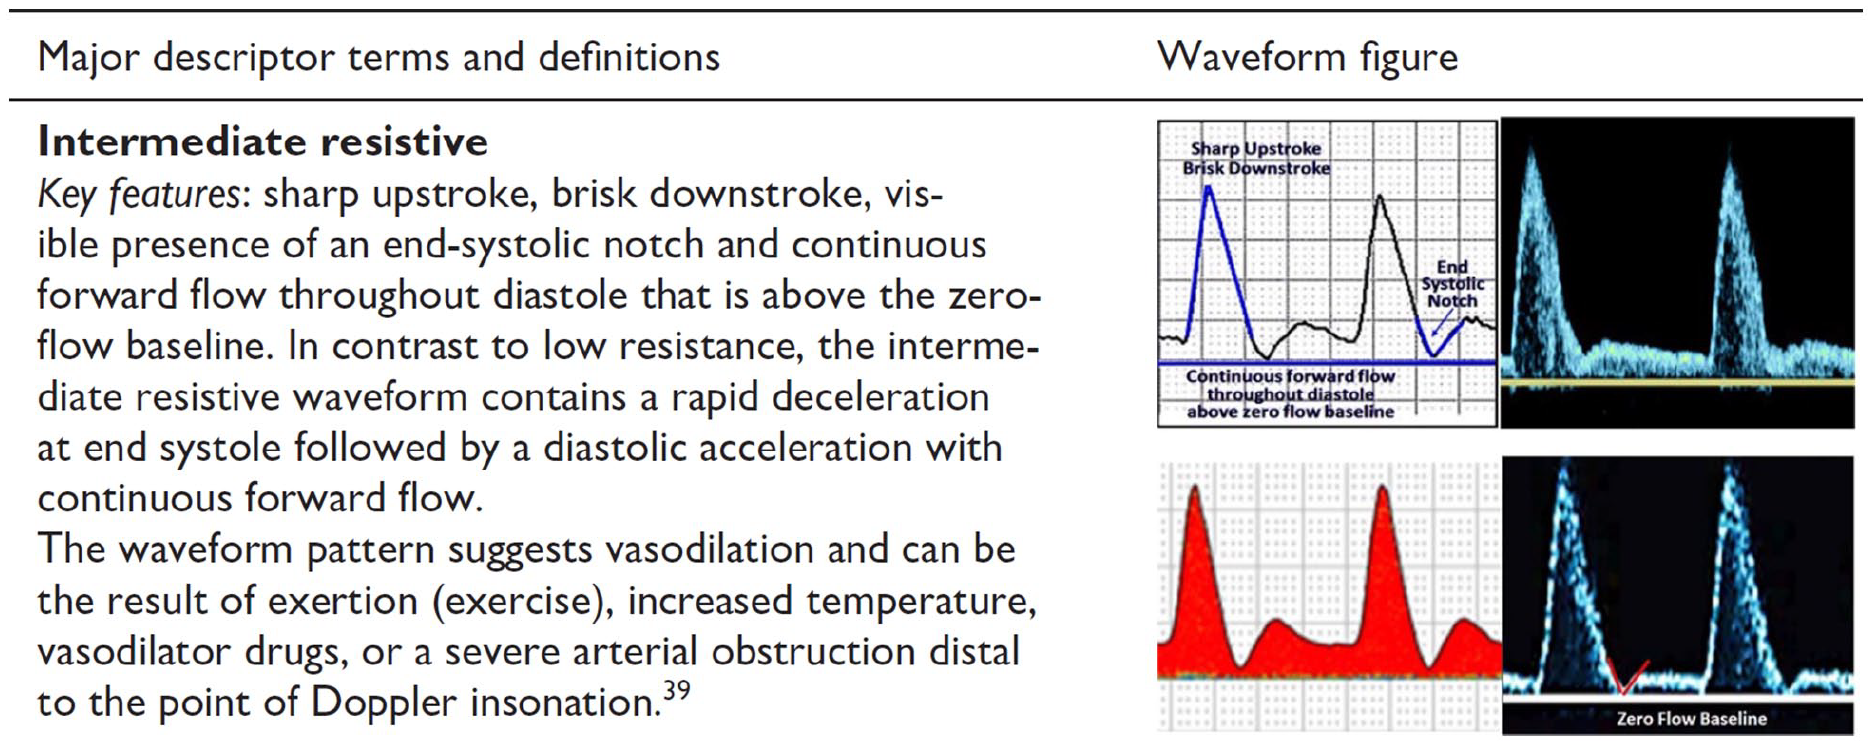
Definition of intermediate resistive arterial Doppler waveform recommended by the Society for Vascular Medicine and the Society for Vascular Ultrasound consensus statement.
Multiple arterial spectral Doppler waveforms with an end-systolic notch were observed in the studied population. There were cases of a combination of multiphasic waveform and monophasic waveform with an end-systolic notch noted at the same location in the same artery (Figure 4-1, and 4-2) which made it difficult to categorize the waveform as high resistive or intermediate resistive. The resistance of the waveform would have been regarded as high resistive if based on multiphasic waveforms (the 3rd waveform in Figure 4-1 and the left five waveforms in Figure 4-2) and intermediate resistive if based on monophasic waveforms with an end-systolic notch (remainders of waveforms in Figure 4-1 and 4-2). Monophasic waveforms with a shallow notch (relatively high notch velocities) were noted in other cases (Figure 4-3 and 4-4) which were more characteristic of a low resistive waveform in our opinion.
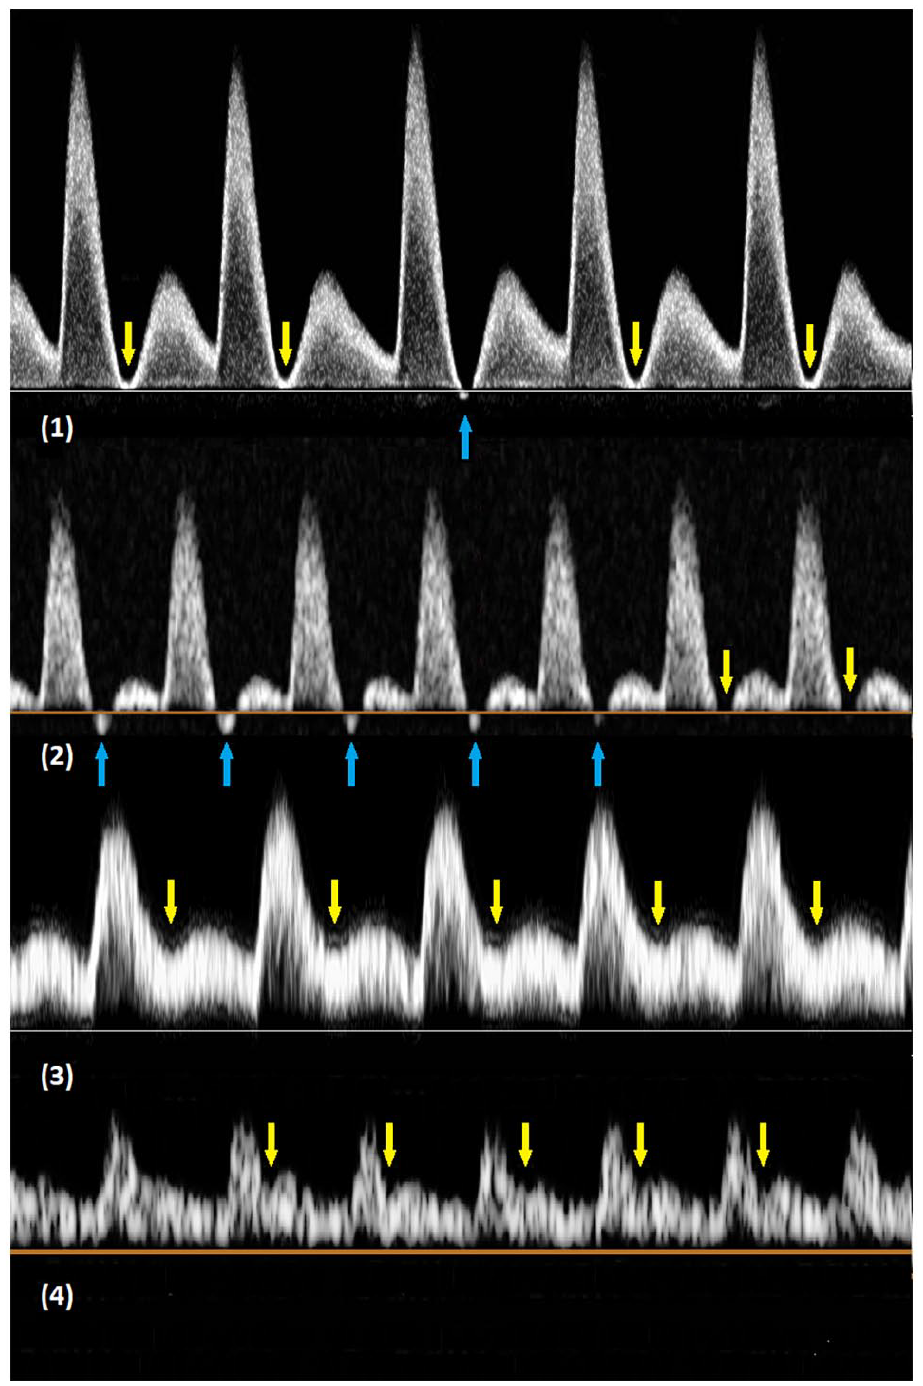
Arterial spectral Doppler waveforms with an end-systolic notch (arrows): (
To make it easier to categorize the arterial Doppler waveform resistance, the following modified definitions were used in this study to define high resistive, intermediate resistive, and low resistive terms:
High resistive: sharp upstroke and brisk downstroke, with or without diastolic flow reversal; when an end-systolic notch is present, the notch velocity is not more than zero (B = 0; Figure 5-1).
Intermediate resistive: sharp upstroke, brisk downstroke, presence of an end-systolic notch with velocity greater than zero but less than one-fourth of PSV (1/4A > B > 0; Figure 5-2) and continuous forward flow throughout diastole that is above the zero-flow baseline.
Low resistive: a prolonged downstroke in late systole and continuous forward flow throughout diastole, when an end-systolic notch is present, the notch velocity greater than one-fourth of PSV (B > 1/4A; Figure 5-3).
For example, if A (PSV) = 80 cm/sec, waveform is regarded as high resistive when B (end-systolic notch velocity) = 0 cm/sec, intermediate resistive when B > 0 cm/sec, but < 20 cm/sec, or low resistive when B > 20 cm/sec.
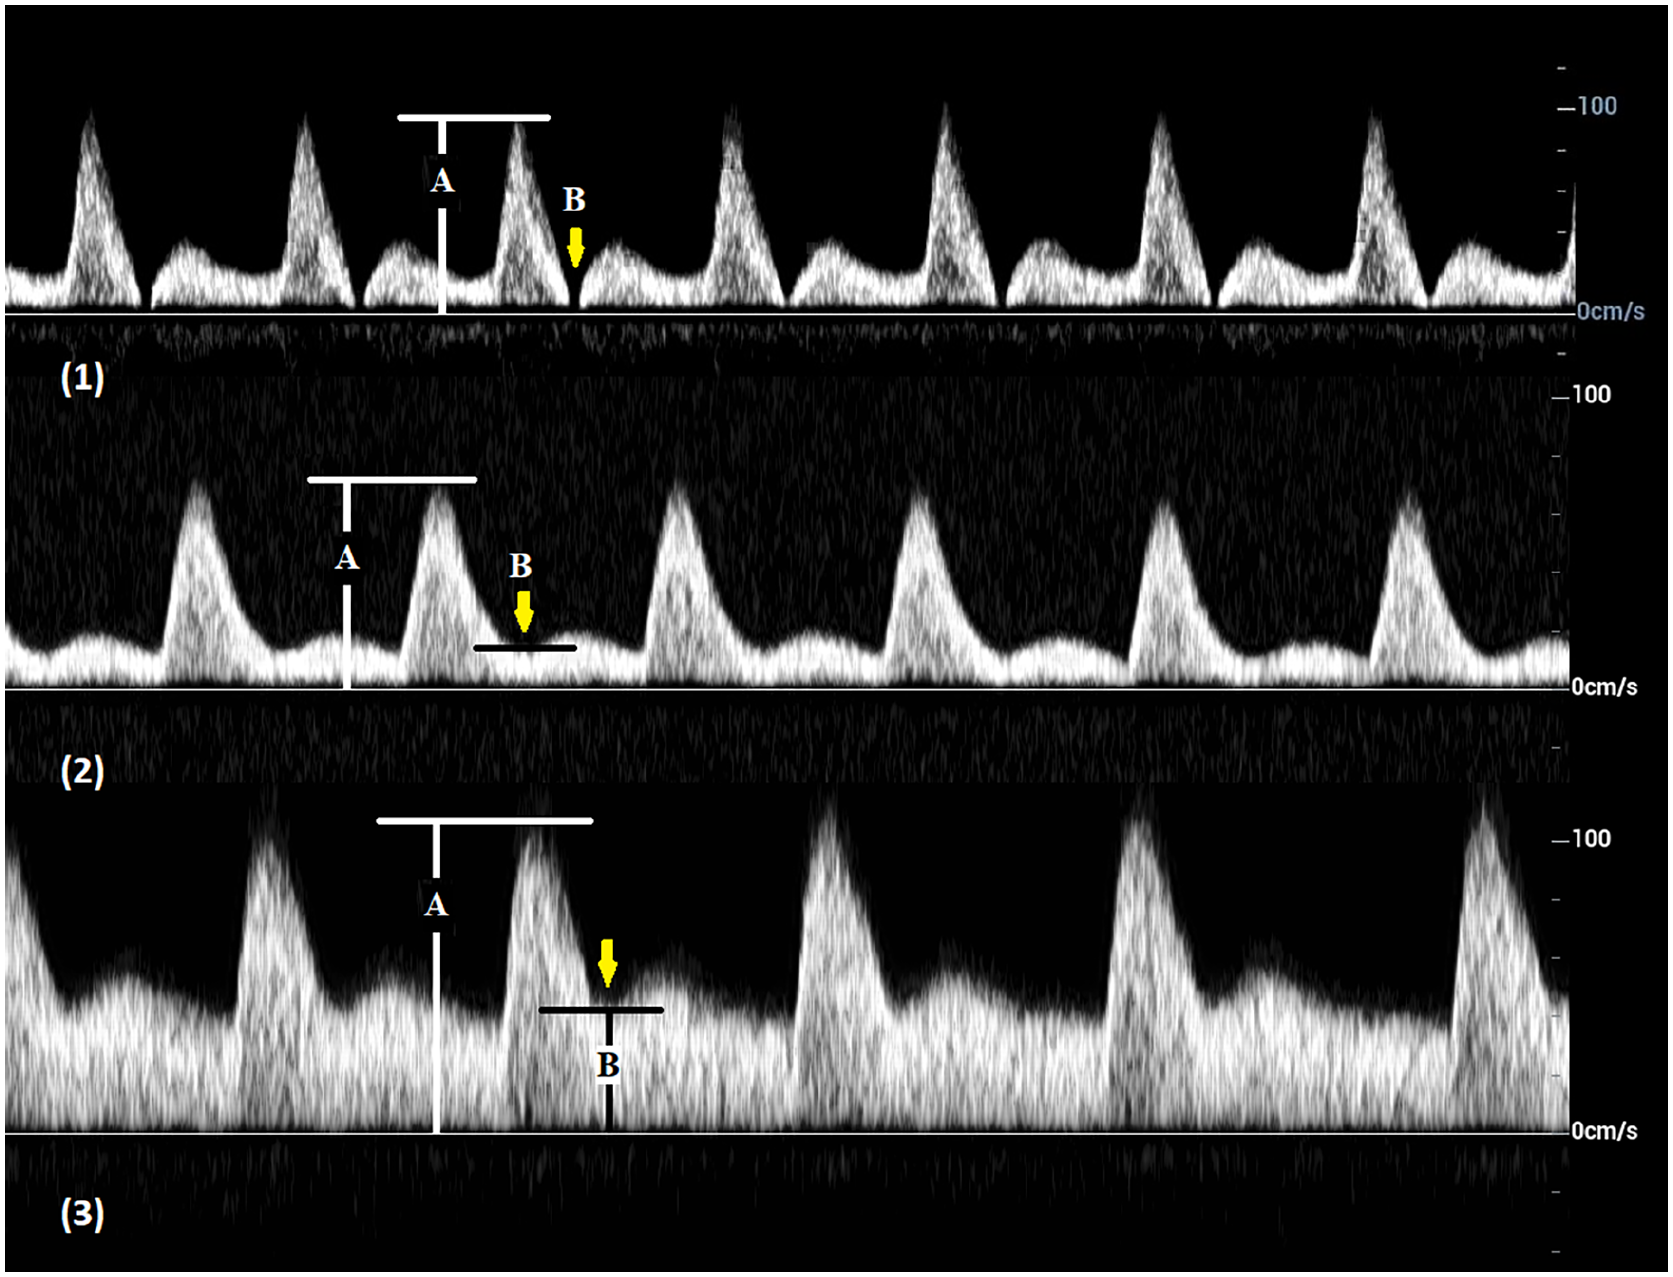
Arterial spectral Doppler waveforms with an end-systolic notch (arrows).
Statistical analysis
Fisher’s exact test was used to compare categorical data of arterial Doppler waveforms from arteries with different degrees of stenoses. All statistical analyses were carried out using IBM SPSS Statistics V25.0 (Armonk, NY, USA). A p-value less than 0.05 is regarded as statistically significant.
Results
Diameters of the right canine femoral arteries in 12 beagle dogs were 2.9 mm ~ 3.1 mm based on preoperative duplex ultrasound assessment.
A 50% (45–52%) canine femoral stenosis was confirmed on angiogram at 4–5 hours after ameroid constrictor ring replacement in all 12 cases. The arterial stenosis progressed to 70% (68–72%) in 12 cases, 7–8 days postoperatively, and advanced to 90% (86–90%) in six cases or occlusion in the remaining six cases 21–35 days after the surgery. All arterial stenoses were confirmed angiographically. Five of the six arterial occlusions were confirmed by a selective femoral angiogram and the remaining case confirmed by a histological examination. Among six cases with arterial occlusion, the occlusion extended to the segments proximal and distal to the ameroid constrictor in one case and extended to the segment distal to the constrictor in another case.
Antegrade flow was observed at all locations with the exception of the six cases of arterial occlusion. In the cases with occlusion, flow absence was observed at the location of an ameroid constrictor ring, as well as immediately proximal and distal to the ring in one case and immediately distal to the ring in the other case due to extension of the occlusion.
Multiphasic waveforms were recorded in 9 of 12 cases (75.0%) at normal baseline (0% stenosis), 3/12 (25.0%) in arteries with a 50% stenosis, 1/12 (8.3%) with a 70% stenosis, and 0/6 (0%) with a 90% stenosis (Table 1 and Figure 6-2). The proportions of multiphasic waveforms at the sites of arterial stenoses (50%, 70%, or 90%) were significantly lower compared to normal baseline (baseline vs 50%: p = 0.039, baseline vs 70%: p = 0.003, and baseline vs 90%: p = 0.009) (Table 2). However, differences between 50%, 70%, and 90% stenoses were not statistically significant (50% vs 70%: p = 1.000, 50% vs 90%: p = 0.529, and 70% vs 90%: p = 1.000).
Phasicity of arterial spectral Doppler waveform in 12 canine femoral arteries.
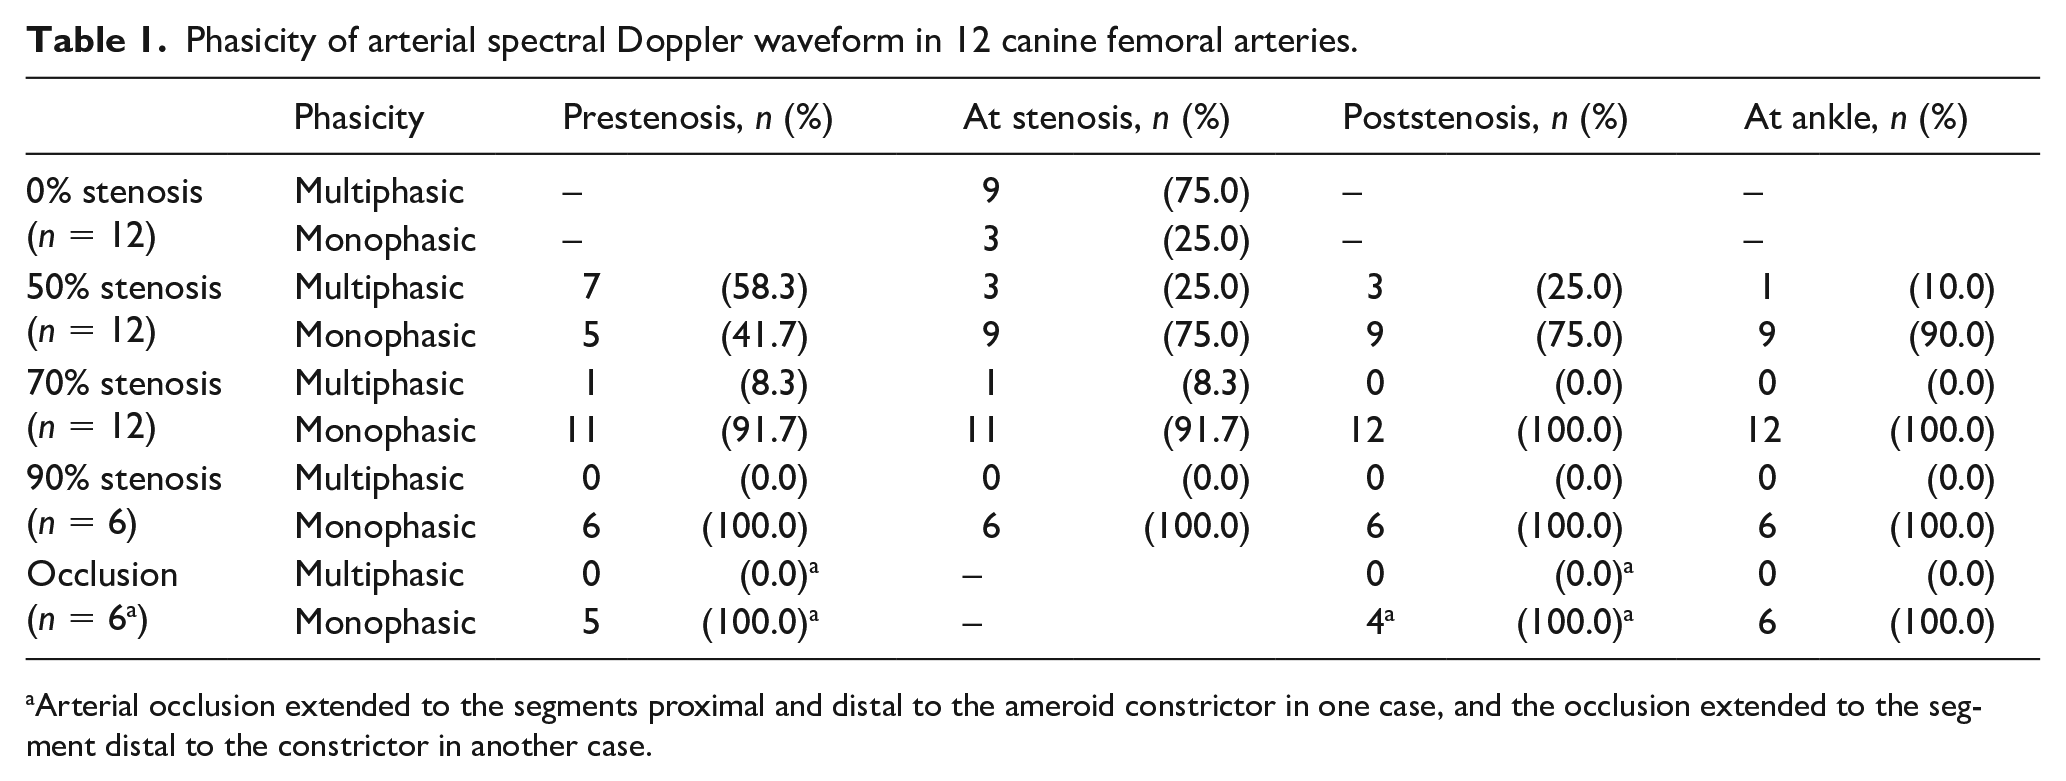
Arterial occlusion extended to the segments proximal and distal to the ameroid constrictor in one case, and the occlusion extended to the segment distal to the constrictor in another case.
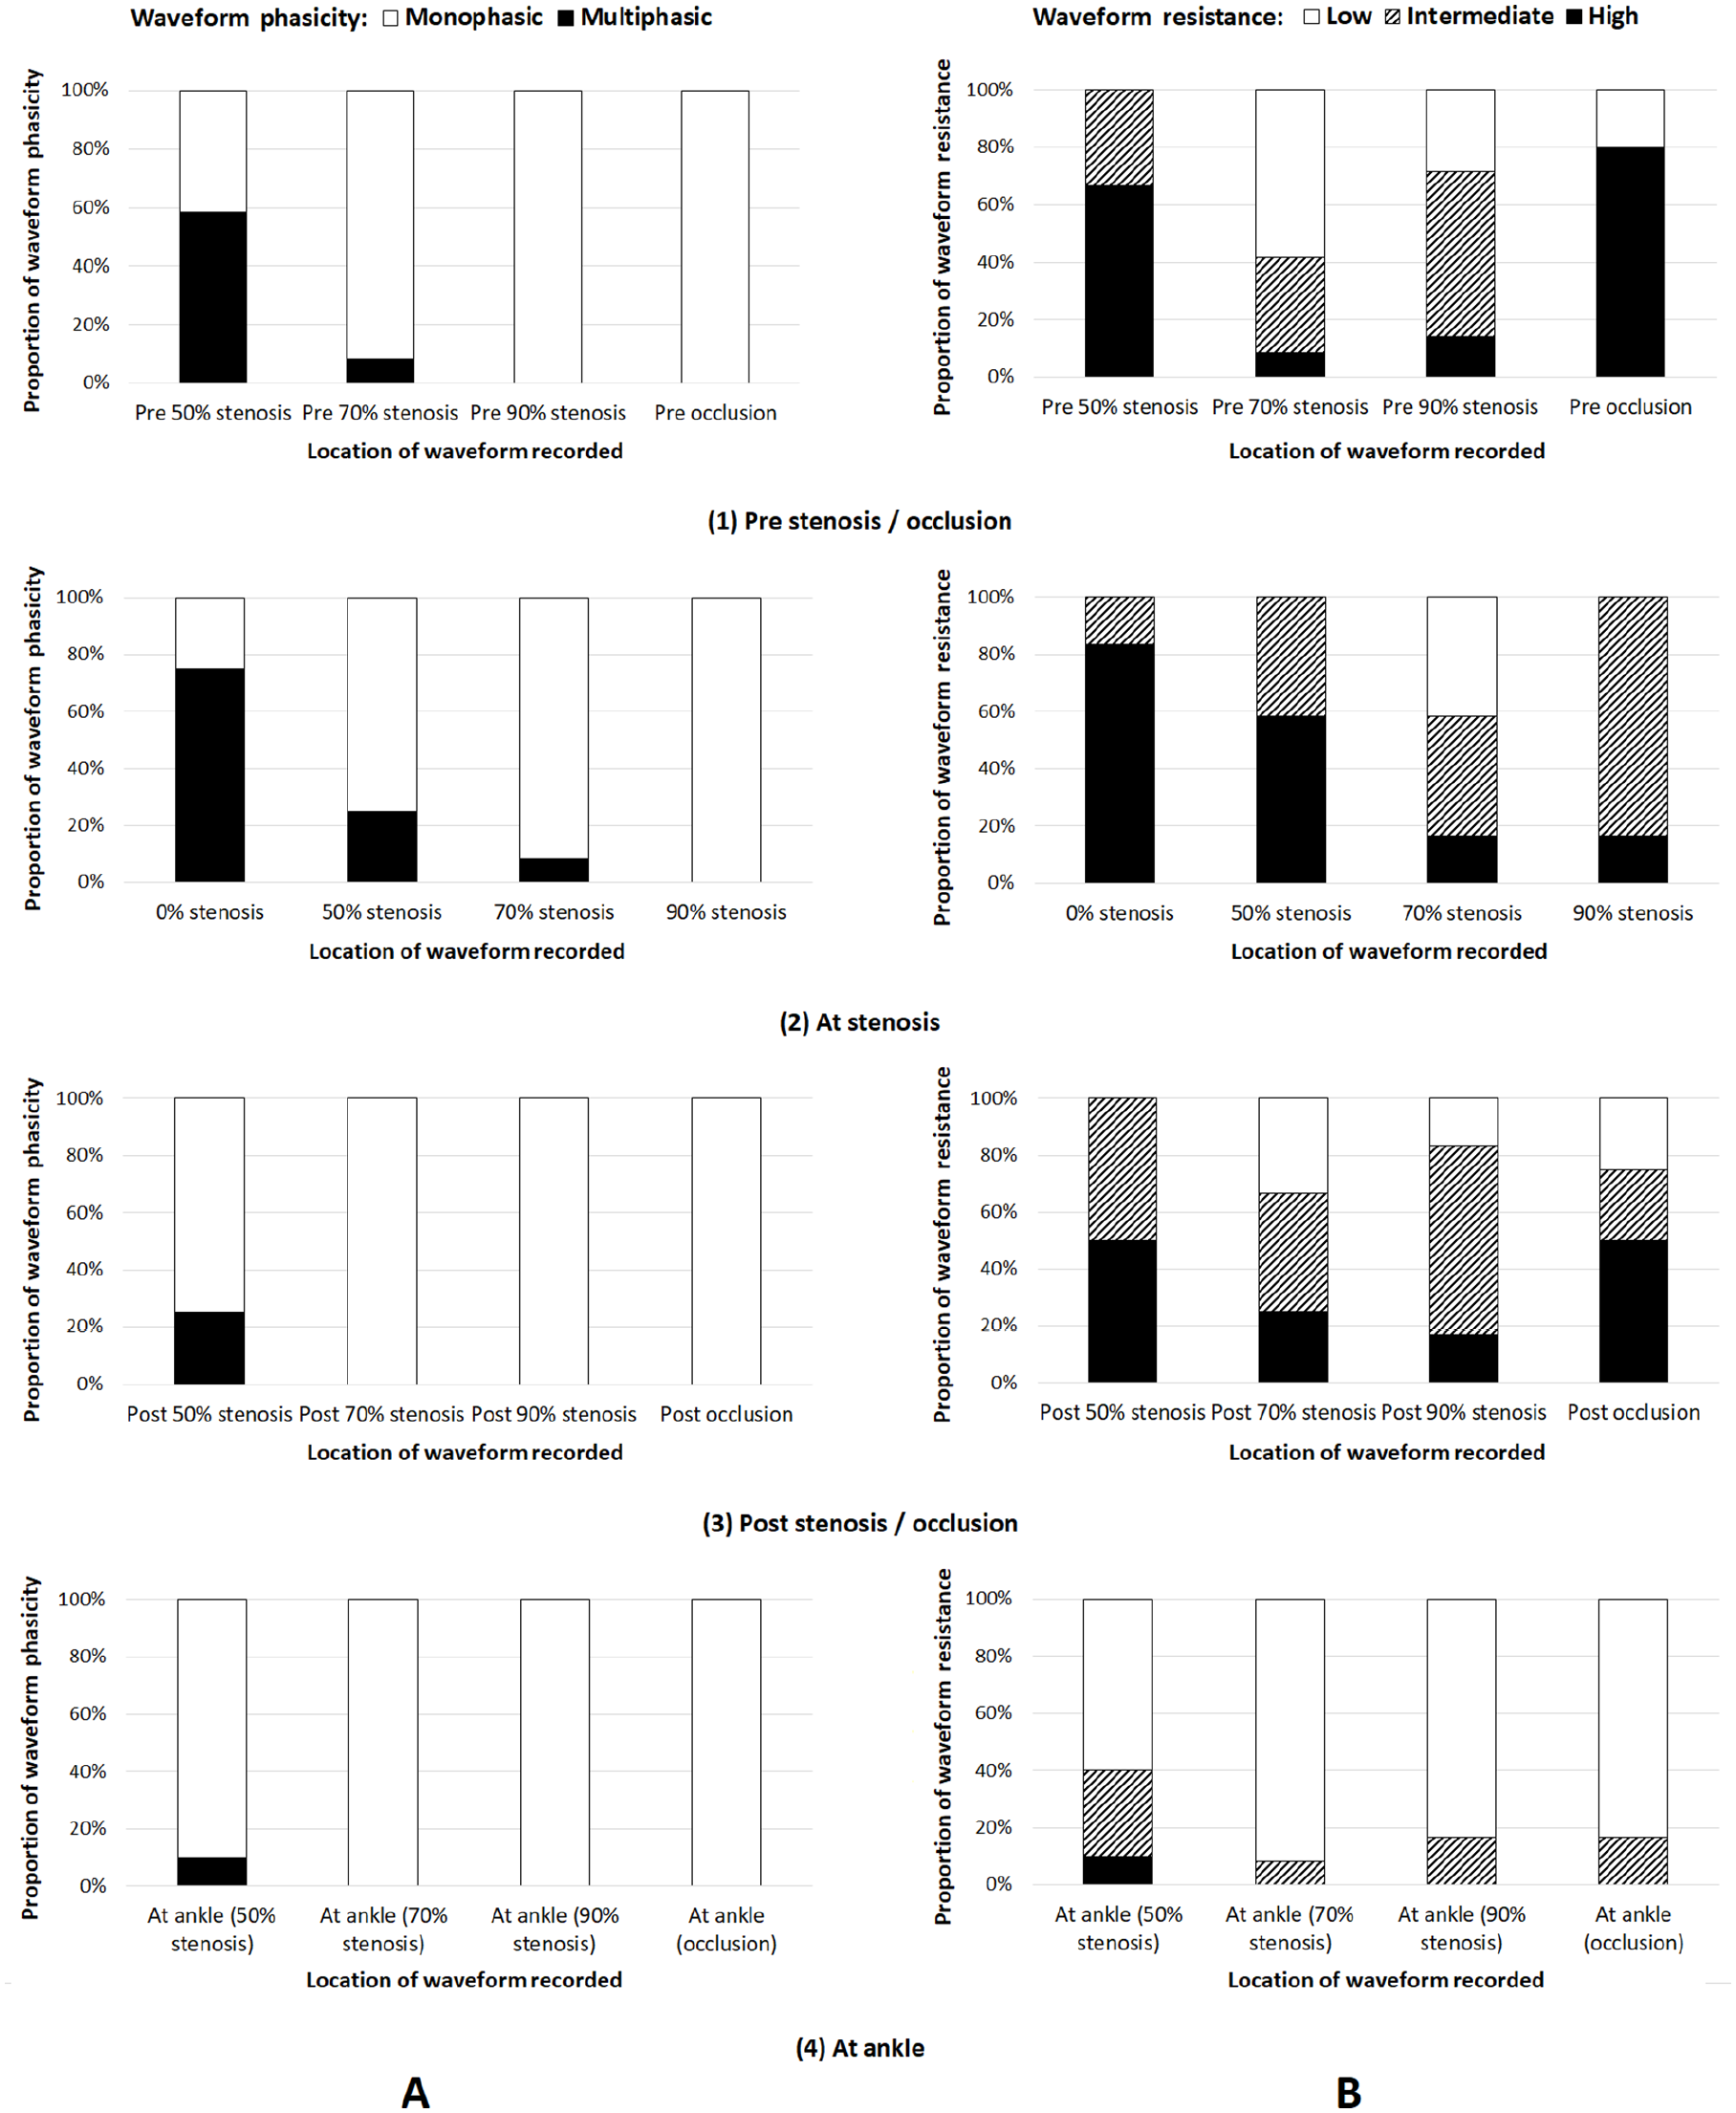
Arterial spectral Doppler waveform phasicity and resistance.
Fisher’s exact test results for comparison of proportion of multiphasic waveforms: baseline versus pre, at, and post different degrees of arterial stenoses and at ankle.
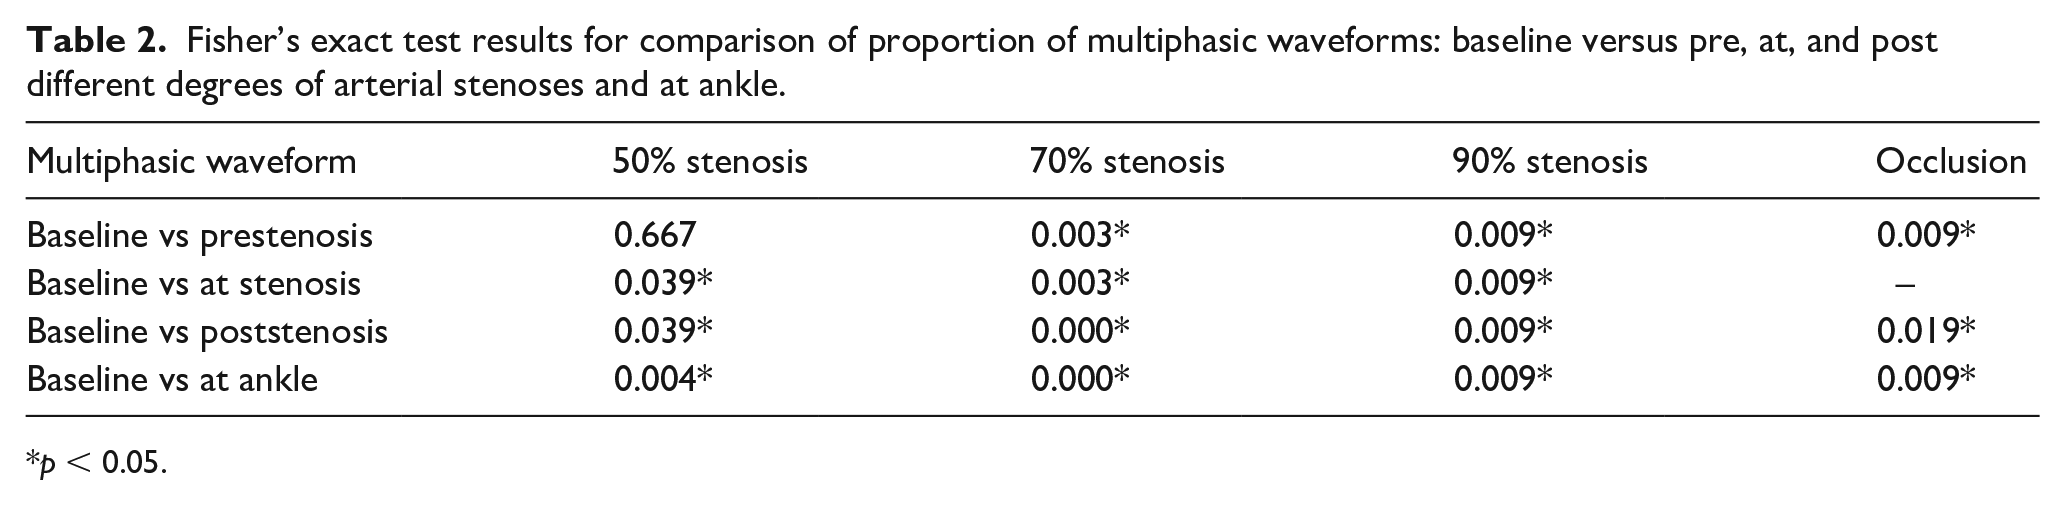
p < 0.05.
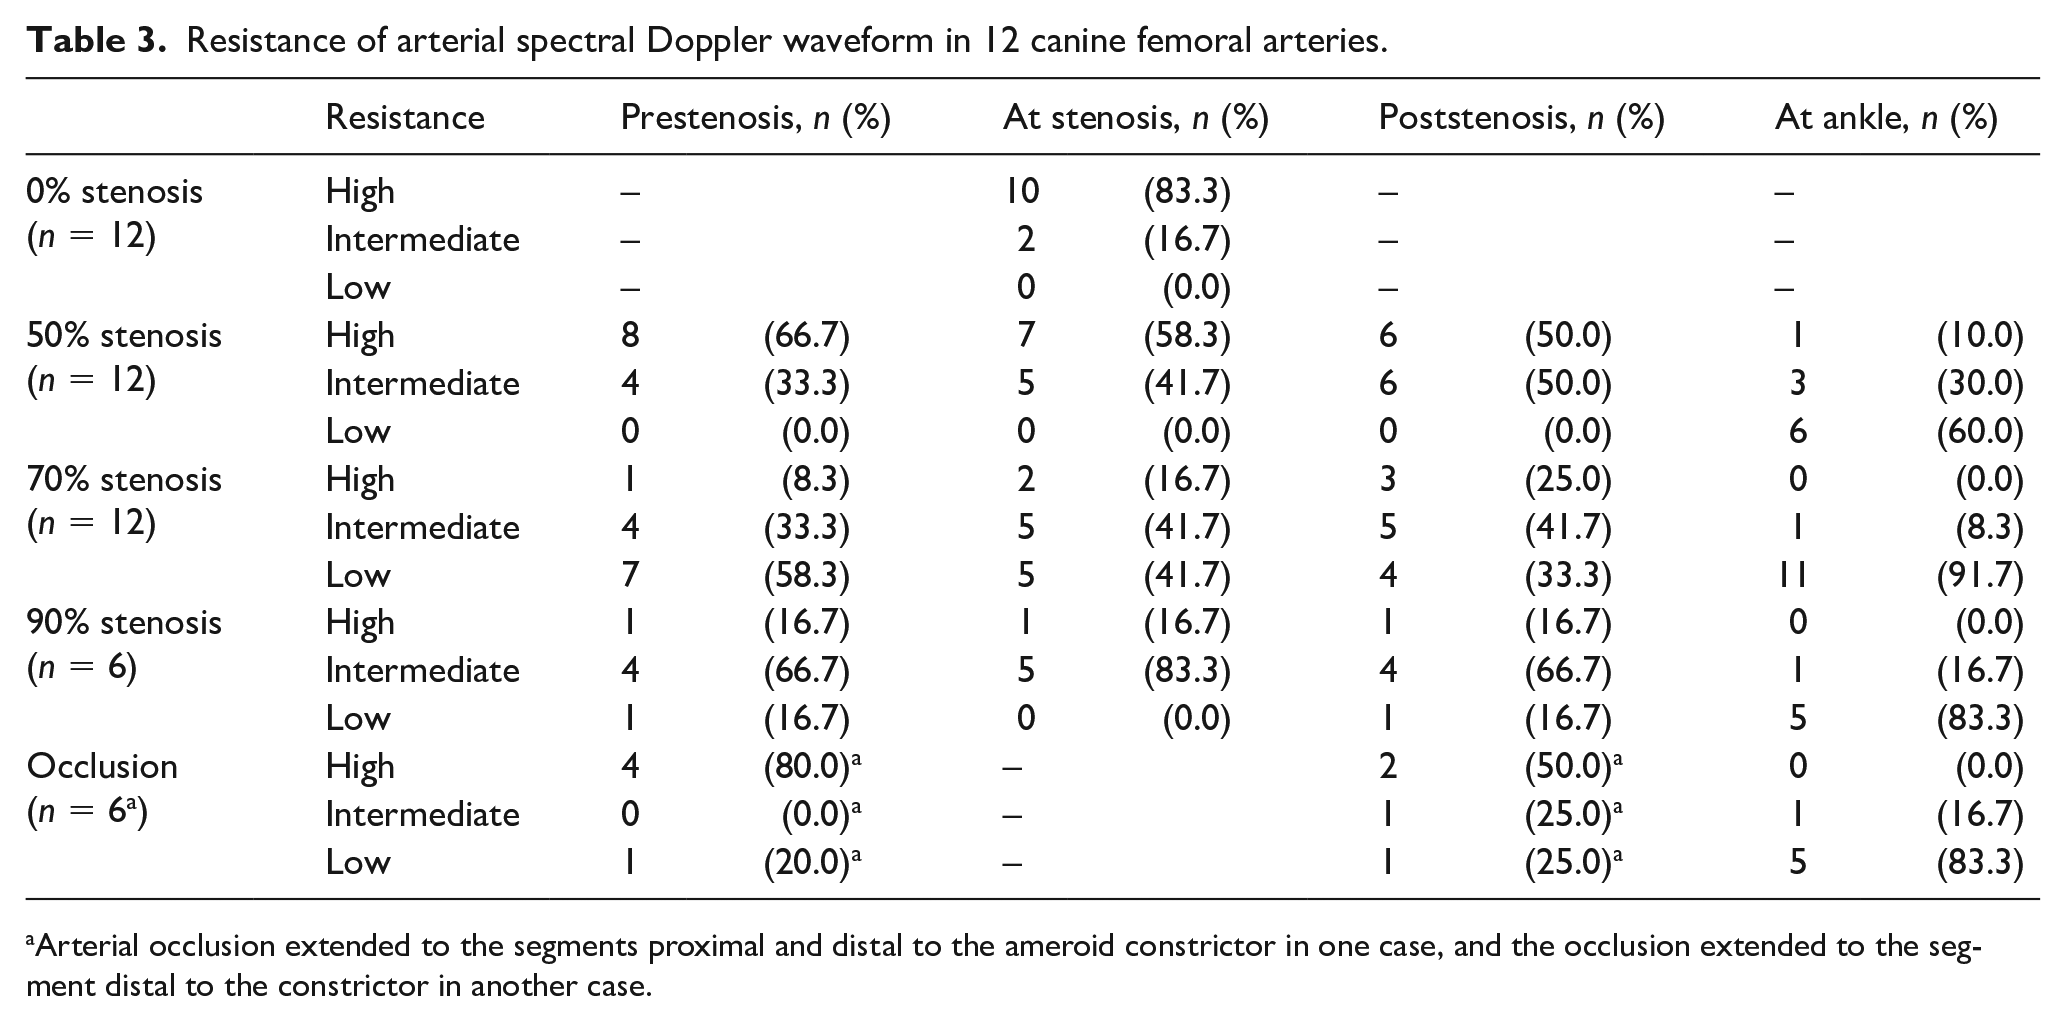
High resistive waveforms were observed in 10 of 12 (83.3%) at normal baseline, 7/12 (58.3%) with a 50% stenosis, 2/12 (16.7%) with a 70% stenosis, and 1/6 (16.7%) with a 90% stenosis (Table 3 and Figure 6-2). Compared to normal baseline, the proportions of high resistive waveforms at the sites of arterial stenoses (50%, 70%, or 90%) decreased. The difference between baseline and moderate stenosis (50%) was not statistically significant (p = 0.371), whereas the differences between baseline and more severe stenosis (70% or 90%) were significant (baseline vs 70%: p = 0.003 and baseline vs 90%: p = 0.013) (Table 4).
Resistance of arterial spectral Doppler waveform in 12 canine femoral arteries.
Arterial occlusion extended to the segments proximal and distal to the ameroid constrictor in one case, and the occlusion extended to the segment distal to the constrictor in another case.
Fisher’s exact test results for comparison of proportion of high resistive waveforms: baseline versus pre, at, and post different degrees of arterial stenoses and at ankle.
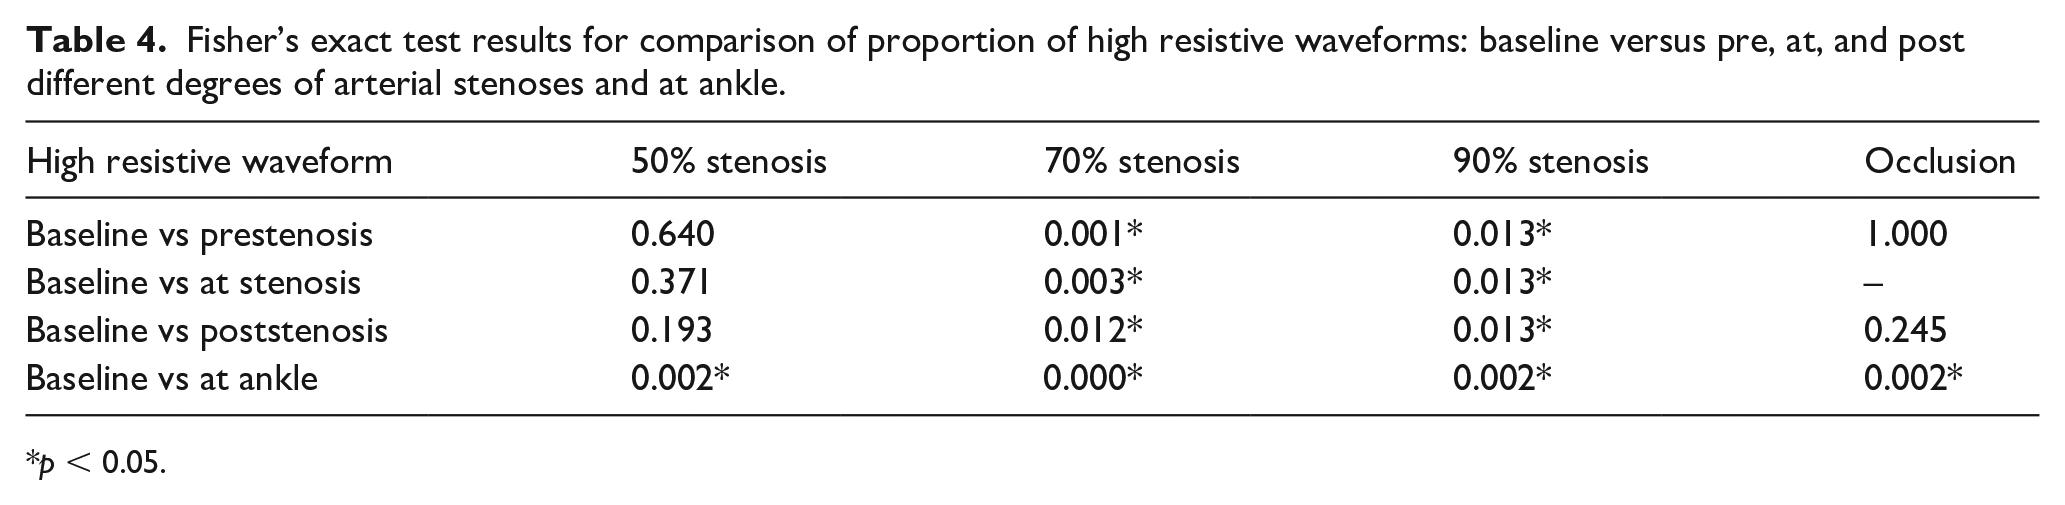
p < 0.05.
Phasicity data of arterial spectral Doppler waveforms recorded immediately proximal to, at, and immediately distal to different degrees of stenoses, and downstream at the ankle, are summarized in Table 1. Compared to normal baseline, the proportion of multiphasic arterial waveforms obtained proximal to a moderate stenosis (50%) decreased but not statistically significantly (p = 0.667). However, decreases were significant at the stenosis, distal to the stenosis, and downstream at the ankle (p = 0.039, 0.039, and 0.004). Decreases in the proportion of multiphasic arterial waveforms associated with a severe stenosis or occlusion were statistically significant in all locations where an arterial waveform was recorded (p < 0.05) (Tables 1 and 2; Figure 6A).
Table 3 and Figure 6B show resistance of the arterial spectral Doppler waveforms recorded pre, at, and post different degrees of stenoses, and downstream at the ankle. Compared to normal baseline, the decrease in the proportion of high resistive arterial waveforms was significant at the ankle (p = 0.002) but not significant proximal to, at, and distal to the stenosis (p = 0.640, 0.371, and 0.193) in the arteries with a moderate stenosis (50%). In the arteries with a severe stenosis (70% or 90%), decreases in the proportion of high resistive arterial waveforms were significant at all locations (p < 0.05). In the arteries with an occlusion, the proportion of high resistive arterial waveforms decreased significantly at the ankle (p = 0.002) but not significantly proximal to and distal to the occlusion (p = 1.000 and 0.245) (Table 4).
Discussion
Arterial Doppler spectral waveform analysis has been widely used in the noninvasive assessment of arterial occlusive disease. However, definitions for arterial Doppler waveform descriptors are still inconsistent, even contradictory. 12 Recently, the SVM and the SVU published their expert consensus statement on the interpretation of peripheral arterial and venous spectral Doppler waveforms in order to standardize nomenclature for Doppler waveforms. 16 Major descriptors of arterial waveform nomenclature recommended by the consensus statement were used in this study to analyse canine artery spectral Doppler waveforms. The consensus statement recommends that arterial spectral Doppler waveforms be described as high, intermediate, or low resistive. The intermediate resistive waveform is defined as a waveform with sharp upstroke, brisk downstroke, visible presence of an end-systolic notch, and continuous forward flow throughout diastole that is above the zero-flow baseline. In the examples from this study (Figure 4-1 and 4-2), there are a combination of multiphasic waveforms and monophasic waveforms with an end-systolic notch at the same site of an artery. As a multiphasic waveform is regarded as a high resistive waveform, it is reasonable to call those monophasic waveforms with a notch recorded at the same location high resistive rather than intermediate resistive. Reversed flow in Figure 4-1 and Figure 4-2, are noted to be extremely small in magnitude and could be obscured by a wall filter setting. In other samples (Figure 4-3 and Figure 4-4), the waveforms have key features of a low resistive waveform, prolonged downstroke in late systole, and continuous flow throughout diastole and the end-systolic notches are relatively shallow. Given this, it would follow to categorize them as low resistive waveforms rather than intermediate resistive waveforms as they have far more low resistive waveform features than high resistive waveform features.
Changes in arterial Doppler waveforms represent a spectrum of peripheral vascular resistance and are gradual and continuous from high to low. 21 When arterial waveforms are divided into high, intermediate, and low resistive, it seems reasonable to expect each represents a similar spectrum of peripheral resistance. In this study, the measurement of end-systolic notch velocity was introduced to further distinguish an intermediate resistive waveform from high and low resistive waveforms. When the notch velocity equals to zero, the waveform is considered as high resistive, when greater than zero but less than one-fourth of PSV as intermediate resistive, and when greater than one-fourth of PSV as low resistive (Figure 5). Although the thresholds used to differentiate intermediate resistive from high or low resistive are arbitrary, it nevertheless has made it easier to categorize the resistive status of an arterial Doppler waveform and may have better representation of vascular resistance. The end-systolic notch velocity measurement might be an alternative to end-diastolic ratio [end-diastolic velocity (EDV)/PSV] and resistive index [(PSV – EDV)/PSV], which take EDV measurement into consideration when quantifying arterial Doppler waveform resistance.
Compared with arterial waveforms at baseline (0% stenosis), the proportion of multiphasic waveforms reduced significantly at the sites of moderate (50%) to more severe (70% and 90%) focal stenoses (p < 0.05). Multiphasic arterial waveforms representing pulsatile flow patterns in normal lower limb arteries have a key feature of diastolic flow reversal. This is due to pressure gradient variations during the cardiac cycle between proximal and distal arteries. The pressure gradient is greatest during the first half of systole and then it decreases. A negative pressure gradient may appear during diastole, which reverses the blood flow direction when distal resistance is higher than proximal resistance.17,18,22 When an arterial stenosis is present, a multiphasic waveform is less likely to be observed due to the reduction in arterial outflow bed resistance.
Arterial waveform resistance is also changed at an arterial stenosis. In this study, a decrease in waveform resistance was significant in arteries with a severe stenosis (70% or 90%) (p < 0.05) but not significant in arteries with a moderate stenosis (50%) (p = 0.039). This suggests arterial waveform phasicity change is more sensitive in response to an arterial focal stenotic lesion than waveform resistance change in this canine femoral artery stenosis model.
At all locations where arterial spectral Doppler waveforms were recorded, including pre, at, and post an arterial stenosis (moderate and severe) and occlusion, and downstream at the ankle, significant changes in waveform phasicity occurred. The exception was proximal to a moderate stenosis. On the other hand, significant changes of waveform resistance associated with a moderate stenosis were at the ankle only, but detected at all locations associated with a severe stenosis. This further supports that a change of arterial waveform phasicity appears earlier than that of waveform resistance when a focal arterial stenosis is present.
Waveform resistance changes immediately proximal and distal to an occlusion were not significant but were downstream at the ankle in this small study population. The results are in line with the view that depending on the status of collateral vessels and the acuteness of occlusion, the appearance of a waveform proximal to an occlusion may or may not be affected23,24 and vascular resistance decreases more significantly downstream to an occlusion than immediately distal to an occlusion.
Study limitations
There are several limitations in this study. First, the sample size is small. Definitions of descriptor terms for arterial Doppler waveform resistance were modified and different from the recent published consensus statement. 16 In this canine femoral artery stenosis model, arterial stenoses progressed gradually from less severe to more severe over a period of time. Therefore, arterial stenoses of different degrees were established at different stages of acuteness. This might impact on arterial Doppler waveform changes. 23 The size of the canine femoral arteries studied was approximately 3 mm in diameter and much smaller than the most commonly studied human femoropopliteal arteries. As a result, haemodynamic changes including its response to a stenosis in those arteries might be different.
Conclusion
This study demonstrates that arterial spectral Doppler waveform phasicity and resistance are likely to alter in canine femoral arteries associated with a moderate or severe focal stenosis. In addition, arterial waveform phasicity change seems more sensitive in response to arterial focal stenotic disease than waveform resistance change, especially when an arterial stenosis is moderate. Extra measurements of arterial Doppler waveforms, such as end diastolic ratio (EDR), resistance index (RI), and potentially end-systolic notch velocity, could provide additional information on arterial resistance.
Footnotes
Acknowledgements
The authors greatly thank Mrs Jayne Chambers (Austin Hospital, University of Melbourne, Melbourne, Australia) for proofreading of the manuscript.
Data availability statement
The raw data supporting the conclusions of this article will be made available by the corresponding author, without undue reservation.
Declaration of conflicting interest
The authors declared the following potential conflicts of interest with respect to the research, authorship, and/or publication of this article: Yigang Du is employed by Mindray.
Funding
This work was, in part, supported by the National Natural Science Foundation of China (Grant No. 81771833) and the Beijing Natural Science Foundation (Grant No. 7172209).