
Abstract
Keywords
Introduction
The femoropopliteal artery is the most commonly affected vessel for patients with peripheral artery disease (PAD). 1 Endovascular therapy has been developed gradually and is now regarded as the first-line treatment for most symptomatic patients. 2 Self-expanding bare-metal stents (BMSs) are essential in the intervention treatment of PAD. 3 Since improvements in stent materials and technology have resulted in a significant reduction in surgical complications such as stent fracture, 4 in-stent restenosis (ISR) is still a common and frustrating problem in the clinical setting. 5 For example, more than 50% of patients treated with nitinol BMSs developed ISR of the femoropopliteal artery at the 2-year follow-up. 6 In the last decade, several new endoluminal treatment modalities have been used to treat ISR, such as drug-coated balloon (DCB), peripheral cutting balloon angioplasty (PCBA), Viabahn endoprosthesis (VBE), directional atherectomy (DA), and excimer laser atherectomy (ELA).7–10 Nonetheless, it is still controversial which endovascular treatment approach will contribute to the most efficient treatment outcome clinically. 11 Therefore, we performed a network meta-analysis (NWM) comparing the efficacy of treatment modalities concerning primary patency, target lesion revascularization (TLR), technical success, and major amputations for femoropopliteal ISR disease.
Methods
Data sources and searches
This study followed the Preferred Reporting Items for Systematic Reviews and Meta-Analyses (PRISMA) guidelines. This meta-analysis was registered with the PROSPERO International Prospective Register of Systematic Reviews (
Study selection
Studies meeting the following criteria were included: (1) the patients underwent femoropopliteal ISR; (2) the patients received endovascular treatment; (3) the sample size was at least 20 patients; (4) there was at least 6 months of follow-up; (5) at least one follow-up outcome was reported (technical success, primary patency, TLR, amputation); (6) there were no duplicated reports; (7) the type of research was comparative.
Data collection
We included all clinical trials of femoropopliteal ISR that met the inclusion criteria. If multiple articles about the same trial were searched, only the most recent article with the most complete information was included. Two researchers independently extracted data for the included literature. Disagreements were resolved by consensus or by consultation with author ZZ if necessary. The following data were extracted from the included studies: author, year, country, study design, study period, number of patients, presentation, treatment arms, time of follow-up, age, sex, hypertension status, diabetes mellitus status, hyperlipidemia status, ankle–brachial index, lesion length, Rutherford category, ISR Tosaka classification, and primary and secondary outcome data. If no results were reported for the relevant measures, they were calculated from Kaplan–Meier curves by two researchers independently using the Excel spreadsheet provided with Engauge Digitizer 4.1 (free software downloaded from http://sourceforge.net). 13
Quality assessment
Following the Cochrane guidelines, two authors independently assessed the risk of bias for all included randomized controlled trials (RCTs), and debatable issues were resolved through discussion and negotiation. In addition, RCTs were evaluated for quality using the JADAD score, with 1–3 being low quality and 4–7 being high quality. 14 For retrospective studies, the authors used the Newcastle–Ottawa Scale (NOS) for quality assessment. A score of no less than 5 was required for inclusion in the NWM. 15 The evaluation was completed by two independent reviewers, with disagreements handled by consensus formation or by consultation with author ZZ if necessary.
Outcome measures
Efficacy evaluation indicators included the following:
1) technical success, defined as a final angiogram with less than 30% residual stenosis;
2) primary patency, defined as a nonoccluded segment of the treated artery without any additional hemodynamic reconstruction;
3) TLR, defined as any surgical bypass or re-endovascular intervention to the target vessel; and
4) major amputation, defined as amputation above the ankle.
Data analysis
NWM is also named mixed-treatment comparison meta-analysis or multiple-treatment comparison. NWM is a method for evaluating intervention effectiveness by analyzing indirect comparisons of different trials based on a common comparator and direct comparisons of interventions. In other words, NWM provides evidence for making decisions by assessing the relative effectiveness of two or more interventions under the same conditions. 16
Compared to traditional meta-analysis, one of the advantages of NWM is the accuracy of the assessment analysis and the ability to show the relative ranking of all treatments on study outcomes. However, at the same time, NWM requires a more rigorous methodology, logic, and statistical assumptions. Before performing NWM, three main assumptions (similarity, transferability, and consistency) need to be verified.
Similarity was assessed qualitatively for each included study from a methodological perspective, rather than a statistical test of hypotheses. The population, intervention, comparison, and outcome (PICO) techniques were used to examine similarity. 17 Transitivity involves the validity of logical reasoning, and similarity involves the feasibility of comparative methods. Consistency is defined as the consistent size of the comparative effect obtained by direct and indirect comparisons. Consistency is an objective measure of transitivity.
This study used the NWM approach based on the frequentist framework. The approach is based on consistency between direct and indirect sources of evidence (the consistency of assumption). The model proposed in the Stata program considers both the level of heterogeneity and inconsistency, as with the size of the treatment effect.
The statistical analysis of this study consisted of five main steps. First, we created a network map showing direct and indirect comparisons between individual treatments and the number of comparisons. A network map is a graphical depiction that shows how each intervention is associated with other interventions. Nodes are weighted according to the allocated patient population, and lines are weighted according to the number of trials available.
Second, we examined the assumption of consistency. Stata’s inconsistency testing has two levels. 18 The first is a way to test for overall inconsistency. The inconsistency model is executed, and then the consistency model is executed when the inconsistency level is 0. 16 In exploring the comparative efficacy of the eight treatment modalities, we used standard balloon angioplasty (SBA) as the reference treatment modality. The second one is a localized method. Loop-specific methods are used to detect inconsistencies in evidence loops when the network geometry shows a closed loop. Additionally, we used node-splitting methods to detect inconsistencies between direct evidence and indirect evidence across the network. When the p-value for comparing direct and indirect effects in the nodal split node-splitting analysis is > 0.05, it cannot indicate a significant inconsistency. 19
Third, we made a league table and a prediction interval plot to demonstrate the summary size of comparative effectiveness among various interventions. The NWM produced results in the form of odds ratios (ORs) and 95% CIs between treatments. The prediction interval plots are used to show the processing results for each pair. Additionally, for all comparisons in the network, ORs and 95% CIs were placed in pairs in the nondiagonal cells of the league table. Fourth, we calculated the cumulative ranking to determine the superiority between interventions. The surface under the cumulative ranking curve (SUCRA) represents the probability of ranking effectiveness and the percentage of effectiveness of a treatment that consistently ranks first in the absence of any uncertainty. 20 SBA was used as the reference treatment modality. A larger SUCRA value indicates a better, more efficient, or safer treatment. A frequentist resampling method with 10,000 bootstrap repetitions was used to estimate the probability of each treatment in a specific order, mean rank of treatments, and the SUCRA value. 21
The fifth step assesses publication bias to draw valid inferences from the results. Publication bias was assessed given the number of studies (more than 10) included in each meta-analysis. 22 Therefore, we structured a ‘comparison-adjusted’ funnel plot and Begger’s test to evaluate bias and small-study effects. We performed a sensitivity analysis including RCTs only to confirm that the same options consistently rank at the top and make our results more convincing. All analyses were performed using Stata 16.0 statistical software (http://www.stata.com), and we used Review Manager 5.4 software for the risk of bias summary.
Results
A total of 1796 publications were selected, and 14 eligible articles were included in the meta-analysis. A detailed literature search flow chart is shown in Figure 1. The Cochrane Collaboration tool was used to assess the risk of bias for the 10 RCTs (Figure 2). We evaluated the quality of the 14 included papers (Supplementary Table 1). All supplemental materials are available online with the article. The JADAD scores of all 10 RCTs were ⩾ 4. The NOS scores were ⩾ 7 in all four retrospective studies. In other words, the included studies were of high quality and had a low bias.
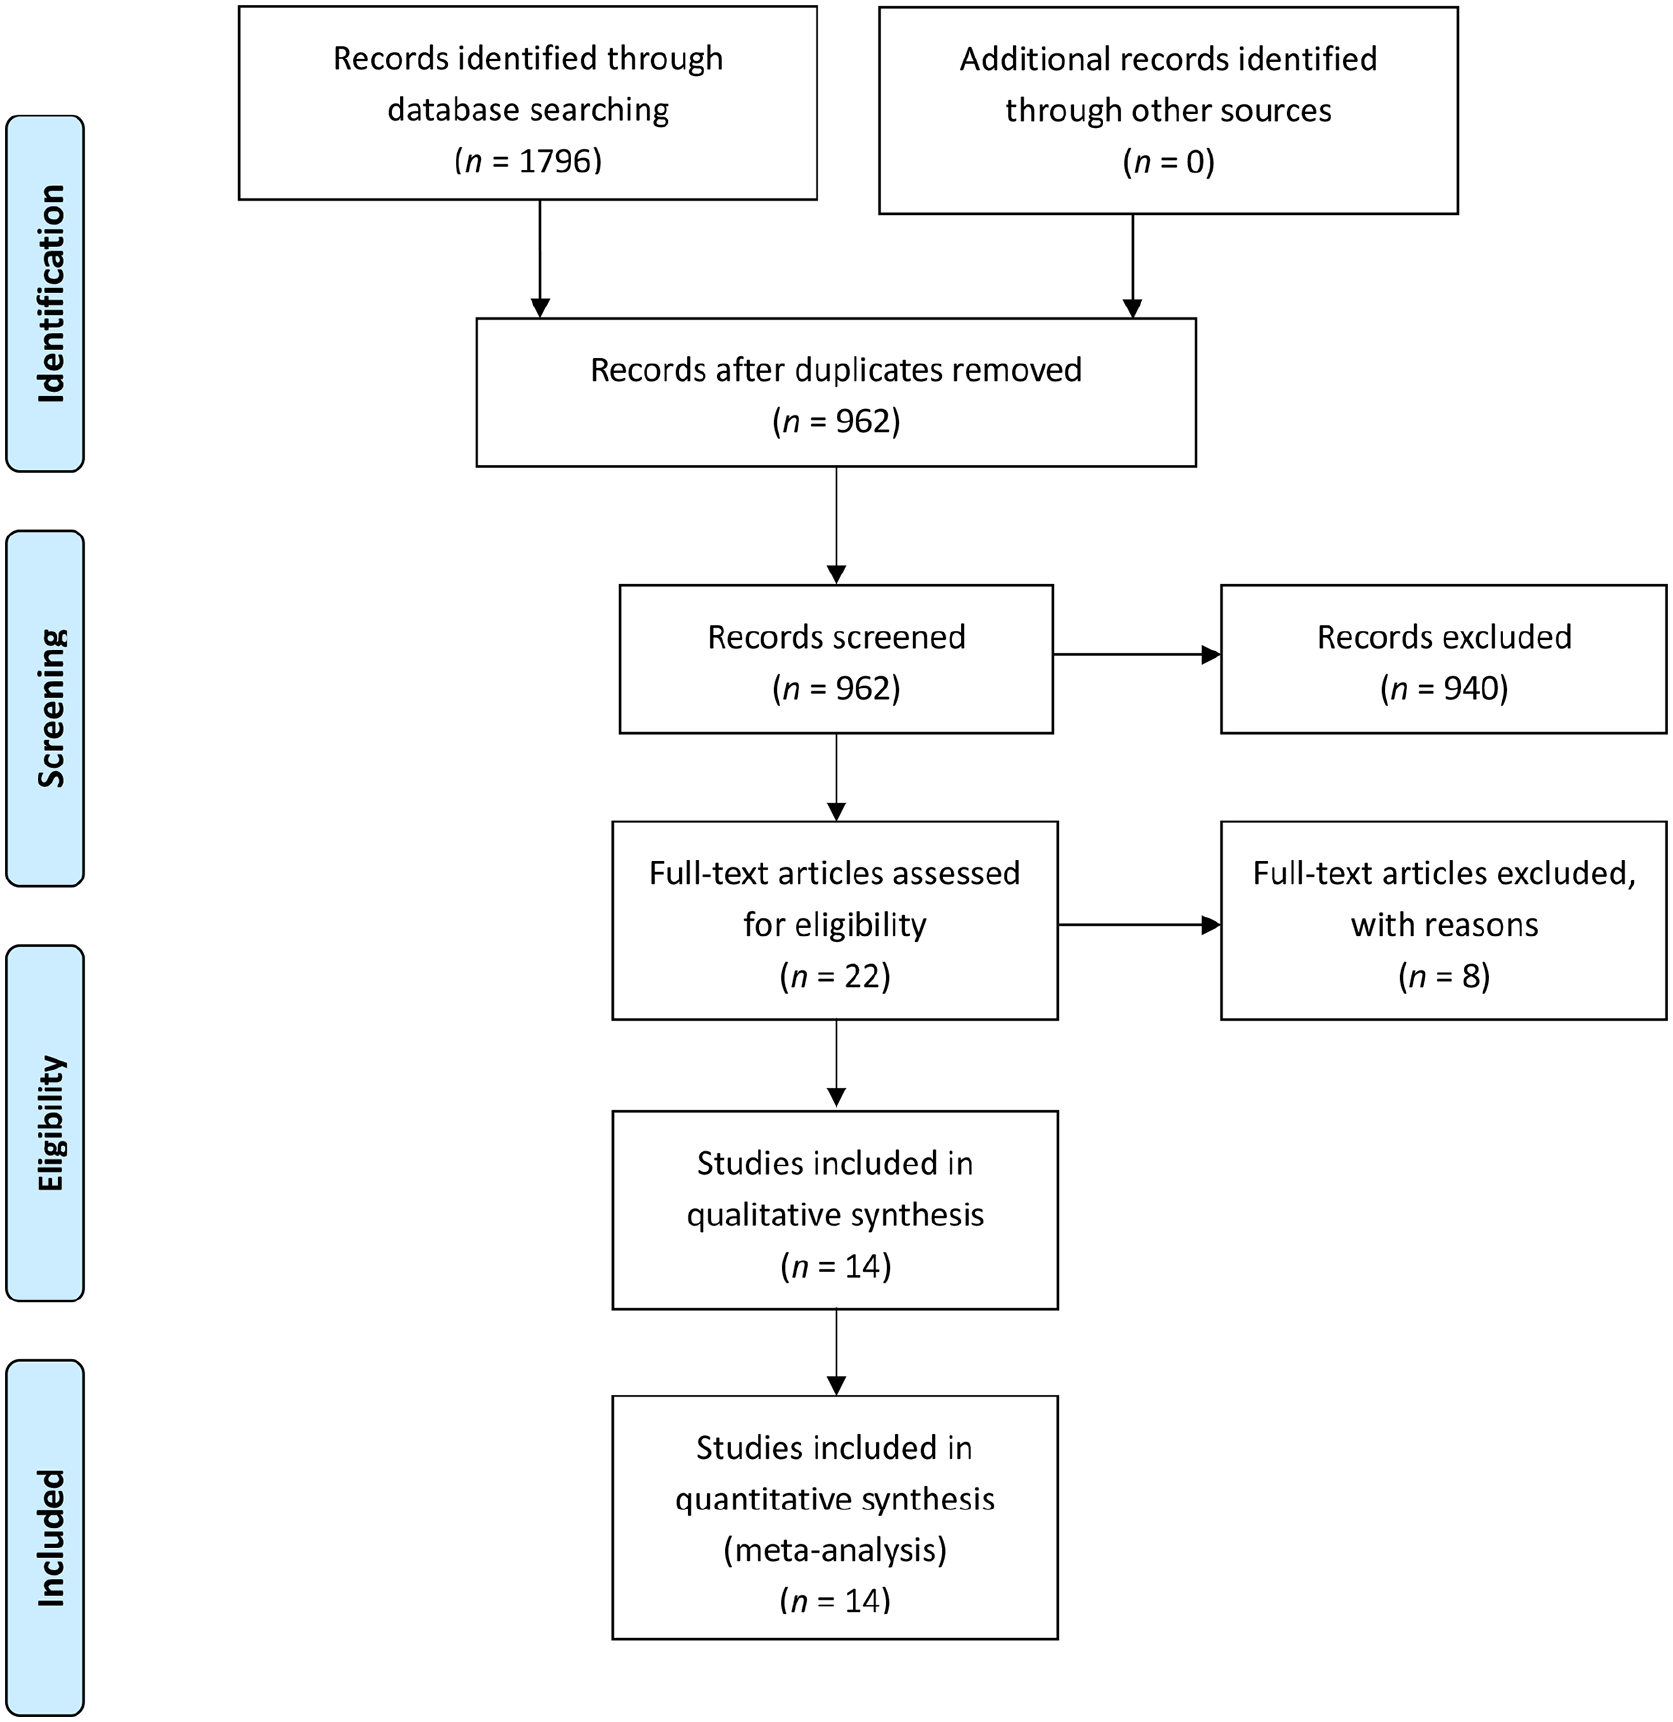
Preferred reporting items for systematic reviews and meta-analyses (PRISMA) flow chart.
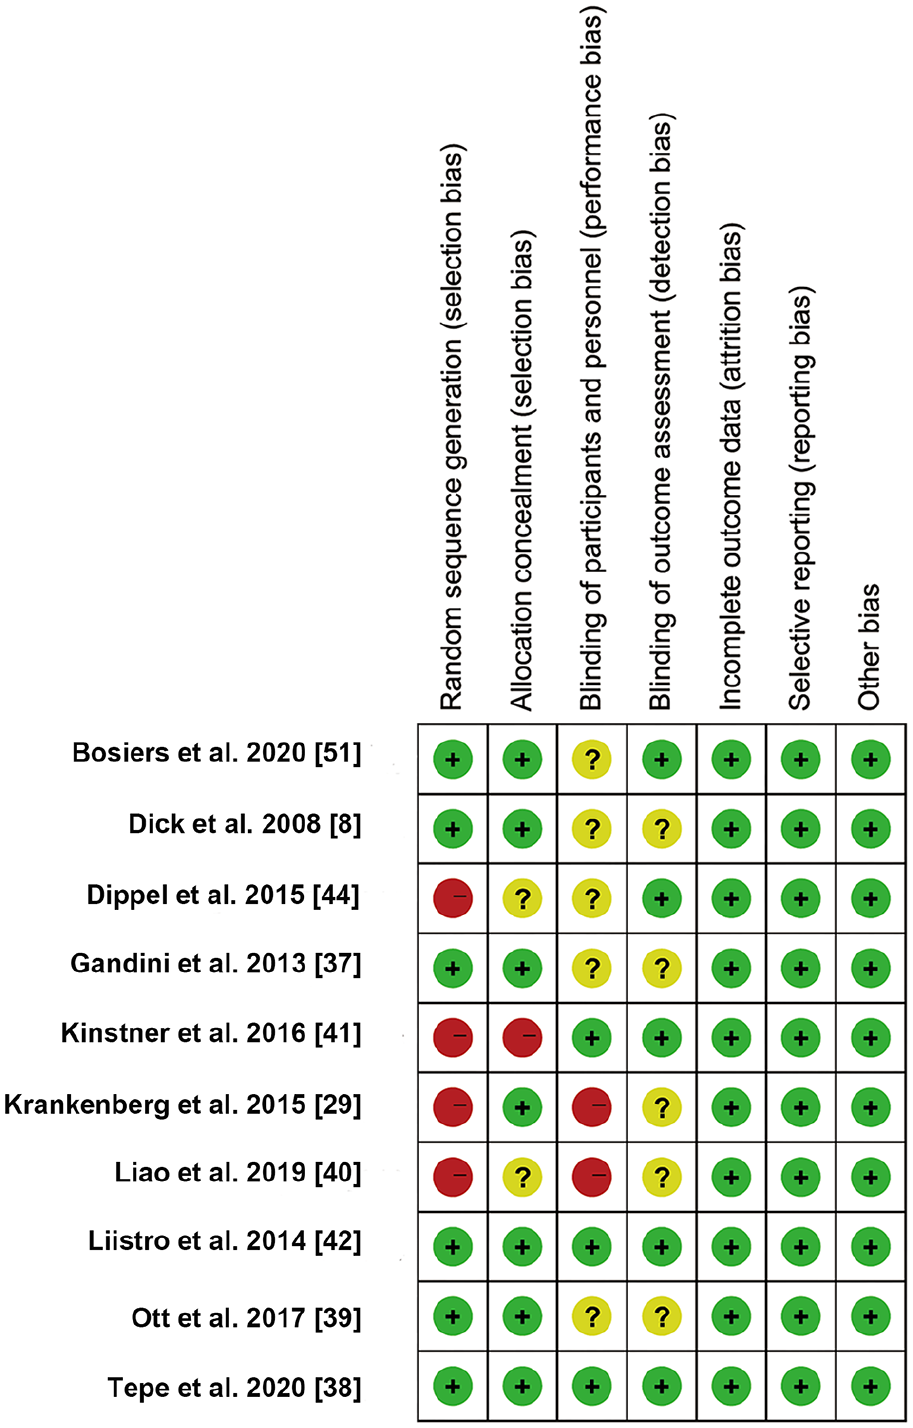
The risk of bias for each included randomized controlled trial according to the Cochrane Collaboration’s tools.
Efficacy (OR and 95% CI) of all treatment modalities in the league table according to a multi-treatment meta-analysis of outcome measures.
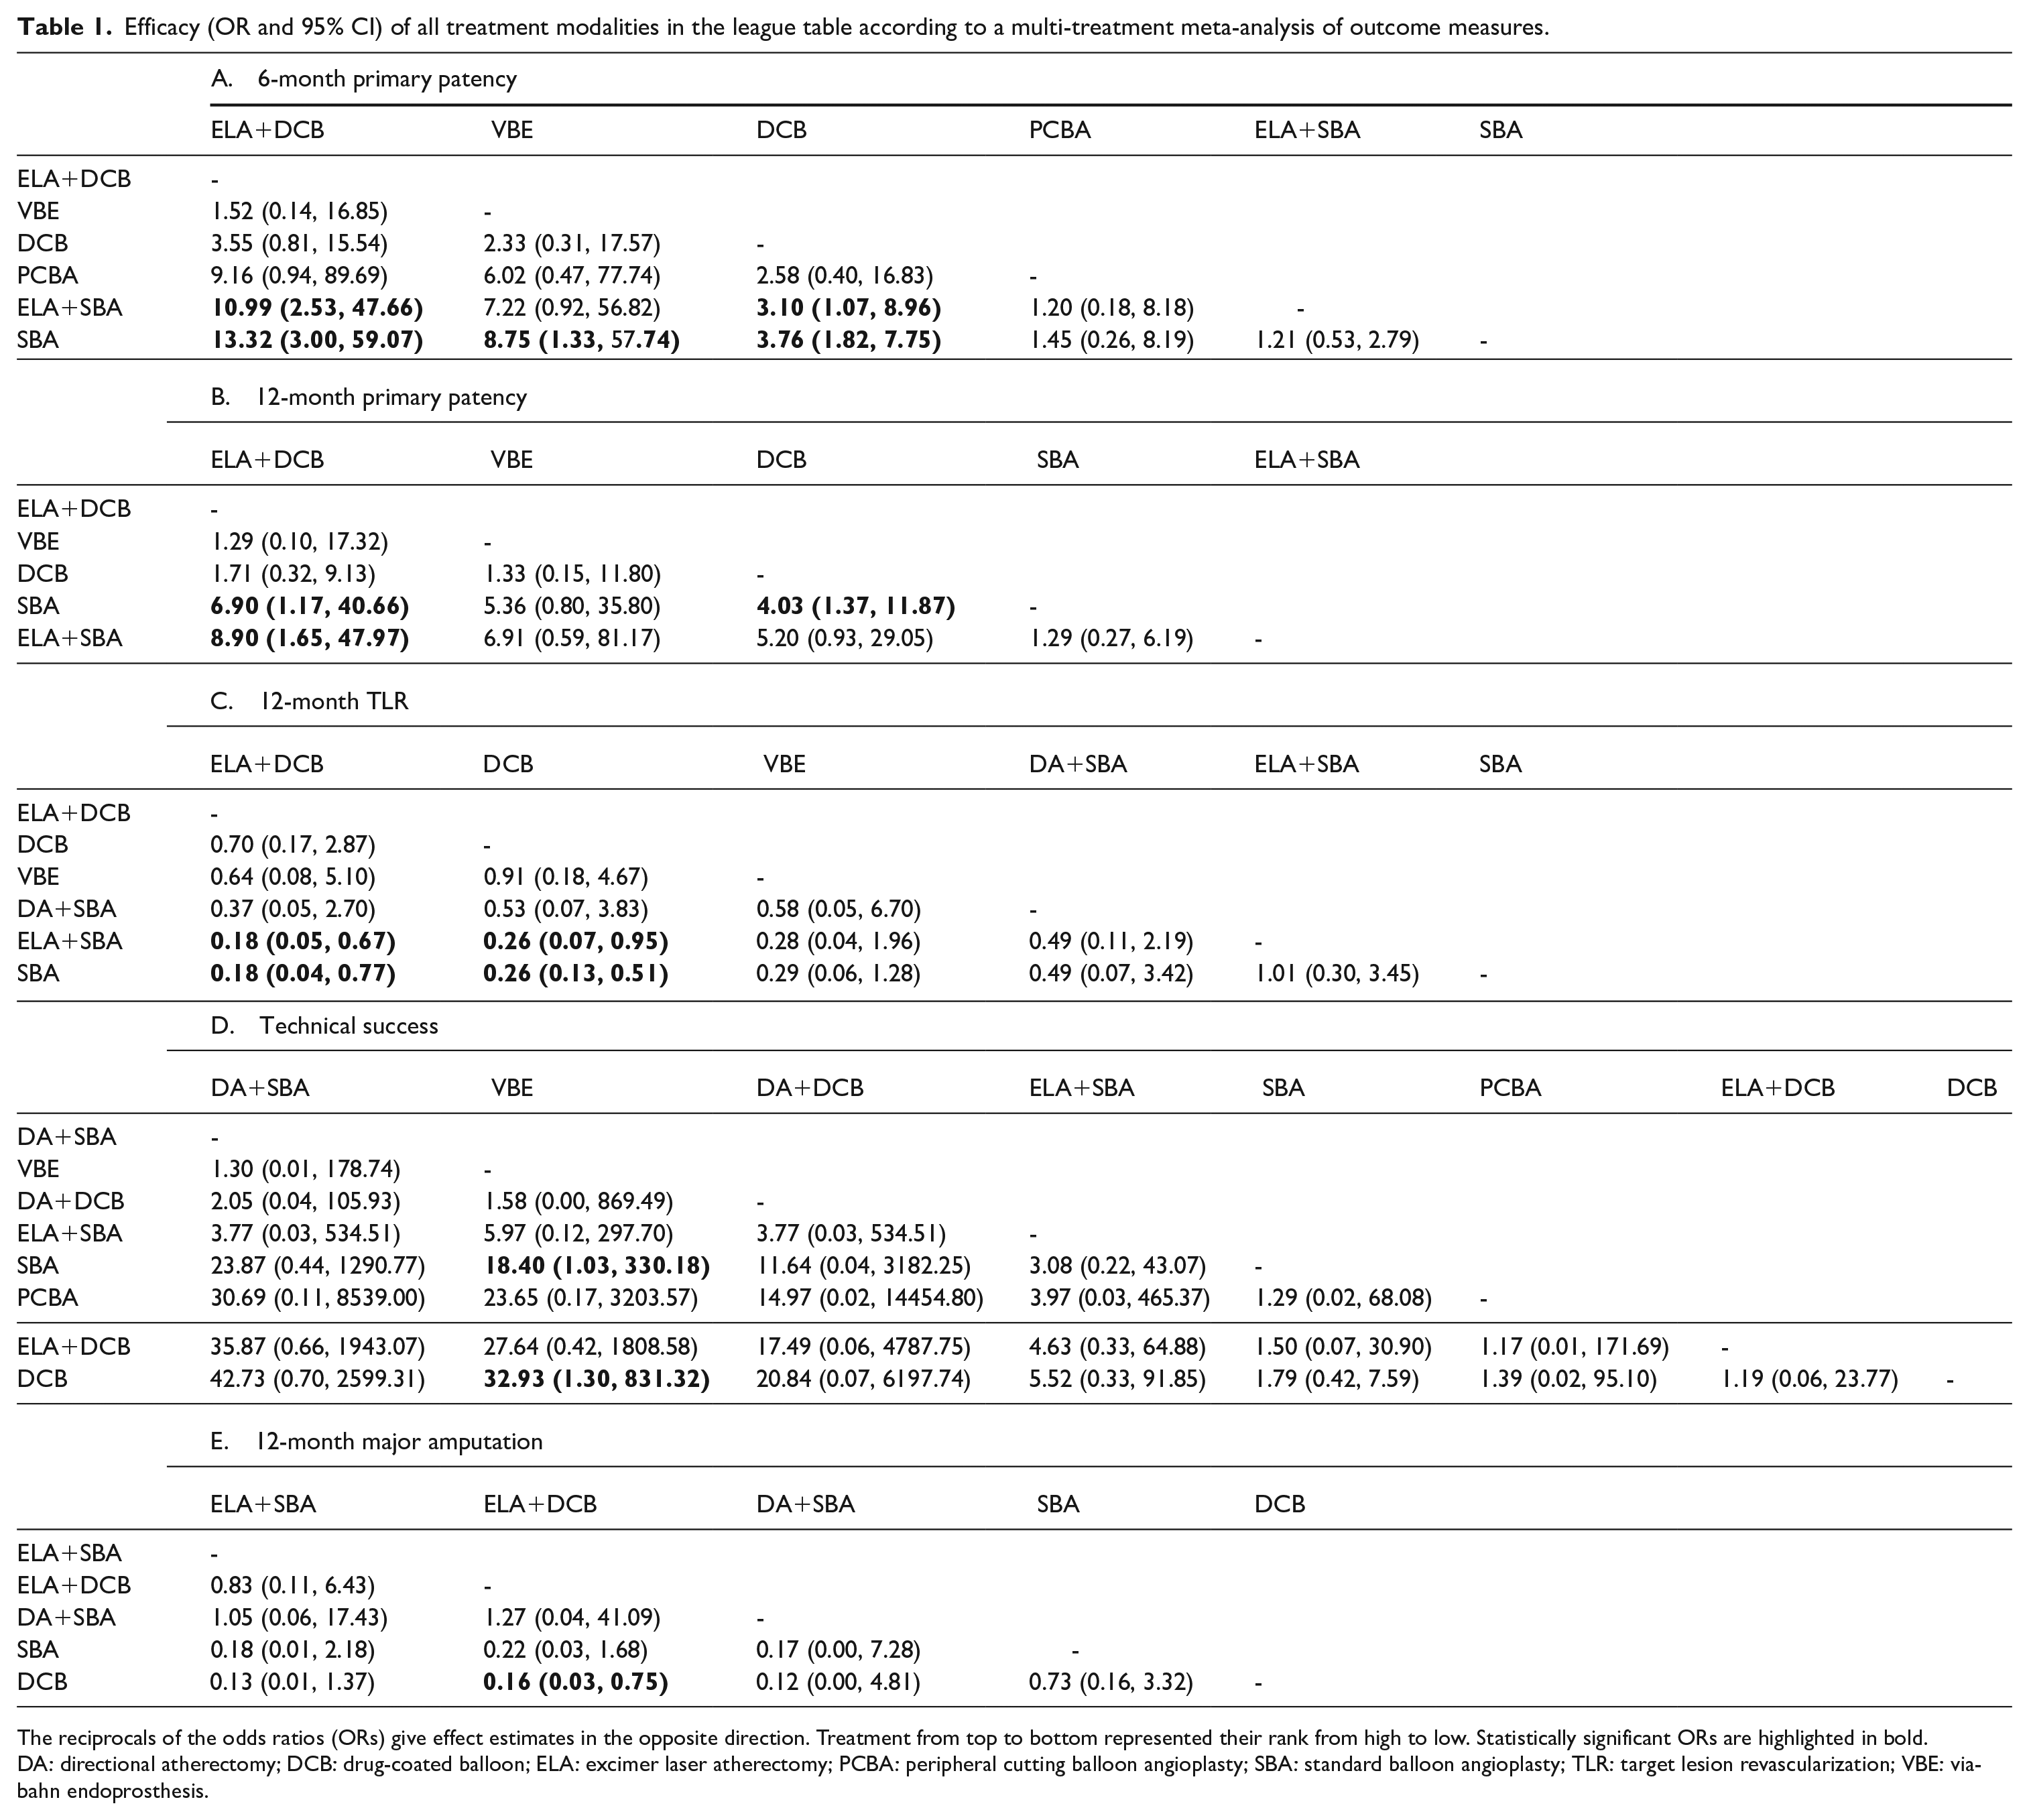
The reciprocals of the odds ratios (ORs) give effect estimates in the opposite direction. Treatment from top to bottom represented their rank from high to low. Statistically significant ORs are highlighted in bold. DA: directional atherectomy; DCB: drug-coated balloon; ELA: excimer laser atherectomy; PCBA: peripheral cutting balloon angioplasty; SBA: standard balloon angioplasty; TLR: target lesion revascularization; VBE: viabahn endoprosthesis.
Network meta-analysis
Primary patency (at 6 months)
The results of the primary patency rates (at 6 months) were reported in 10 articles with six interventions (Figure 3A). ELA+DCB (OR 10.99, 95% CI 2.53, 47.66) and DCB (OR 3.10, 95% CI 1.07, 8.96) had higher primary patency rates (at 6 months) than ELA+SBA. The primary patency rates (at 6 months) were significantly higher for ELA+DCB (OR 13.32, 95% CI 3.00, 59.07), VBE (OR 8.75, 95% CI 1.33, 57.74), and DCB (OR 3.76, 95% CI 1.82, 7.75) than for SBA. No significant result was found in other comparisons (Table 1A and Supplementary Figure 2A).
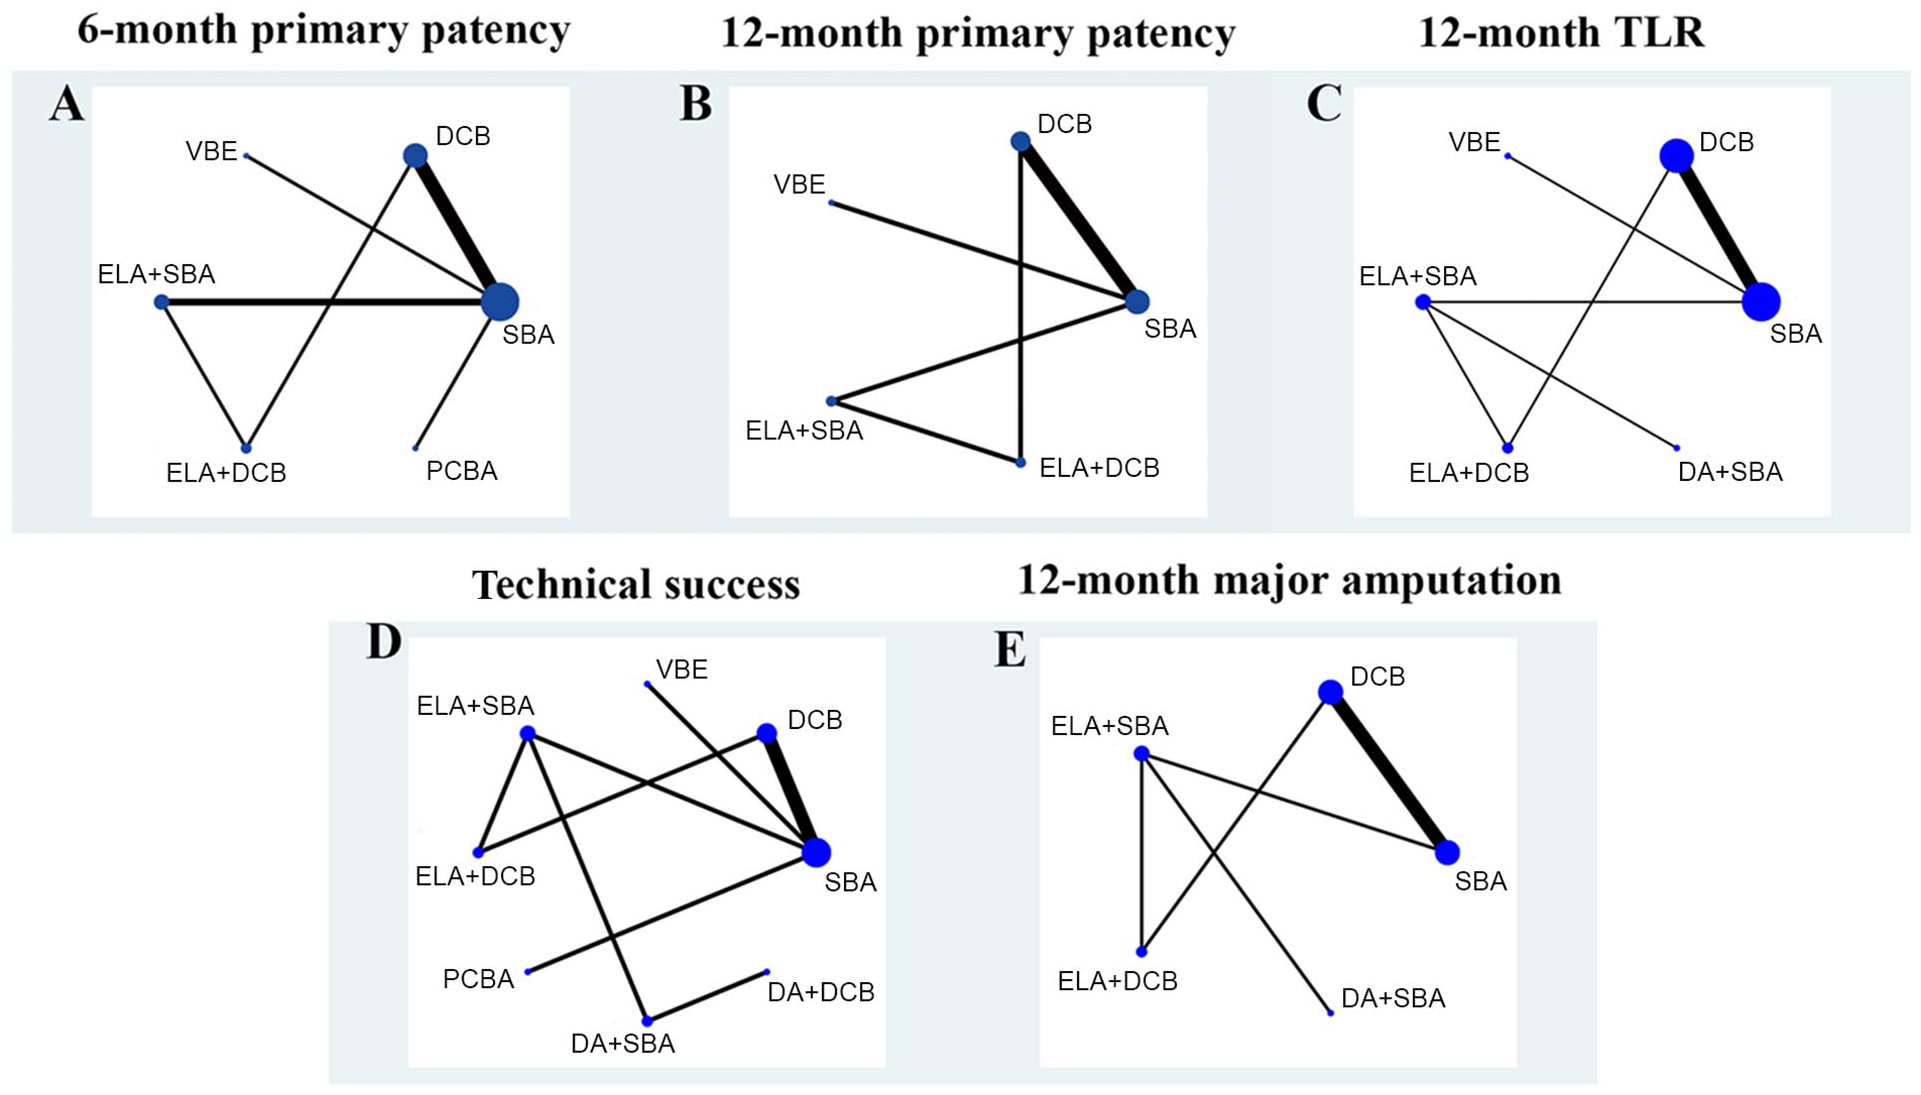
Network plot for all outcome measures. The network plot visualizes the evidence base and provides a concise description of its features. It consists of nodes representing the interventions being compared and lines representing direct comparisons between the interventions. Nodes are weighted according to the allocated patient population, and lines are weighted according to the number of trials available. The size of each circle is proportional to the sample size of interventions. The thicker the line, the more studies exist between the two nodes. When the objective is to examine comparative effectiveness of
The comparison-adjusted funnel plot for primary patency (at 6 months) is presented in Supplementary Figure 4A. We did not find significant asymmetry by our observation of the ‘comparison-adjusted’ funnel plot. The p-value for Begger’s test was > 0.05. It cannot yet be assumed that there is a publication bias or a small-study effect. The loop-specific analysis (SBA–DCB–ELA+SBA–ELA+DCB) indicated no significant result (Inconsistency factor (IF) = 1.82; 95% CI 0.00, 4.85; p = 0.23) (Supplementary Figure 3A). The node-splitting analysis did not produce significant results (all p-values > 0.227) (Supplementary Table 2A). The SUCRA values are presented in Supplementary Figure 1A and listed as follows: ELA+DCB (SUCRA = 91.1), VBE (SUCRA = 80.9), DCB (SUCRA = 61.4), PCBA (SUCRA = 30.2), ELA+SBA (SUCRA = 22.9), and SBA (SUCRA = 13.6). Then, we ranked in descending order the treatments based on the following values: ELA+DCB ranked 1, VBE ranked 2, DCB ranked 3, PCBA ranked 4, ELA+SBA ranked 5, and SBA ranked 6 (Supplementary Table 3A).
Primary patency (at 12 months)
The primary patency rates (at 12 months) were reported in seven articles with five interventions (Figure 3B). The primary patency rates (at 12 months) were significantly higher for ELA+DCB (OR 6.90, 95% CI 1.17, 40.66) and DCB (OR 4.03, 95% CI 1.37, 11.87) than for SBA. ELA+DCB (OR 8.90, 95% CI 1.65, 47.97) had higher primary patency rates (at 12 months) than ELA+SBA. No significant result was found in other comparisons (Table 1B and Supplementary Figure 2B).
The loop-specific analysis (SBA–DCB–ELA+SBA–ELA+DCB) indicated no significant result (IF = 2.08; 95% CI 0.00, 5.54; p = 0.23) (Supplementary Figure 2B). The node-splitting analysis did not produce significant results (all p-values > 0.226) (Supplementary Table 2B). The SUCRA values are presented in Supplementary Figure 1B and listed as follows: ELA+DCB (SUCRA = 82.3), VBE (SUCRA = 73.0), DCB (SUCRA = 65.7), SBA (SUCRA = 17.3), and ELA+SBA (SUCRA = 11.7). We ranked the treatments in descending order based on the following values: ELA+DCB ranked 1, VBE ranked 2, DCB ranked 3, SBA ranked 4, and ELA+SBA ranked 5 (Supplementary Table 3B).
Target lesion revascularization (at 12 months)
The TLR results were reported in 11 articles with six interventions (Figure 3C). ELA+DCB (OR 0.18, 95% CI 0.05, 0.67) and DCB (OR 0.26, 95% CI 0.07, 0.95) had lower TLR rates than ELA+SBA. The TLR rates were significantly lower for ELA+DCB (OR 0.18, 95% CI 0.04, 0.77) and DCB (OR 0.26, 95% CI 0.13, 0.51) than for SBA. No significant findings were found in other comparisons (Table 1C and Supplementary Figure 2C).
The comparison-adjusted funnel plot for TLR is presented in Supplementary Figure 4B. We did not find significant asymmetry by our observation of the ‘comparison-adjusted’ funnel plot. The p-value for Begger’s test was > 0.05. It cannot yet be assumed that there is a publication bias or a small-study effect. The loop-specific analysis (SBA–DCB–ELA+SBA–ELA+DCB) indicated no significant result (IF = 2.28; 95% CI 0.00, 4.57; p > 0.05) (Supplementary Figure 3C). The node-splitting analysis did not produce significant results (all p-values > 0.058) (Supplementary Table 2C). The SUCRA values are presented in Supplementary Figure 1C and listed as follows: ELA+DCB (SUCRA = 83.4), DCB (SUCRA = 71.6), VBE (SUCRA = 65.8), DA+SBA (SUCRA = 46.8), ELA+SBA (SUCRA = 16.2), and SBA (SUCRA = 16.2). Then, we ranked the treatments in descending order based on the following values: ELA+DCB ranked 1, DCB ranked 2, VBE ranked 3, DA+SBA ranked 4, ELA+SBA ranked 5, and SBA ranked 6 (Supplementary Table 3C).
Technical success
The results of technical success were reported in 10 articles with eight interventions (Figure 3D). The technical success rates were significantly higher for VBE than SBA (OR 18.40, 95% CI 1.03-330.18) and DCB (OR 32.93, 95% CI 1.30-831.32). No significant finding was found in other comparisons (Table 1D and Supplementary Figure 2D).
The comparison-adjusted funnel plot for technical success is presented in Supplementary Figure 4C. We did not find significant asymmetry by our observation of the ‘comparison-adjusted’ funnel plot. The p-value for Begger’s test was > 0.05. It cannot yet be assumed that there is a publication bias or a small-study effect. The loop-specific analysis (SBA–DCB–ELA+SBA–ELA+DCB) indicated no significant differences (IF = 0.41; 95% CI 0.00, 6.46; p = 0.894) (Supplementary Figure 3D). The node-splitting analysis did not produce significant results (all p-values > 0.893) (Supplementary Table 2D). The SUCRA values are presented in Supplementary Figure 1D and are listed as follows: DA+SBA (SUCRA = 83.3), VBE (SUCRA = 80.4), DA+DCB (SUCRA = 68.2), ELA+SBA (SUCRA = 55.0), SBA (SUCRA = 34.6), PCBA (SUCRA = 32.4), ELA+DCB (SUCRA = 25.8), and DCB (SUCRA = 20.2). Then, we ranked the treatments in descending order based on the following values: DA+SBA ranked 1, VBE ranked 2, DA+DCB ranked 3, ELA+SBA ranked 4, SBA ranked 5, PCBA ranked 6, ELA+DCB ranked 7, and DCB ranked 8 (Supplementary Table 3D).
Major amputation (at 12 months)
The results of major amputation were reported in eight articles with five interventions (Figure 3E). The major amputation rates were only observed to be significantly lower for ELA+DCB (OR 0.16, 95% CI 0.03, 0.75) than for DCB. No other significant results were found in other comparisons (Table 1E and Supplementary Figure 2E).
The loop-specific analysis (SBA–DCB–ELA+SBA–ELA+DCB) indicated no significant result (IF = 3.58; 95% CI 0.00, 8.68; p = 0.169) (Supplementary Figure 3E). The node-splitting analysis did not produce significant results (all p-values > 0.169) (Supplementary Table 2E). The SUCRA values are presented in Supplementary Figure 1E and listed as follows: ELA+SBA (SUCRA = 73.1), ELA+DCB (SUCRA = 70.3), DA+SBA (SUCRA = 68.5), SBA (SUCRA = 24.5), and DCB (SUCRA = 13.6). Then, we ranked the treatments in descending order based on the following values: ELA+SBA ranked 1, ELA+DCB ranked 2, DA+SBA ranked 3, SBA ranked 4, and DCB ranked 5 (Supplementary Table 3E).
Sensitivity analysis
This NWM included 10 RCTs and four observational studies. We performed a sensitivity analysis including RCTs only to confirm that the same options consistently rank at the top to make our results more convincing. The network plot for all outcome measures of the 10 RCTs is shown in Supplementary Figure 5. The node-splitting analysis did not produce significant results (all p-values > 0.05) (Supplementary Table 7). Plots of the SUCRAs for all treatments of the 10 RCTs are shown in Supplementary Figure 6. The predictive interval plot and league table indicated the efficacy (odds ratio and 95% CI) for all treatment modalities of the 10 RCTs (Supplementary Table 5 and Supplementary Figure 7). According to the above results, we found that ELA+DCB ranked first in primary patency (at 6 and 12 months), TLR (at 12 months), and major amputation (at 12 months). In addition, we ranked treatments overall based on SUCRAs values for the main outcome measures: 6-month primary patency, 12-month primary patency, 12-month TLR, and 12-month major amputation (Supplementary Figure 8). The result showed that ELA+DCB ranked first overall, and the total score was far higher than other treatments.
Discussion
A total of 10 RCTs and four retrospective studies were included in this NWM. The included studies were of high quality and low bias as the JADAD scores of all 10 RCTs were ⩾ 4 and the NOS scores were ⩾ 7 in all four retrospective studies. This NWM revealed significant differences among different intervention treatment approaches for femoropopliteal ISR disease. In contrast to traditional meta-analyses, network meta-analyses make comparisons between the results of two or more studies. The strength of NWM is the accuracy of the estimates and the output of the relative ranking of all treatment results. 23 To the best of our knowledge, there has been no NWM comparing various endovascular treatments for femoropopliteal ISR disease. Therefore, the first NWM provides an essential reference for developing clinical practice guidelines or the design of future RCTs. The 2017 European Society for Vascular Surgery guideline recommended DCB for femoropopliteal ISR as Class IIB, Level B evidence. 2 The 2018 American College of Cardiology/American Heart Association guidelines for the management of lower-extremity peripheral artery disease issues did not recommend the treatment of ISR in the femoropopliteal artery. 24 In 2018, a meta-analysis of 28 RCTs (4663 patients) by Katsanos et al. reported long-term all-cause mortality in the treatment of femoropopliteal artery lesions with DCB and SBA. Compared with the control group, DCB had a significant increase in all-cause mortality at 2 years (7.2% vs 3.8%) and 5 years (14.7% vs 8.1%). 25 However, several subsequent multicenter, large, sample retrospective studies evaluated the safety of drug-coated devices and concluded that there was insufficient evidence of increased long-term patient mortality associated with drug-coated devices.26–29
In terms of primary patency rates (at 6 and 12 months) and TLR (at 12 months), ELA+DCB was significantly better than SBA and ELA+SBA and had the highest probability of being the most effective treatment. ELA+DCB was significantly better than DCB for major amputations (at 12 months), ranking second. The results showed that ELA+DCB showed positive encouraging results in primary patency (6, 12 months), TLR, and major amputation in femoropopliteal ISR. In 2020, Tong et al. conducted a meta-analysis to compare the efficiency and safety of DCB and ELA with SBA in patients with femoropopliteal ISR. The results showed that DCB (patency: relative risk (RR) 2.38, 95% CI 1.71, 3.30, p < 0.01; freedom from TLR: RR 1.56, 95% CI 1.33, 1.82, p < 0.01) and ELA (patency: RR 2.25, 95% CI 1.14, 4.44, p < 0.05; freedom from TLR: RR 1.59, 95% CI 1.12, 2.25, p = 0.01) were superior in terms of primary patency rates and freedom from TLR compared to SBA at the 12-month follow-up. 30
ELA and DCB are performed without the need for an additional stent layer. Therefore, ELA and DCB should be superior to other percutaneous strategies and may provide more opportunities for subsequent treatment.31,32 The debulking procedures in combination with other treatment modalities can provide better primary patency after revascularization.33,34 ELA can remove calcified plaque and intimal hyperplasia in the stent, decrease recoil before balloon inflation, enlarge the effective lumen and provide better vascular preparation for DCB. Moreover, the uptake and retention of paclitaxel at the lesion site can be promoted by modifying plaques and the formation of micropores. Thus, allowing better absorption of the drug into the vessel wall and allowing it to be more effective in inhibiting intimal hyperplasia from achieving better long-term patency rates.35,36
We found that patients in studies that included ELA had a longer mean lesion length, with critical limb ischemia (CLI) and Tosaka III having a higher proportion by further analyzing the closed-loop evidence (ELA+DCB vs ELA+SBA vs SBA vs DCB) (Supplementary Table 3). Gandini et al. compared ELA+DCB versus DCB only for long femoropopliteal in-stent occlusions (mean lesion length > 200 mm; Tosaka III: 100%). 37 In addition, patients with complex lesions accounted for a low proportion in DCB versus SBA studies.38–42 In other words, DCBs and SBAs may be less effective in treating femoropopliteal artery ISR with complex lesions.
Debulking with atherectomy devices, and especially ELA, plays a vital role in the treatment of femoropopliteal ISR.43,44 Most of the existing studies involved a 1-year follow-up and did not include stent type. Debulking technologies (ELA or DA) combined with DCB in the treatment of femoropopliteal ISR require more exploration in complex lesions, longer follow-up results, and different stent types.
In terms of primary patency rates (at 6 and 12 months), the rate for DCB was significantly higher than that of SBA, ranking third. That of DCB was significantly better than SBA and ELA+SBA for TLR (at 12 months), ranking second. However, in 2020, Doshi et al. conducted a meta-analysis to compare the efficiency of DCB and SBA in patients with femoropopliteal ISR. The results indicated no difference in all-cause mortality or TLR risk for DCB compared to SBA at the 12-month follow-up. 45 However, several meta-analyses and studies have demonstrated the superiority of DCB compared to SBA in treating ISR in the femoropopliteal artery. Inhibition of cell proliferation by local administration reduces the recurrence of restenosis.38,46 Liao et al. designed an RCT that showed superior effects with DCB versus SBA in treating of femoropopliteal ISR, with remarkably higher primary patency (87.9% vs 51.6%; p = 0.001) and lower TLR (6.1% vs 35.5%; p = 0.003). 40 The meta-analysis conducted by Cassese et al. showed that patients treated with DCB (hazard ratio 0.25; 95% CIs 0.14, 0.46; p < 0.001) displayed a lower risk for TLR for 12 months than SBA. 47 Additionally, in this NWM, there were significant advantages of DCB (primary patency at 6 months: OR 3.76, 95% CI 1.82, 7.75; primary patency at 12 months: OR 4.03, 95% CI 1.37, 11.87; TLR: OR 3.86, 95% CI 1.98, 7.52) compared to SBA.
In terms of primary patency rates (at 6 months) and technical success rates, VBE was significantly better than SBA, ranking second. VBE ranked second and third in r primary patency (at 12 months) and TLR (at 12 months), respectively. VBE has shown promising results in primary patency (6, 12 months), TLR, and technical success in femoropopliteal ISR. Lammer et al. conducted a prospective, randomized, single-blind, multicenter study that evaluated 141 patients with symptomatic PAD after treatment with Viabahn or BMS. At 24 months, the primary patency rate of Viabahn was significantly higher than that of BMS, but there was no significant effect on the clinical outcome or reintervention rates. 48 Geraghty et al. compared the 3-year outcomes of complex superficial femoral artery disease intervention using Viabahn to those obtained with BMS. At 3 years, primary patency rates (defined by peak systolic velocity ratio ⩽ 2.0 and no TLR) did not significantly differ between patients treated with the Viabahn stent graft and those who received a bare nitinol stent (24.2% vs 25.9%; p = 0.392). 49 In addition, Viabahn may be prone to stent thrombosis by edge restenosis and virtue of collateral vessel occlusion.50,51 This result is what we need to pay attention to when using Viabahn. More RCTs are needed to confirm the efficacy of VBE treatment.
The NWM indicated that the technical success rates of DA+SBA may be superior to those of other treatments, but the performance in terms of primary patency and TLR is not satisfactory. DA for ISR is off-label use of this device. We consider that this may be related to the fact that removing the proliferating endothelium from the stent may be conservative to ensure safety, resulting in incomplete removal of the proliferating endothelium or plaque. The potential reason for the higher technical success rate with DA+SBA may be the distal vessel Spider filter protection commonly employed when using DA in clinical practice, thus avoiding distal embolus and the slow flow/no reflow phenomenon. On the other hand, SBA could not provide sufficient therapeutic effects. 52 This combined approach needs some large-scale RCTs for further validation.
For outcomes at 12 months, we found that ELA+DCB ranked first in patency, first in TLR at 12 months, and second in major amputation at 12 months. ELA+DCB was more effective than other treatments. We performed a sensitivity analysis including RCTs only to confirm that the same options rank at the top, as well as to make our results more convincing. We found that ELA+DCB ranked first in primary patency (at 6 and 12 months), TLR (at 12 months), and major amputation (at 12 months). We need to focus future studies on combined debulking technologies (especially ELA) and DCB options. Hence, more focused RCTs should be aimed in that direction.
In addition, although ELA+DCB was superior in terms of TLR and major amputations, both from short- and long-term perspectives, the lower technical success rate for ELA+DCB or DCB alone may need further exploration. Therefore, we further analyzed the original data. The study of Bosiers et al. 51 showed that the technical success rate of the VBE group was 100%, and the technical success rate of the SBA group was 81.8% (p = 0.002). The technical success in the other studies was not statistically significant, and their results were similar. In general, the ranking results of technical success had minimal significance.
Drug-eluting stent (DES) is commonly used in the treatment of coronary ISR. 53 However, we found no relevant studies on DES for femoropopliteal ISR. In the motion process, the femoropopliteal artery often needs to deal with challenges such as compression, flexion, extension, bending, and distortion due to the particularity of mechanics. 54 Therefore, stents are at a higher risk of fracture deformation within the femoropopliteal artery.55,56 In addition, the vascular lumen will be narrowed if the stent is inserted inside the stent, and a fracture may occur again.
DES can improve the stimulation of the vascular wall by stents. Moreover, reimplantation of stents will restimulate the wall and lead to intimal hyperplasia. However, other treatments offer more opportunities for postoperative complications. We think this may be the reason why clinicians do not choose DES. However, relevant studies are still needed to verify the effectiveness and safety of DESs in the treatment of femoropopliteal ISR.
It is worth mentioning that intravascular ultrasound (IVUS) is widely used in coronary artery disease and has been increasingly used in recent years for peripheral endovascular procedures.57,58 However, angiography was used in all the studies included in this NWM. Iida et al. performed a retrospective analysis from an extensive multicenter database (1198 limbs in 965 patients, 28% CLI) to explore the efficacy of IVUS imaging and found that the use of IVUS was associated with improved patency rates in the femoropopliteal region. 59 IVUS could contribute to a better understanding of the mechanism of stent failure, which may influence the choice of treatment (i.e. underexpansion versus ISR). 60
Study limitations
First, this NWM included both RCTs and observational studies, although the majority consisted of RCTs. Second, only high-quality comparative studies were included in this meta-analysis, which may have resulted in a low number of included literature for some treatment modalities. Some treatment modalities had only one eligible included study, possibly weakening the results to some extent. Third, the small sample size (n < 50) in the comparison of PCBA with SBA (Dick et al. 2008 8 ) may have affected the veracity of the results. Fourth, most of the included studies did not provide information about the types of stents and the lengths of the stented segments. Therefore, the analysis of this part is missing. Fifth, the network plot shows only one closed loop of evidence (ELA+DCB vs ELA+SBA vs SBA vs DCB). The rest are only indirect comparisons.
Conclusions
In conclusion, this NWM showed that ELA+DCB produced positive, encouraging results in primary patency (6, 12 months), TLR, and major amputation in femoropopliteal ISR. In contrast, SBA appears to be a less effective treatment. The technical success rates of DA+SBA may be superior to those of other treatments, but the performance in terms of primary patency and TLR is not satisfactory. These results may have potential clinical implications that should be considered when developing clinical practice guidelines or the design of future RCTs.
Supplemental Material
sj-pdf-1-vmj-10.1177_1358863X211070327 – Supplemental material for The safety and efficacy of different endovascular treatments for in-stent restenosis of the femoropopliteal artery: A network meta-analysis
Supplemental material, sj-pdf-1-vmj-10.1177_1358863X211070327 for The safety and efficacy of different endovascular treatments for in-stent restenosis of the femoropopliteal artery: A network meta-analysis by Zhipeng He, Haoran Wang, Feng Lin, Wenjie Ding, Ke Chen and Zhigong Zhang in Vascular Medicine
Footnotes
Declaration of conflicting interests
The authors declared no potential conflicts of interest with respect to the research, authorship, and/or publication of this article.
Funding
The study was funded by the Natural Science Research Project of Universities in Anhui Province (KJ2018A0663).
Supplementary material
The supplementary material is available online with the article.
References
Supplementary Material
Please find the following supplemental material available below.
For Open Access articles published under a Creative Commons License, all supplemental material carries the same license as the article it is associated with.
For non-Open Access articles published, all supplemental material carries a non-exclusive license, and permission requests for re-use of supplemental material or any part of supplemental material shall be sent directly to the copyright owner as specified in the copyright notice associated with the article.