
Abstract
The aim of this study was to determine if galectin-3 levels were different between participants with peripheral artery disease (PAD) and controls, and to describe its relationship with markers of early atherosclerosis. Sixty participants were recruited into two groups: a PAD group (n=31), ankle–brachial index (ABI) ⩽0.90 and a normal ABI group (n=29), ABI 1.0–1.4. PAD participants were older (68.6 vs 61.8 years, p=0.037), more commonly men (68% vs 38%, p=0.02), and with more cardiovascular risk factors (p<0.001). Galectin-3 was 22% higher in PAD participants (mean±SD: 17.6±4.7 vs 14.4±4.1 ng/mL, p<0.01). The odds ratio for galectin-3 in PAD to be 1 ng/mL higher than the participants with normal ABI was 1.19, after adjusting by age and gender (p=0.014). High-sensitivity C-reactive protein (hs-CRP) and homeostatic model assessment (HOMA) were positively associated with galectin-3 in the age- and gender-adjusted model, while arterial elasticity and microalbuminuria were not. In conclusion, galectin-3 levels were higher in participants with PAD.
Introduction
Peripheral artery disease (PAD) is a prevalent disease affecting 4% of the population older than 40 years of age 1 and 12–25% of people older than 70 years of age.2,3 It is associated with high cardiovascular mortality, 4 morbidity in other vascular beds, 5 and amputation of the affected limb. 6 The clinical diagnosis is unreliable 7 as patients can be asymptomatic or have atypical leg pain (50%) and still have poor health outcomes. 4
The ankle–brachial index (ABI)8,9 has good specificity (83–99%) and acceptable sensitivity (69–79%) to detect ⩾ 50% stenosis in the arteries,2,9 but damage in the arteries starts before the ABI becomes abnormal. Early detection of PAD could identify a patient in a higher cardiovascular risk category with different cholesterol targets and in need of antiplatelet therapy, lifestyle modification and closer clinical surveillance.2,8,10
Several markers of early vascular disease have been studied. 11 New biomarkers and biomarker panels are being investigated to identify one that is easy to obtain with high sensitivity, specificity, and reliability. Galectin-3 (G3) is a β-galactoside-binding lectin that has been linked to atherosclerosis in animal models 12 and humans, in different vascular beds, 13 including PAD,14–16 where it has been found in pathological samples, 14 and it has been linked with a higher risk of mortality when elevated. 15 However, a direct comparison between PAD and controls without PAD has not been reported.
The aims of this study were to determine if G3 plasma levels were different in participants with PAD and participants without PAD (ABI ⩾1). A secondary aim was to describe the relationship between G3 plasma levels and early markers of atherosclerotic disease (arterial elasticity, high-sensitivity C-reactive protein (hs-CRP), urinary albumin to creatinine ratio (UACR) and the homeostasis model assessment (HOMA)) in our sample of participants with and without PAD.
Methods
Participants
The design and procedures of the study were approved by the Institutional Review Board at the University of Oklahoma Health Sciences Center (OUHSC). Each participant gave written informed consent before initiating his/her participation in this cross-sectional study.
Participants with PAD older than 40 years old were recruited by referrals from the vascular and cardiology clinics at the OUHSC. Normal ABI participants older than 40 years old were consecutively recruited by newspaper advertising. All participants were compensated for their time and travel expenses.
Inclusion criteria for study participation were being 40 years or older and able to give consent. Exclusion criteria were a glomerular filtration rate <15 mL/min per 1.73 m2, active cancer – defined as patients receiving any cancer therapy (chemotherapy, radiation therapy or surgery) within the last 6 months, heart failure, pregnancy, and/or infusion of anti-murine antibodies within the last 6 months.
Based on the ABI results and medical history, as described below, participants were divided in two groups: (1) PAD participants: ABI equal to or below 0.9 in either leg, with or without claudication or revascularization; (2) non-PAD participants (i.e. controls): ABI between 1.0 and 1.39 in both legs and no history of claudication or lower extremity revascularization.
Participants were evaluated at the Exercise Physiology Laboratory in the O’Donoghue Research Building at OUHSC under basal conditions after overnight fasting, without caffeine intake or smoking and before any strenuous exercise. Participants were instructed to take their usual medications.
Demographic information, height, weight, cardiovascular risk factors, comorbid conditions, blood pressure and a list of current medications were obtained from a physical exam and medical history.
ABI was obtained after the participants rested for 10 minutes in the supine position in a quiet environment. The systolic blood pressure (SBP) was obtained from the brachial artery in each arm, dorsalis pedis arteries and posterior tibialis arteries in each leg. The ABI was calculated as the higher of the two SBP of each leg (dorsalis pedis or posterior tibialis) divided by the highest of the brachial SBP in either arm as previously described. 9 The SBP was measured using the appropriate size blood pressure cuff for the arms, and 10-cm width cuffs in the ankles, using a continuous wave bidirectional Doppler and probe (Model MD6; DE Hokanson, Inc., Belleview, WA, USA) and an aneroid sphygmomanometer. The test-retest intra-class reliability coefficient for the measurement of ABI in our laboratory is r=0.96 for ABI. 17
Measurements
Blood samples were obtained by venipuncture of an antecubital vein, collected in vacutainers after overnight fasting. Urine samples were collected by the patients. The hs-CRP, glucose, insulin, cholesterol, low-density lipoprotein (LDL), triglycerides, creatinine, and albuminuria and creatininuria were analyzed in the central laboratory at OUHSC. Samples for G3 were obtained in an ethylenediamine tetraacetic acid (EDTA) tube, centrifuged, aliquoted and stored at −80°C, and were analyzed in batches.
G3 was measured using a commercially available enzyme linked immunosorbent assay (ELISA): the G3 assay (BG Medicine, Waltham, MA, USA). The test uses a rat monoclonal antibody against mouse galectin-3. At the epitope for the assay there is 100% homology between mouse and human G3. To avoid cross reactivity, patients receiving any other murine antibody within 6 months were excluded
Samples, standardization dilutions and kit controls were run in duplicates (e.g. each sample, standard or control, was tested in two wells in each plate). Participant samples were allocated in the plates following a randomly generated order, and the operator performing the ELISAs was blind to the ABI and clinical variables. The plates were read with the Synergy 2 multi-detection microplate reader (BioTek Instruments Inc., Winooski, VT, USA) and standardization curves were generated by the built-in software using a 4-parameter logistic method. This ELISA has a low within-run, run-to-run and day-to-day variability (less than 10% in all cases) and G3 levels demonstrated linearity between observed and expected values in the range between 0.96 ng/mL and 130 ng/mL.18,19
Arterial elasticity was determined by diastolic pulse contour analysis (DPCA) with the HD/PulseWaveTM CR-2000 Research CardioVascular Profiling System (Hypertension Diagnostics, Eagan, MN, USA). A blood pressure cuff appropriately sized was placed on the left upper arm of the participant. The right wrist was immobilized with a rigid wrist stabilizer in the neutral supine position. The arterial HD/PulseWave sensor was placed on the skin directly over the radial artery at the point of the strongest pulse by palpation, overlaying a bony prominence. 20 The non-invasive acoustic sensor was adjusted to the highest relative signal strength. Then the blood pressure was measured on the left with an oscillometric blood pressure cuff and the arterial waveform was recorded on the right wrist for 30 seconds at a rate of 200 per second, and subsequently analyzed with the software algorithm based on a modified Windkessel model. 21 Measurements were averaged over three consecutive trials. To convert values to whole numbers, the units for large arterial elasticity index (LAEI) (ml × mmHg−1) were multiplied by 10, and the units for small arterial elasticity index (SAEI) (ml × mmHg−1) were multiplied by 100. The test-retest intra-class reliability coefficient is r=0.87 for LAEI and r=0.83 for SAEI. 22
The LAEI represents the compliance of the aorta and main branches, and the SAEI represents the compliance of the smaller arteries.
Statistical analysis
Continuous clinical variables were presented as mean ± standard deviation (SD), distributions of variables with a skewed distribution were summarized using the median and interquartile range (IQR), and categorical variables were expressed as percentages.
Comparisons between PAD participants and normal ABI participants were made using a Student’s t-test for continuous, normally distributed variables, and a Wilcoxon rank sum test for variables with a skewed distribution. Categorical variables were compared between groups using a chi-squared or Fisher’s exact test if at least 20% of the expected frequency counts were less than five or if there were any zero counts in cross-tabulation categories.
The strength of the linear associations between pairs of continuous variables was quantified using Spearman’s correlation coefficient, as some of the variables were not normally distributed. The linear associations were analyzed for the entire group and after stratifying by gender and PAD or control status.
Logistic regression modeling was used to estimate the odds of higher G3 in PAD versus normal ABI participants with and without adjustment for age and gender. Imbalances in age and gender between the cases and controls were adjusted for in the analyses using regression modeling. Age was divided into two groups at the median: ⩾65 years old and <65 years old.
Linear regression modeling was performed for SAEI, hs-CRP, UACR and HOMA as dependent variables and G3 as an independent variable. The regression coefficients were estimated in the simple model and after adjustment for age and gender. SAEI, hs-CRP and HOMA were transformed with the natural log, due to their skewed distribution and violation of the assumptions of constant variance and normal distribution of the residuals. The analysis of the residuals of UACR, after taking the natural log transformation, did not satisfy the assumptions for linear regression, and thus the variable was categorized into two groups at the median value of the sample: high UACR ⩾5 versus low UACR <5, and logistic regression modeling was used.
Confounders were defined as those factors that changed the odds ratio (OR) of the G3 independent factor by more than 10% for a logistic regression model and those that changed the regression coefficient for G3 by more than 10% for a linear regression model.
Given the exploratory nature of the project, no formal adjustment was made for other variables such as cardiovascular risk factors, medication use, ABI or biomarkers, with the exception of hs-CRP, which was included as an additional independent factor in the model of PAD status as a function of G3. 23
The sample size was calculated to have a power of 80% to detect a difference of G3 levels of 5 ng/mL between PAD and controls, assuming that the controls will have G3 levels of 11±3 ng/mL 18 and the levels in PAD patients may be similar to the lower end of patients with heart failure (15±5 ng/mL). Asuming that 30% of the variability in case–control status can be explained by confounding factors, we estimated that we needed a sample size of 30 participants in each group to allow for adjustment for confounders. 24
A two-sided p-value ⩽0.05 was considered significant. Statistical analyses were performed with SAS (SAS System for Windows, version 9.3; SAS Institute Inc., Cary, NC, USA).
Results
Clinical characteristics
We enrolled 60 participants: 31 cases with PAD and 29 with normal ABI. The participants with PAD were older (p=0.037), more frequently men (p=0.021), and had a higher prevalence of cardiovascular risk factors (Table 1).
Clinical characteristics of participants with peripheral artery disease (PAD) and participants with a normal ankle–brachial index (ABI ⩾1).
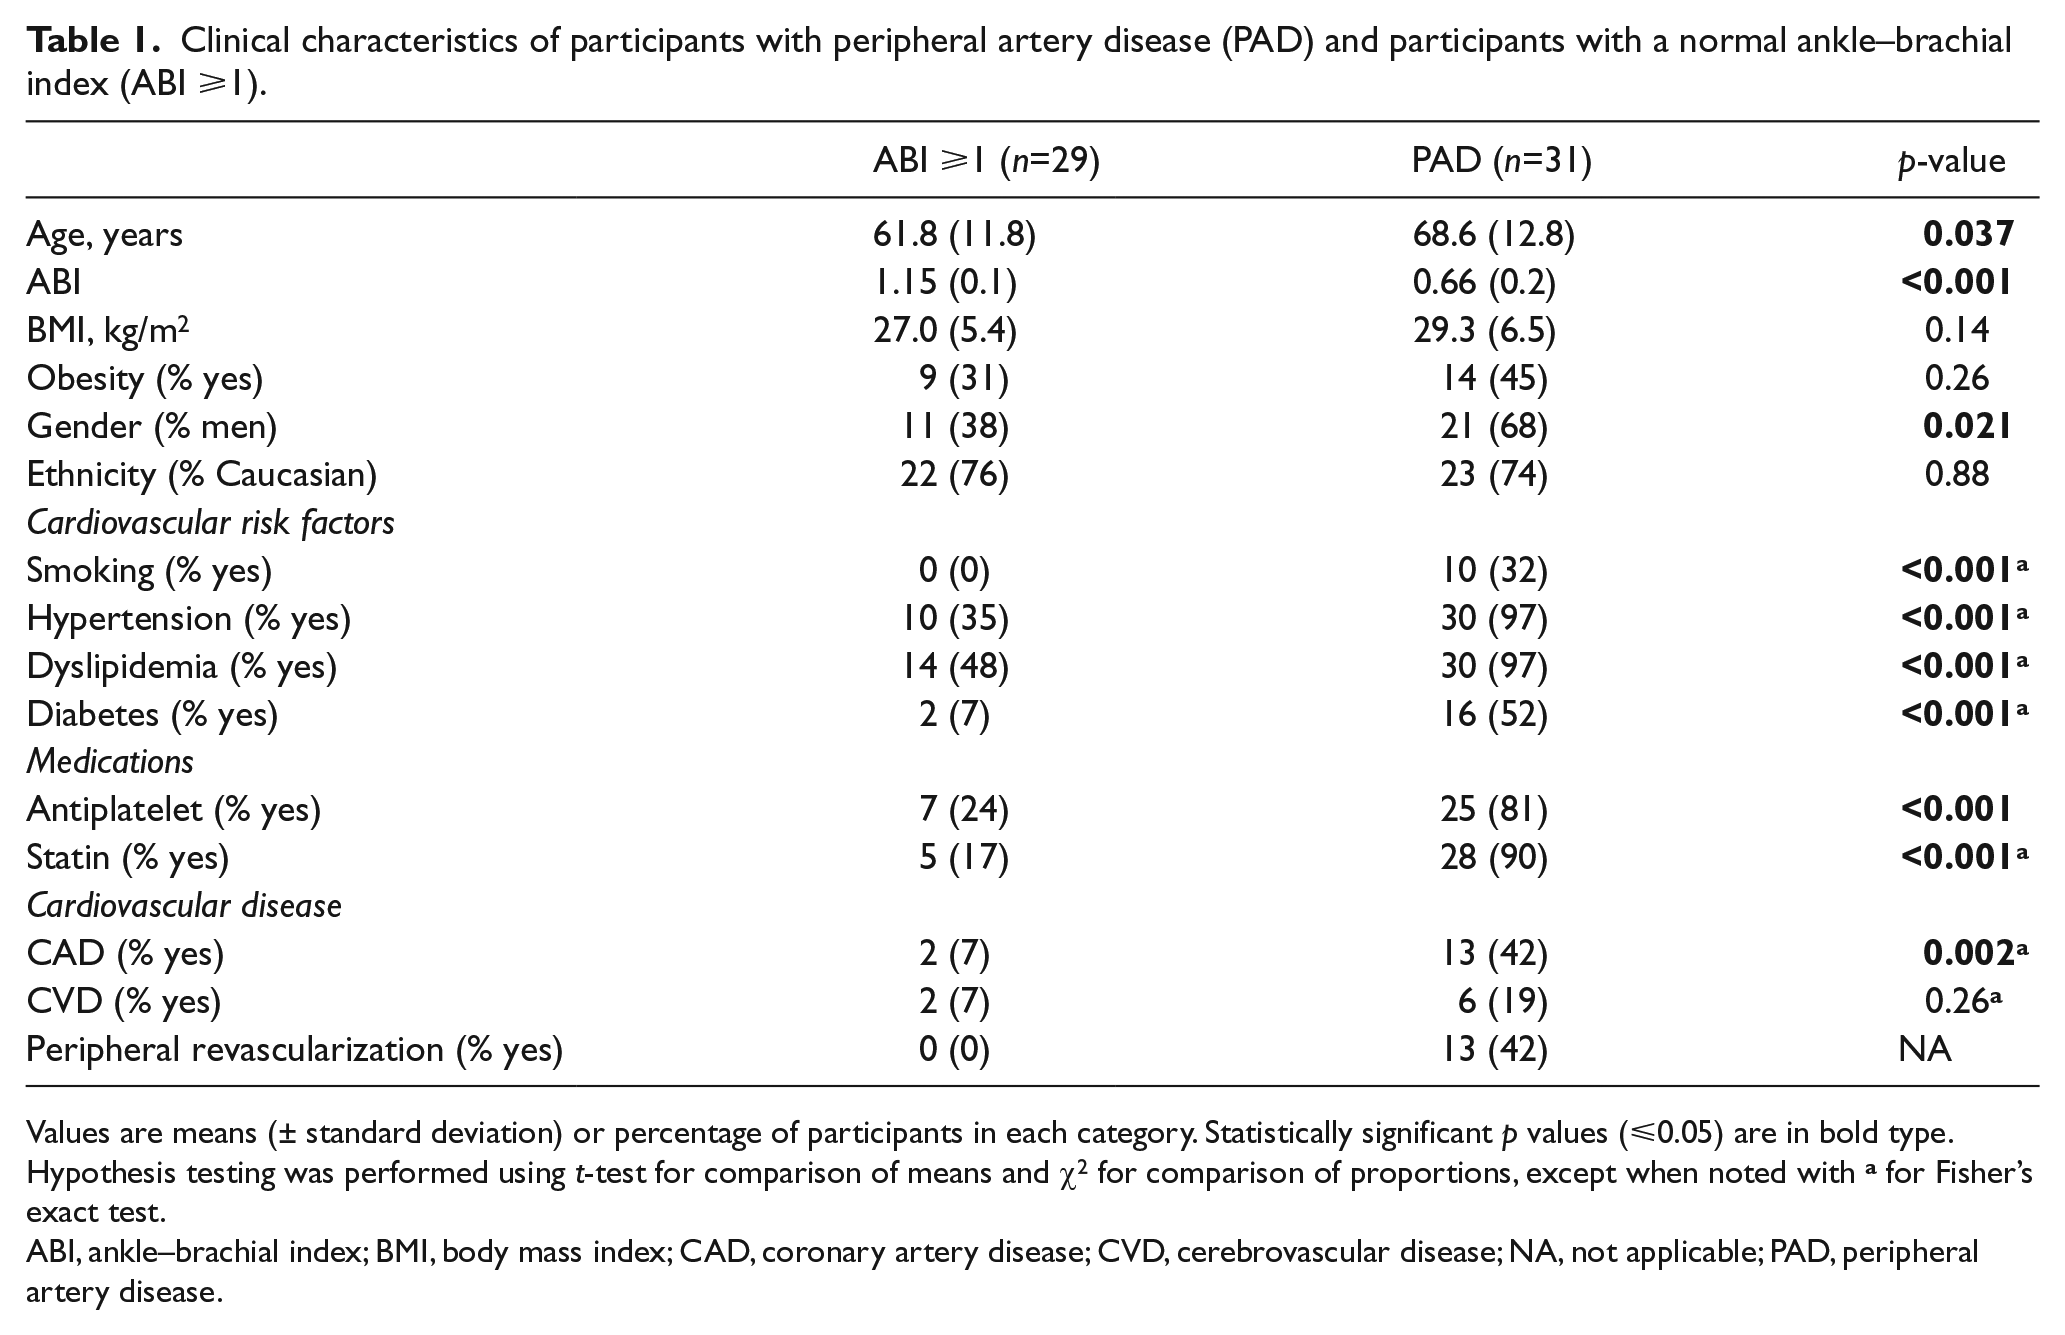
Values are means (± standard deviation) or percentage of participants in each category. Statistically significant p values (⩽0.05) are in bold type.
Hypothesis testing was performed using t-test for comparison of means and χ2 for comparison of proportions, except when noted with a for Fisher’s exact test.
ABI, ankle–brachial index; BMI, body mass index; CAD, coronary artery disease; CVD, cerebrovascular disease; NA, not applicable; PAD, peripheral artery disease.
As described in Table 2, hs-CRP, UACR and HOMA were elevated in the PAD participants compared with the controls (p<0.05). This association remained statistically significant after adjusting for age and gender. There was no significant difference in SBP, DBP (diastolic blood pressure) or LAEI between the PAD and normal ABI groups. The SAEI was lower in the PAD group (p<0.001) (Table 2), and the association remained significant and in the same direction after adjustment for age ⩾65 and gender (data not shown).
Galectin-3 (G3): Laboratory and vascular measurements of participants with peripheral artery disease (PAD) and participants with normal ABI (ABI ⩾1).
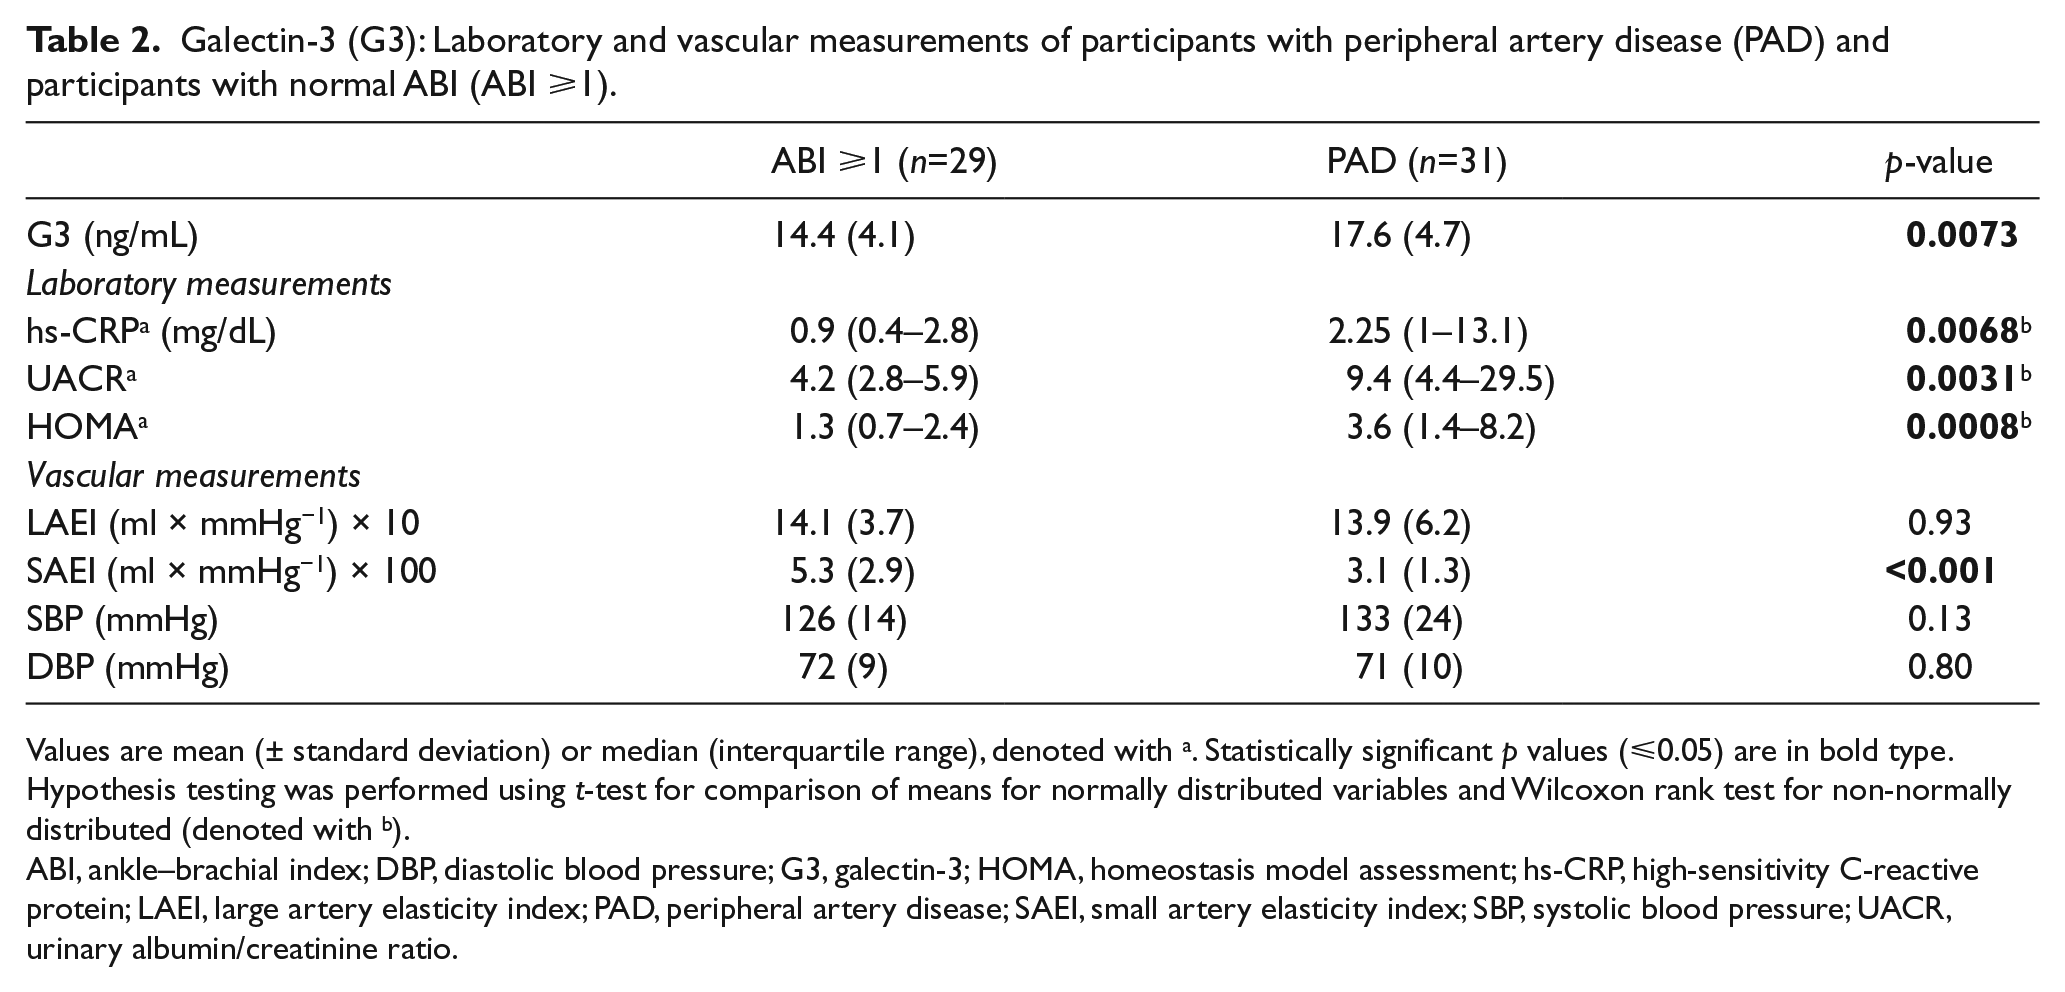
Values are mean (± standard deviation) or median (interquartile range), denoted with a. Statistically significant p values (⩽0.05) are in bold type.
Hypothesis testing was performed using t-test for comparison of means for normally distributed variables and Wilcoxon rank test for non-normally distributed (denoted with b).
ABI, ankle–brachial index; DBP, diastolic blood pressure; G3, galectin-3; HOMA, homeostasis model assessment; hs-CRP, high-sensitivity C-reactive protein; LAEI, large artery elasticity index; PAD, peripheral artery disease; SAEI, small artery elasticity index; SBP, systolic blood pressure; UACR, urinary albumin/creatinine ratio.
Galectin-3
PAD participants had higher levels of G3 (17.6±4.7 ng/mL) compared to the participants with a normal ABI (14.4±4.1 ng/mL) (p=0.0073; Table 2, Figure 1). The associations between G3 and clinical characteristics are shown in Table 3 for continuous variables in the total group. G3 was positively correlated with age, hs-CRP, UACR and HOMA. In the participants with a normal ABI, the only variable that showed a significant correlation with G3 was age. In the PAD group, UACR and HOMA were associated with G3 but age was not. There was no significant difference in G3 levels by gender, obesity, ethnicity, current smoking, history of coronary artery disease (CAD), cerebrovascular disease (CVD) or revascularization (data not shown). However, there was a difference in G3 levels by hypertension, diabetes and dyslipidemia (p<0.05).
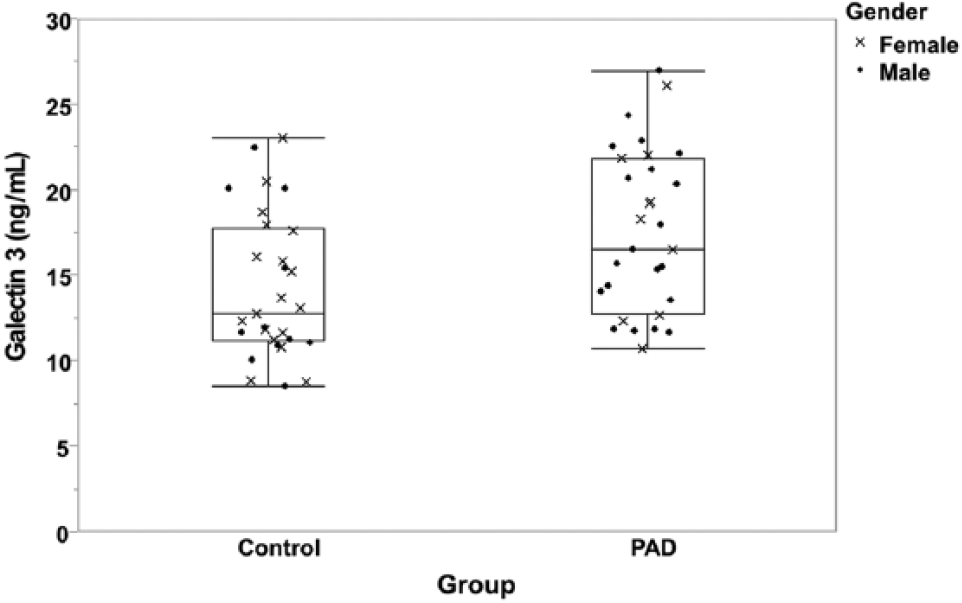
Box plot of the galectin-3 (G3) levels of participants with peripheral artery disease (PAD) and controls.
Correlation between galectin-3 (G3), arterial elasticity, and markers of cardiovascular risk with other variables in the entire sample.
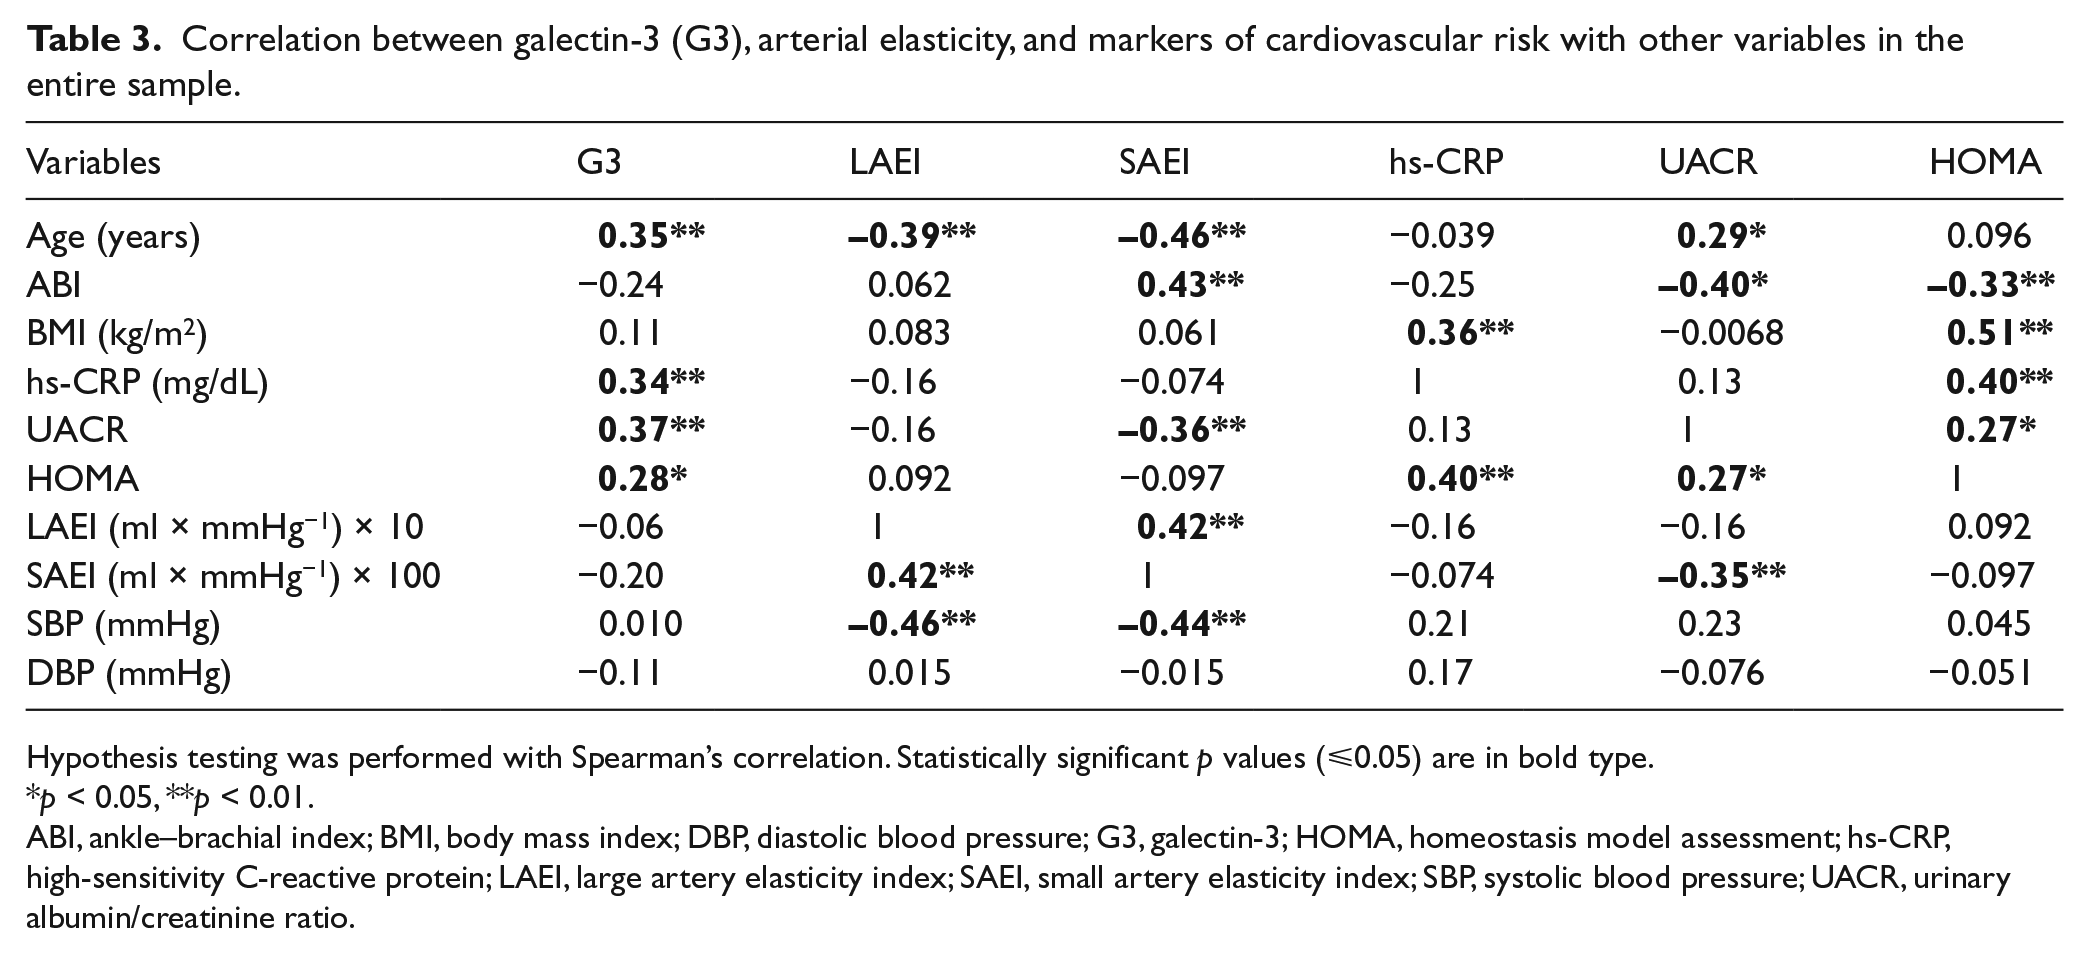
Hypothesis testing was performed with Spearman’s correlation. Statistically significant p values (⩽0.05) are in bold type.
p < 0.05, **p < 0.01.
ABI, ankle–brachial index; BMI, body mass index; DBP, diastolic blood pressure; G3, galectin-3; HOMA, homeostasis model assessment; hs-CRP, high-sensitivity C-reactive protein; LAEI, large artery elasticity index; SAEI, small artery elasticity index; SBP, systolic blood pressure; UACR, urinary albumin/creatinine ratio.
Logistic regression analysis results, adjusting for gender, age and hs-CRP, are presented in Table 4. The odds of having a G3 value 1 ng/mL higher among those with PAD were 1.19 times the odds among those without PAD (ABI ⩾1), after adjusting by age and gender (95% confidence interval (CI) 1.036–1.37). When hs-CRP was included in the model, the association between PAD and G3 was no longer statistically significant; however, there was no indication of confounding by hs-CRP as the OR did not change by more than 10%.
Logistic regression: odds ratio of having peripheral artery disease (PAD) in a model for galectin-3 (G3), and adjusted by age ⩾65, gender, high-sensitivity C-reactive protein (hs-CRP), and a combination of age and gender, and age and hs-CRP.
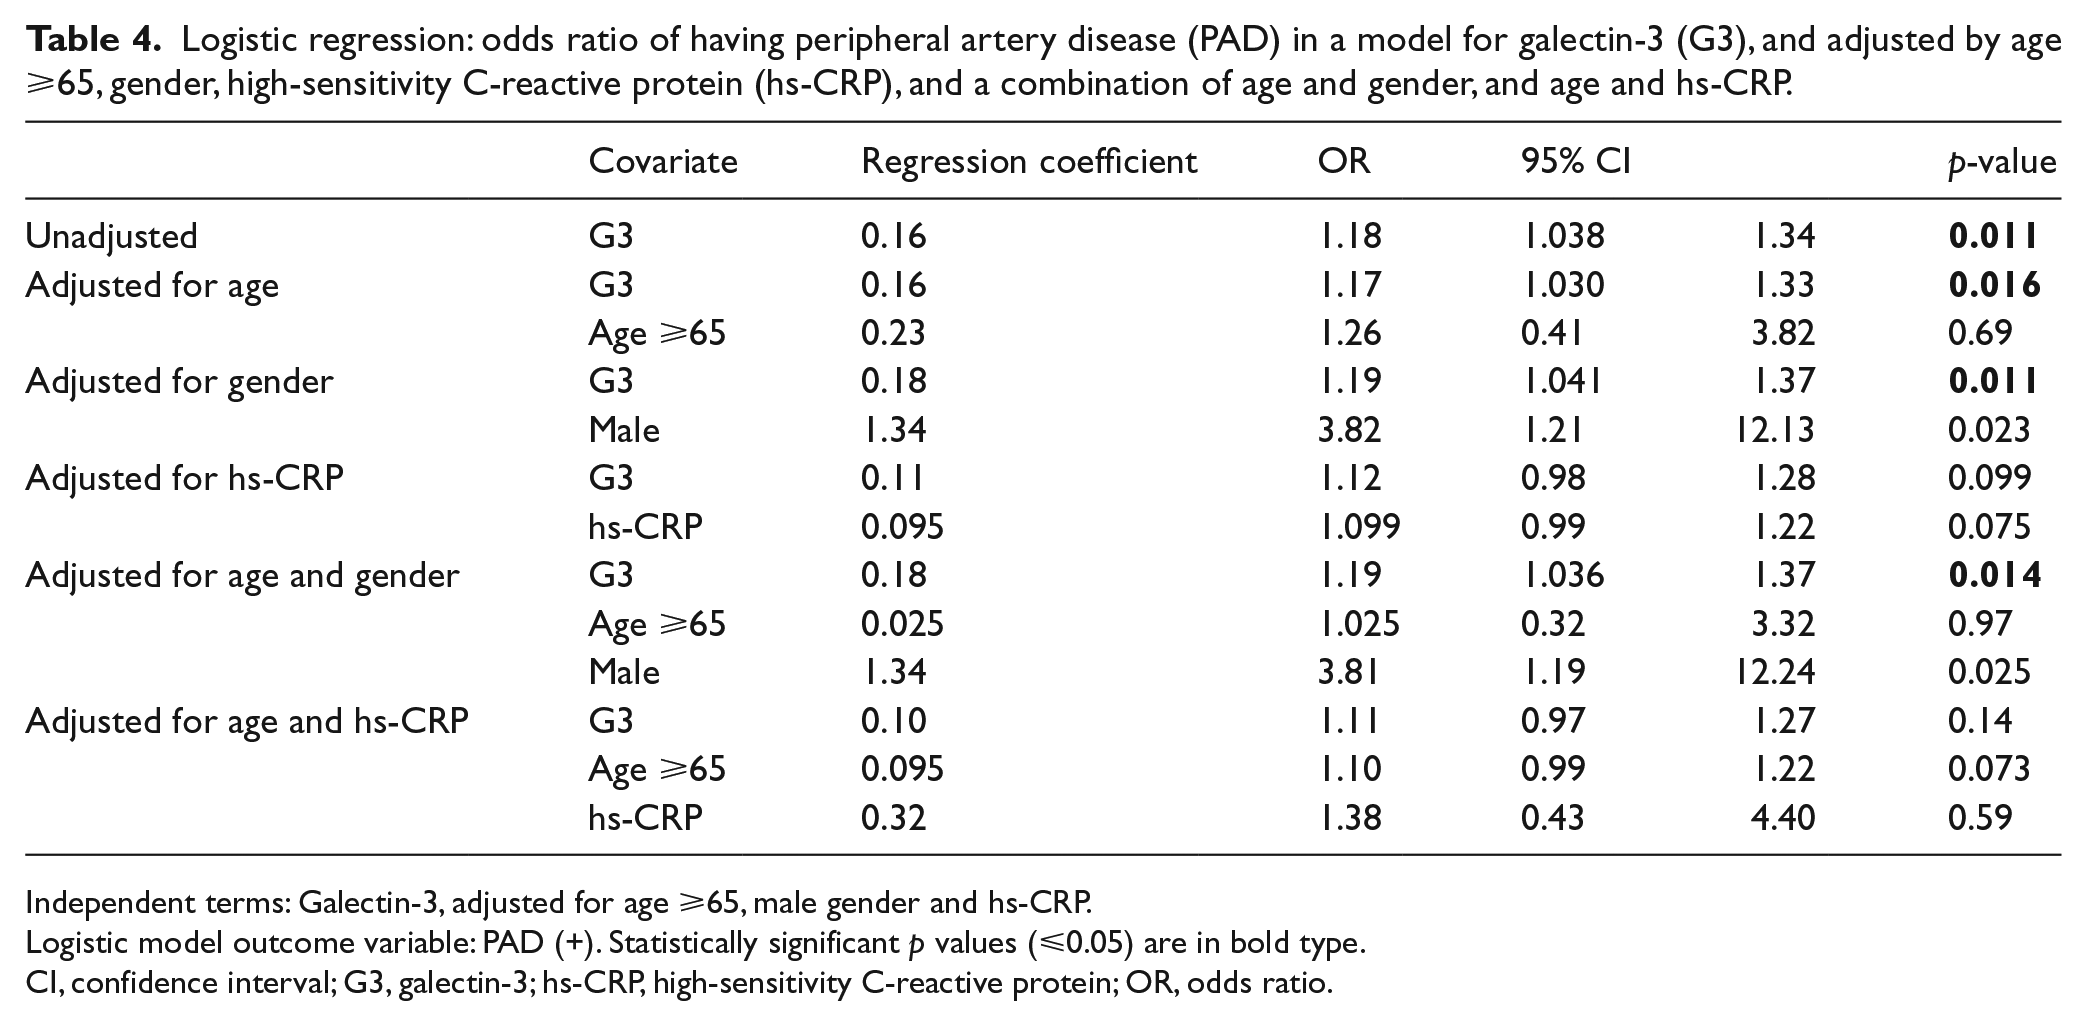
Independent terms: Galectin-3, adjusted for age ⩾65, male gender and hs-CRP.
Logistic model outcome variable: PAD (+). Statistically significant p values (⩽0.05) are in bold type.
CI, confidence interval; G3, galectin-3; hs-CRP, high-sensitivity C-reactive protein; OR, odds ratio.
Arterial elasticity
LAEI was not significantly associated with G3 in the total sample (Table 3), in the PAD group or in the normal ABI group (data not shown), and was not significantly associated with PAD status (Table 2). Although there was an association between SAEI and PAD (Table 2), the association did not remain significant after adjustment for age and gender (data not shown). Furthermore, SAEI was not associated with G3 in the total sample (Table 5) or in subgroups defined by PAD status (data not shown), in the unadjusted model, or after adjustment for age and gender.
Regression model of markers of early arterial disease. Galectin-3 alone and with adjustment for age and gender.
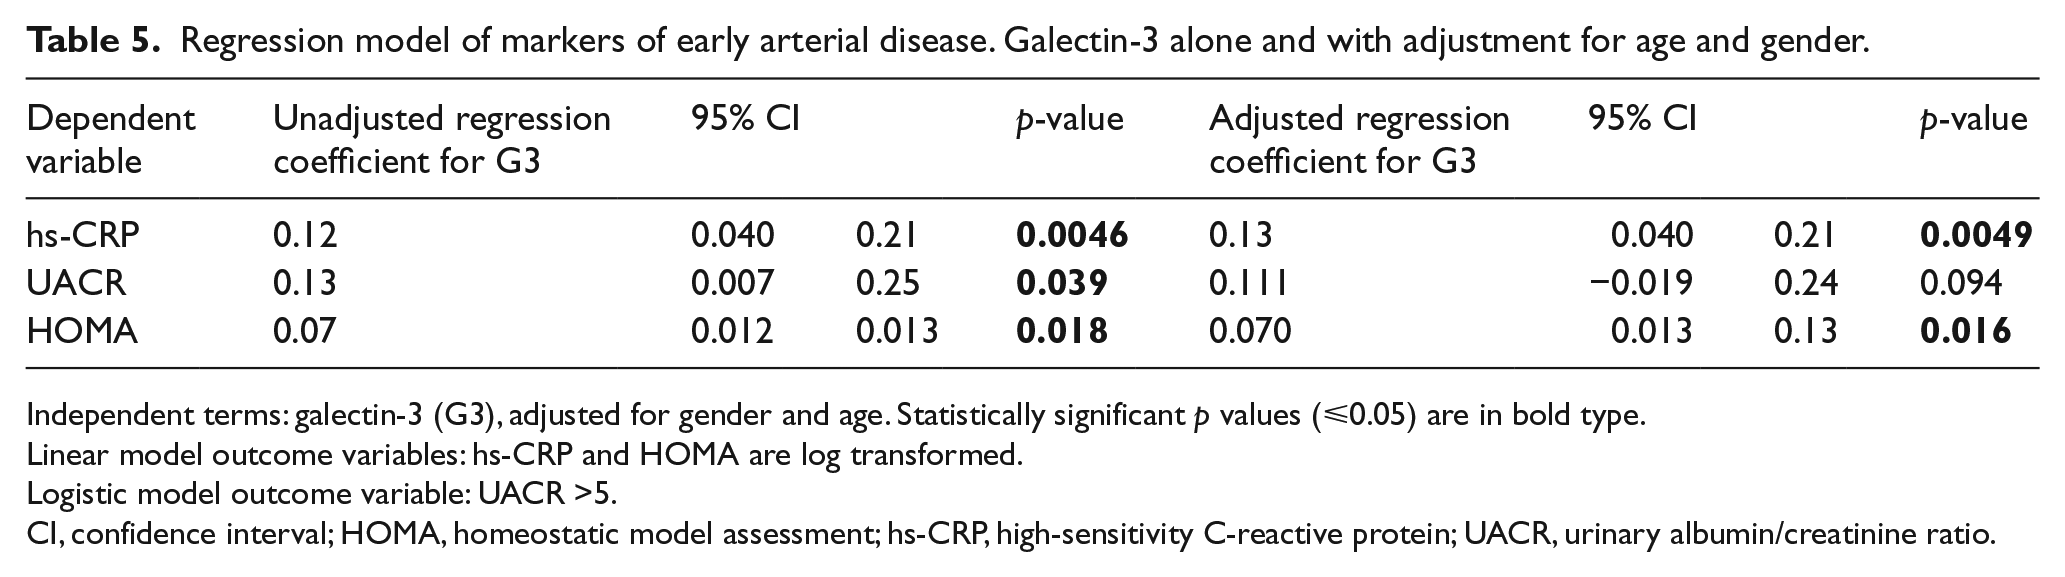
Independent terms: galectin-3 (G3), adjusted for gender and age. Statistically significant p values (⩽0.05) are in bold type.
Linear model outcome variables: hs-CRP and HOMA are log transformed.
Logistic model outcome variable: UACR >5.
CI, confidence interval; HOMA, homeostatic model assessment; hs-CRP, high-sensitivity C-reactive protein; UACR, urinary albumin/creatinine ratio.
Markers of early atherosclerosis
Hs-CRP was associated with G3, and the association remained significant after adjusting by age ⩾65 and gender individually and in combination (Table 5).
Although there was a significant correlation between UACR and G3 in the unadjusted logistic regression model (Table 5), this association was of similar magnitude, but was no longer statistically significant after adjusting for age and gender in the fully adjusted model.
There was a positive association between HOMA and G3 in the unadjusted and fully adjusted model (Table 5).
Discussion
This is the first study comparing G3 levels between participants with and without PAD objectively diagnosed by ABI. G3 levels were found to be higher in participants with PAD compared to those with a normal ABI, even after adjusting for age and gender. In a secondary aim, there was a significant association between G3 and hs-CRP in the regression model adjusted for age and gender.
G3 and PAD
This study directly compared a well-defined group of participants with PAD and participants with an ABI ⩾1. After adjusting for age and gender, we found that the PAD group had significantly higher mean G3 levels by 22% than the normal ABI group. Because we measured G3 in plasma, we cannot directly compare our PAD group with the PAD group of Madrigal-Matute et al., 15 who measured G3 in the serum of 309 participants with PAD, excluding those with critical limb ischemia. Furthermore, only a minority of our patients (n=2) had critical limb ischemia, rendering comparison with the study by Sheu et al. 16 difficult, as the difference in severity of the disease may explain the very high levels of G3 found in their study, including exclusively participants with critical limb ischemia (23.09±4.17 ng/mL) compared to the current investigation (17.6±4.7 ng/mL).
Our control group (ABI ⩾1) had higher G3 levels than previously reported,18,25 with a mean of 14.2 ng/mL and a median of 12.8 ng/mL. In a large population study by De Boer et al., 18 which included 7968 participants, the median G3 level measured with the same method employed by us (ELISA; BG Medicine) was only 10.9 ng/mL. Our levels were higher than in this study, likely because of demographic differences, including age, in which our participants were older. The mean age of our control group was 62 years, which was approximately 12 years older than the control group in the study by De Boer 18 and 5 years older than in the study by O’Seaghdha et al. 25 Furthermore, De Boer et al. 18 found a positive relationship between G3 and age, as age explained nearly 10% of the variance of G3.
As demonstrated in our analyses, age does not fully explain the association between PAD and G3. After adjustment for age, the G3 levels remained significantly higher among participants with PAD compared to participants with an ABI ⩾1. A multivariate analysis in a sample of general population investigating the association between age, gender, body mass index (BMI), triglycerides, creatinine, cystatin-C, hs-CRP and G3 indicated that all of these variables combined only explained 16.3% of the variance of G3. Although this study by De Boer et al. 18 did not evaluate patients for PAD, participants in the highest quintile of G3 had higher prevalence of cardiovascular risk factors, CAD and CVD, suggesting that G3 could be a marker of atherosclerosis. It is also possible that there are other factors influencing G3 levels that are still unknown. When we evaluated the association of PAD and G3 adjusting by hs-CRP, the relationship was no longer statistically significant but this was likely a consequence of our small sample size and not caused by confounding, as the odds ratio value did not change by more than 10% with adjustment for hs-CRP. In summary, the current study indicates that G3 is elevated in participants with PAD defined as an ABI below 0.9. These results support previous findings indicating that G3 may be elevated in atherosclerosis, including CAD and CVD.
G3 and hs-CRP
Hs-CRP is the most extensively used biomarker of inflammation. It is an acute-phase reactant and it is also used to stratify cardiovascular risk in participants without other, traditional cardiovascular risk factors. 26 Hs-CRP is higher in individuals with PAD compared to controls. 27 We found that G3 was positively associated with hs-CRP in our sample, suggesting that G3 may be related to inflammation and atherosclerosis, as suggested by experimental studies. 28 Our finding supports previous work by De Boer et al., 18 who demonstrated a progressive increase of hs-CRP across G3 quintiles. We found a significant association between hs-CRP and G3, which remained significant after adjusting by age and gender. Collectively, these results indicate that G3 may be a useful marker of cardiovascular disease; G3 has a potential advantage over hs-CRP because G3 is less influenced by non-infectious inflammatory states. 29
G3 has been related to other pathophysiological mechanisms besides inflammation, such as fibrosis, apoptosis macrophage differentiation and modulation of adhesion. Also, the distribution of G3 by immunohistochemistry appears to be different based on the vascular bed involved and the characteristics of the plaque. Taking these elements into consideration, it is possible that hs-CRP and G3 could be evaluating different facets of the pathological process of atherosclerosis. It has been hypothesized that G3 may be a marker of plaque burden and plaque stability.
Further studies are needed to determine if G3 offers an advantage over hs-CRP as a marker of increased risk of cardiovascular events in different vascular beds or at different stages of the disease.
G3 and arterial elasticity
We found that G3 was not significantly associated with arterial elasticity in our sample of patients with and without PAD as defined by ABI. Arterial elasticity is a well-recognized marker of arterial disease, and is associated with cardiovascular events and mortality.30,31 Furthermore, arterial elasticity is impaired in patients with PAD. 32 Libhaber et al. 33 found a significant correlation between G3 and carotid-femoral pulse wave velocity, which primarily measures the arterial elasticity of the aorta, in 966 participants of African descent in South Africa. The lack of association between G3 and arterial elasticity in the current study suggests that a global measurement of DPCA fails to detect differences in predominantly large vessels like the aorta. Alternatively, the failure to detect a difference may be due to the smaller sample size of our study or the difference between sample demographics as we included a vast majority of Caucasian participants. In the Multi-Ethnic Study of Atherosclerosis (MESA), African Americans with higher European ancestry had lower arterial elasticity than African Americans with predominantly African ancestry. 34
Limitations
This study has limitations, as participants were volunteers and may represent individuals more interested in their health and less limited by diseases or social factors. The design does not allow us to establish causality. Controls with an ABI ⩾1 were included in the study consecutively, as there were not enough to perform marginal matching by age and gender as intended. The distribution of known cardiovascular risk factors was different and the sample size was too small to allow for adjustments beyond age and gender, thus the results could be affected by confounding. Not surprisingly, the number of diabetics in the normal ABI group was very low, which is expected considering the high prevalence of PAD in the diabetic population and the recruitment sources for the control patients. Because sensitivity of the ABI is suboptimal for early disease. it is likely that some patients in the control group may have been misclassified. Another limitation is related to the method employed to measure arterial elasticity. The European Society of Cardiology recommends using carotid-femoral pulse wave velocity as the first choice for arterial elasticity evaluation, based on reproducibility, accuracy and correlation with clinical outcomes. However, one weakness of that method is that it only measures arterial elasticity of the aorta. The DPCA used in this study has the advantage of providing an estimated arterial elasticity of the large vessels and small vessels through analysis of the refracted waveforms. 35 This is of interest considering that some pathological processes may affect one type of artery more than the other. 36 The DPCA has been validated in human and animal models, in which DPCA compares favorably with invasive measurements of arterial elasticity,35,37 is reproducible 20 and it is associated with cardiovascular outcomes.38,39
Conclusion
This is the first study to describe G3 levels in participants with PAD diagnosed by ABI compared to participants with normal ABI. In conclusion, mean G3 levels were 22% higher in participants with PAD than in controls, and G3 was positively associated with hs-CRP, which remained significant even after adjustment for age and gender. The clinical significance is that G3 is a biomarker associated with other markers of generalized atherosclerosis, and is readily detectable in the peripheral blood. It is plausible that G3 may be used to detect PAD at an early stage of disease; however, this deserves further study.
Footnotes
Acknowledgements
We would like to thank Dr Heather Gornik, from the Cleveland Clinic Foundation, for her helpful comments and review of the manuscript, Polly Montgomery for her invaluable help coordinating the patient scheduling and Fabiola Donna for her dedication and efforts in patient recruitment.
Declaration of conflicting interests
The authors declared no potential conflicts of interest with respect to the research, authorship, and/or publication of this article.
Funding
The authors disclosed receipt of the following financial support for the research, authorship, and/or publication of this article: This work was supported by the National Institute of General Medical Sciences of the National Institute of Health under Award Number U54GM104938. The content is solely the responsibility of the authors and does not necessarily reflect the official views of the National Institutes of Health.