
Abstract
A low ankle–brachial index (ABI) is associated with increased risk for cardiovascular events and mortality. Physical inactivity in individuals with a low ABI may further increase their risk for cardiovascular events. The purpose of this paper is to examine the relationship between the intensity of free-living physical activity and cardiovascular disease (CVD) risk by ABI status. During 2003–2004, the National Health and Nutrition Examination Survey included an accelerometer module and collected ABI data. Individuals were classified as having a normal (1–1.4) or low (< 1) ABI. The Framingham risk score (FRS) was used to determine CVD risk. Multiple linear regression was used to determine the association of total accelerometer counts and time spent at various physical activity intensity levels with FRS by ABI groups. Individuals with a low ABI spent less time engaging in moderate-to-vigorous intensity physical activity (MVPA) (9.1 min/day vs 13.2 min/day; p = 0.06) when compared to those with a normal ABI. There were no differences in light intensity physical activity (LPA) or sedentary behavior between ABI groups. Total accelerometer counts were inversely related to FRS. MVPA, but not LPA, was inversely related to FRS in both normal and low ABI groups (p < 0.001 and p = 0.001, respectively). In conclusion, these findings suggest that even modestly higher levels of physical activity may be beneficial for secondary risk prevention in this high-risk group.
Introduction
A low ankle–brachial index (ABI) is a subclinical measure of cardiovascular disease (CVD) associated with increased risk of future cardiovascular events.1,2 ABI is used in clinical settings to screen individuals for peripheral artery disease (PAD), which may be present with or without exertional leg symptoms (i.e. claudication). 3 Individuals with a low ABI are often less physically active when compared to those with a normal ABI, especially at higher intensities, which is likely due to impaired functional ability and pain caused by claudication.4,5 However, ABI has also been shown to be inversely related to physical activity (PA) even among healthy subjects and individuals with a low normal ABI (< 1.0) who are free from PAD and related symptoms of claudication.5 –7
Lower levels of PA in individuals with a low ABI are concerning because both confer a higher risk for CVD events and mortality.8,9 Studies by Garg and Gardner have shown a significant inverse association between moderate-to-vigorous intensity physical activity (MVPA) and all-cause and CVD-related mortality in individuals with a low ABI,10,11 which highlights the potential benefit of PA for prevention in this population subgroup. However, little is known about the role of light intensity physical activity (LPA) on CVD risk among individuals with a low ABI. Given that individuals with a low ABI may have difficulty sustaining higher intensity activities, examining the role of total movement volume as well as time spent in sedentary and LPA on CVD risk in individuals with a low ABI is particularly important. A better understanding of this relationship could result in a more targeted approach to evidence-based prevention strategies focused on transferring time spent in sedentary pursuits to LPAs in this at-risk population to increase overall movement volume. Therefore, the purpose of this study was to examine the relationship between accelerometer-derived PA with CVD risk in those with normal and low ABIs.
Methods
Population and study design
The National Health and Nutrition Examination Survey (NHANES) is a cross-sectional, surveillance system comprised of non-institutionalized US residents aged 6 years and older. A detailed description of the NHANES design and sampling methodology has been previously described. 12 In brief, NHANES used a stratified, multistage probability design to obtain a nationally representative sample of the US population. NHANES over-sampled participants who were non-Hispanic black, Mexican American, individuals 60 years of age and older, and individuals of low income to increase the reliability and precision of estimates obtained from these population subgroups. The ABI was assessed in individuals over 40 years of age. Individuals were excluded from ABI measures if they had bilateral amputation or other conditions that would interfere with testing. We further excluded individuals who had missing data on PA and relevant covariates (i.e. fasting plasma glucose, smoking status, body mass index (BMI), blood pressure, and lipids) or a history of CVD. The NHANES protocol was approved by the National Center for Health Statistics Institutional Review Board. All participants provided written informed consent at the time of the household interview.
Ankle–brachial index
Trained health technicians in the mobile examination centers performed the ABI examination. Detailed clinical examination procedures can be found elsewhere. 13 In brief, systolic pressure was measured on the right arm and bilateral posterior tibial arteries in both ankles with a Doppler probe while participants rested in a supine position. Right and left ABI were calculated by dividing the highest systolic ankle pressure in each respective ankle by the highest systolic brachial pressure. The lower of the two readings were used in this analysis. Individuals were classified into one of two groups: normal ABI (1–1.4) or low ABI (< 1). A value of < 1 was chosen for low because previous studies have shown these values to be related to an increased risk for functional decline. 4 The small number of individuals with a high ABI (> 1.4, n = 13) were not included in this analysis.
Cardiovascular risk
The Framingham risk score (FRS) was used to estimate CVD risk. The FRS was developed to predict the 10-year risk of developing CVD events using several factors including age, sex, diabetes status, smoking status, treated and untreated systolic blood pressure, and total and high-density lipoprotein cholesterol (HDL-c). FRS predicts the percent risk of developing CVD on a continuous scale. FRS was non-normally distributed and was log-transformed to better conform to assumptions of linear regression analysis.
Physical activity
The ActiGraph AML-7164 accelerometer was used to estimate PA. Individuals were given the uniaxial accelerometer during the examination visit and were asked to wear the monitor on their hip for 7 days during all waking hours; removing the monitor only for showering or water activities. After 7 days, participants mailed the accelerometer back to the lab and data were downloaded onto a computer for processing. Data were screened for wear time using methods reported by Troiano et al. 14 Briefly, device non-wear was defined as 60 consecutive minutes of 0 counts. Wear time was determined by subtracting the derived non-wear time from 24 hours. 15 A minimum of 10 hours of wear time per day on at least 4 of 7 days was required for data to be considered for further use in calculating weekly estimates of PA.
Data output from the ActiGraph accelerometer are activity counts, which quantify the amplitude and frequency of detected accelerations. Activity counts were summed over a 1-minute time interval (i.e. epoch). Total accelerometer counts per day were calculated using summed daily counts detected over wear periods to provide an estimate of movement volume. Times spent per day (min/day) at different intensity levels were estimated based on validated count cut-points.15,16 The resulting PA count ranges were: sedentary (0–99 counts per minute (ct/min)), light (100–1951 ct/min), and moderate-to-vigorous (≥ 1952 ct/min). Since time spent in MVPA was highly skewed, values were log-transformed for subsequent analysis.
Covariates
Participant characteristics such as age, sex, race/ethnicity, and lipid-lowering medication use were collected during the household examination survey. BMI was calculated as weight in kilograms over height in meters squared (kg/m2) collected at the mobile examination center.
Diabetes status was defined by a self-reported diagnosis of diabetes, history of medications used to treat diabetes or a fasting glucose level of ≥ 126 mg/dL. C-reactive protein was measured using latex-enhanced nephelometry (Dade Behring, Deerfield, IL, USA) on a BN II nephelometer at the University of Washington Medical Center, Seattle, WA. Current smoking status was defined as having a serum cotinine level above 3 mg/dL. Lipids (i.e. total cholesterol, HDL-c, low-density lipoprotein cholesterol (LDL-c), and triglycerides) were measured at the Johns Hopkins Hospital, Baltimore, MD using laboratory methods as previously described. 17
Statistical analysis
All analysis was conducted using STATA 9.2 software; a p-value < 0.05 was considered statistically significant. The complex survey design used in NHANES was accounted for in all analysis by using survey command procedures with proper strata clustering and weighting. Non-normally distributed variables were log-transformed. Descriptive characteristics of the population are presented as means and linearized standard errors or medians and 25th and 75th percentiles for continuous variables and percentages for categorical variables. A Wald or chi-squared test was used to detect differences between groups with a normal or low ABI for continuous and categorical variables, respectively. Age-adjusted means for PA estimates were calculated using least squared means. Multiple logistic regression models were used to determine differences in accelerometer-derived PA estimates stratified by ABI group (i.e. normal vs low).
Partition models were used to examine the association between accumulated time spent in specific intensity categories and CVD risk in individuals with a normal and low ABI.18,19 Partition models estimate the unique effect of each intensity category (e.g. light intensity activity) on log-transformed FRS, after adjusting for the effect of the other intensity categories of PA (e.g. sedentary, MVPA). Given that the outcome of interest was risk of developing CVD, individuals with a self-reported history of CVD (e.g. congestive heart failure, coronary heart disease, angina, myocardial infarction and stroke) were excluded from these analyses.
Results
Of the 3299 NHANES participants aged 40 years and older, 3086 were eligible for an ABI assessment. An ABI was obtained on 2082 individuals. The most common reasons for not completing an assessment were the inability to obtain all necessary blood pressure measures (n = 565), participant refusal (n = 139), physical limitations (n = 100), and lack of time (n = 116). Of those with an ABI, 1757 had valid accelerometer data. Fasting blood measures were only performed on those who attended the morning sessions (n = 837). Thus, after removing individuals with missing covariate data or a history of CVD, there were 561 individuals included in the final sample. Individuals who were excluded from this analysis were not significantly different from those included with respect to age, LDL-c, total cholesterol, smoking status, diabetes status, or sex. However, individuals who were excluded were African American, and had increased BMI, C-reactive protein (CRP) levels, pulse pressure, and triglyceride levels when compared to the analytical sample (p < 0.05).
Of the 561 individuals included in the final analytic sample, approximately 17% had a low ABI (Table 1). When comparing clinical and demographic characteristics between ABI groups, individuals with a low ABI had higher pulse pressures and CRP levels, lower HDL, were more likely to be non-white (i.e. black or Mexican American), and more likely to be female than individuals with a normal ABI. Individuals with a low ABI also had a higher FRS compared to individuals with a normal ABI. Both groups were similar with respect to age, BMI, smoking status, systolic and diastolic blood pressure, serum cholesterol levels (i.e. HDL-c, LDL-c, total cholesterol, and triglycerides), use of lipid-lowering medications, and history of CVD (Table 1).
Descriptive and behavioral characteristics and cardiovascular risk factors by ABI group (normal versus low).
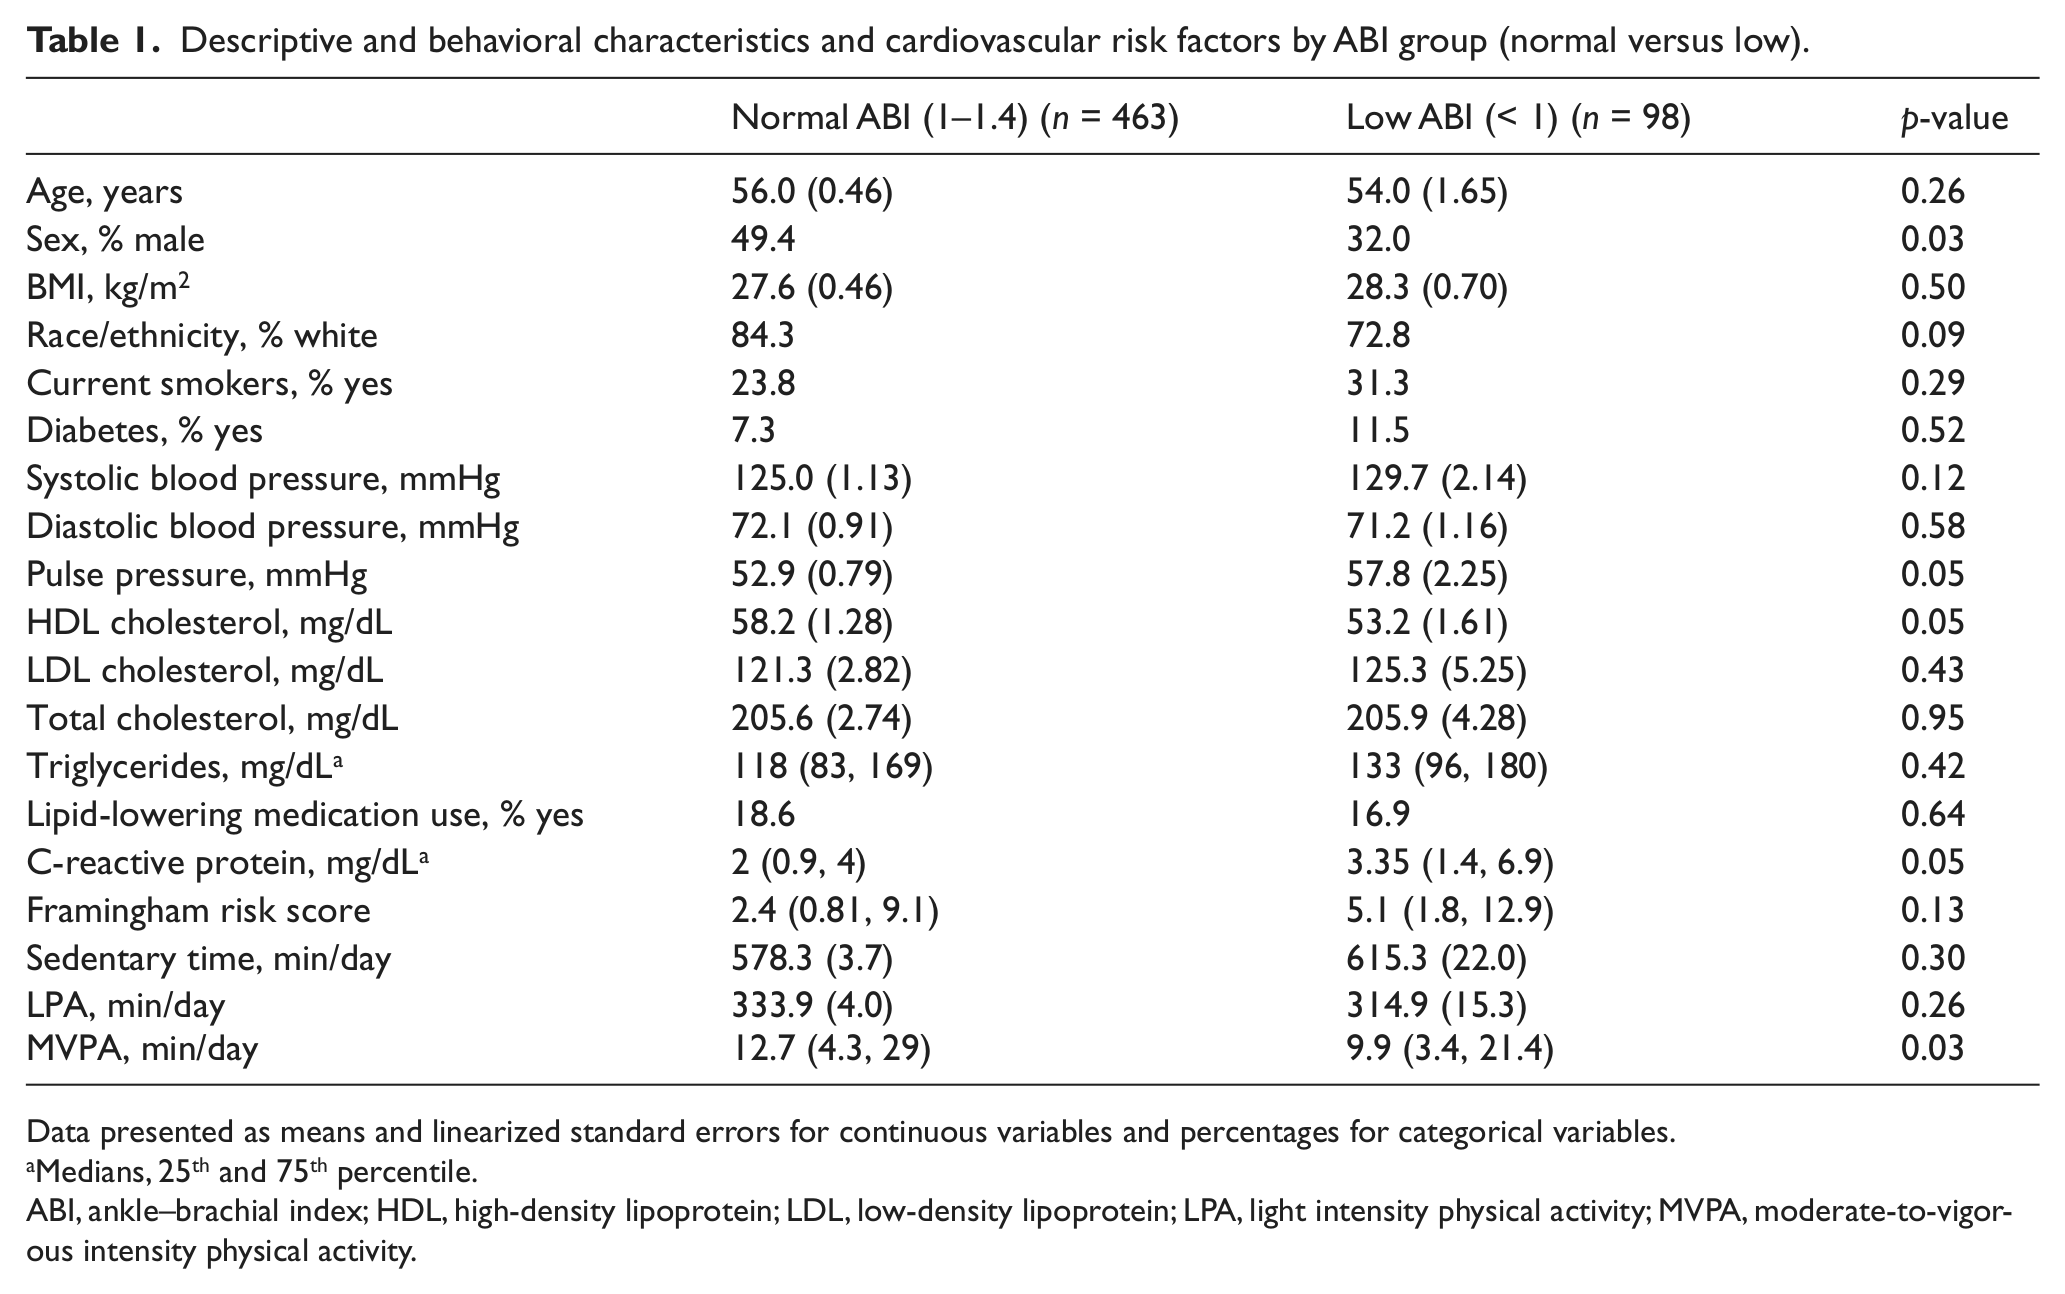
Data presented as means and linearized standard errors for continuous variables and percentages for categorical variables.
Medians, 25th and 75th percentile.
ABI, ankle–brachial index; HDL, high-density lipoprotein; LDL, low-density lipoprotein; LPA, light intensity physical activity; MVPA, moderate-to-vigorous intensity physical activity.
Individuals with a low ABI spent less time per week engaged in MVPA (9 vs 13 min/day; p = 0.06) and spent more time being sedentary (615 vs 578 min/day; p = 0.13) than individuals with a normal ABI; however, this did not reach statistical significance (Table 1). Although not statistically significant, those with a low ABI also spent less time engaging in LPA (314 vs 333 min/day; p = 0.30) when compared to those with a normal ABI.
Higher PA was shown to be related to lower CVD risk, as assessed by the FRS, in both individuals with a normal and low ABI (Table 2). In the single activity models, total accelerometer counts were inversely related to FRS. MVPA was also inversely associated with FRS in those with a normal or low ABI (p < 0.001 and p = 0.001, respectively). More specifically, every 1-minute increase in MVPA per day was associated with a 3.4% and 2.8% lower FRS among individuals with low and normal ABI, respectively. Time spent in sedentary pursuits and in LPA was not significantly related to FRS among individuals with normal or low ABI.
The linear association between log-transformed Framingham risk score and intensity of physical activity by ankle–brachial index group.
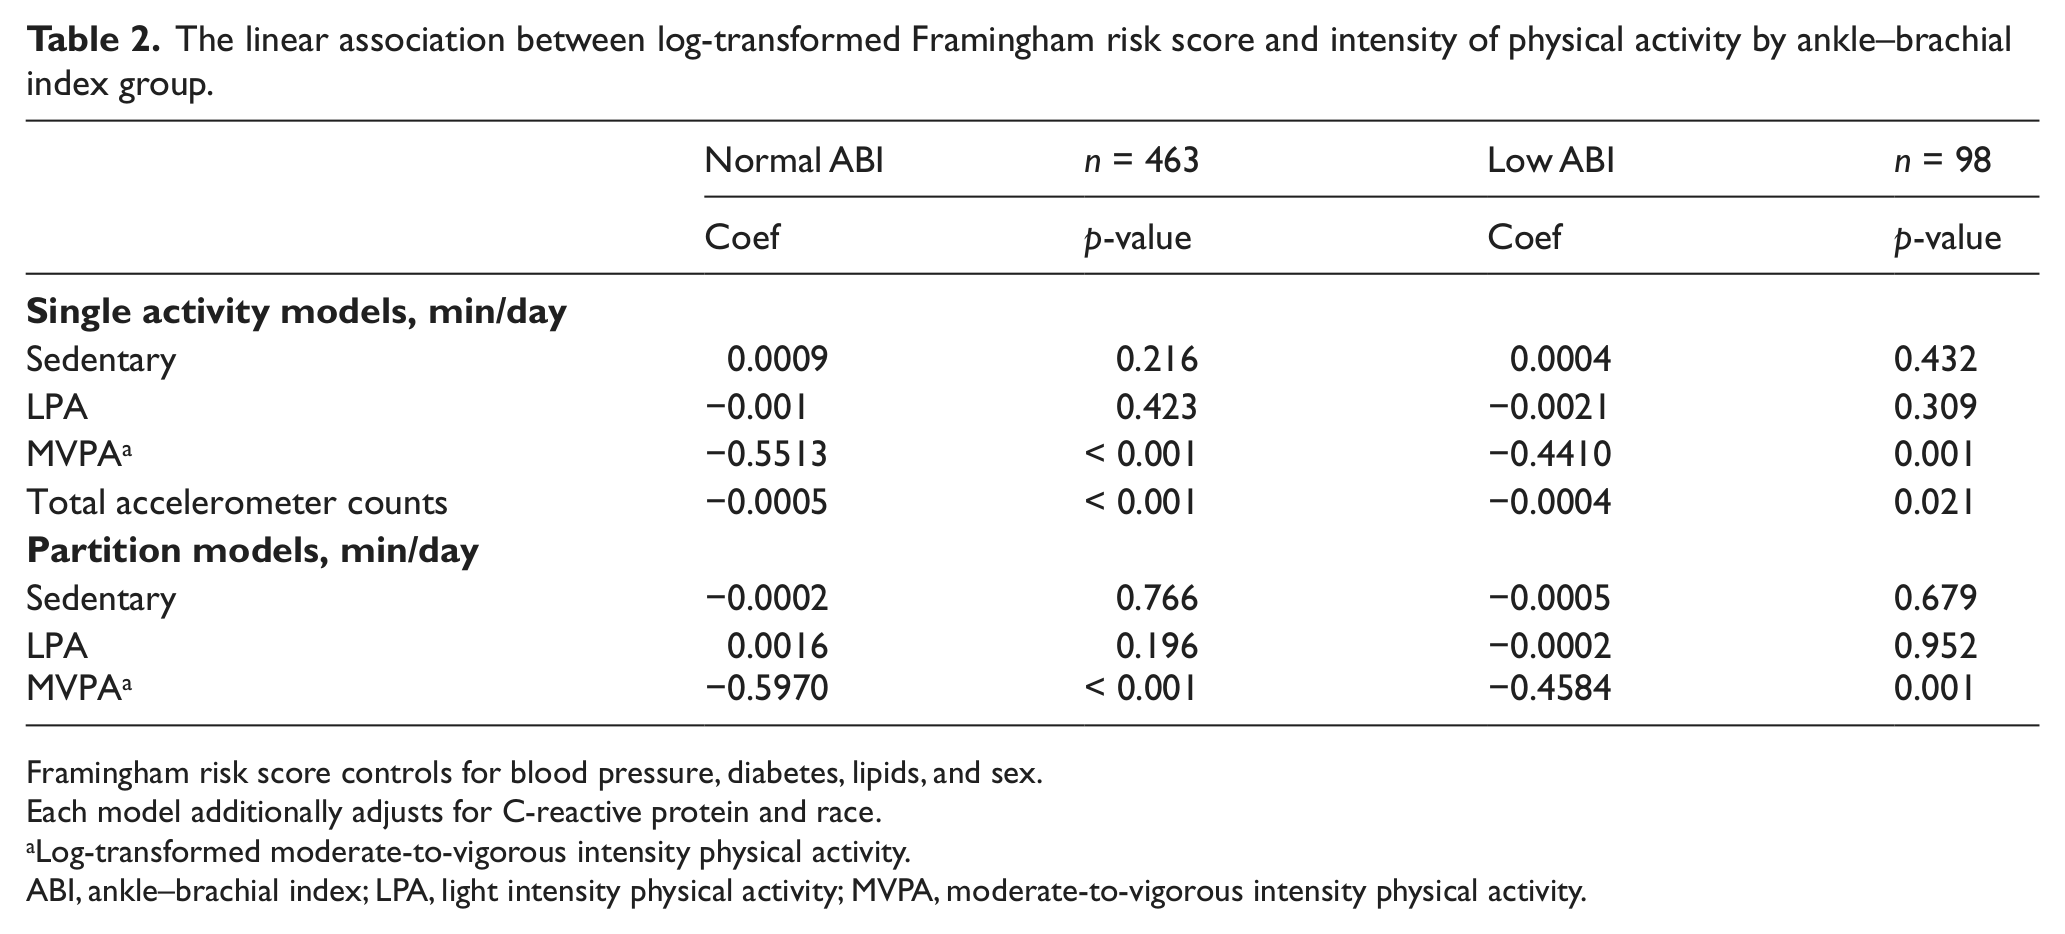
Framingham risk score controls for blood pressure, diabetes, lipids, and sex.
Each model additionally adjusts for C-reactive protein and race.
Log-transformed moderate-to-vigorous intensity physical activity.
ABI, ankle–brachial index; LPA, light intensity physical activity; MVPA, moderate-to-vigorous intensity physical activity.
Discussion
The findings from the current report are important because a low ABI has been shown to be related to increased risk for cardiovascular events and premature mortality,1,2,20 which may be heightened by reduced PA levels. 10 Consistent with results from previous studies,6,21–23 the findings from the current report suggest that individuals with a low ABI spent less time engaged in MVPA and more time in sedentary pursuits when compared to individuals with a normal ABI. While individuals with a low ABI averaged less than 15 minutes of MPVA per day, slightly higher levels of MVPA were associated with significantly lower CVD risk. For every 1-minute increase in MVPA, the FRS score decreased by 3.4% in individuals with a low ABI. The magnitude of this decrease is likely due to the fact that PA significantly impacts many factors such as blood pressure and lipids, which in part determine FRS. 24 Additionally, the stronger association between MVPA and CVD risk in individuals with a low ABI compared to individuals with a normal ABI is likely due to the higher levels of blood pressure and lipids in the low ABI group. While more studies are needed to determine the true magnitude of the effects of PA on CVD risk in individuals with a low ABI, this study does add an important insight on the benefits of PA using a US representative sample. Many previous studies have highlighted the effectiveness of supervised exercise programs to increase the functional capacity of individuals with a low ABI. 25 The results of the current study show the benefits of MVPA accumulated during activities of daily living. While our national health recommendations state that 150 minutes per week of PA is needed to achieve health benefits, the results of the current study support the benefits of lower amounts of PA.
Time spent in LPA did not differ between ABI groups, suggesting a maintained capacity for activity at this intensity level regardless of health status. These results are consistent with a study by Gardner et al., which used the Minnesota Leisure Time Physical Activity Questionnaire to examine the association between intensity of PA and ABI among patients with intermittent claudication and found similar results to the current study. 26 They showed that individuals with a higher ABI spent more time engaging in activities of moderate and high (i.e. vigorous) intensity compared to individuals with a lower ABI, but time spent in activities of light intensity were statistically similar between groups. The current study adds to this research by examining associations of ABI with PA measured by an accelerometer, which is less prone to information bias and related measurement error when estimating lower intensity activities in comparison to self-report methods. 27 Some researchers have suggested that individuals with a low ABI often avoid being physically active at high intensities due to exertional pain. 23 Thus, individuals with a low ABI likely substitute time spent in MPVA with lighter intensity activities and more sedentary pursuits. Given the reduced capacity for MVPA in those with a low ABI, examining the relationship between LPA and CVD risk in this group has important implications. Although LPA was not associated with FRS in this study, it does not necessarily mean that LPA does not contribute to cardiovascular health. Of note, the contribution of LPA to total volume of movement is higher in those with a low ABI compared to those with a normal ABI (~85% vs 80%), which in turn is related to lower CVD risk. Therefore it may be prudent to encourage those with a low ABI to increase their total movement, regardless of intensity, when initiating an activity program.
In addition to not having measures of intermittent claudication, there are other limitations of this study. While higher intensity activity was shown to be associated with a better CVD risk profile in individuals with a low ABI, owing to the cross-sectional study design causality cannot be inferred. It can also be argued that individuals with a worse CVD risk profile have more severe PAD which limits their PA levels. Prospective studies are needed to better understand the causal relationship between PA, particularly total volume of movement, and cardiovascular risk in individuals with a normal and low ABI.
Finally, waist-worn, uni-axial accelerometers provide an accurate measure of predominantly ambulatory activities and, thus, do not capture all physical activities that may contribute to improvement in health outcomes. 14 Presumably, individuals with a low ABI may experience lower leg pain causing them to reduce their ambulatory movement. They may perform more upper body, light intensity activities that are not captured by waist-worn accelerometers, which may have underestimated the amount of LPA performed by individuals with a low ABI and thus attenuating its relationship with CVD risk.
A strength of the current study is the ability to evaluate the association between accelerometer-derived PA and CVD risk in a nationally representative cohort, which may have great public health significance than smaller, clinical populations used in other studies. The use of the accelerometer will also provide quantitative information on PA levels in individuals with a low ABI, which can be used for comparison against studies from clinical populations. The accelerometer is a direct measure of ambulatory movement accumulated across a range of intensity levels. Self-report assessments are somewhat limited in that they capture primarily higher intensity activities, which might not reflect the types of activities commonly performed among individuals with impaired ABI.
In conclusion, individuals with a low ABI engage in less MVPA than individuals with a normal ABI. Owing to the low activity levels in this group, even modest improvements in activity levels were shown to be associated with lower CVD risk. Whatever their current activity levels are, encouraging individuals with a low ABI to gradually increase movement and participation in MVPA may reduce their future risk of cardiovascular events.
Footnotes
Conflict of interest
The authors declare no conflicts of interest in preparing this article.
Funding
This research received no specific grant from any funding agency in the public, commercial, or not-for-profit sectors.