
Abstract
The investigation of tourism movement is fundamental for effective attraction and destination management. In particular, understanding patterns of movement to differentiate tourists according to their consumption of space and time has marketing and managerial implications. This paper uses a combination of mobile data, information about points of interest, and geographical data to investigate the movement of 2.95 million international visitors in Tuscany. The findings identify four types of international visitors according to their movement patterns and explore the differences between them and highlighting the consequential theoretical and practical importance of these differences for destination management and marketing. The paper also adds to the growing discussion on the use of mobile data, particularly its combined use with other data sources in the study of spatiotemporal behavior of tourists.
Introduction
Movement constitutes a key aspect of tourists’ behavior. Understanding how tourists move to reach and travel within a destination is crucial for tourism decision-makers for two main reasons. Firstly, it informs infrastructure and service planning decisions. Detailed information concerning tourist movement can facilitate the creation and refinement of tourist attractions and products (Lew and McKercher, 2006; Shoval and Isaacson, 2007; Vu et al., 2015) as well as of transportation systems, visitor information services, and way-finding systems (Edwards and Griffin, 2013). Secondly, it can allow more efficient and effective marketing efforts (Lew and McKercher, 2006) by helping tourism organizations to identify relevant market segments based on movement patterns and accordingly develop more targeted marketing strategies (Xia et al., 2010).
In recent decades, a multiplicity of scholarly efforts has been invested in deciphering tourist movement using a variety of methods and data sources (Caldeira and Kastenholz, 2018; Cheng et al., 2023; Park and Zhong, 2022; Park et al., 2023; Versichele et al., 2014). The rapid technological developments have led to the widespread availability of tracking technologies (Shoval and Ahas, 2016), resulting in a shift from the use of surveys to the more advanced data sources including geotagged data, sensor data and mobile data. In addition, the drastic expansion of big data and technology to store and process the data, including machine learning, pattern recognition, and its use for research purposes, has created opportunities for new insight into tourists’ behavior (Miah et al., 2017). At the same time, tourist segmentation has expanded with an increasing number of measures and sophisticated analytical techniques being employed (McKercher et al., 2023b).
These technological advances have enabled more feasible investigations of the tourism movement, prompting further investigations on the topic. While previous studies have predominantly compared groups of tourists based on socio-demographic or trip-related factors, more recent academic endeavors have shifted toward posterior or data-driven segmentation using passively collected tourism movements or large volumes of user-generated and destination-related data (Hernandez et al., 2018; Park et al., 2023; Yu et al., 2023). Although these studies are methodologically advanced, they often rely on a single data source, providing valuable yet limited information on the destination. Integrating different data sources has been recognized to generate greater theoretical and practical insights (Alaei et al., 2019).
This paper contributes to this discussion by exploring the spatiotemporal behavior of international visitors based on a combination of mobile data, landscape data, and points of interest. It analyses a dataset with 40 features, including spatiotemporal characteristics and nationality, from the behavior of 2.95 million foreign visitors across 273 municipalities and 792 tourist attractions in Tuscany, Italy. In doing so, the paper segments visitors based on their spatial distribution, movement patterns, and types of locations, visited. This combination of data sources strengthens the quality of the analysis and presents practical opportunities for destination managers to understand the movement patterns of tourists which can lead to more effective segmented marketing.
Background
Tourist movement and segmentation
Studying how tourists move through space and time is a crucial element of understanding tourist behavior (McKercher et al., 2023b). Such an investigation can be conducted at both a macro- and micro-level: macro-scale or inter-destination movements refer to the movements from tourists’ original destination to one or more destinations (Dejbakhsh et al., 2011) and typically entail wide distances; micro-scale or intra-destination movements include the movements within a destination, including, for instance, movement between points of interest and activities (Lau and McKercher, 2006; McKercher and Lau, 2008; Xia et al., 2005). Understanding both levels is significant for managing destinations (Dejbakhsh et al., 2011). In fact, the study of macro-scale movements has been recognized as useful in conceptualizing micro-scale movements (Lau and McKercher, 2006).
The exploration of the topic of tourist movement, or as often referred to tourist mobility or spatiotemporal behavior has evolved significantly in the last two decades. Critical reviews on the topic (Chen et al., 2024; Shoval and Ahas, 2016) have highlighted the increase in sophistication, scope and depth of investigations. Initially, studies relied on self-reported movement and direct observation and slowly broadened to include a variety of data sources including GPS, Bluetooth, geotagged social media data and mobile data. Topics explored in this area now cover a wide range of areas including identifying hotspots (East et al., 2017; Shoval, 2008) factors influencing behavior (Barros et al. 2020), trends and patterns of movement (Payntar et al. 2021), attraction clustering (Han et al., 2021; Zhou and Chen, 2023) and predicting tourist movement patterns (Jiang et al., 2021).
Overall, the expanding body of knowledge on the topic highlights that tourist consumption of space and time is far from uniform. Spatially, there are hot spots in destinations, usually around key attractions, where tourists tend to concentrate (Shoval, 2008); even within a particular attraction, there are zones receiving a considerably higher number of visitors compared to others (East et al., 2017). Furthermore, locations within attractions or destinations that are similar with respect to visitor numbers are often different in the order in which they are visited (Orellana et al., 2012). In terms of time, destinations and attractions can witness peak numbers on a particular day of the week or time of day (Li et al., 2010; Versichele et al., 2014).
Besides the recognition of the heterogeneous distribution of tourists in space and time, there have also been suggestions that several factors affect spatiotemporal behavior. Scholars have attempted to explore how origin of tourists (Barros et al., 2020; De Cantis et al., 2016; East et al., 2017; Md Khairi et al., 2018), length of stay (Md Khairi et al., 2018), visitor experience (Lau and McKercher, 2006; McKercher et al., 2012; Md Khairi et al., 2018), group type and/or size (East et al., 2017; Md Khairi et al., 2018; Zhao et al., 2018), annual income (De Cantis et al., 2016) and motivation (McKercher et al., 2019) affect the way tourists explore destinations. Md Khairi et al. (2018) discovered that the origin of tourists influences the way space is utilized: tourists from Europe and Oceania tend to favor primary destinations like historical sites, whereas Asian visitors are more interested in secondary locations such as shopping areas.
With regard to length of stay, Md Khairi et al. (2018) found that tourists who stayed fewer days visited more attractions on average than those who had longer stays. Similar findings were discussed by (McKercher et al., 2019), who confirmed that visitors with longer stays tend to keep their visits to single attractions, and those with shorter stays tend to concentrate on centrally located iconic sites. Interestingly, the authors found that short- and long-duration stays involved a narrower exploration of the destination when compared to middle-duration trips. In a different study, McKercher and Lau (2008) found that tourists with longer stays have a higher likelihood of repeating patterns of movement.
Experience with the destination or attraction have also been discussed to affect spatiotemporal patterns. Repeat visitors often exhibit more dispersed spatial patterns while first-time visitors tend to focus on downtown areas and traveling mainly by foot (Lau and McKercher, 2006). In addition, first-time visitors typically move continuously throughout the day, focusing on iconic attractions, whereas repeat visitors show more sporadic patterns and visit fewer, often secondary, attractions (McKercher et al., 2012). Other studies, however, found no major difference between first-time visitors and destination connoisseurs (De Cantis et al., 2016).
Finally, group type and size also have been suggested to affect spatiotemporal behavior to a limited extent. Zhao et al. (2018) concluded that as party size increases, spatial dispersion decreases. East et al. (2017), on the other hand, found that party size positively affected the length of stay in the attraction visited. The same study has also shown that the presence of children in the travel party also affected the length and dispersion of visitors.
In addition to these efforts of comparing the behavior of different types of tourists based on socio-demographic or trip characteristics, there have also been various attempts to differentiate distinct types of visitors according to their actual spatiotemporal behavior. For instance, Kuusik et al. (2011) looked at destination loyalty and proposed a simple classification model for repeat visitors by segmenting visitors based on the number and type of repeat visits to a particular country using call data records. Versichele et al. (2014) identified five different segments based on the types of attractions visited. In the context of cruise tourism, De Cantis et al. (2016) classified tourists based on different itinerary attributes, including length of tour, number of visited attractions, spatial dispersion, and the average speed, and identified seven different groups with distinct broad patterns of activity. In addition, Xia et al. (2010) segmented tourists based on dominant movement patterns to assist package development.
While significant insights have been drawn from these attempts at movement data-driven segmentation, there is a great need to further understand different patterns of movement. Not only the existing knowledge superficial (Md Khairi et al., 2018), but also various studies have acknowledged their limited sample in terms of individuals, the time frame of tracking data (Versichele et al., 2014; Xia et al., 2010) or spatial dimensions of the tracked study area and highlighted the need for larger scale studies covering larger areas and for longer periods of time (Orellana et al., 2012). There have also been further calls to examine movement patterns by different tourism segments and using combined data sources (McKercher et al., 2012). Such segments can be defined in various ways, including demographically, psychographically, motivational, or by special interest (McKercher et al., 2012), but also by the actual behavior. In fact, clustering methods have been suggested to advance knowledge on spatiotemporal movements (Versichele et al., 2014). These can be used to create effective destination marketing strategies and to develop new services and products for various visitor segments.
Context, data, and methods
Context
Tuscany is Italy’s second top tourist region and one of the top 20 most visited regions within the European Union (Eurostat, 2017). With more than 44 million overnight stays, tourism makes a significant economic contribution to the region, generating an estimated 6.5% of its GDP and employing 10% of its workforce (Toscana Promozione Turistica, 2016). The region's main cities, Florence and Pisa, drive most of the region's demand for tourism with their extensive historical and cultural heritage (Popp, 2012). Rural tourism is also popular given its natural landscape (Ferrari et al., 2016; Randelli et al., 2014) in addition to its famous food and wine offer (Bertella, 2011; Getz and Brown, 2006). A key competitive strength of the region is the heterogeneity in both supply and demand of tourism (Toscana Promozione Turistica, 2016). The broad range of attractions and experiences on offer provide numerous reasons to visit. This diversity coupled with the well-established reputation of the region as a major destination and the presence of visitors from various backgrounds make it a well-suited choice for investigating different visitor mobility profiles.
Data sources and collection
Three data sources were integrated in this study: mobile data, points of interest (PoI) specific to Tuscany, and geospatial data from an open-source geographic information system. Mobile data included a dataset provided by a European mobile network operator. The dataset included pre-processed logs of anonymized signaling traces of mobile devices with foreign SIM cards connected to the operator's infrastructure in Italy between May 2017 and February 2018. While data collection dates to pre-COVID-19 times, understanding visitor movement pre-pandemic remains crucial. Research has highlighted short-term changes in the preferences and patterns of visitors after the different outbreaks (Yu et al., 2023), but it also highlighted revenge tourism has led to the rapid recovery of tourism and to travel intentions and habits similar to pre-pandemic periods (Hamad et al., 2024; Zhao and Liu, 2023).
For the purpose of this study, only data relevant to Tuscany were analyzed. Figure 1(a) illustrates the distribution of all mobile cell towers deployed by the operator within the region. By filtering the dataset to only include devices that connected to a cell tower in Tuscany at least once during the 10-month period, we identified unique mobile phones, referred to hereafter as visitors.
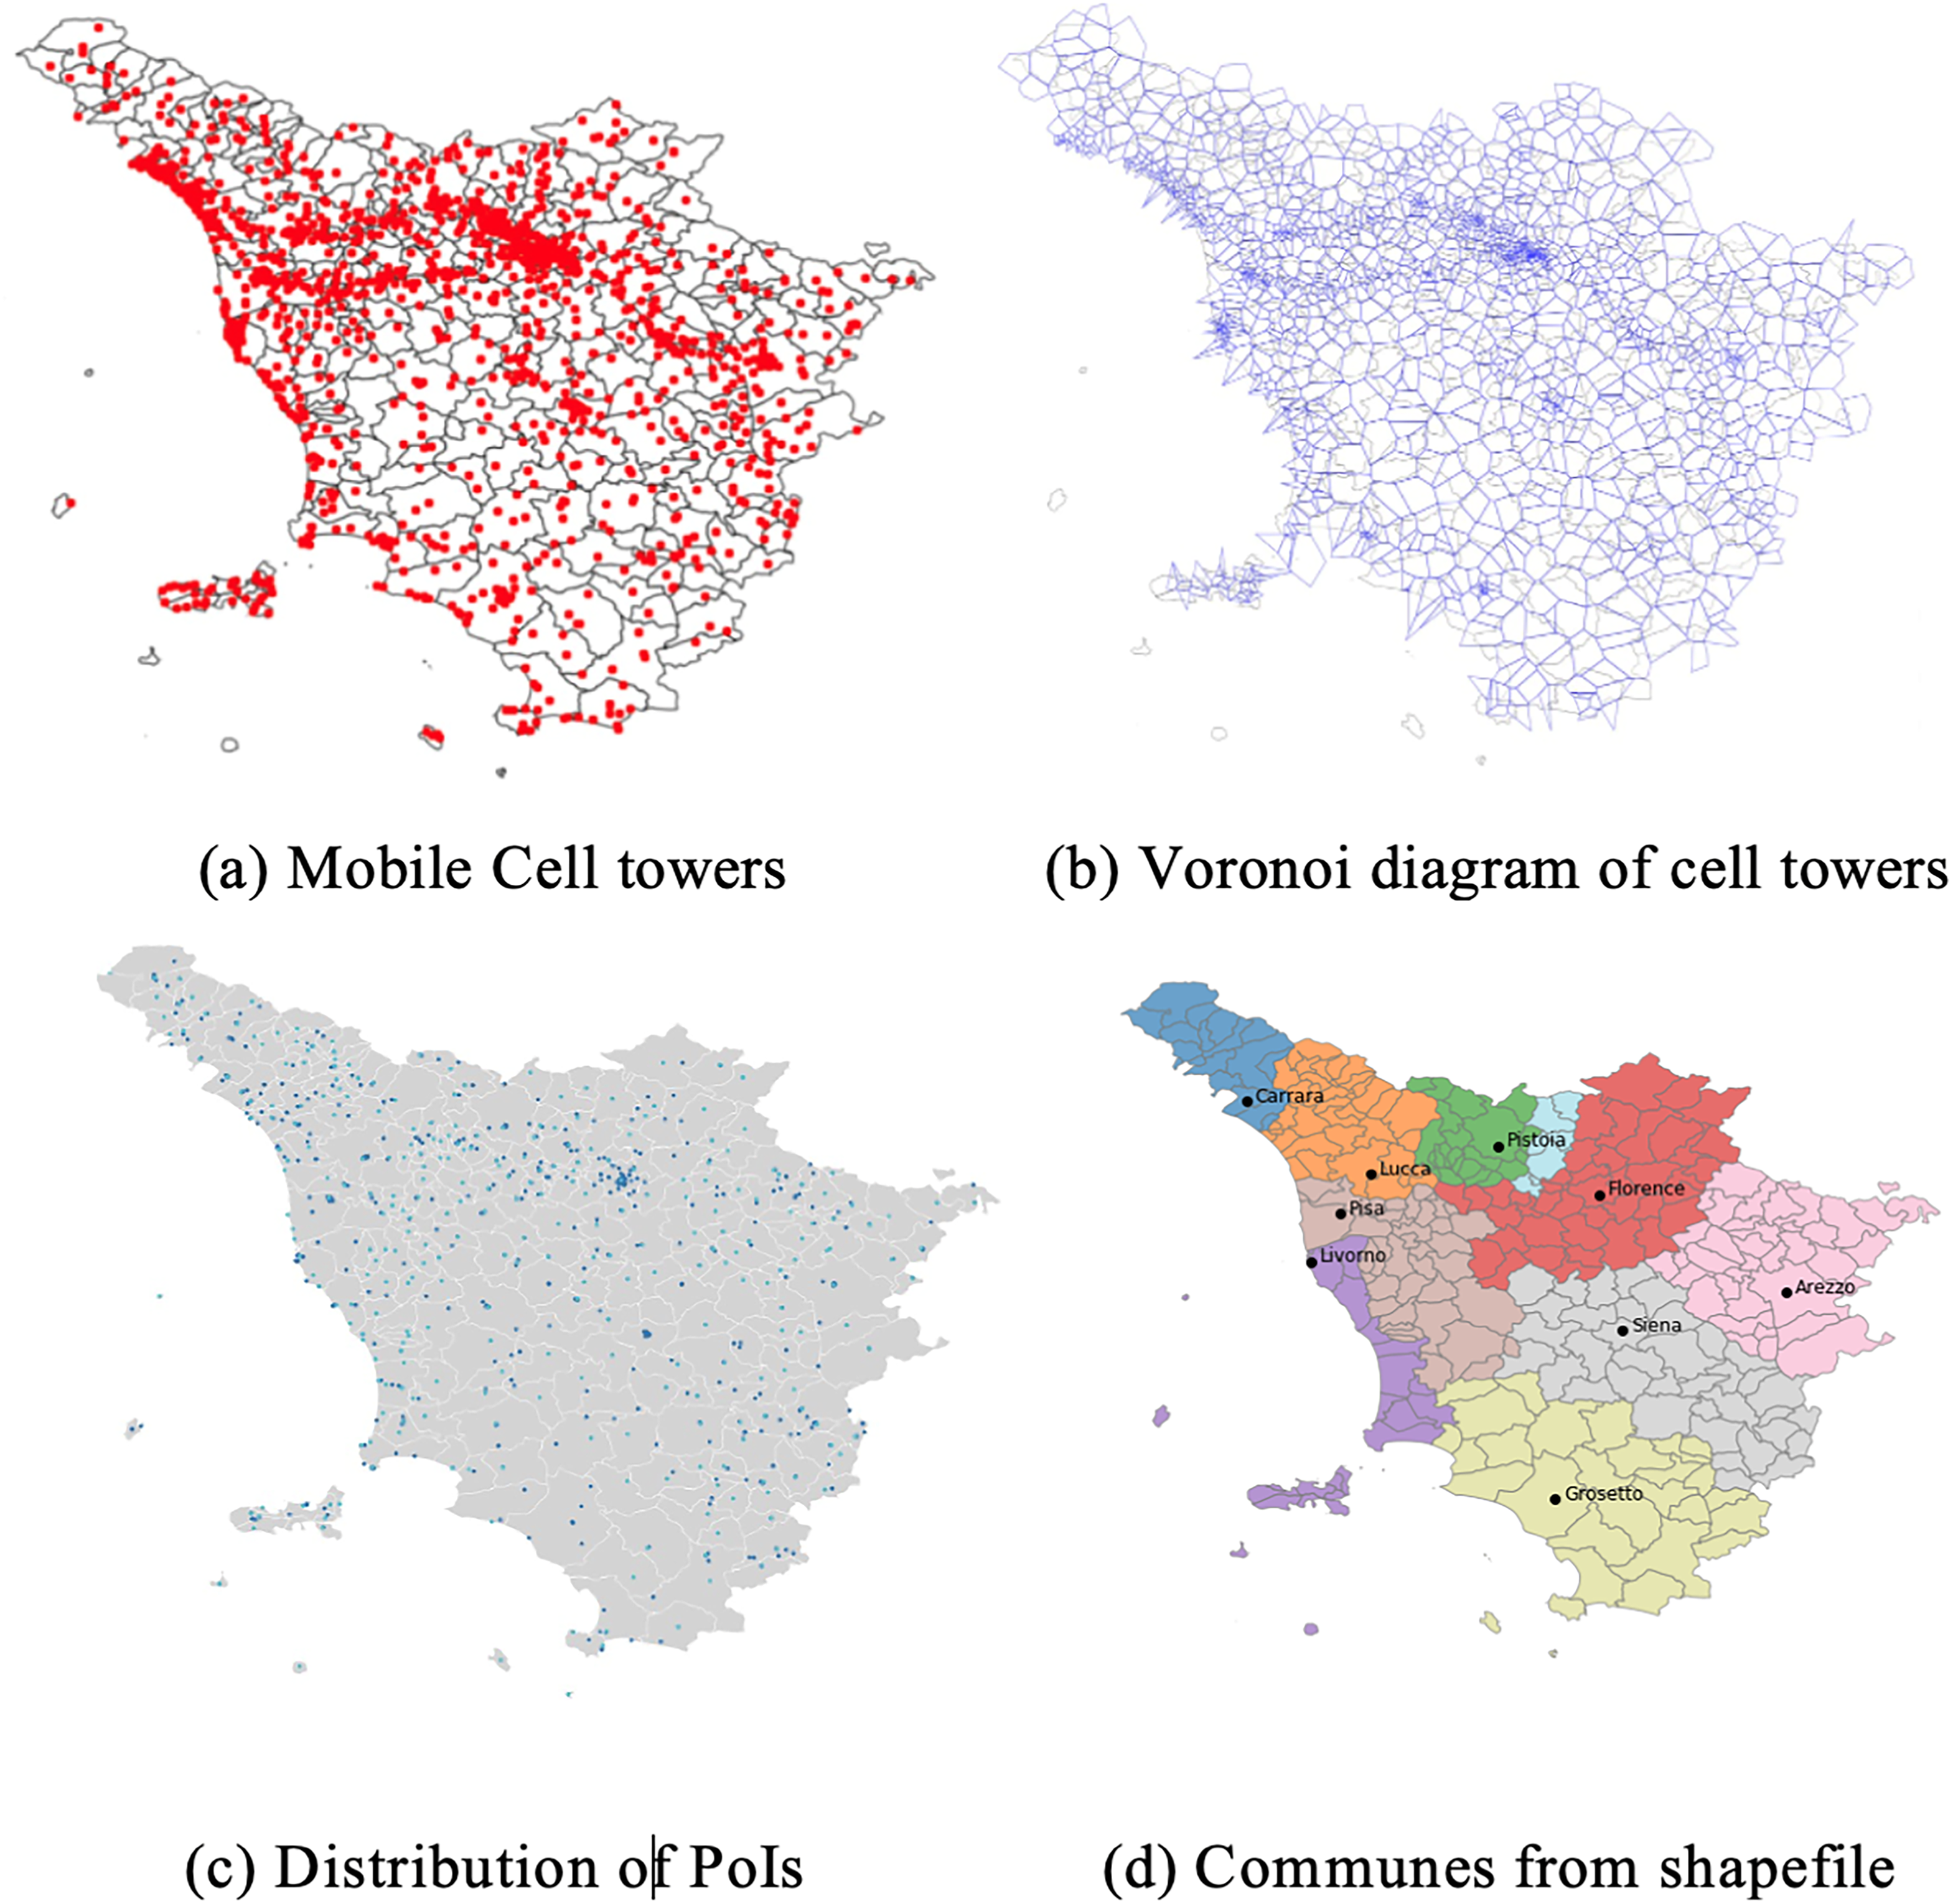
Geospatial representation of Tuscany region constructed from location data of cell towers, PoI and shapefiles.
Each visitor's dataset comprised multiple signaling events, each including: a random unique code representing each mobile phone, a timestamp with the date and time, the geo-coordinates of the connected cell tower, and SIM card's country of origin. The granularity of this data varied, with minute-level resolution when a visitor's location changed (i.e., switching towers) and hourly resolution when stationary (i.e., consistent connection to a single tower). In total, the dataset contained 3.3 billion signaling events from 9.6 million visitors.
Secondly, data regarding the tourist attractions or points of interest of Tuscany was collected from Visit Tuscany, the region's official tourism website, which maintains a filterable online database of points of interest. In total, information from 792 tourist attractions was collected, including their names, categories (e.g., historical sites, museums, etc.), and geo-coordinates. Finally, the open-source geospatial information from DIVA-GIS was also collected. DIVA-GIS (Hijmans et al., 2012) is an open-source software program that allows for the analysis and visualization of geographical data. The downloaded information contained ESRI shapefiles of the Tuscany region indicating one of five terrain types: forest, park, inland water, riverbank, and coastal areas. This type of data was incorporated with the aim of adding an extra layer of information regarding the natural/geographical characteristics of the region.
Preprocessing
The initial mobile positioning dataset was subjected to various preprocessing procedures to ensure the veracity and validity of data for this study.
First, a set of atypical behaviors were identified and removed from the dataset. Such behaviors included situations when a visitor spent less than one hour in Tuscany, had no registered movement, simply crossed the Tuscany region without engaging in any location or spent more than one month in Tuscany. As a result of this data cleaning process, 746,361 individuals were removed.
Second, visitors’ locations were aggregated on two levels. The first entailed applying the Voronoi tessellation technique, in which the Tuscany region was divided into areas that represent approximated coverage of the cell towers, creating a Voronoi diagram (Gonzalez et al., 2008). Each resulting area is a convex polygon containing one centroid as the location of a cell tower. In other words, each Voronoi cell represents the entire potential area of the actual location of a tourist when the signaling event is linked with a particular cell tower. Figure 1(b) shows the region partitioned by the cell area, with each node corresponding to a cell tower and the lines representing its reception area. This more granular level of location aggregation enables a better understanding of the crowd dynamics over time.
Additionally, to further characterize the area, Voronoi cells were merged with the geographic area of POIs and terrain types data, as shown in Figure 1(c). For each Voronoi cell, a set of metrics was calculated: the number of attractions and whether an area is within the forest, inland water, river, natural parks, and coastal areas, or in any of the major Tuscan cities (Arezzo, Florence, Livorno, Lucca, Pisa, Pistoia, and Siena), as illustrated in Figure 1(d). Next, additional variables were created using each visitor's spatial coordinates (latitudes and longitudes) over the trip. These variables included the coordinates information about the first, last, and top locations and the average coordinates weighted by the duration of visits. This process identified 643,276 tourists who focused their trips outside Tuscany, that is, their average coordinates located beyond the geographic bounds of Tuscany, and were, therefore, removed from the sample.
The result of the multiple preprocessing was a dataset with approximately 5.55 million foreign visitors. Additionally, due to the computational complexity of dealing with this size of data, a subset of the cleaned dataset was created by selecting the top 6 nationalities represented: Germany, United States, France, United Kingdom, Netherlands, and China. This final dataset contained 2.95 million foreign visitors.
Finally, a list of features was generated by aggregating the signaling data at the individual level to characterize each visitor. Table 1 shows the details of each feature that was used to describe different aspects of tourists’ behavior, such as duration spent in Tuscany, number of connected cell towers, duration spent in different types of landscape types and cities, and summarized spatial coordinates, respectively.
Feature description.

Cluster analysis
Cluster analysis was used to group visitors into homogeneous segments based on their spatiotemporal behavior (for a general overview of tourism market segmentation, see e.g., Dolnicar, 2002). Given the large volume and variety of data extracted from different data sources, the K-Means algorithm was employed as the effective clustering method to identify homogeneous clusters of visitors (Mazanec, 1984). In particular, a variant of the K-means algorithm—MiniBatch K-Means—was used. This alternative was chosen because it reduces computational time by using mini-batches while still optimizing the same objective function (Sculley, 2010). Accordingly, instead of loading the whole set of input data at each iteration, samples are drawn randomly from the dataset to form a mini-batch and assigned to the nearest centroid. Then, the assigned centroid is updated for each sample in the mini-batch. Lastly, the features were standardized by transforming them to have a mean of 0 and a standard deviation of 1. This step enables the set of mixed features at different scales to be comparable and thus helps in generating more homogeneous clusters.
A necessary step before running the K-means algorithm on data is to determine the optimal number of clusters. Admittedly, K-means algorithm with varying K would yield different numbers of clusters, which may affect how tourist spatiotemporal behavior is segmented. The process of v-fold cross-validation was employed to identify the best number of clusters (Nisbet et al., 2009). The optimal number of clusters was observed to be either 4 or 9. The number of clusters was set to 4, a decision that was tested and validated by the regional tourism organization.
Post hoc analysis
Post hoc analysis of clustering results was conducted to understand which features exhibit discriminative power to segment tourists. Provost and Fawcett (2013: 179) suggested mixing a supervised machine learning approach with clustering to generate cluster descriptions automatically. In this study, the random forests model was leveraged to derive the rules of why each tourist belongs to a particular segment through segment classification. Compared to existing literature where we find the use of decision tree models for tourism market segmentation (Chung et al., 2004; Kim et al., 2011; Legoherela et al., 2015), the random forests model is less prone to overfitting the data while still generating reasonable explanations.
As interpreting random forests is traditionally considered to be infeasible given its complex ensemble structure, a novel interpretation method SHAP (SHapley Additive exPlanations) was employed to explain the model prediction by computing the contribution of each feature (Lundberg and Lee, 2017). It calculates Shapley values for features and represents explanations as an additive attribution method. For example, the SHAP feature importance averaged the absolute Shapley values per feature, and thus, features with large absolute Shapley values are important. The model was fine-tuned by selecting hyperparameters to optimize prediction accuracy through the n-fold cross-validation randomized search procedure (n is set to 5). The resulting model used 500 decision trees, with each tree growing up to the depth of 80, and achieved 97.3% prediction accuracy.
Results
Descriptive statistics
The final dataset for this study included 40 features (6 nationalities, 4 periods, and 30 spatiotemporal characteristics) derived from the spatiotemporal behavior of 2.95 million foreign visitors across 273 municipalities and 792 tourist attractions. The distribution of country of origin included Germany (25.1%), United States (19.8%), France (16.4%), United Kingdom (15.1%), Netherlands (14%), and China (9.7%). The average duration of visit to Tuscany was 5 days with 21% of visitors staying up to one day, 45% between 1 and 5 days, 15% between 6 and 10 days, and the remaining 19% more than 14 days.
The temporal distribution of these visits reveals expected seasonality, with a surge in visitor numbers during the summer months. Figure 2 shows how visitor numbers varied across the 10-month period according to country of origin. Interestingly, it was noticed that the visitor distribution differs by market. For instance, August emerges as the favored month for visitors from Germany, France, and the United Kingdom. In contrast, July attracts visitors from the Netherlands and China, while June is the preferred choice for visitors from the United States. The intensity and duration of these peaks also vary. French and Dutch visitors exhibit a sharp peak in August and July, with a significant drop in numbers in the adjacent months. German and United Kingdom's visitors, however, spread their visits from June to September, resulting in a more extended peak. Chinese tourists present a more uniform distribution across the 10 months.
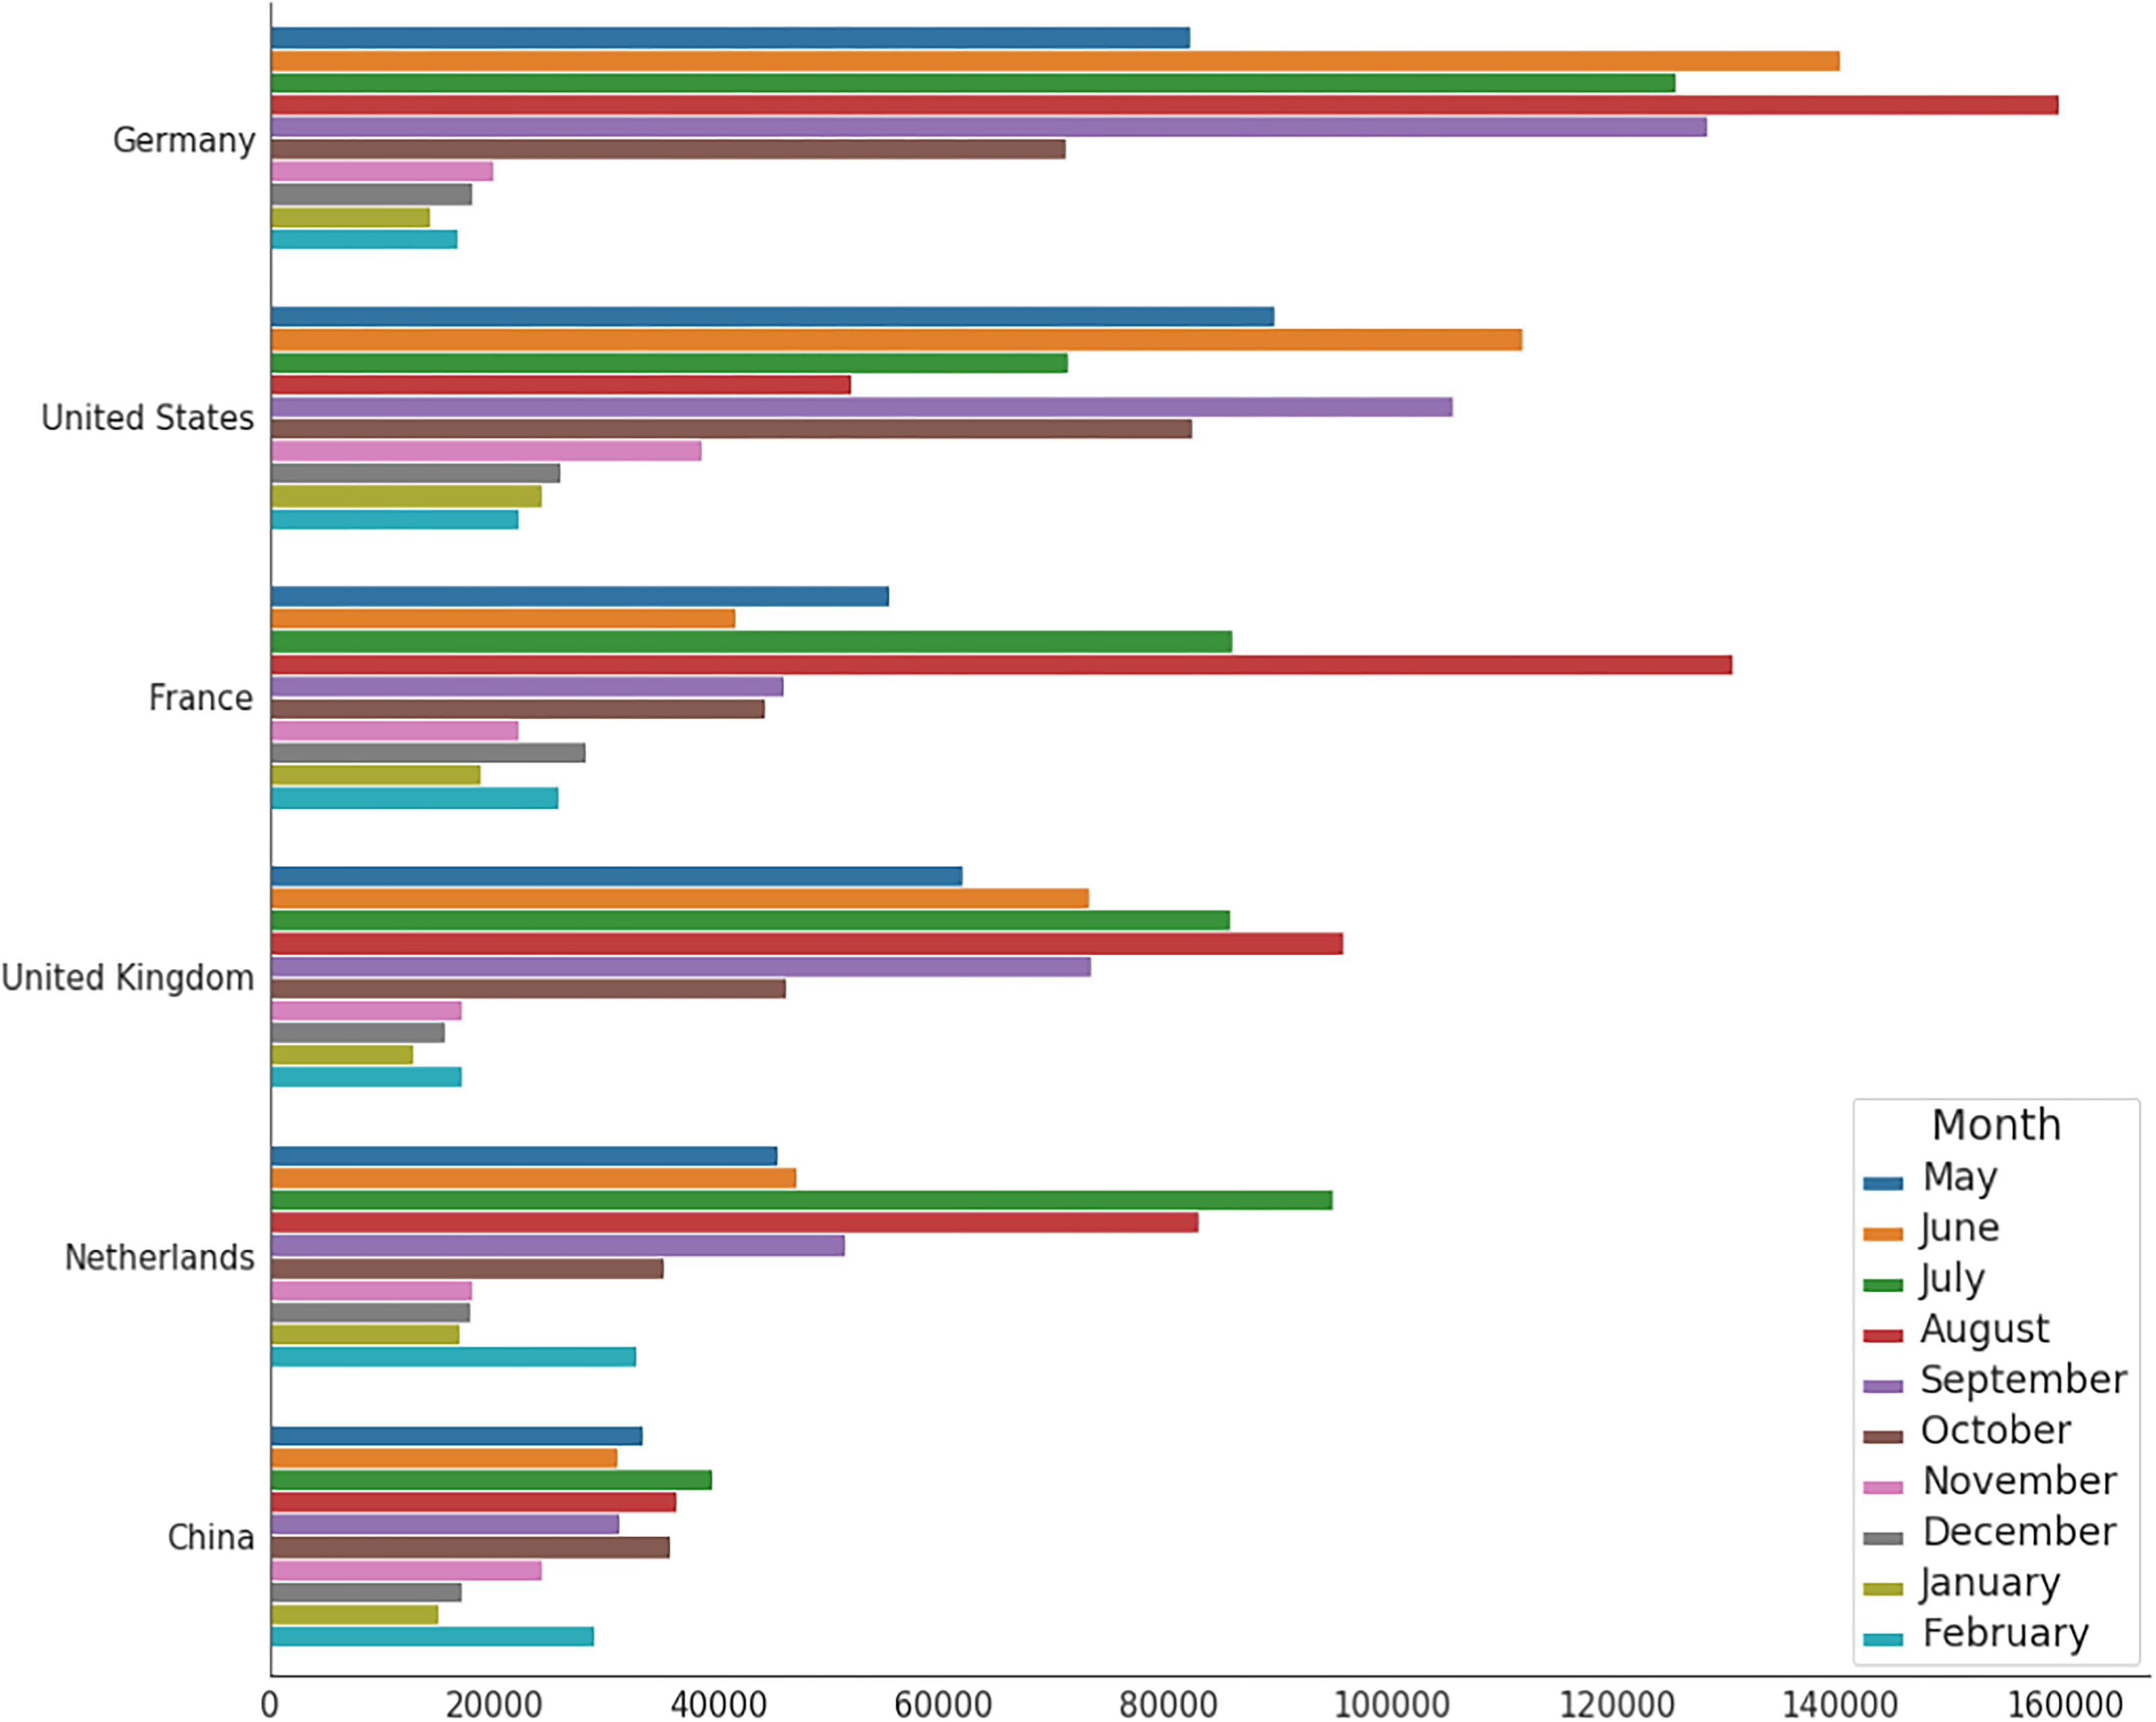
Number of visitors from top six nationalities.
Florence, unsurprisingly, mirrors the broader regional trends. Figure 3 illustrates the pronounced seasonality in Florence's tourist numbers. The summer months see a spike in visitors, which drops sharply during the colder months. An interesting pattern emerges when comparing the proportion of tourists in Florence to the rest of Tuscany. During summer, a larger fraction of tourists ventures beyond Florence, exploring the broader region. In contrast, the off-peak season sees a concentration of tourists in Florence, suggesting a more limited exploration of Tuscany.
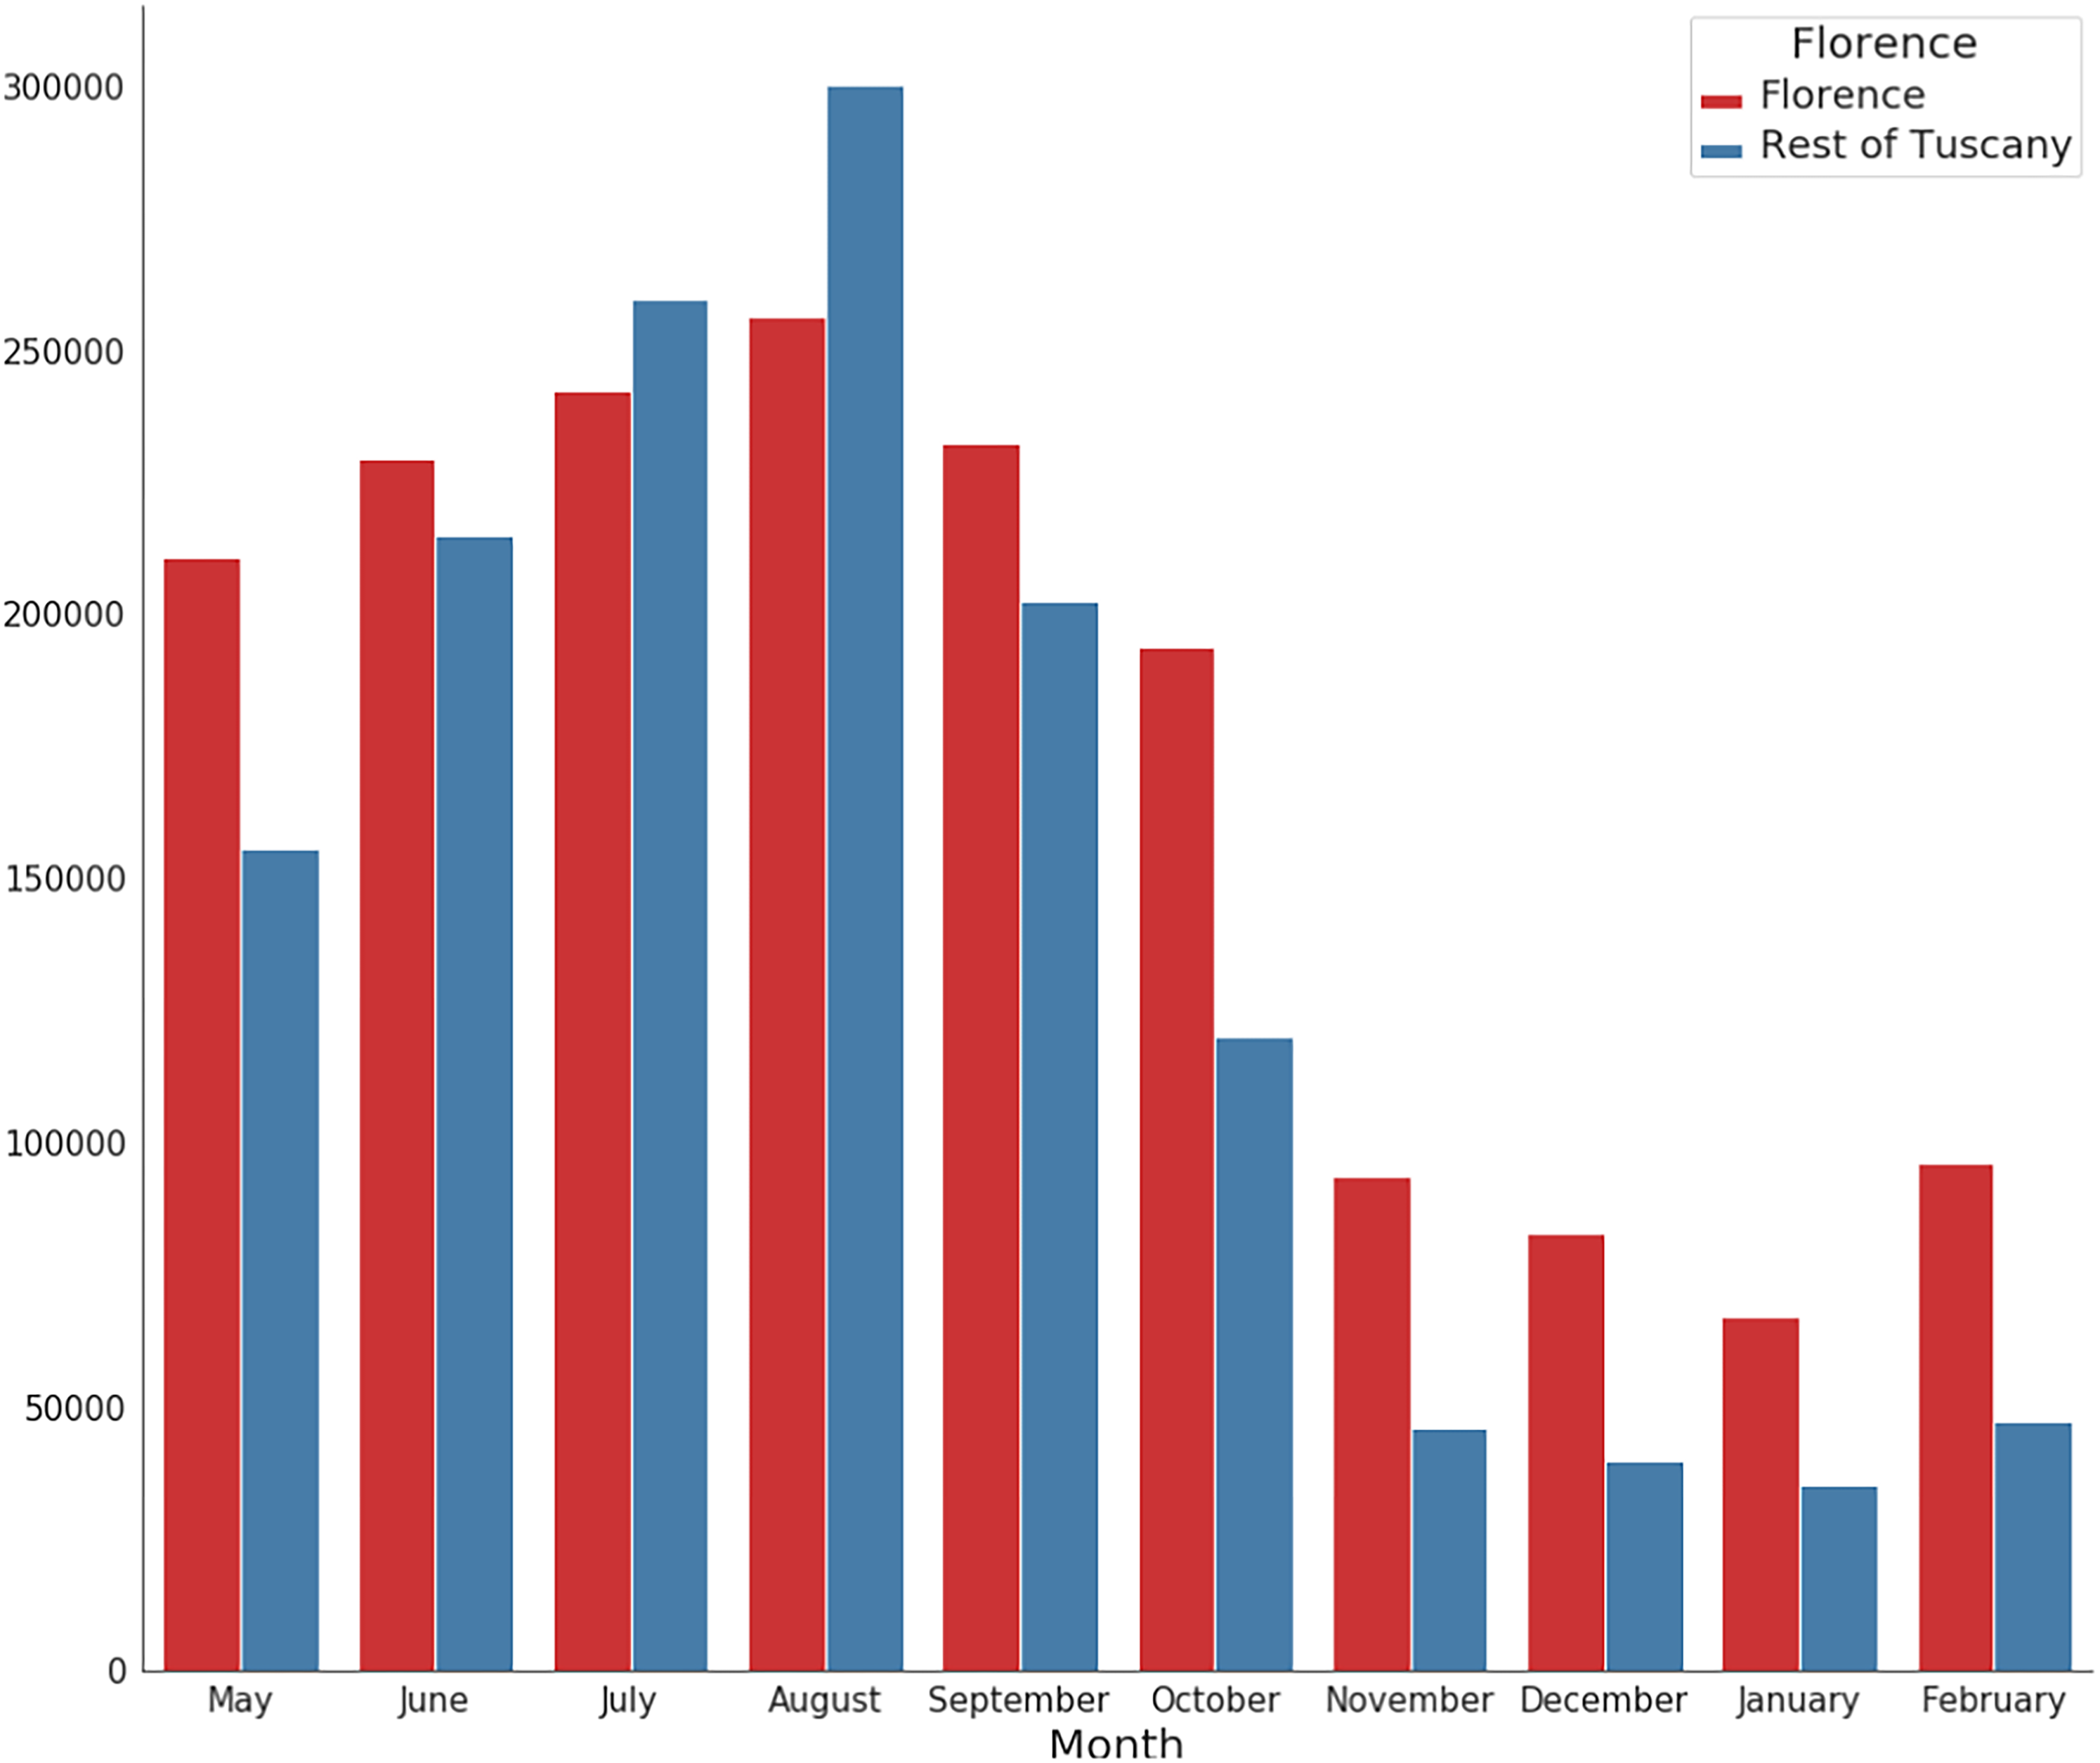
Number of visitors in Florence and rest of Tuscany.
K-means clustering
The cluster analysis segmented visitors into four distinct groups: “Florence Visitors,” “Coast Lovers,” “Fast Trippers,” and “Explorers.” Each group was characterized by the average attributes of its members, known as the centroid of the cluster, as shown in Table 2. These average attributes are interpreted as the representative spatiotemporal behavior of each cluster. Figure 4 visualizes the average locations of the top 0.5% of visitors proximate to the centroid of each cluster, underscoring distinct mobility patterns.
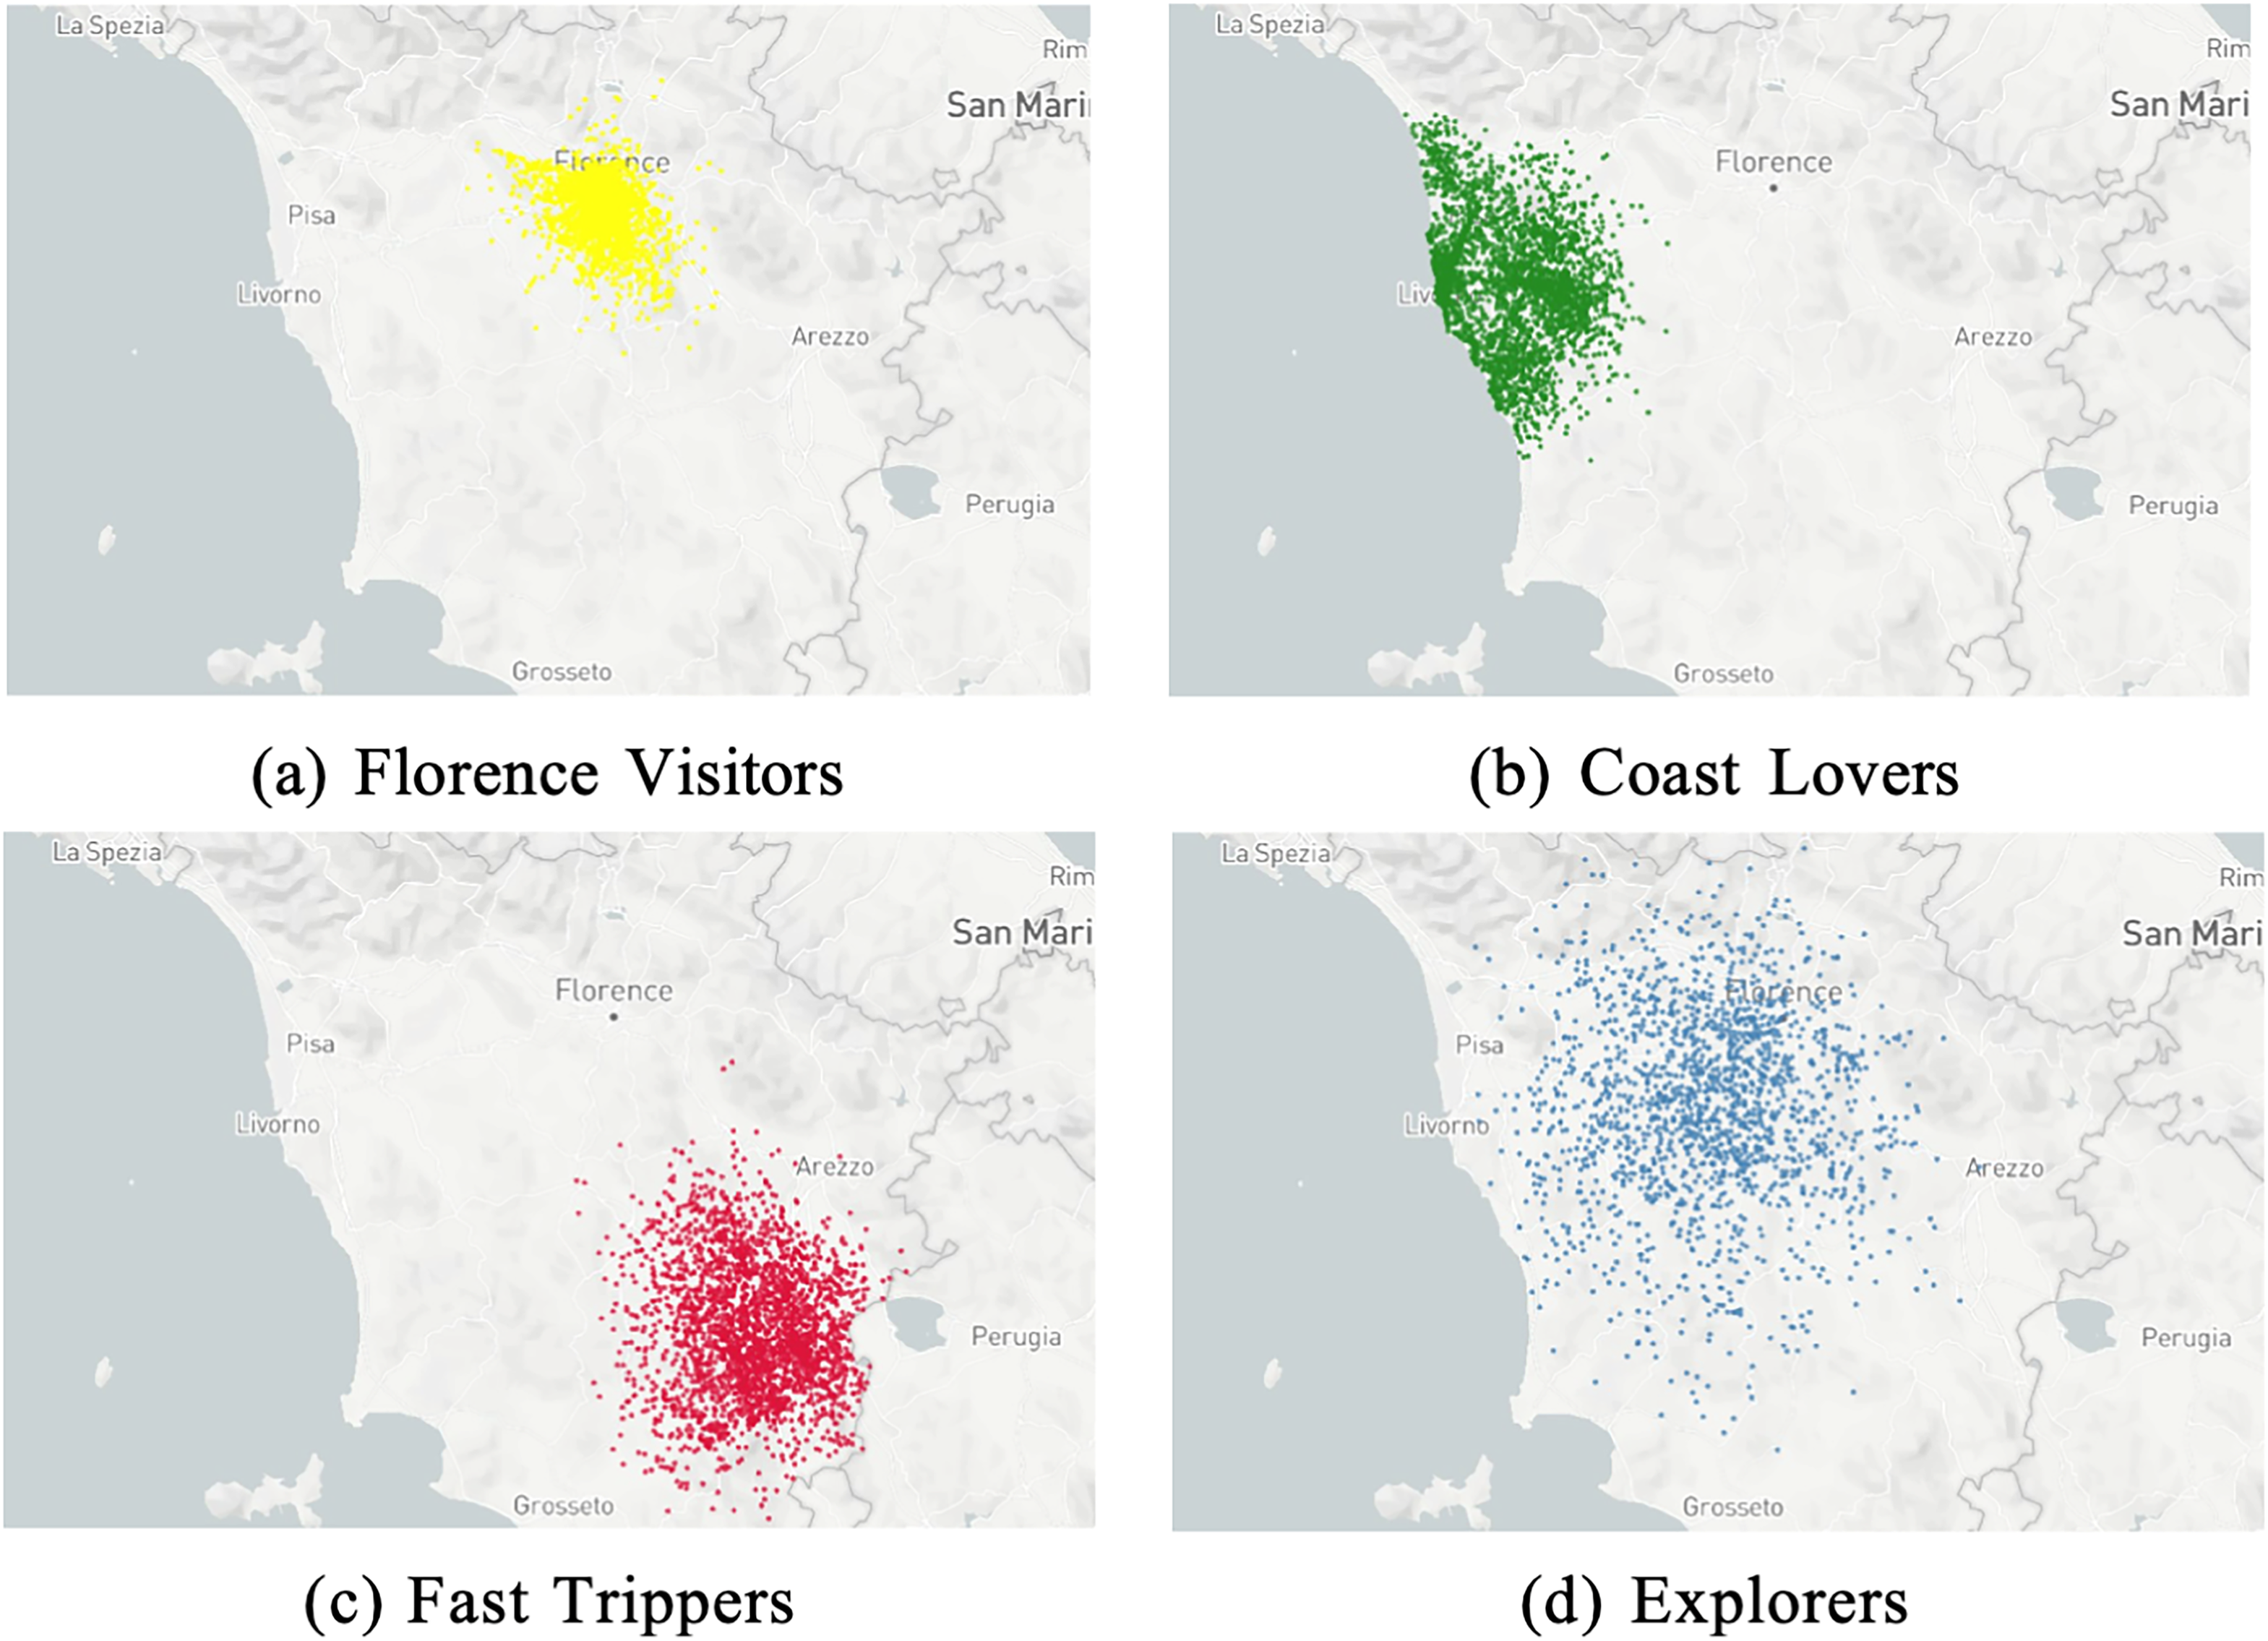
Average locations of tourists that have the closest distance to the centroids of clusters.
Feature values of the centroid of each cluster.
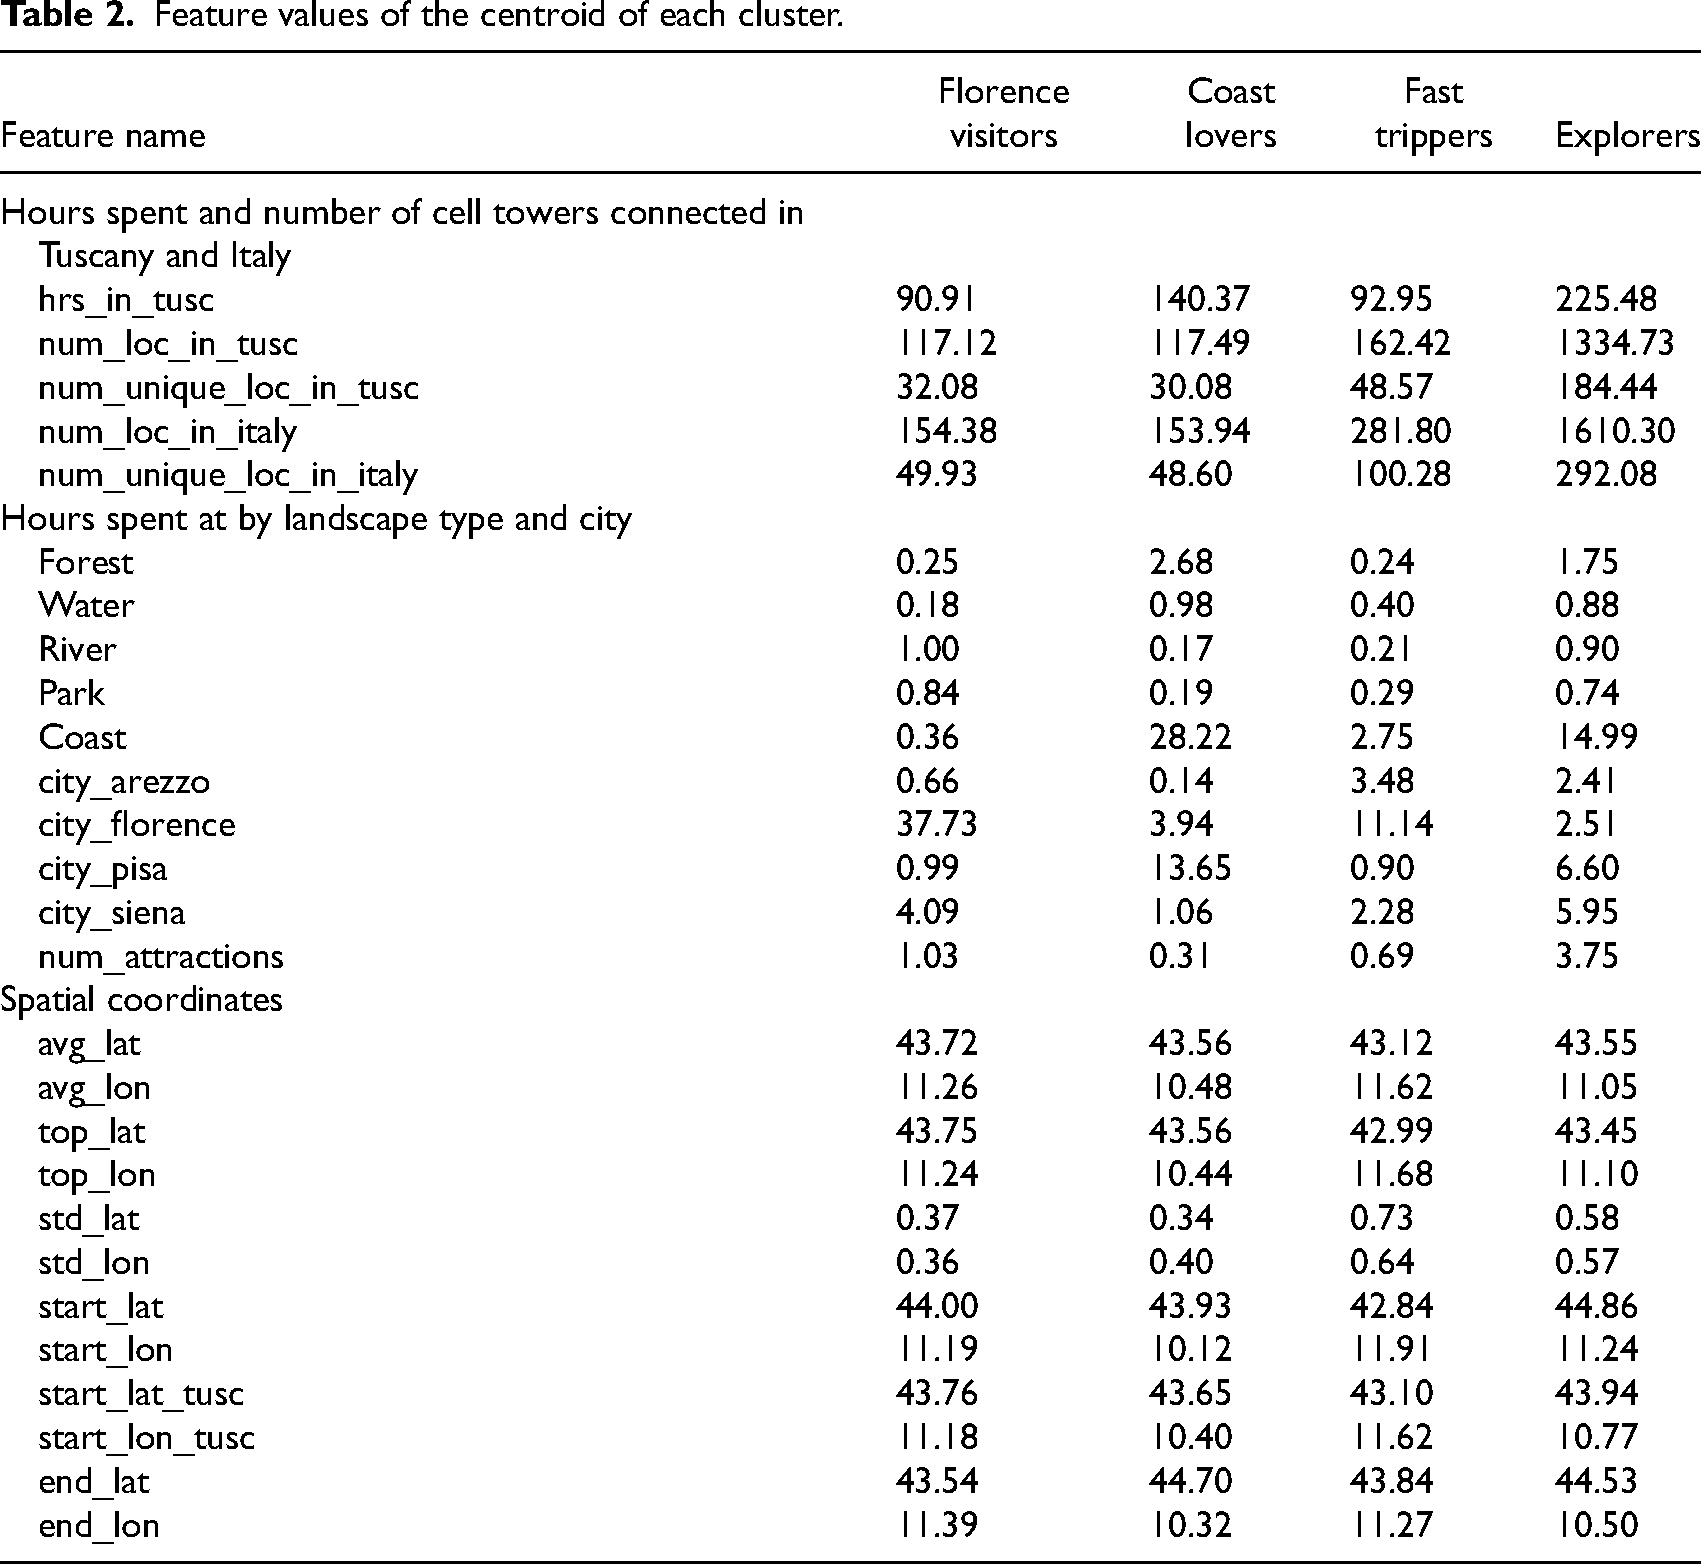
The “Florence Visitors” cluster represents approximately 40% of the sample. These visitors typically have the shortest average stay in Tuscany, at 3.9 days. As suggested by their designation, their primary focus is Florence, where they spend 40% of their time in the region, with a few additional hours in Siena. The predominant nationalities within this cluster are the United States, accounting for 27%, followed by the United Kingdom at 19%.
“Coast Lovers,” make up 28% of visitors. They stay in Tuscany an average of 5.8 days and they exhibit a preference for visiting fewer locations in proportion to their stay. The cluster's name stems from its members’ pronounced inclination toward the coastal areas. They spend a considerable amount of time in Livorno and Pisa, with brief visits to Lucca and Florence. This cluster has a high representation of visitors from Germany (40.8%) and France (19.6%).
“Fast Trippers,” account for 21% of the sample. Their duration of stay mirrors that of the “Florence Visitors” at 3.9 days, but their spatial preferences diverge. “Fast Trippers” allocate more time to coastal areas and comparatively less to Florence. The capital of the region is still their most frequented destination, but additional short visits are made to Arezzo and Siena. The primary countries of origin for this cluster are China (25.6%) and the United States (22.9%).
“Explorers” represent 11% of visitors and are characterized by a proclivity for extended stays in the region, averaging 9.4 days. They exhibit a comprehensive exploration pattern, traversing various cities and attractions, coupled with significant coastal visits. Although they frequent all major Tuscan cities, the proportion of time spent in each is relatively reduced. Pisa, Siena, and Lucca emerge as their preferred destinations. Most “Explorers” are from Germany (34%) and France (20.6%). Notably, they predominantly visit during the summer, as 58% of this cluster's members are summer visitors.
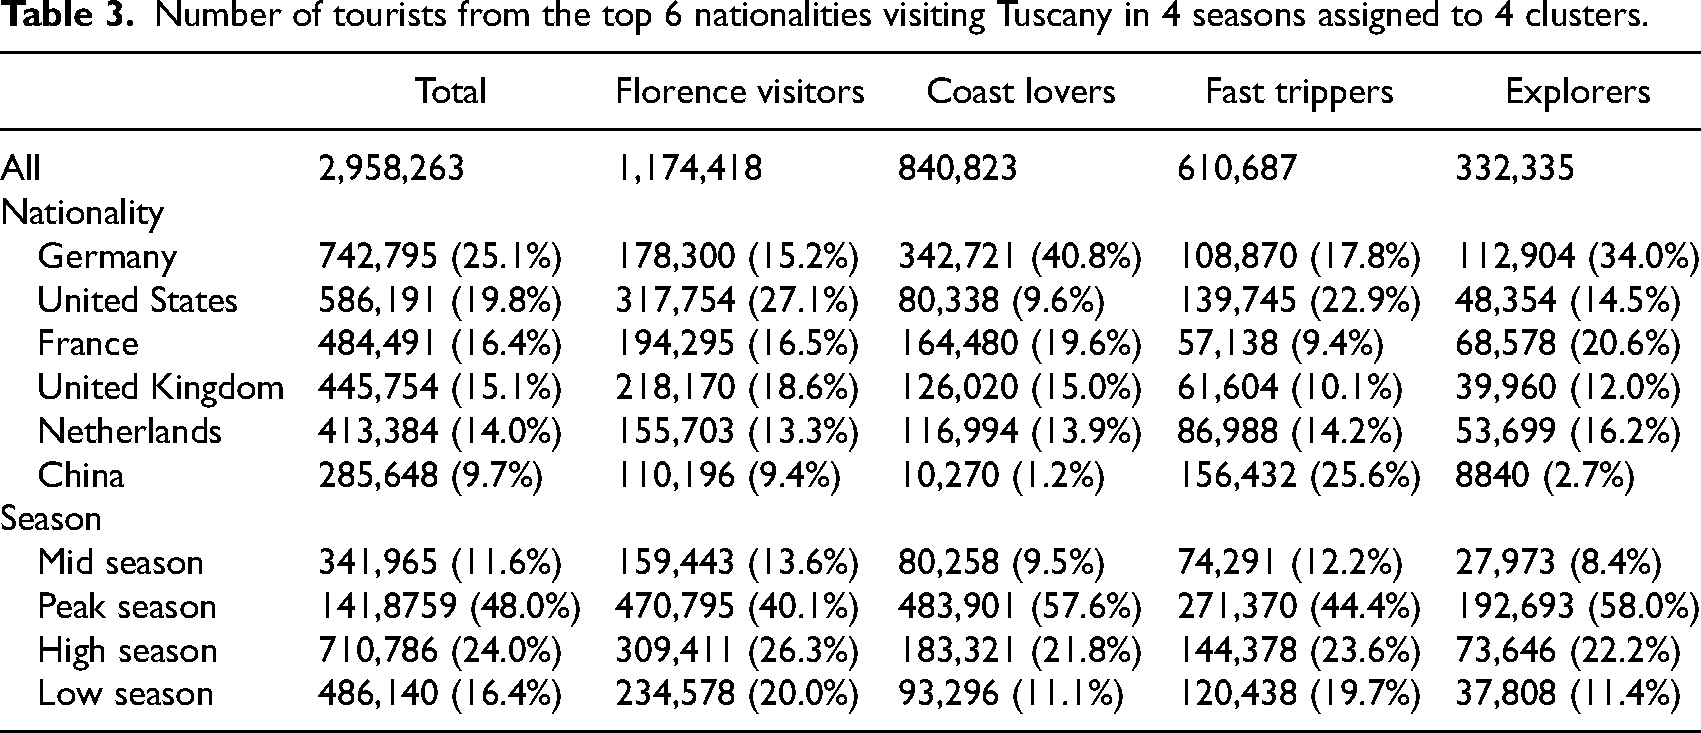
Table 3 details the distribution of the top six nationalities across the four segments and their seasonal visitation patterns. The clustering results highlight the nuanced behaviors of tourists from different countries regarding their Tuscany tourism preferences. For instance, German and French tourists predominantly belong to the Coast Lovers and Explorers segments. In contrast, tourists from the United States and China are more prevalent in Florence Visitors and Fast Trippers segments. Tourists from the United Kingdom predominantly align with cluster Florence Visitors, while those from the Netherlands are more associated with Explorers. Meanwhile, seasonal variations also influence mobility patterns. For instance, tourists visiting Tuscany during the low season, mid-season, and high season are predominantly represented in Florence Visitors, whereas peak season visitors are more aligned with Explorers.
Number of tourists from the top 6 nationalities visiting Tuscany in 4 seasons assigned to 4 clusters.
Post hoc analysis
Figure 5 presents the top 10 discriminative features for each segment, as derived from the SHAP model. These are ranked based on their importance and the warmth (or coldness) of each feature's color signifies its high (or low) level.
Florence Visitors (see Figure 5(a)): As anticipated, this segment tends to allocate more time to Florence. Their spatial behavior leans toward visiting areas with higher latitudes and longitudes in northeastern Tuscany. Demographically, they predominantly hail from the United States, with a noticeably reduced representation from Germany. Coast Lovers (see Figure 5(b)): This segment presents a contrasting spatio-temporal behavior compared to the Florence Visitors. Their visits are concentrated in areas with lower latitudes and longitudes, pointing toward southwestern Tuscany. Interestingly, they are more likely to originate from Germany and less so from the United States. Their travel pattern suggests a preference for staying in a limited number of locations rather than extensively touring Tuscany. Fast Trippers (see Figure 5(c)): This segment is characterized by their visits to areas with lower latitudes but higher longitudes, gravitating toward southeastern Tuscany. Their stays in Florence are notably shorter in comparison to other segments. Explorers (see Figure 5(d)): This adventurous group exhibits a tendency to explore a plethora of locations, not just within Tuscany but also throughout Italy. Their spatial behavior is marked by visits to areas with higher latitudes. It's noteworthy that both the Fast Trippers and the Explorers have a diminished likelihood of being from the United States.
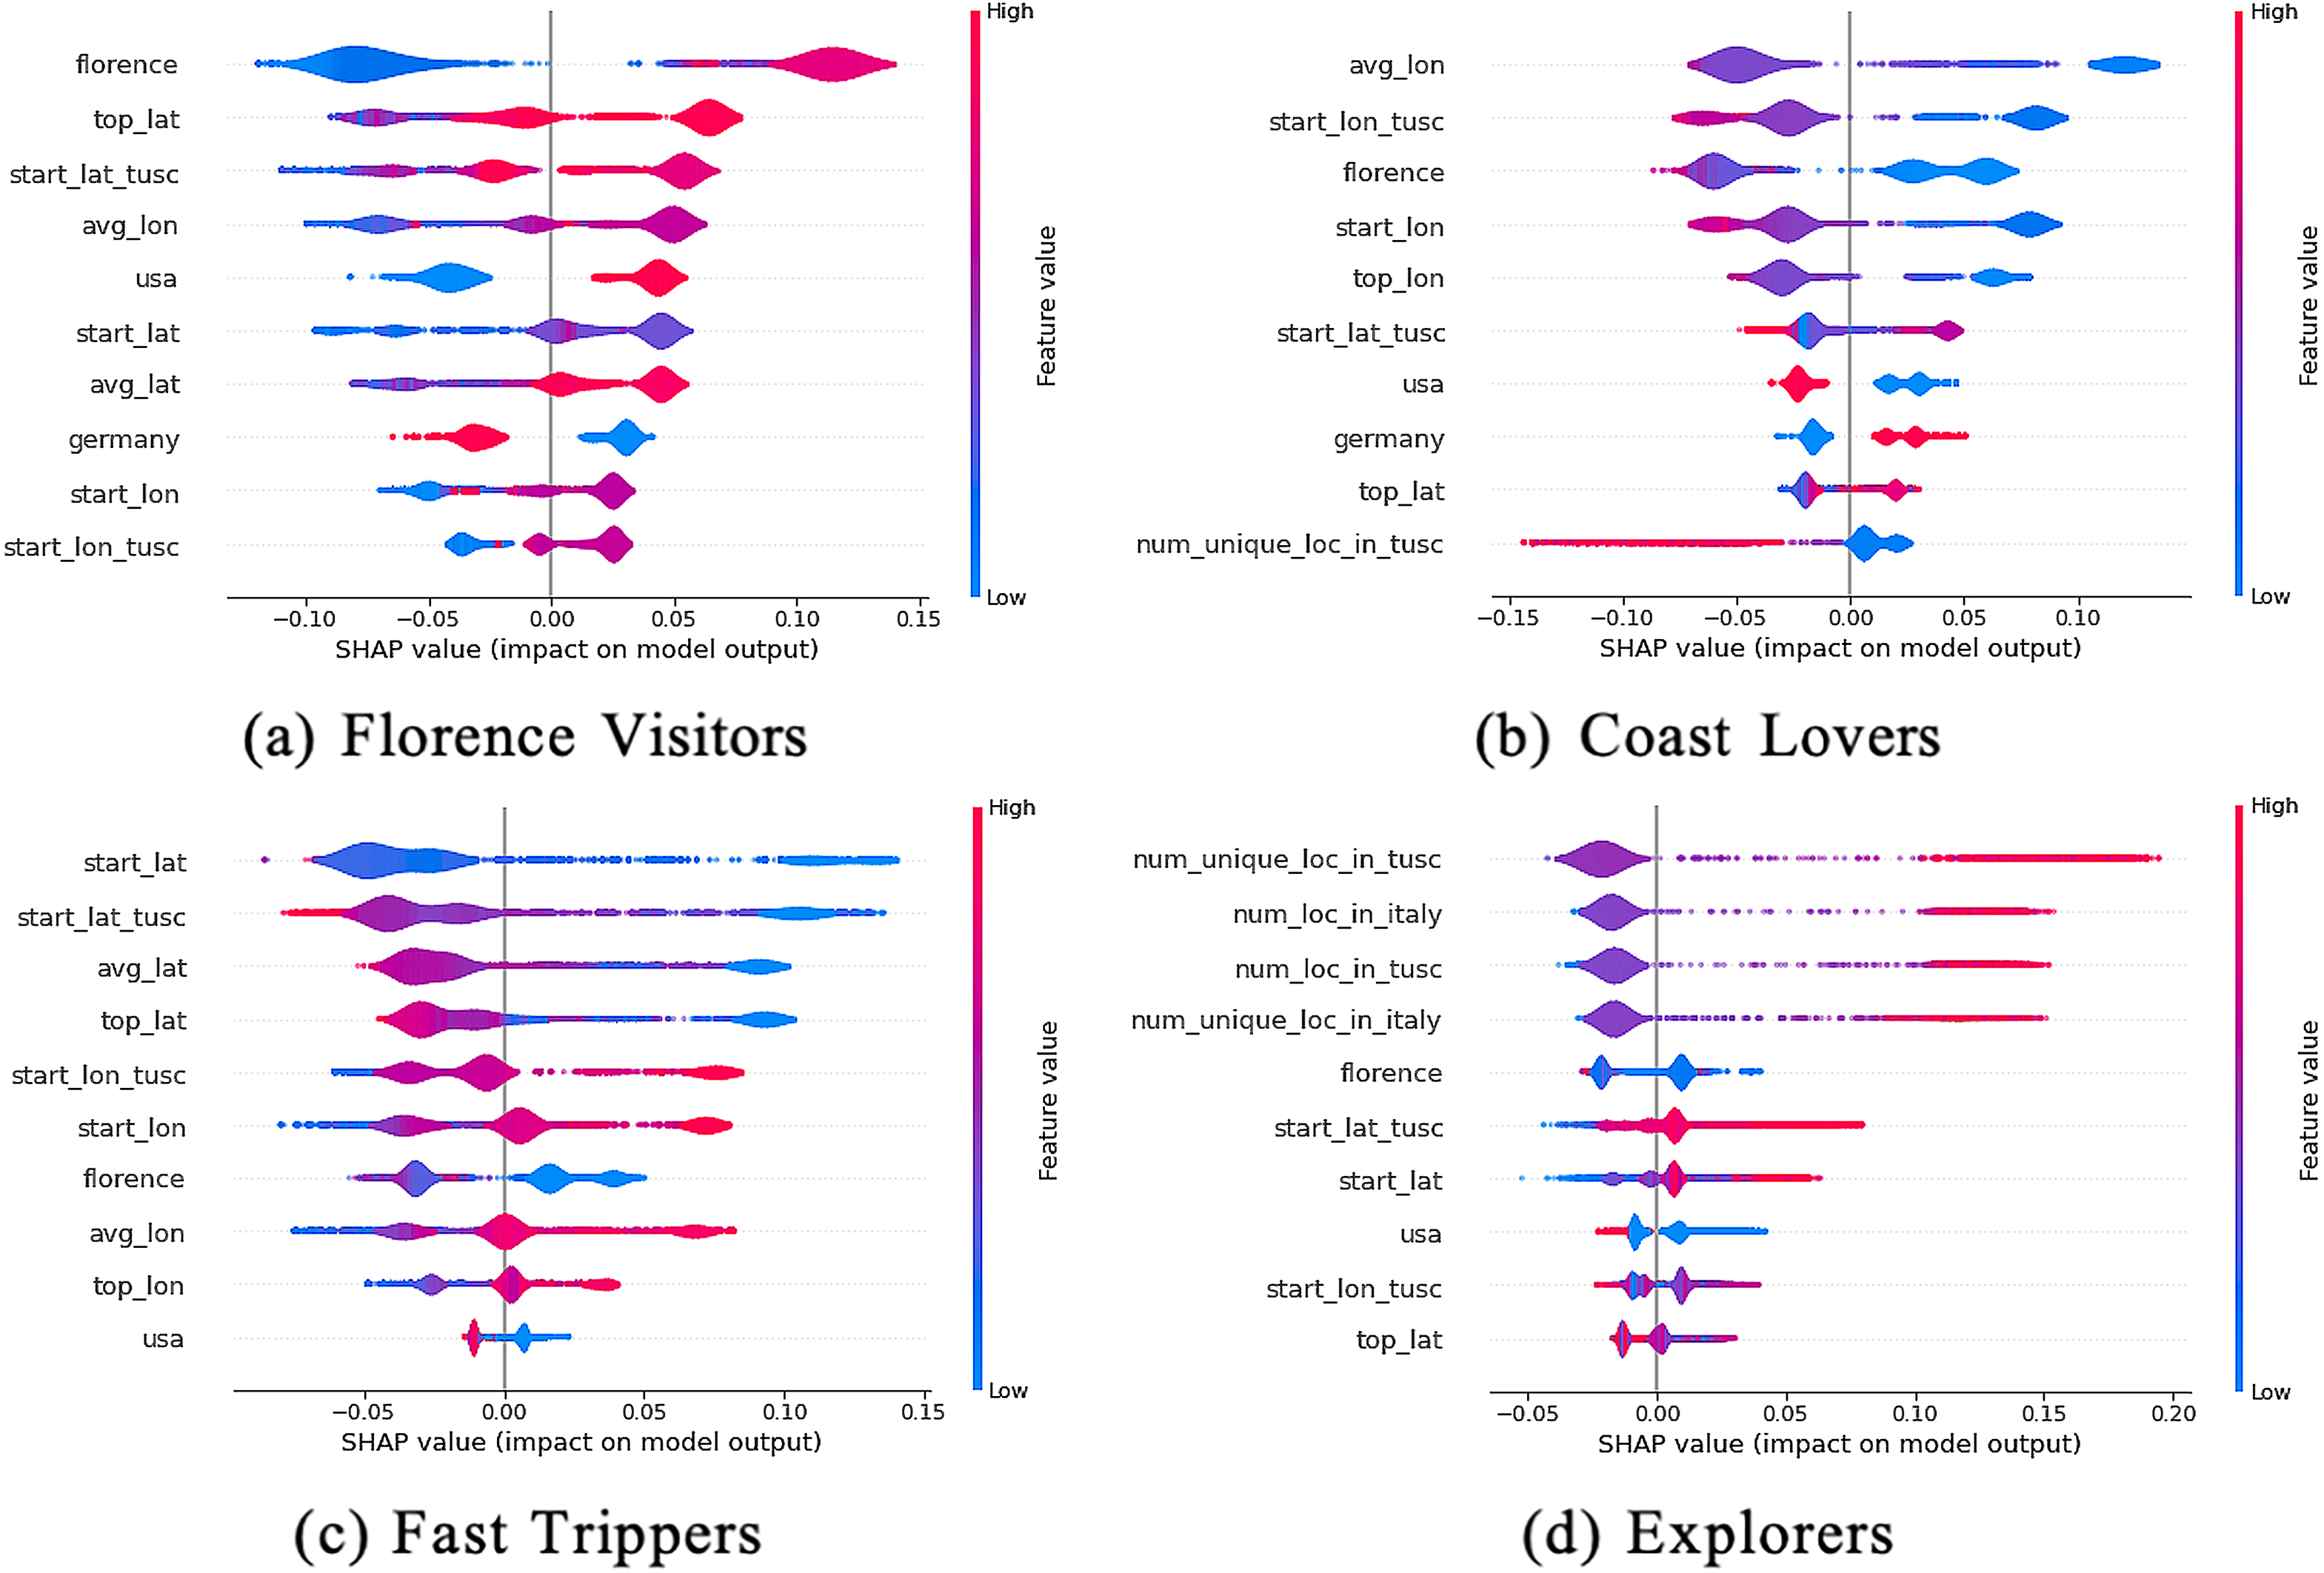
Illustration of top discriminative features for each segment.
Discussion
The investigation of tourists’ spatiotemporal behavior using a combination of three types of data has revealed several significant findings. First, the results of the study highlight the diverse exploration patterns of international visitors to Tuscany. The four clusters identified represent distinct behaviors in how the destination is consumed in terms of space, time, and nature of activities, confirming the well-recognized heterogeneity of visitor spatiotemporal behavior (Versichele et al., 2014). The identification of segments that distinguish between more and less active visitors has been a common finding in previous research (De Cantis et al., 2016; Espelt and Benito, 2006), however, the nature and scale of the differences, have varied across studies.
The originality of this study's findings lie in the nuanced patterns uncovered by through the cluster composition regarding nationality and timing of visits. The study demonstrates how some nationalities dominate certain clusters while others exhibit a more balanced distribution relative to cluster size. For instance, German visitors have a strong representation in “Coast Lovers” (40%) and “Explorers” (34%) but a smaller presence in “Florence Visitors” (15%), indicating a stronger inclination toward specific tourism experiences. Conversely, visitors from the Netherlands maintain consistent representation across clusters, between 13% and 16%, reflecting a more balanced distribution of interests and preferences. Additionally, the contrasting behaviors of “Fast Trippers” (predominantly from China or the United States) and “Explorers” (mainly Europeans, especially Germans) generally concur with the distance-decay effect explored in existing literature (McKercher, 2021), but offer a deeper level of detail to the phenomenon. In particular, the distinct behaviors and preferences within both distant and closer markets demonstrate varied ways in which visitors respond to travel distance and the complexity of visitor movement.
Overall, these findings contribute to the growing discussion on how the origin of visitors, distance traveled, and seasonality affect how space is consumed (De Cantis et al., 2016; East et al., 2017; Md Khairi et al., 2018; Zhao et al., 2018). More importantly, they underscore the intricate interplay between these factors, revealing underlying trends in visitor movement. These insights offer a valuable understanding of visitor behavior and have significant implications for tourism management and marketing strategies.
Furthermore, while previous literature has acknowledged the varied ways tourists visit destinations and emphasized the importance of examining movement patterns (Raun et al., 2016; Zhao et al., 2018), it has also highlighted the need for integrating diverse data sources (East et al., 2017). This integration can yield a more nuanced differentiation of tourist behaviors, ultimately leading to more effective marketing strategies. Accordingly, this study also makes a methodological contribution to the study of tourist movement by not only adding to the growing evidence that mobile data is useful in understanding tourists’ movement (Han et al., 2021; Nyns and Schmitz, 2022) but more importantly, by demonstrating that the integration of different data sources can offer significant layers to the analysis. In the case of this study, the combination of mobile signaling data, points of interest, and landscape categorization offered insights into tourists’ potential activities at specific locations.
The importance of this paper extends beyond the theoretical knowledge. The study suggests that segmentating visitors based on spatiotemporal behavior can be a powerful tool for optimizing destination management and marketing by identifying the most beneficial visitor segments. As argued by McKercher et al. (2023a), it is important to choose segmentation approaches that are aligned with a destination's needs. The recent explorations of the concept of yield in tourism systems and its importance for sustainability and competitiveness (Becken and Simmons, 2008; Lundie et al., 2007) have been gaining increasing traction and high- lighting the need for an optimization approach in destination marketing and management (Sun et al., 2020). Similarly, enabling and promoting the dispersal of visitors is seen as crucial for regional economic development (Koo et al., 2012), in particular in light of the growing focus on sustainable or even regenerative tourism. In this context, the findings highlight, for instance, the predominance of “Florence Visitors” across all seasons, accentuating Florence's significance as the primary draw card in the region but, at the same time, the need to attract other segments and therefore diversifying the demand mix or to change the behaviors of this segment. Additionally, the study identifies a potentially fundamental segment for the sustainability of the region, the Explorers, with longer stays, a considerably higher dispersion, lower emissions (given the proximity of the source market), and potentially higher yields.
A solid understanding of the characteristics of the different clusters can then enable the prioritization of certain clusters in the promotional activities and contribute to achieving a balance between the various segments and leveraging certain characteristics of each of them. Identifying the preferred segments and defining a strategy regarding which segments to attract throughout the year can assist in the creation of a marketing strategy aligned with the destinations’ goals. Finally, the differences found across the different segments can be leveraged by the region to target advertising campaigns for specific markets focusing on particular types of experiences. These insights can also be utilized to inform promotional efforts targeting specific groups of visitors already present in the region at a given time.
The study also underscores the increasing relevance of data providers in shaping tourism-related public policies. Mobile operators possess invaluable data on individual movement patterns, primarily used for essential services like calls and internet access. The recent commercial exploration of this data suggests a promising future for data-driven tourism management. Enhancing data accessibility is paramount to fostering innovative research and insights for tourism management. The private nature of mobile data poses accessibility challenges, however, open data initiatives, like those in Tuscany, exemplify commendable practices that can stimulate important research.
Limitations and further research
While this study contributes to the expanding body of knowledge on tourist movement and tourist segmentation, it is not without its limitations. The first relates to the data used, particularly the issues of location accuracy and representativeness associated with mobile data. Positioning accuracy is contingent upon various factors: the density of cell towers, which is higher in urban areas, enhancing accuracy in those areas and reducing it in more remote settings; the landscape's configuration, which can disrupt signals causing devices to connect to more distant towers and misidentify the location of the device; and the utilization of triangulation techniques which assist in pinpointing a device's precise location. Accordingly, the data may not always reveal the precise location of users. Additionally, the dataset from a single mobile operator may only capture a portion of the total foreign visitor population, potentially limiting representativeness.
Second, the study did not investigate the sequences of visited locations (each location visited being considered as an independent element) or the pace of movement. Future research could explore the actual sequence of activities which could contribute to a deeper understanding of movement and enable real-time visitor management. Moreover, given the inherent variability in visitors’ spatial patterns and visit frequency, their exploration speeds are also expected to vary. Third, the findings may have limited generalizability. Although Tuscany is recognized as a major tourist hotspot, each destination has a unique combination of demand and supply elements that shapes its tourist system and influences visitor behavior. As a result, the visitor profiles found in this study may not fully represent the broader dynamics of tourism behavior in other regions or countries.
Future research could examine the evolution of visitor behavior across different destinations and over time, to determine if similar tourist spatiotemporal behaviors emerge. Such comparative analyses could enable the potential development of a universal typology of tourist movement. Given the current data-rich landscape, and the expansion of services and technologies, these analyses are increasingly feasible and relevant. Large language models (LLMs) and large neural networks, with their capacity to process vast amounts of data, may reveal hidden patterns that current methods do not capture. Furthermore, integrating additional Big Data sources, such as social media analytics and insights from prominent platforms, could provide a more holistic understanding of tourist movement and broader behavior.
Footnotes
Declaration of conflicting interests
The authors declared no potential conflicts of interest with respect to the research, authorship, and/or publication of this article.
Funding
The authors disclosed receipt of the following financial support for the research, authorship, and/or publication of this article: Orsolya Vásárhelyi was funded by the European Union under Horizon EU project LearnData, 101086712. European Union under Horizon EU project LearnData (grant number 101086712). Qiwei Han and Leid Zejnilovic were funded by by Fundação para a Ciência e a Tecnologia (UIDB/00124/2020, UIDP/00124/2020, UID/00124, Nova School of Business and Economics and Social Sciences DataLab - PINFRA/22209/2016), POR Lisboa and POR Norte (Social Sciences DataLab, PINFRA/22209/2016). In addition, we acknowledge the support from Toscana Promozzione Turistica in terms of research question specification and professional advice. Also, we acknowledge the support by Vodafone Italy for sharing the data within the context of the Data Science for Social Good Summer Fellowship at Nova School of Business and Economics.
_in_terms_of_nights_spent_in_tourist_accommodation_establishments,_2016.png%26oldid=355856)