
Abstract
The increasing popularity and accessibility of virtual reality (VR) presents an opportunity for destination marketers to leverage its strengths to attract visitors. However, VR's benefits over more traditional media formats remain unclear. This paper reports results from two experiments that compared the impacts of consuming destination marketing material through VR with other media formats. The measured impacts include destination image, perceived advertising effectiveness, and behavioral intentions. Further, the dual experiments allowed for a comparison between different VR content styles (i.e. active vs. passive). Results show that more active VR content largely outperformed other media formats, but with a more passive style of VR these benefits were mostly muted. The findings have direct theoretical and practical implications relating to VR tourism marketing.
Introduction
Virtual reality (VR) technology offers users immersive experiences in which they feel present in a virtual environment (VE). VR has received increasing attention in recent years from both tourism academics and practitioners (Loureiro et al., 2020; Yung and Khoo-Lattimore, 2019). Numerous potential applications have been explored in practice and academe, including providing experiential entertainment on-site at attractions and tourism sites (e.g. Jung and tom Dieck, 2017; Mine et al., 2012), increasing accessibility to hard-to-reach or fragile sites (Sambhanthan and Good, 2013), enhancing the education of potential visitors (e.g. Griffin and Muldoon, 2020), assisting destination planners, and serving as a marketing tool (Guttentag, 2018; Hobson and Williams, 1995). For tourism marketers, the virtual simulation of places and experiences offers particular value by reducing the perceived risk of intangible services and distant products, helping consumers make more informed decisions and establish more realistic expectations that can improve satisfaction (Klein, 2003). There are many examples of tourism industry providers utilizing VR for marketing (e.g. Gaudiosi, 2016), and scholarly research on the intersection between VR and tourism has focused predominantly on this aspect (Yung and Khoo-Lattimore, 2019; Yung et al., 2021a, 2021b).
Destination marketing often focuses on enhancing the potential visitor's destination image. Destination image refers to what individuals know about a destination and the emotions it inspires (San Martín and Del Bosque, 2008). Practitioners need to understand how to communicate with potential visitors, as different consumer groups respond to certain types of messaging and channels in diverse ways that can be leveraged to varied effect (Chang, 2021; Dedeoğlu et al., 2020; Fjelldal et al., 2021). As VR technology has become more prevalent, there has been growing interest in examining the impact of VR on destination image. In general, research has confirmed a positive effect, with an experience of a virtual representation of a real place enhancing attitudes and behavioral intentions (Huang et al., 2013; Tussyadiah et al., 2018). However, findings on VR's effectiveness have been varied, as some studies have determined VR has a greater impact than other media formats (e.g. video, websites), whereas other studies have shown limited differences, particularly when it comes to behavioral intentions. Further, most destination image research has considered VR content homogenously, without considering the impact of different content and styles.
Therefore, the purpose of this study is to compare the impact of destination marketing content presented via VR with other technology-based media. Further, by conducting two separate experiments using content from different national Destination Marketing Organizations (DMOs) (South Africa and Australia), this study provides a comparison between different styles of VR material. The primary research questions this paper addresses are:
Is VR more effective than other types of technology-based media at enhancing destination image and promoting behavioral intentions? Do users perceive VR as a more effective advertising format than other types of technology-based media? Do the impacts of viewing destination marketing content in VR differ depending on the style of the content?
To answer these questions, 374 undergraduate students from a North American university participated in two experiments where they were shown destination marketing material in one of four media formats (VR, 2D videos with 360° navigation, 2D video, or a website). Respondents subsequently answered questions about destination image, advertising effectiveness, and behavioral intentions. This paper contributes to the existing literature by furthering understandings of the comparative ability of VR to enhance destination image, and also offers novel insights into the importance of the content and style of VR materials. The findings offer important implications regarding VR and destination marketing, and are of both theoretical and practical value.
Literature review
Destination image
Tourism is an intangible product, which poses significant challenges for destination marketers seeking to attract consumers without the opportunity to trial the experience. Destination marketing must therefore instil confidence in potential visitors of what a destination has to offer in terms of the facilities and services, as well as the overall emotional experience a visitor can expect (Echtner and Ritchie, 1991). This concept is referred to as destination image, a somewhat nebulous term conceptualized in myriad ways, but which essentially refers to the overall impression that an individual holds about a destination (Kock et al., 2016). There are two main components– cognitive image, which refers to one's beliefs or knowledge on what a destination offers (the natural environment, cultural heritage, infrastructure, etc.), and affective image, which refers to one's feelings and emotional responses towards a destination (exciting, pleasing, etc.) (San Martín and Del Bosque, 2008). Some researchers also conceptualize destination image as encompassing a third component, conative image, referring to behavioral actions towards a destination (seeking information, booking, visiting, sharing recommendations, etc.) (Agapito et al., 2013); for the purposes of this study however, such actions are conceptualized separately as behavioral intentions.
Destination image has received considerable attention in the tourism literature. For example, Pike (2002) reviewed 142 papers on destination image published between 1973–2000, Stepchenkova and Mills (2010) conducted a meta-analysis on 152 articles published between 2000–2007, and Nghiêm-Phú (2014) reviewed 177 articles published between 2008 and 2012. Unsurprisingly, researchers have tended to find that positive destination image is associated with increased intentions to visit and other desirable behaviors. For example, such a relationship was associated with potential visitors’ interest in visiting Malaysia after the COVID-19 pandemic (Ahmad et al., 2020), Americans’ interest in visiting Cuba (Chaulagain et al., 2019), and Taiwanese interest in visiting Hong Kong (Tan & Wu, 2016). Destination image derives from personal factors (e.g. motivations and socio-demographics) and information sources, which may be primary (e.g. memories) or secondary (e.g. news, friends and family, or advertising) (Beerli and Martin, 2004).
Tourism advertising is one lever for destination marketers to affect destination image, with varying levels of effectiveness. Although advertising has been found to improve destination image (e.g. Bojanic, 1991), there are dissenting views. Govers et al. (2007), for example, found tourism advertising only had a limited impact compared with word-of-mouth and online reviews on destination image formation. The context within which consumers experience the advertising is also important; for example, Gong and Tung (2017) found mini-movie advertising influenced destination image the most when viewers were motivated to travel and unaware they were watching an advertisement. Clearly, some advertising efforts are more effective than others and efficacy varies depending on consumer groups, their relationship to the destination being advertised, and the context within which the advertising is being presented. The onus is on destination marketers to understand their potential clients, and utilize the tools available to them to produce optimally effective advertising campaigns.
Advertising effectiveness
Tourism marketers have numerous decisions to make when generating advertisements, including the content and messaging, and media format(s) to use. Researchers have examined tourism advertising effectiveness from a variety of angles, including on a conceptual level (e.g. Kim et al., 2005), assessing the effectiveness of different methods (e.g. Scott et al., 2016), and examining various strategies (e.g. Byun and Jang, 2015). Some have specifically compared media formats; as Kim et al. (2005) note, “[d]ifferent media channels are known to have their own strengths and weaknesses in delivering different types of advertisement messages” (p. 42). For example, Tutaj and Van Reijmersdal (2012) found sponsored online content to be more effective than banner ads, and Belanche et al. (2019) found Instagram stories to be more effective than Facebook walls. As these examples underscore, the advent of new technologies, and the ways in which consumers use them, has continuously presented new channels for tourism marketers to exploit.
Visual imagery has long been adopted by marketers to communicate an understanding of what an experience offers, producing a stronger mental imagery for the consumer (Huang et al., 2013; MacKay and Fesenmaier, 1997). Images enhance the feeling of being able to explore a destination, which can positively impact attitudes and purchase intentions (Van Kerrebroeck et al., 2017). Further, images help users position themselves within the representation, and seeing people one identifies with strengthens one's connection to a destination (Tussyadiah and Fesenmaier, 2009). Mental imagery allows consumers to create a narrative within which they can situate themselves, but also set expectations of what the actual experience will be like (Walters et al., 2007). Advertising that has elements of interactivity, allowing viewers to position themselves within the experience or use the product, has been demonstrated to positively affect purchase intentions (Daugherty et al., 2008; Liu and Shrum, 2002). A more vivid picture—meaning high quality and detailed—“holds attention and excites the imagination” (Walters et al., 2007: 26), stimulating greater mental imagery and eliciting more response towards travel than mere textual descriptions (Lee and Gretzel, 2012; MacKay and Fesenmaier, 1997).
Virtual reality marketing
All media types have the potential to spark mental imagery and transport the consumer to a different place, but VR has clear distinctive and advantageous characteristics. Central to the VR experience is the concept of presence, which is “the extent to which one feels present in the mediated environment, rather than in the immediate physical environment” (Steuer, 1992: 76). Presence is promoted via interactivity (i.e. engagement) with the VE, the vividness of the representation, and immersion within the VE (Sanchez-Vives and Slater, 2005; Yung et al., 2021a, 2021b). In other words, feelings of presence increase as users gain greater ability to navigate and modify the VE, as the breadth (variety of sensory dimensions) and depth (resolution and quality) of the output is enhanced, and as the user is more fully immersed in the virtual world and separated from the real world (Steuer, 1992; Yung et al., 2021a, 2021b). Head-mounted-displays (HMDs) represent the quintessential VR device (Beck et al., 2019) (and what is referred to as “VR” throughout this study). HMDs cover the user's entire eye area, restricting the view of the real world, and allow navigation of a VE by moving the head, adjusting the displayed images in a natural and immediate way, offering a comparatively high level of control and immersion (Flavián et al., 2019).
VR can be a tool for tourism marketers to offer a “try-before-you-buy” experience (Flavián et al., 2021: 10), promoting positive expectations and attitudes during the decision-making pre-trip phase of the consumer journey (Cohen et al., 2014). Increasingly, practitioners are experimenting with the technology; for instance, Destination British Columbia (Clark, 2015), Carnival Cruises (Gaudiosi, 2016), and Best Western (Ting, 2016) have all undertaken VR-based marketing. By facilitating feelings of presence, VR can foster positive feelings towards a destination, which can in turn lead to visitation intentions (Tussyadiah et al., 2018). Moreover, a greater sense of immersion, and feeling engrossed by the virtual representation, helps form a stronger destination image (Tussyadiah and Fesenmaier, 2009), enhancing knowledge, brand awareness, and even consumer intentions (Gibson and O’Rawe, 2018). However, the nuances of advertising effectiveness are contextual, and VR's impacts versus other media formats is still not completely clear.
Various studies have assessed whether VR is more effective than other common media formats in specific situations. In comparison with marketing consumed through other media, amongst university students VR has been found to promote greater levels of presence, elaboration of mental imagery, and a greater brand experience than similar material consumed on websites and traditional videos (e.g. Bogicevic et al., 2019). Further, VR marketing was found to generate more positive emotional reactions and higher psychological and behavioral engagement, also among university students, towards a hotel property than information consumed using a desktop computed or mobile phone (Flavián et al., 2021).
Although it seems accepted that VR is more immersive, which increases levels of presence and in turn generates more enjoyment (Yung et al., 2021a, 2021b), the extent to which it then leads to greater cognitive and affective awareness (Diemer et al., 2015), and ultimately more visitors in comparison with other media, is contested. For example, Yung et al. (2021b) found VR experiences reduced perceived destination choice risk by enhancing both cognitive and affective destination image, whereas McFee et al. (2019) found limited differences in affective and cognitive image between two groups who watched material about Madrid via VR versus 360° video on a computer. Some have found that VR experiences of places have improved users’ intentions to visit a destination in real life (e.g. Alyahya and McLean, 2021; Manchanda and Deb, 2021; Tussyadiah et al., 2018), while others have demonstrated mixed results. Adachi et al. (2020) concluded that watching promotional tourism videos in VR versus on a desktop computer had a positive impact on destination image, but not on visitation intention, and Weng et al. (2021) found that VR generally outperformed print and video marketing for Chinese heritage sites in terms of advertising effectiveness, but the different conditions produced similar results relating to travel intentions. This finding is also supported by Pasanen et al. (2019), who found no significant differences between respondents who consumed similar materials on VR and tablets in terms of behavioral intentions towards a destination. Marasco et al. (2018) found that a VR experience of a local cultural site was reported as visually appealing, but the immersive nature of VR was itself “insufficient to engage [respondents] … as potential visitors” (p. 144). Further, the longevity of the consequences of VR marketing in comparison with other media is also contested. For example, Leung et al. (2020) explored reactions to a Hong Kong hotel video viewed in VR and traditional video, and found VR had more positive immediate advertising effects, but less impact in the long-term. In sum, the extant research suggests VR may have benefits over other media formats, but the findings are varied and additional insight is required.
It seems possible that the somewhat discrepant findings result from the varied contexts of users, their existing relationship with the technology and destination being promoted (Chang, 2021; Manchanda and Deb, 2021; Marasco et al., 2018), but also the different attributes of the marketing content being viewed. Just as some websites are more effective than others (e.g. Li and Wang, 2010), certain types of VR content will presumably prove more effective than others. To date, there is very limited research considering whether different styles of content may influence the impact of a VR experience. Two exceptions are Adachi et al. (2020), who found that using a tour guide versus a peer as an information source did not alter the impact on destination image or visitation intention, and Weng et al. (2021), who examined the effectiveness of advertisements for cultural and natural destinations and found mixed results. Optimizing VR content is critical, as marketers who invest in VR advertising want it to be as impactful as possible. The present research intends to help fill this gap by comparing different media formats as well as content produced by different destinations with dissimilar styles of presentation consumed by a sample sharing similar demographics.
Methods
Experimental design
Two experiments were conducted using destination advertisements for South Africa (Study 1) and Australia (Study 2). These destinations were chosen primarily due to the availability of promotional content produced by their respective DMOs. Moreover, both destinations are nations, and exhibit some similarities regardin the type of experiences they offer in relation to the sample: southern hemisphere, English speaking, coastal and natural landscapes, adventure, and wildlife (South African Tourism Board, 2016b; Tourism Australia, 2017b). Further, the geographic distance from the research setting meant participants were unlikely to have well-established destination images (Gallarza et al., 2002). Both studies were one-factor, between-subjects experiments that included various conditions to which participants were randomly assigned—VR HMD (VR), 2D video with 360° navigation (2D360, in Study 2 only), 2D video (2D), website (Web), and a control group (Control).
The sample was recruited via a university-sanctioned research pool, where instructors of Business School undergraduate classes choose to include their courses so that students could participate in research projects in return for small bonus grades. Participants reported to a central office, and were randomly directed to one of the conditions that were staffed by research assistants where they were asked to complete a consent form that revealed which media they would consume. Participants were then asked to consume the marketing and then complete a survey. The disadvantages of using this demographic as a sample are acknowledged, specifically as their generalisability to the wider population is limited. However, the use of such a convenience sample is fairly common in experimental research, including studies related to VR and tourism (e.g. Flavián et al., 2021; Leung et al., 2020). Further, this age group is more likely to use VR technology, and therefore be targeted with VR marketing (Adachi et al., 2020; Leung et al., 2020). This study's sample recruitment and size were consistent with other comparable studies (e.g. Adachi et al., 2020; Bogicevic et al., 2019).
Images of the stimuli used in this study are included as Appendices. In the VR condition, subjects used an Oculus Rift HMD, wired to a desktop computer, and watched a 360° advertisement video. For the 2D conditions, the exact same video content was shown to participants via a laptop computer. Subjects in the 2D condition could not adjust the video in any way. In response to preliminary insights gleaned from Study 1, researchers added a 2D360 condition to Study 2. The 2D and 2D360 videos in Study 2 were identical, but the 2D360 group could use a computer mouse to adjust the 360° viewing perspective. For the Web condition, the researchers recreated a website by taking screenshots, images, and articles from the relevant DMO website that covered the same activities presented in the videos (see Appendix A). The websites were offline, preventing participants from exiting the sites and accessing other resources, but the sites could be scrolled, and had a “home page” from which all other pages could be accessed. Web participants were allotted 3 min and 45 s to explore the websites, equal to the duration of the videos. Participants in the Control condition were not exposed to any destination marketing material.
Measurement items
After viewing their assigned marketing content, each participant completed a survey on destination image, advertisement effectiveness, and behavioral intentions; participants in the Control condition completed the survey items related to destination image and behavioral intentions, but not advertisement effectiveness. Items from established scales were adapted and presented on seven-point Likert scales for consistency purposes. Affective destination image was measured with an eight-item semantic differential scale adapted from Aaker (1997) and Martínez and Alvarez (2010) (sample item: unpleasant-pleasant). Cognitive destination image was not measured in Study 1, but was added for Study 2, as the researchers decided to broaden the scope of the constructs considered. Cognitive destination image was measured with a 21-item scale adapted from Beerli and Martin (2004), and involved items about the destination features (weather, nightlife, hotels, etc.). Advertising effectiveness was measured with items adapted from three existing scales. Five semantic differential items were adapted from Burton and Lichtenstein (1988), focusing on whether the content was informative, persuasive, believable, and convincing. Four more semantic differential items were adapted from Xu (2005), focusing on whether the content was realistic, entertaining, positive, and captivating. An additional seven items were adapted from Walters et al. (2007), focusing on the extent to which the content generated vivid mental imagery. Finally, four items related to behavioral intentions were included, asking subjects to rate their intent to visit in the next five years, seek further information, suggest the destination to friends and family, and share information about the advertisement. Information on demographics and previous travel was also collected.
Data analysis
All analyzes were conducted in SPSS. The affective/cognitive destination image and advertising effectiveness scales were subjected to principal component analysis (PCA) to identify underlying dimensions and reduce the number of variables for subsequent analysis. The PCA entailed oblique rotations with direct oblimin factor extraction. In deciding how many factors to extract, parallel analyzes were conducted and scree plots were consulted, which are preferable approaches than simply extracting all factors with eigenvalues greater than one (Field, 2013). The parallel analyzes were conducted using SPSS syntax developed by O’Connor (2000). Regressed factor scores were then saved for subsequent comparative analysis between subjects in the different conditions. The four behavioral intention items were analyzed independently, rather than being aggregated in any way, in order to better highlight possible differences between the various items. Data from subjects in the different conditions were compared with one-way ANOVAs, followed by Tukey's HSD post-hoc tests to identify significant differences between the conditions. However, in some cases the data did not pass ANOVA's homogeneity of variance assumption, so Welch tests and Games-Howell post-hoc tests were used instead.
Results
Study 1 (South Africa)
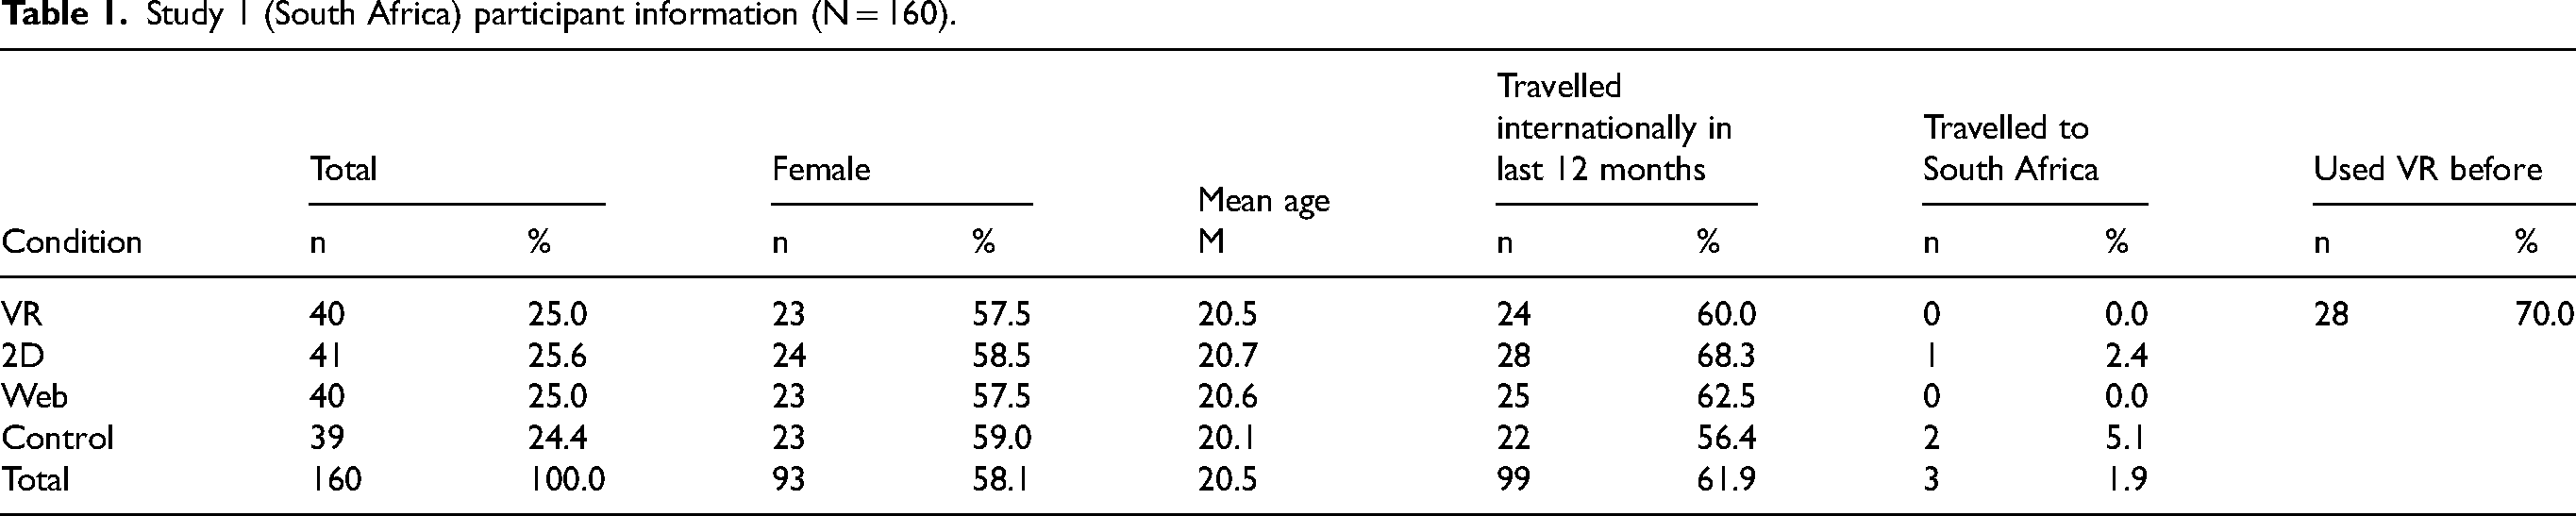
The South African video was taken directly from YouTube (South African Tourism Board, 2016a). The video was edited to 3 min and 45 s to show activities consistent with those available on the DMO website to increase consistency between conditions. The same experiences were therefore portrayed in the VR, 2D, and Web conditions: rock climbing, paragliding, elephant feeding, penguin viewing, walking through a lively restaurant, kite-surfing, and shark-diving (South African Tourism Board, 2016a, 2016b). A total of 160 participants were recruited for Study 1, with around 40 subjects in each of the four conditions, as profiled in Table 1.
Study 1 (South Africa) participant information (N = 160).
The PCA of affective destination image revealed a single factor, so the seven measurement items were simply averaged to generate an aggregate score. The results of the PCA for advertising effectiveness can be seen in Table 2. The resultant two-factor solution was very clean and interpretable, and it explained 59.25% of the total variance. The items were divided very logically, as the first factor (Effectiveness) entailed all of the items adapted from Burton and Lichtenstein (1988) and Xu (2005), whereas the second factor (Mental imagery) entailed all of the items adapted from Walters et al. (2007).
PCA results for advertising effectiveness (South Africa).
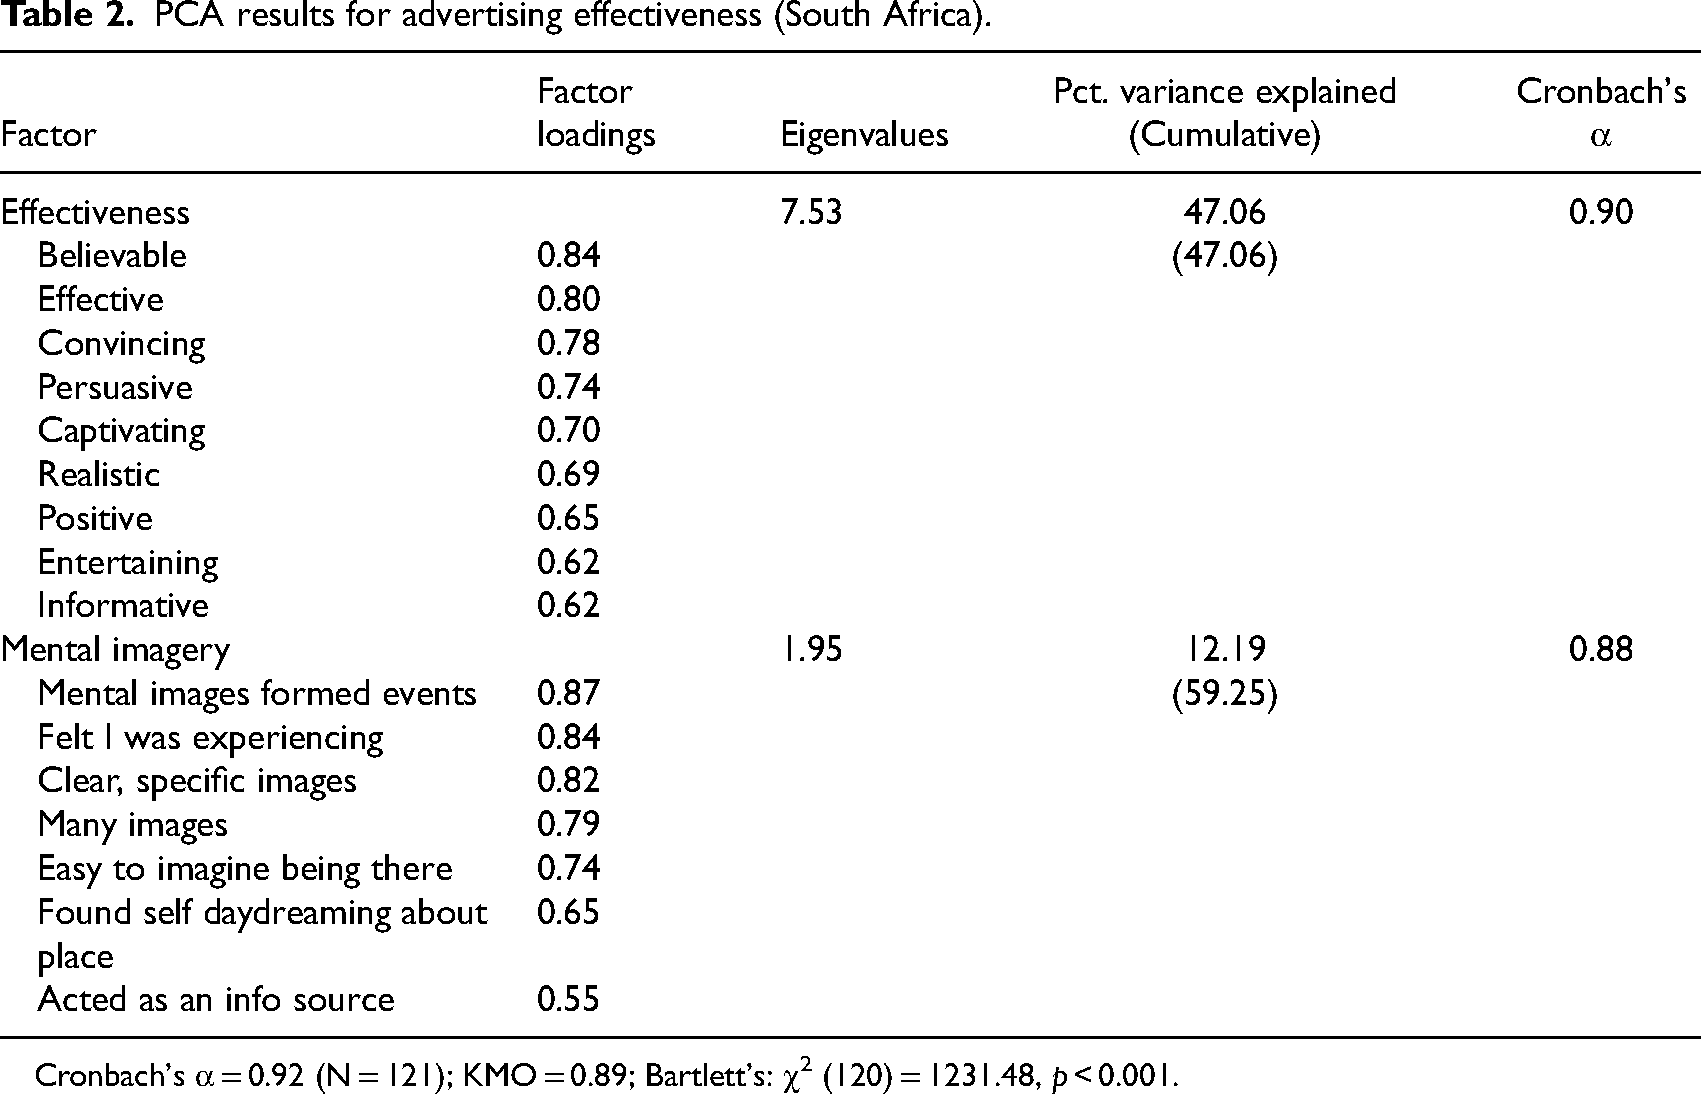
Cronbach's α = 0.92 (N = 121); KMO = 0.89; Bartlett's: χ2 (120) = 1231.48, p < 0.001.
The results of the ANOVA and Welch tests that compared subjects in the different conditions along affective destination image, perceived advertising effectiveness, and behavioral intentions can be seen in Table 3. Respondents in the VR condition indicated significantly stronger affective destination image than respondents in the Web or Control conditions, and notably stronger than respondents in the 2D condition as well. Likewise, respondents in the VR condition rated their content as more effective advertising than did respondents in the 2D or Web conditions along both the Effectiveness and Mental imagery factors. VR respondents were, furthermore, significantly more likely than others to feel they would share information about the advertisement and suggest the destination to others. Moreover, they were significantly more likely than respondents in the Web condition to claim they would seek further destination information. However, no significant differences were found with regards to the likelihood of visiting within the next five years. It is also worthwhile to look beyond merely the statistically significant results to note, more generally, that the VR condition received the highest absolute scores in every single measure in Table 3. Additionally, most of the measures demonstrated a clear pattern in which richer forms of media corresponded with stronger impacts (i.e. VR > 2D > Web > Control).
Group comparisons (South Africa).
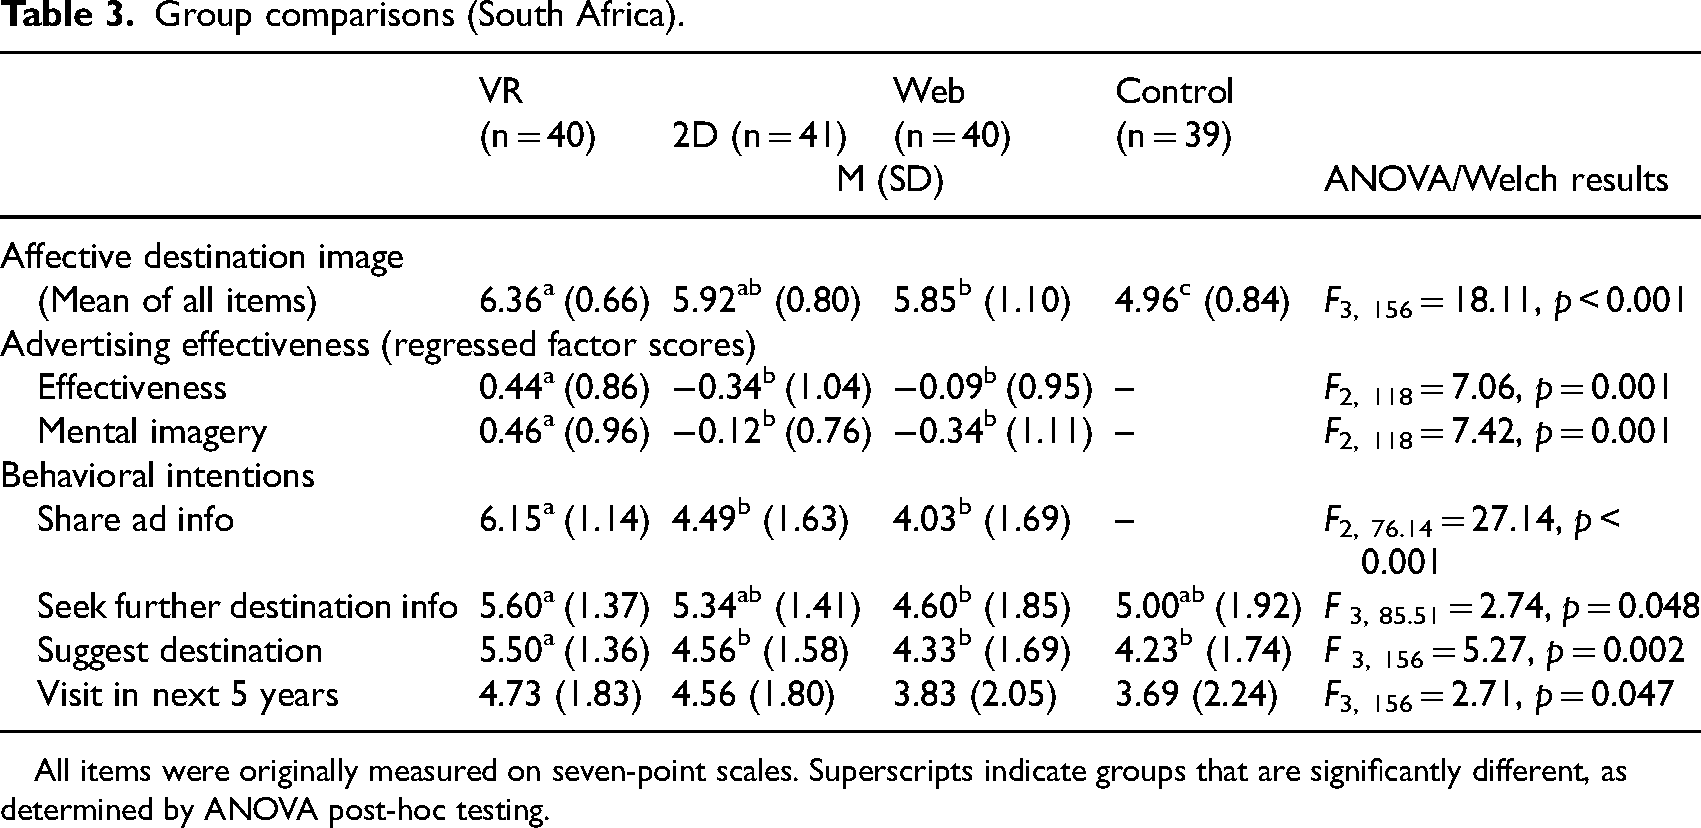
All items were originally measured on seven-point scales. Superscripts indicate groups that are significantly different, as determined by ANOVA post-hoc testing.
Study 2 (Australia)
The video used in Study 2 consisted of segments from several 360° videos produced by the Australian Tourism Board available on its YouTube channel (Tourism Australia, 2017a). Activities included in both the videos and on the DMO website (Tourism Australia, 2017b) were identified. The videos were edited by the authors into a single video, and a website recreated. The final video and recreated website included feeding quokkas (small marsupials), riding in a helicopter, scuba diving, swimming in a waterfall, watching kangaroos and whales, and taking in the view from the SkyPoint Observation Deck. For consistency, the Study 2 video length was similarly 3 min and 45 s, as in Study 1. However, whereas the South Africa video was filmed from the viewpoint of the person experiencing the activities (i.e. the footage is from someone wearing a camera on their head), providing opportunities for eye contact from others in the video looking directly into the camera (South African Tourism Board, 2016a), the Australia video was more passive, and seemingly shot with drones gliding over people and places (Tourism Australia, 2017a).
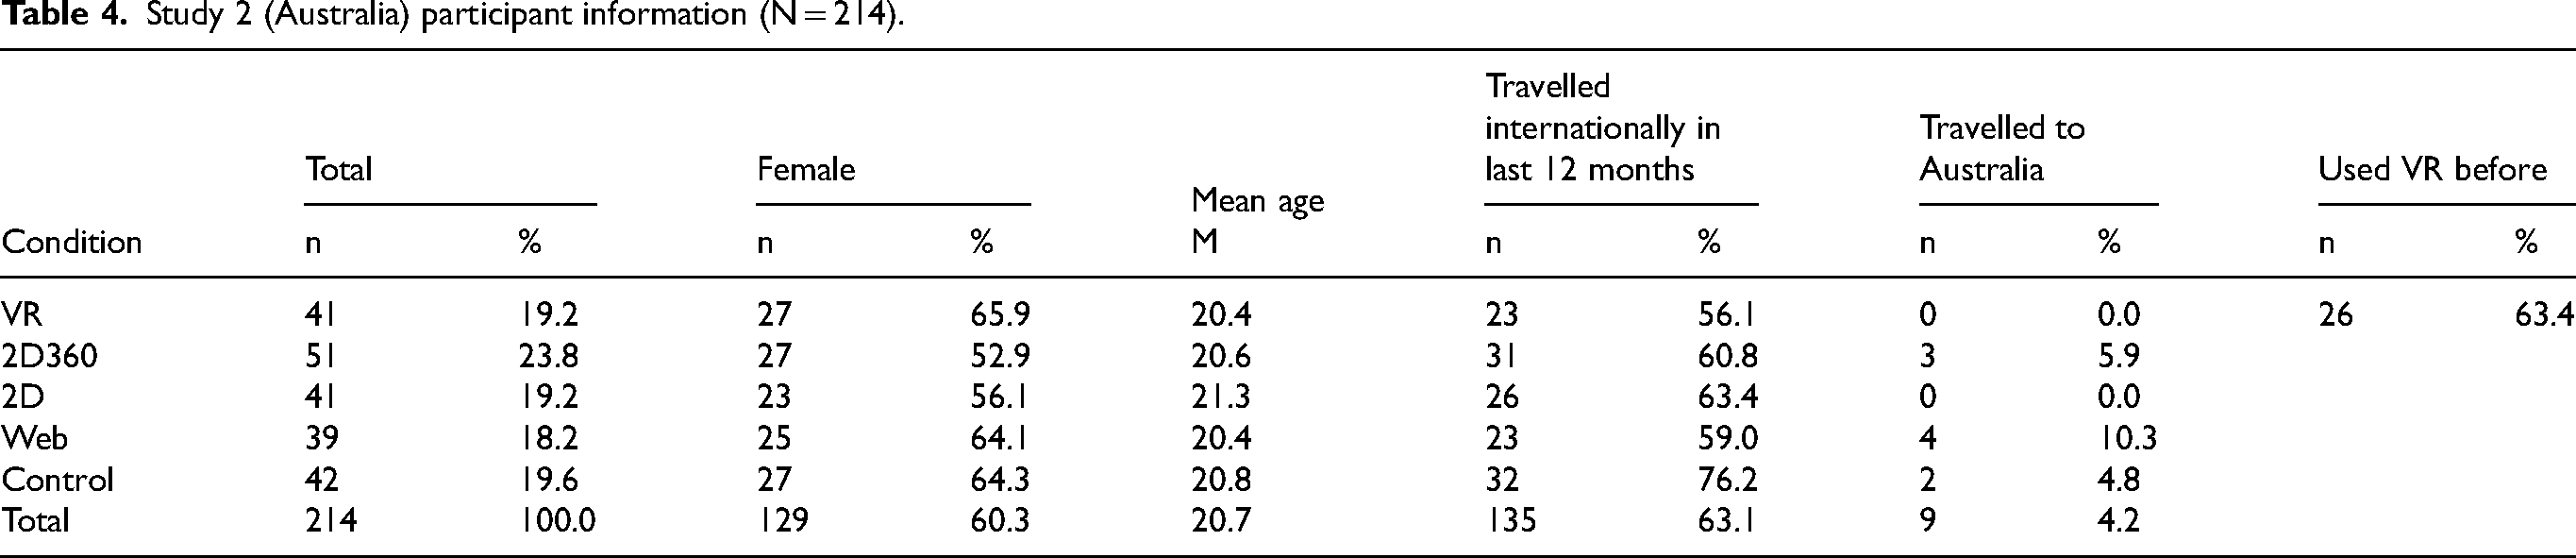
In effect, Study 2 largely replicated Study 1, in order to further confirm the validity and generalizability of the findings. However, the different artistic approach of the Australian video from the South African video allowed for new insights into how the style of VR video content may contribute towards the impacts on the viewer. Moreover, as described previously, to expand the scope of the findings Study 2 added cognitive image items to the survey, as well as a 2D360 experimental group, which watched the video on a laptop computer but was able to navigate around the video with a mouse to experience its 360° nature. In total, 214 research subjects were recruited, with roughly 40 subjects in each condition (Table 4).
Study 2 (Australia) participant information (N = 214).
As with Study 1, the PCA of affective destination image revealed a single factor, so the seven scale items again were averaged to generate an aggregate score. The results of the PCA for cognitive destination image and advertising effectiveness can be seen in Tables 5 and 6. The resultant three-factor solution for cognitive destination image (Table 5) explained 54.23% of the total variance, and was easily interpretable, with the items grouped into conceptually consistent dimensions, named Destination offerings, Environment, and Culture. It was a fairly clean solution; one item (Offers personal safety) somewhat cross-loaded onto the first two factors, but was left with the second factor, onto which it loaded more heavily. The resultant two-factor solution for advertising effectiveness (Table 6) explained 55.56% of the total variance. The factors formed were nearly identical to what was found in Study 1, with the only differences being that the “Informative” item loaded onto the Mental imagery factor instead of the Effectiveness factor, and the order of the two factors switched.
PCA results for cognitive destination image (Australia).
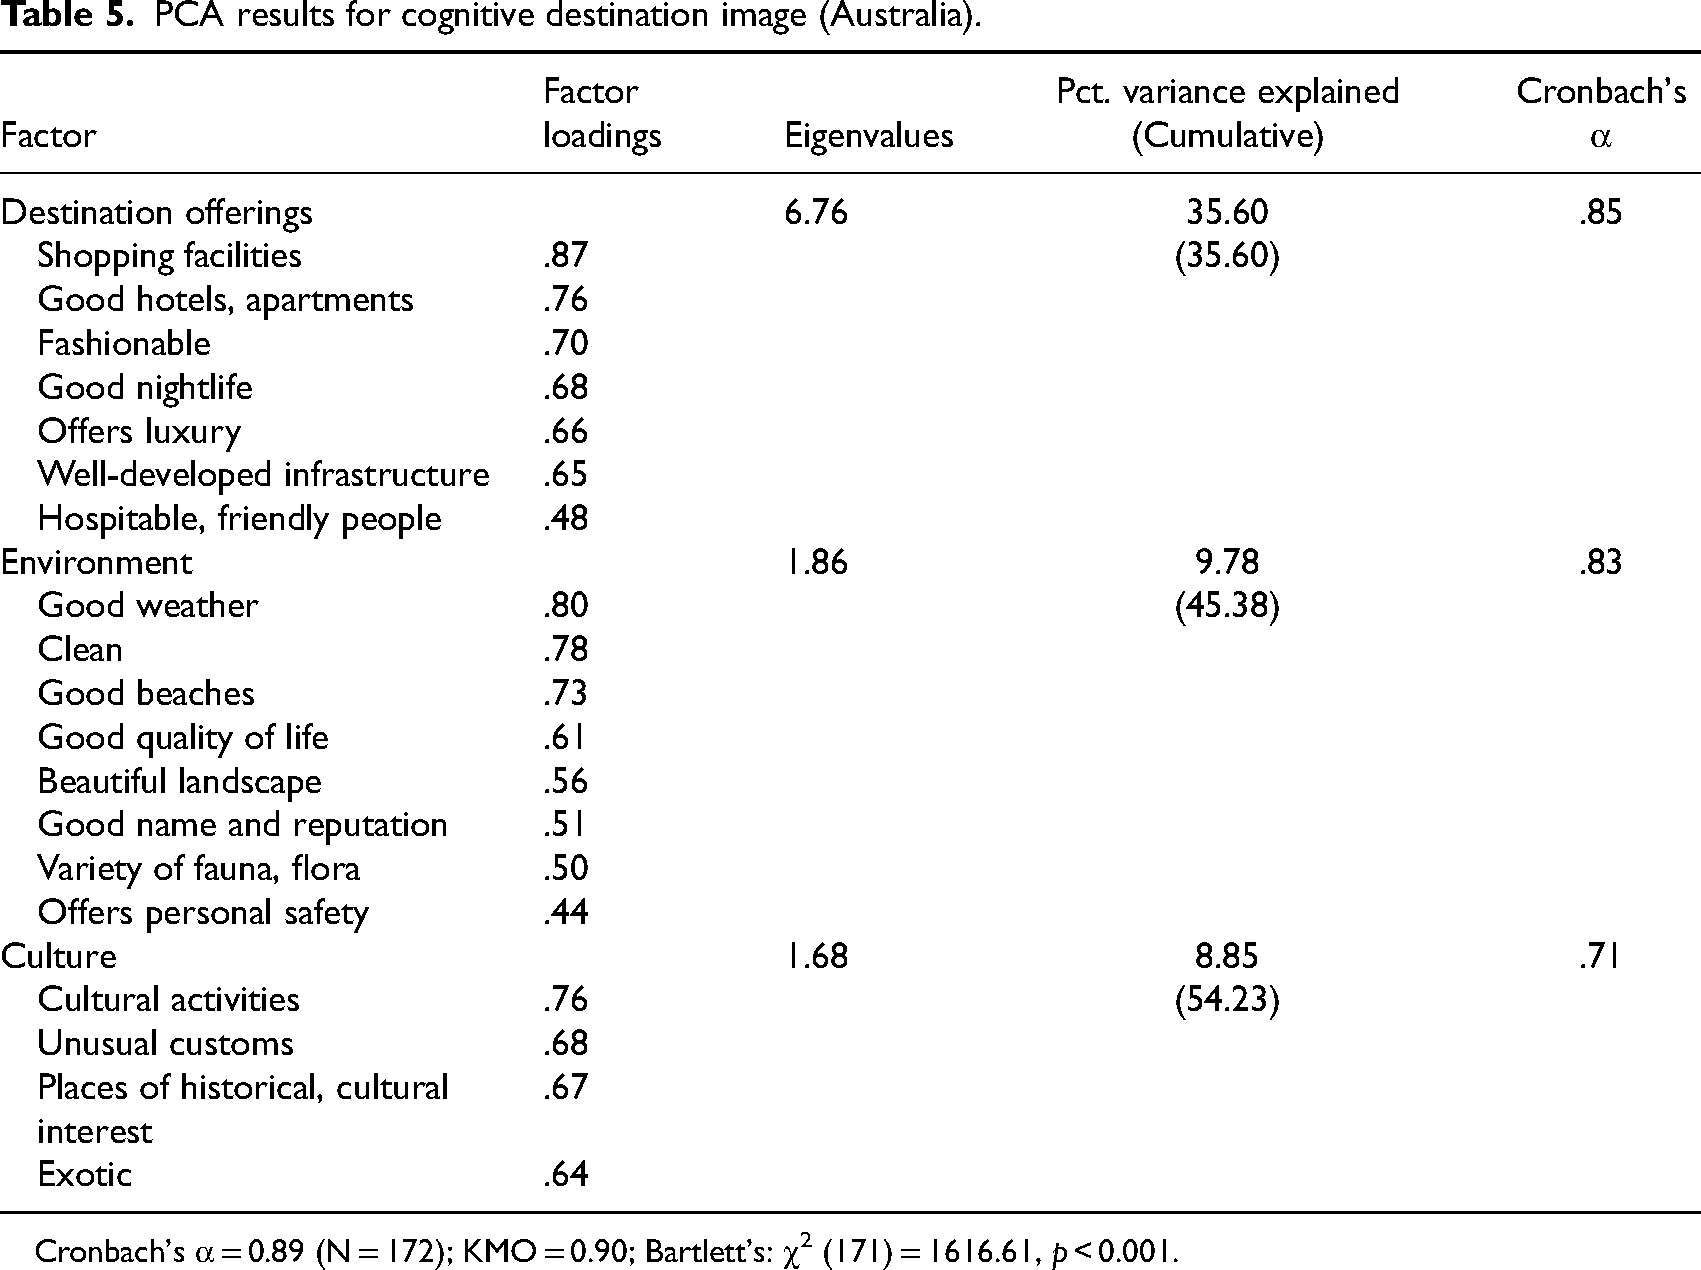
Cronbach's α = 0.89 (N = 172); KMO = 0.90; Bartlett's: χ2 (171) = 1616.61, p < 0.001.
PCA results for advertising effectiveness (Australia).
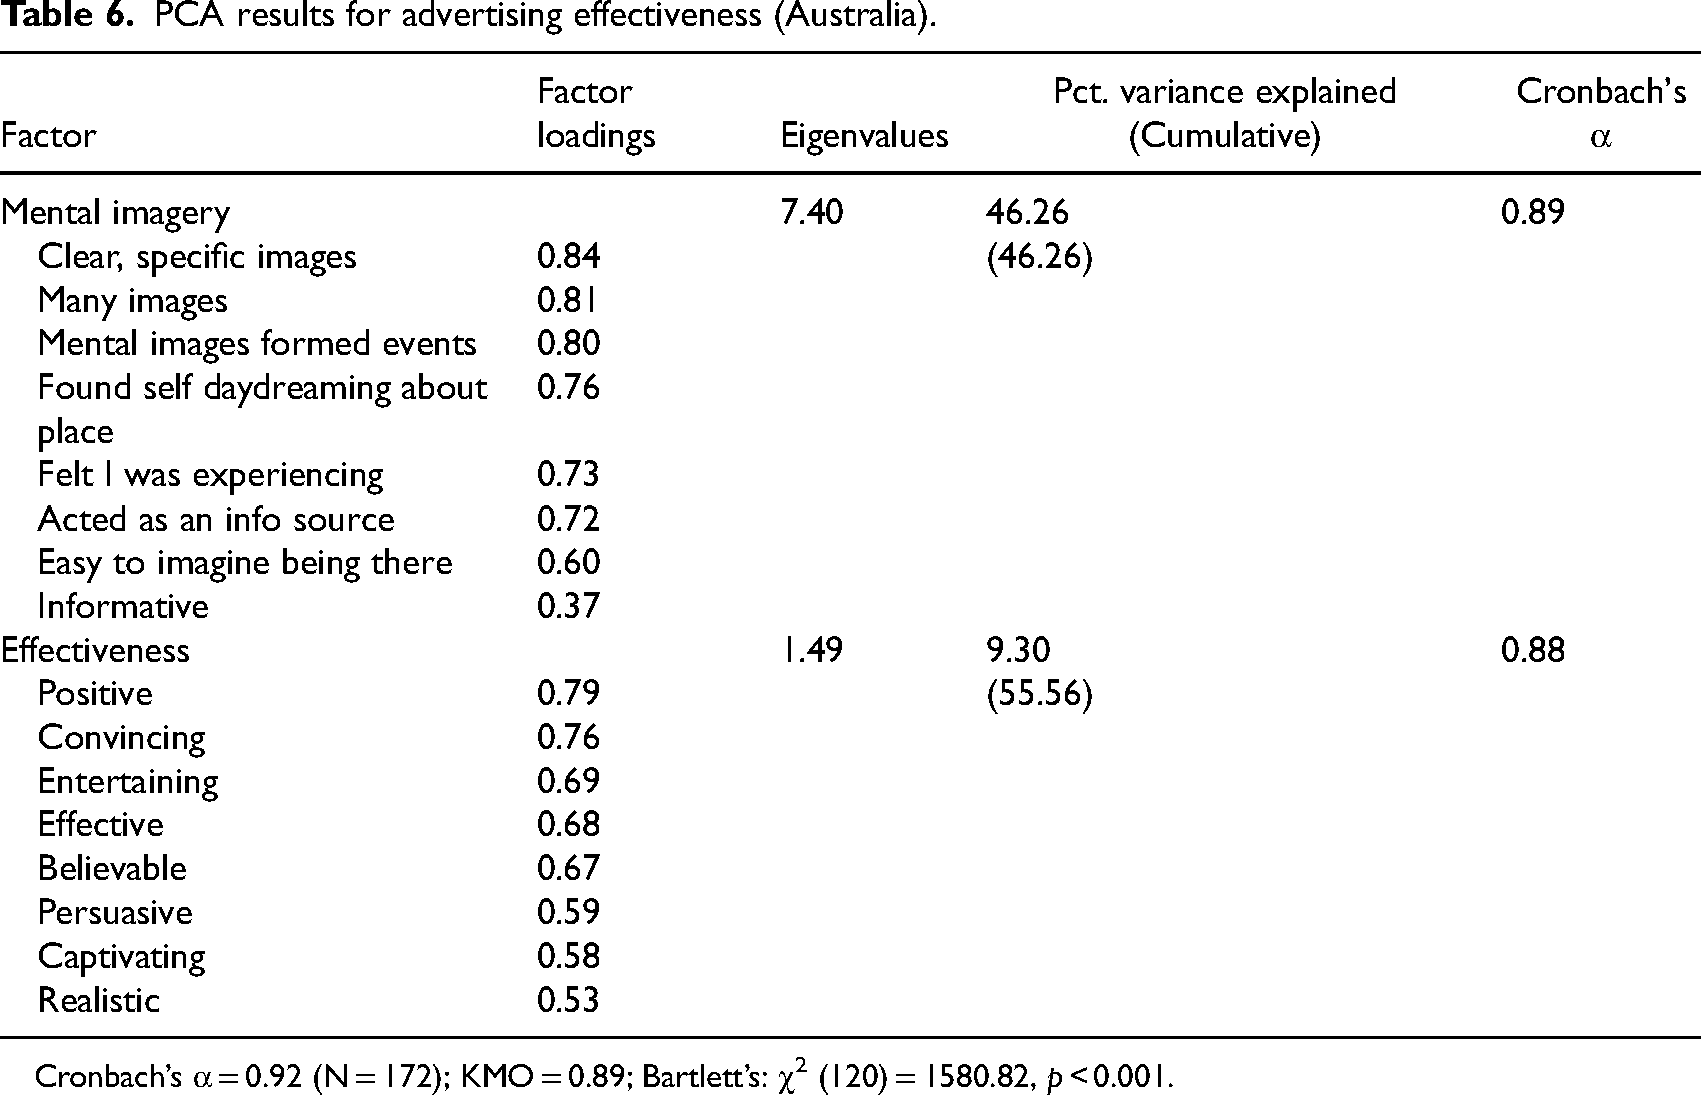
Cronbach’s α = 0.92 (N = 172); KMO = 0.89; Bartlett’s: χ2 (120) = 1580.82, p < 0.001.
The results of the ANOVA and Welch tests comparing participants in the different conditions can be found in Table 7. As shown, the VR group had the highest absolute impact on affective destination image, although the various media types all performed quite similarly. Indeed, only the Control group scored significantly lower than most. These results contrast with Study 1, where the differences were much more pronounced. Likewise, the Control group was the only one to be significantly different than most of the others for the Environment factor of cognitive destination image, and no significant differences were detected within the other two cognitive destination image factors.
Group comparisons (Australia).
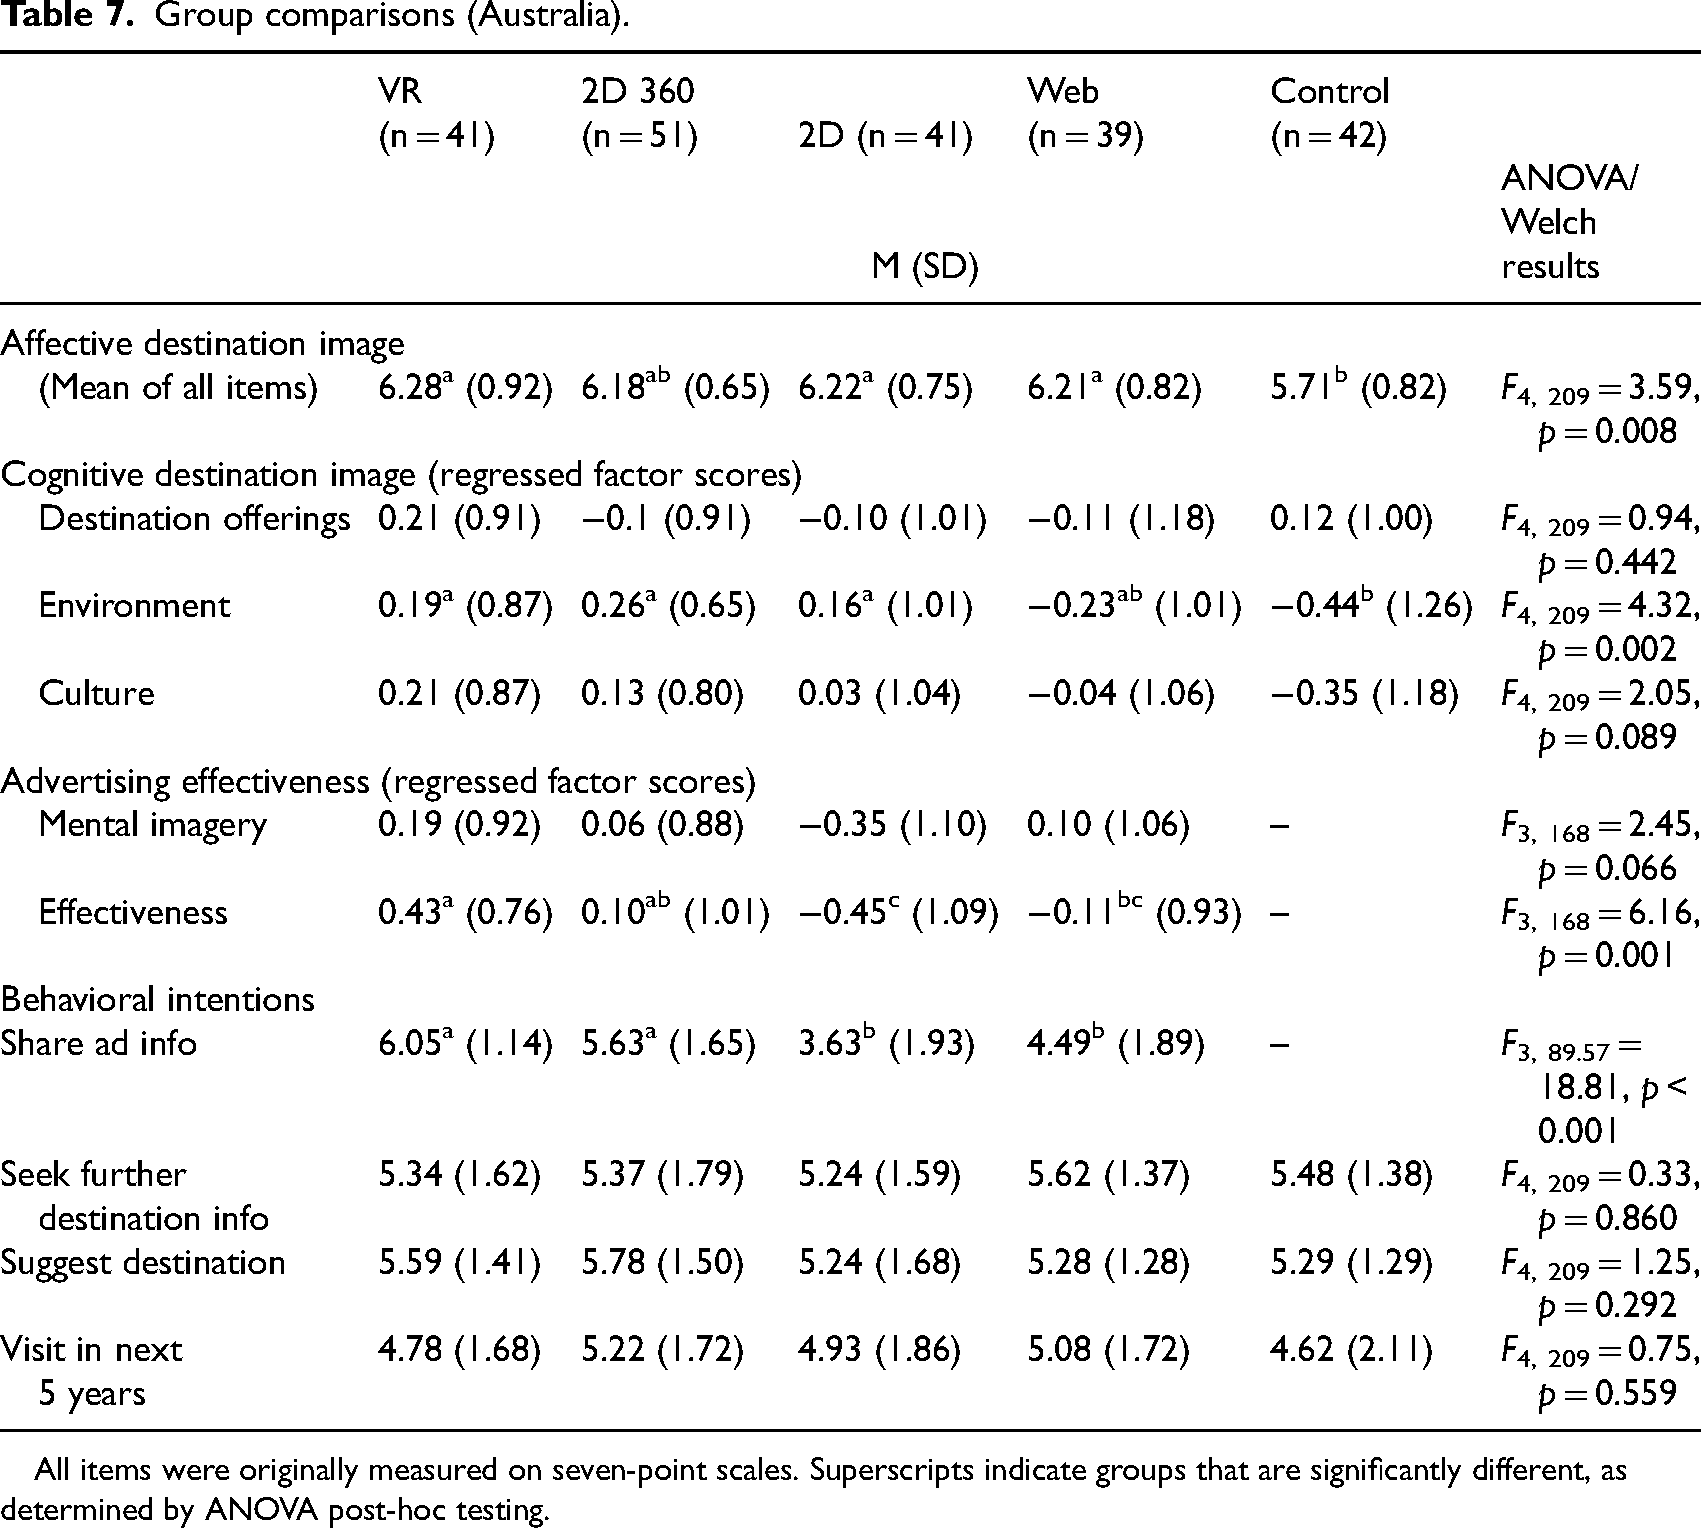
All items were originally measured on seven-point scales. Superscripts indicate groups that are significantly different, as determined by ANOVA post-hoc testing.
No significant differences were found within the Mental imagery factor of advertising effectiveness, although it is worth noting that subjects in the VR condition exhibited the highest absolute scores for this factor, and the ANOVA test results were only marginally beyond being considered significant at the 0.05 level. With the Effectiveness factor of advertising effectiveness, significant differences were indeed detected between the groups; the VR group showed the absolute highest scores, and was distinguished from every group other than 2D360 in the post-hoc testing. Finally, with regards to behavioral intentions, the VR group indicated the absolute highest level of likelihood that they would share information about their advertisement, and the VR and 2D360 groups were found to be significantly more likely than the 2D or Web groups to do so. However, no significant differences were detected between the groups with regards to the other three behavioral intention variables. Again, therefore, these results show less of an impact from using VR than was found in Study 1.
Discussion and implications
It is worth initially noting that, throughout the findings, the Control group was almost always the lowest scoring, supporting the basic assertion that any advertising seems preferable to none (Woodside, 1990). When comparing VR to other media, VR seems to be an effective format for destination marketing material in some regards, but not all. Its impact on affective image was particularly notable in Study 1, consistent with some previous studies (e.g. Flavián et al., 2021; Marasco et al., 2018). Conversely, the impact on cognitive image in Study 2 was marginal at best, in line with others (e.g. McFee et al., 2019). VR also proved more effective at making users feel that the material was realistic, informative, believable, and immersive. Lastly, VR also exhibited some limited benefits over other media formats in terms of fostering positive behavioral intentions towards the destinations, similar to some prior research (Manchanda and Deb, 2021; Tussyadiah et al., 2018), but again these results were mostly confined to Study 1.
These findings are somewhat consistent with prior research that has compared VR with other media formats (e.g. Adachi et al., 2020; Bogicevic et al., 2019; Weng et al., 2021). The positive impact on affective destination image in Study 1, along with the perceived advertising effectiveness, reinforces the notion that VR can be a useful advertising media in comparison with other channels. Also, the impact on behavioral intentions found in Study 1 was more positive than has been found in much prior research, whereas the limited impacts found in Study 2 were more consistent. Nevertheless, it should be acknowledged that destination advertising—particularly for destinations very distant from their origin market, as this study considered—is expected to have limited immediate behavioral impacts, as destination choice is a complex and extended decision-making process (Sirakaya and Woodside, 2005). If the advertisement can move the needle in improving destination image, it has arguably accomplished its goal. In this regard, this study's findings offer further support for continued adoption of VR by destination marketers in some contexts. It is clear that the unique attributes of VR make it a potentially powerful advertising platform that can complement other, more traditional media types that destination marketers are already utilizing.
In particular, this study has shown that VR users are both more likely to have enhanced affective image, and to share their experiences of the advertisement, which has intriguing implications for destination marketers. Affective destination image has been shown to be more connected to the generation of word-of-mouth, as people share their feelings towards a place through conversational narrative interactions (Alcañiz et al., 2009). Destination marketers must communicate differently with tourists in different ways at different stages of the travel purchase process (Bulchand-Gidumal and William, 2020), and will use different media and messages throughout the journey (Cai et al., 2004). VR's apparent ability to promote affective image is a characteristic for marketers to keep in mind as they select ideal opportunities to use VR marketing.
This study also found that the South Africa video, shot from the viewpoint of a person actually experiencing the activities, had a much greater impact than the Australia video, which was shot in a more passive style. Given that the sample in both studies was similar in terms of demographics, experience with the destination, and with VR technology, discussion on the differences between the two VR materials is important. As has been highlighted by Adachi et al. (2020) and Weng et al. (2021), VR content should not be considered homogeneous. The “active” style of the South Africa video seems more effective because it leverages the strengths of VR, creating a more impactful experience. The ability to examine a product “from different angles” (Li et al., 2003: 395) prior to purchase helps imbue confidence, and improves intentions and purchasing behavior, and being able to view the experience from a more realistic viewpoint may add to increasing the sense of experiencing what the destination has to offer.
In addition, it is important to note that the Control group in the South Africa study had lower overall ratings in comparison to those in the Australia study on affective destination image (4.96 vs. 5.71), and behavioral intentions (Seek further info: 5.00 vs. 5.48; Suggest destination to others: 4.23 vs. 5.29; Visit in next 5 yrs: 3.69 vs. 4.62). As research into VR and phobias has shown, a user's pre-existing attitudes towards the object or experience being replicated in VR may affect responses to the VR experience (Bouchard et al., 2008; Diemer et al., 2015). In other words, it is possible that individuals who already hold a more positive image of a destination, with a more concrete understanding of what a destination has to offer, may be more critical in their evaluation of a VR destination marketing experience. This possibility would suggest that VR is most useful to destination marketers in the earliest, inspiration phase of the purchase journey.
Conclusion
The main contribution of this study is the finding that VR can have advantages over other marketing media formats, but all VR content does not have the same impact on a similar group of users. The style of VR content should be part of both academic and practical consideration in exploring and evaluating the effectiveness of marketing to specific groups. Overall, the results from this research underscore the potential that VR offers tourism destination marketers, but also show reason for caution as DMOs consider adopting VR marketing. Study 1 demonstrated that active VR content largely outperformed other traditional media formats in promoting affective destination image, perceived advertising effectiveness, and some behavioral intentions. However, Study 2 demonstrated that passive VR content mostly eliminated much of the apparent benefits of using VR as a marketing tool. The research consequently offers important insights for the growing body of literature on this topic, which has direct implications for practitioners. VR is costly to adopt, so destination marketers should understand its strengths and weaknesses as they evaluate possible uses of this technology. This research suggests that the benefits are worth exploiting, but destination marketers need to invest in active content produced specifically for VR.
There are limitations that should be considered in conjunction with the results of this study. Undergraduate students represent a convenience sample that is not necessarily generalizable to the wider general population of travelers. In addition, these research participants likely had limited intentions or capabilities to take a long, costly international vacation, so results may differ with other samples on other points in the path to purchase. Additionally, the videos used in the 2D condition were produced as 360° content, and therefore designed to be interacted with via either a VR HMD or a computer mouse on a screen. Using the same videos in different conditions was done deliberately in order to reduce confounding variables, but the limitation is acknowledged. Further, the ex-situ context of the experimental design meant that participants’ responses were captured out of their usual and natural process. Further, this data was collected before COVID-19, and therefore does not account for how destination marketing and travel in general has shifted substantially during the course of the pandemic (Manchanda and Deb, 2021), and further research would be useful.
Additional research is recommended to build on the foundations of this study in order to further understand opportunities of VR for destination marketers. The context of users, in relation to their acceptance of technology, their existing image of a destination, the stage on the path to purchase, and their travel motivations and interests in general are all factors that will likely influence how any one individual reacts to a specific piece of marketing, and the style of VR, as discussed in this study, is one of many potential variables that need further exploration to establish best practices for practitioners. Further research could apply the learnings from this study to various groups of participants, both demographically and psychographically, plus also at various stages of the path to purchase. Likewise, the comparison of different types of destinations (near vs. far, developed vs. undeveloped, familiar vs. unfamiliar, etc.) would be valuable. The potential for VR content to affect a shift in consumers from simple awareness of a destination to an emotional attachment, and ultimately to the advanced stages of knowledge and purchase, should be of interest. In addition, it is quite possible that different types of VR content can affect consumers at various stages of the path to purchase or the tourism journey (Bulchand-Gidumal and William, 2020; Wright-Isak et al., 1997), and with different levels of existing involvement with places and activities being displayed (Deng et al., 2019). In addition, the longevity of the impact of VR compared with other media types is an intriguing topic. The consumption of advertising, especially for such an emotional and expensive product as tourism, can have enduring impacts years after consumption (Wright-Isak et al., 1997). The potential for VR content to be viewed and recalled on a more durable basis has implications for users making travel decisions in the future. As technology quickly advances, and the context that tourism happens also drastically shifts, implications quickly change. The likely improvement of VR's ease and access of use, and useful applications, along with the arrival of quality user-generated-content, that has already had substantial impacts on destination marketing in other media (Mendes-Filho et al., 2018), will change how the technology is used by actual and potential consumers, and how it affects their perceptions and behavior.
Footnotes
Declaration of conflicting interests
The author(s) declared no potential conflicts of interest with respect to the research, authorship, and/or publication of this article.
Funding
The author(s) received no financial support for the research, authorship and/or publication of this article.