
Abstract
Evaluators are interested in capturing how things causally influence one another. They are also interested in capturing how stakeholders think things causally influence one another. Causal mapping – the collection, coding and visualisation of interconnected causal claims – has been used widely for several decades across many disciplines for this purpose. It makes the provenance or source of such claims explicit and provides tools for gathering and dealing with this kind of data and for managing its Janus-like double-life: on the one hand, providing information about what people believe causes what, and on the other hand, preparing this information for possible evaluative judgements about what causes what. Specific reference to causal mapping in the evaluation literature is sparse, which we aim to redress here. In particular, the authors address the Janus dilemma by suggesting that causal maps can be understood neither as models of beliefs about causal pathways nor as models of causal pathways per se but as repositories of evidence for those pathways.
Introduction
This article aims to share the experience of the authors in using the approach of causal mapping within the sphere of evaluation and their development of more specific guidelines for evaluators who might be interested in using this as a tool for collating and analysing evidence for causal pathways. During 20 years of conducting evaluations, the lead author became persuaded of the central importance of collecting and being able to aggregate causal propositions embedded in written and spoken data. Further interest in causal mapping arose from discussions with the other authors who had developed a qualitative impact evaluation protocol (the QuIP), which relies on causal mapping for analysis of narrative data. This prompted further expansion of the search for literature and software that could assist in systematically constructing causal maps as a way of presenting the outcome of such impact-evaluation studies. A main product of this action research has been the design of new software and detailed guidelines for causal mapping, 1 which have already been used in many evaluations around the world. 2 This article draws on our joint experience of causal mapping to outline the scope for evaluators to use the approach more systematically and widely.
This article starts with a brief history of causal mapping and clarifies some definitions. It then reviews causal mapping within evaluative practice, distinguishing the tasks of gathering data, coding causal claims and answering evaluative questions. The final section concludes with reflections on the strengths, weaknesses and future potential of causal mapping in evaluation.
A brief history of causal mapping
Causal mapping – diagramming beliefs about what causes what – has been used since the 1970s across a range of disciplines from management science to ecology. The idea of wanting to understand the behaviour of actors in terms of their internal maps of the world can be traced back further to field theory (Tolman, 1948) which influenced Kelly’s ‘personal construct theory’ (Kelly, 1955). A seminal contribution was made by Robert Axelrod in political science, with the book The Structure of Decision (Axelrod, 1976). Causal mapping is largely based on ‘concept mapping’ and ‘cognitive mapping’, and sometimes the three terms are used interchangeably, although ‘causal mapping’ strictly involves maps that only include explicit causal links, rather than, for example, relationships like ‘membership’. 3 Axelrod’s book presents a comprehensive idiographic approach to how individuals make decisions which he himself mostly refers to as ‘cognitive mapping’ (although his definition makes it clear that all links are causal). An appendix to the book (Wrightson, 1976) gives details about how to code causal links. Bougon et al. (1977) applied a similar approach to a study of the Utrecht Jazz Orchestra as an organisational unit, eliciting ‘cause maps’ from several individual members and amalgamating them. One strand of literature about causal mapping can be located within the wider literature on sensemaking in organisations pioneered by Weick (1995), and applications within organisations were present almost from the start.
By 1990, there were many different applications of similar ideas, including an edited book (Huff, 1990) that offered a unitary approach to ‘concept mapping’ in the United States. Most authors (Ackermann and Alexander, 2016: 892; Clarkson and Hodgkinson, 2005: 319; Fiol and Huff, 1992: 268; Laukkanen, 2012: 2; Narayanan, 2005: 2) use a broadly similar definition of a causal map: A causal map is a diagram, or graphical structure, in which nodes (which we call factors) are joined by directed edges or arrows (which we call links), so that a link from factor C to factor E means that someone (P) believes that C in some sense causally influences E. There is a constructive ambiguity (Eden, 1992) about what a collective map is a map of: While maps constructed as a consensus within a group can plausibly be claimed to map ‘what the group thinks’, this is more problematic for maps constructed post hoc by synthesising individual maps.
We found no significant deviations from this basic definition of a causal map across all the variants of causal mapping reviewed in the following sections, with the caveat that there is variation in how explicit different authors are in describing causal links as representing bare causation as opposed to beliefs about causation.
In the following decades, Eden et al. (1992) applied the approach to understanding and supporting decision-making in organisations, increasingly using the phrase ‘causal mapping’ rather than ‘cognitive mapping’, and they subsequently extended the application of causal maps to fields as varied as risk elicitation and information systems development (Ackermann and Eden, 2011; Ackermann et al., 2014), also developing a series of software packages beginning with Decision Explorer (Ackermann et al., 1996). There is now a wealth of literature on using causal mapping for decision support in organisations (including sophisticated approaches to formalise decision support (Montibeller et al., 2008) and even to rank options (Rodrigues et al., 2017)).
Laukkanen (1994, 2012; Laukkanen and Eriksson, 2013) also wrote extensively on causal mapping and developed a software programme called CMAP3 for processing both idiographic and comparative causal maps by importing, combining and analysing factors and links attributed to one or more sources. A broadly similar approach was taken by Clarkson and Hodgkinson (2005) with their Cognizer approach and software.
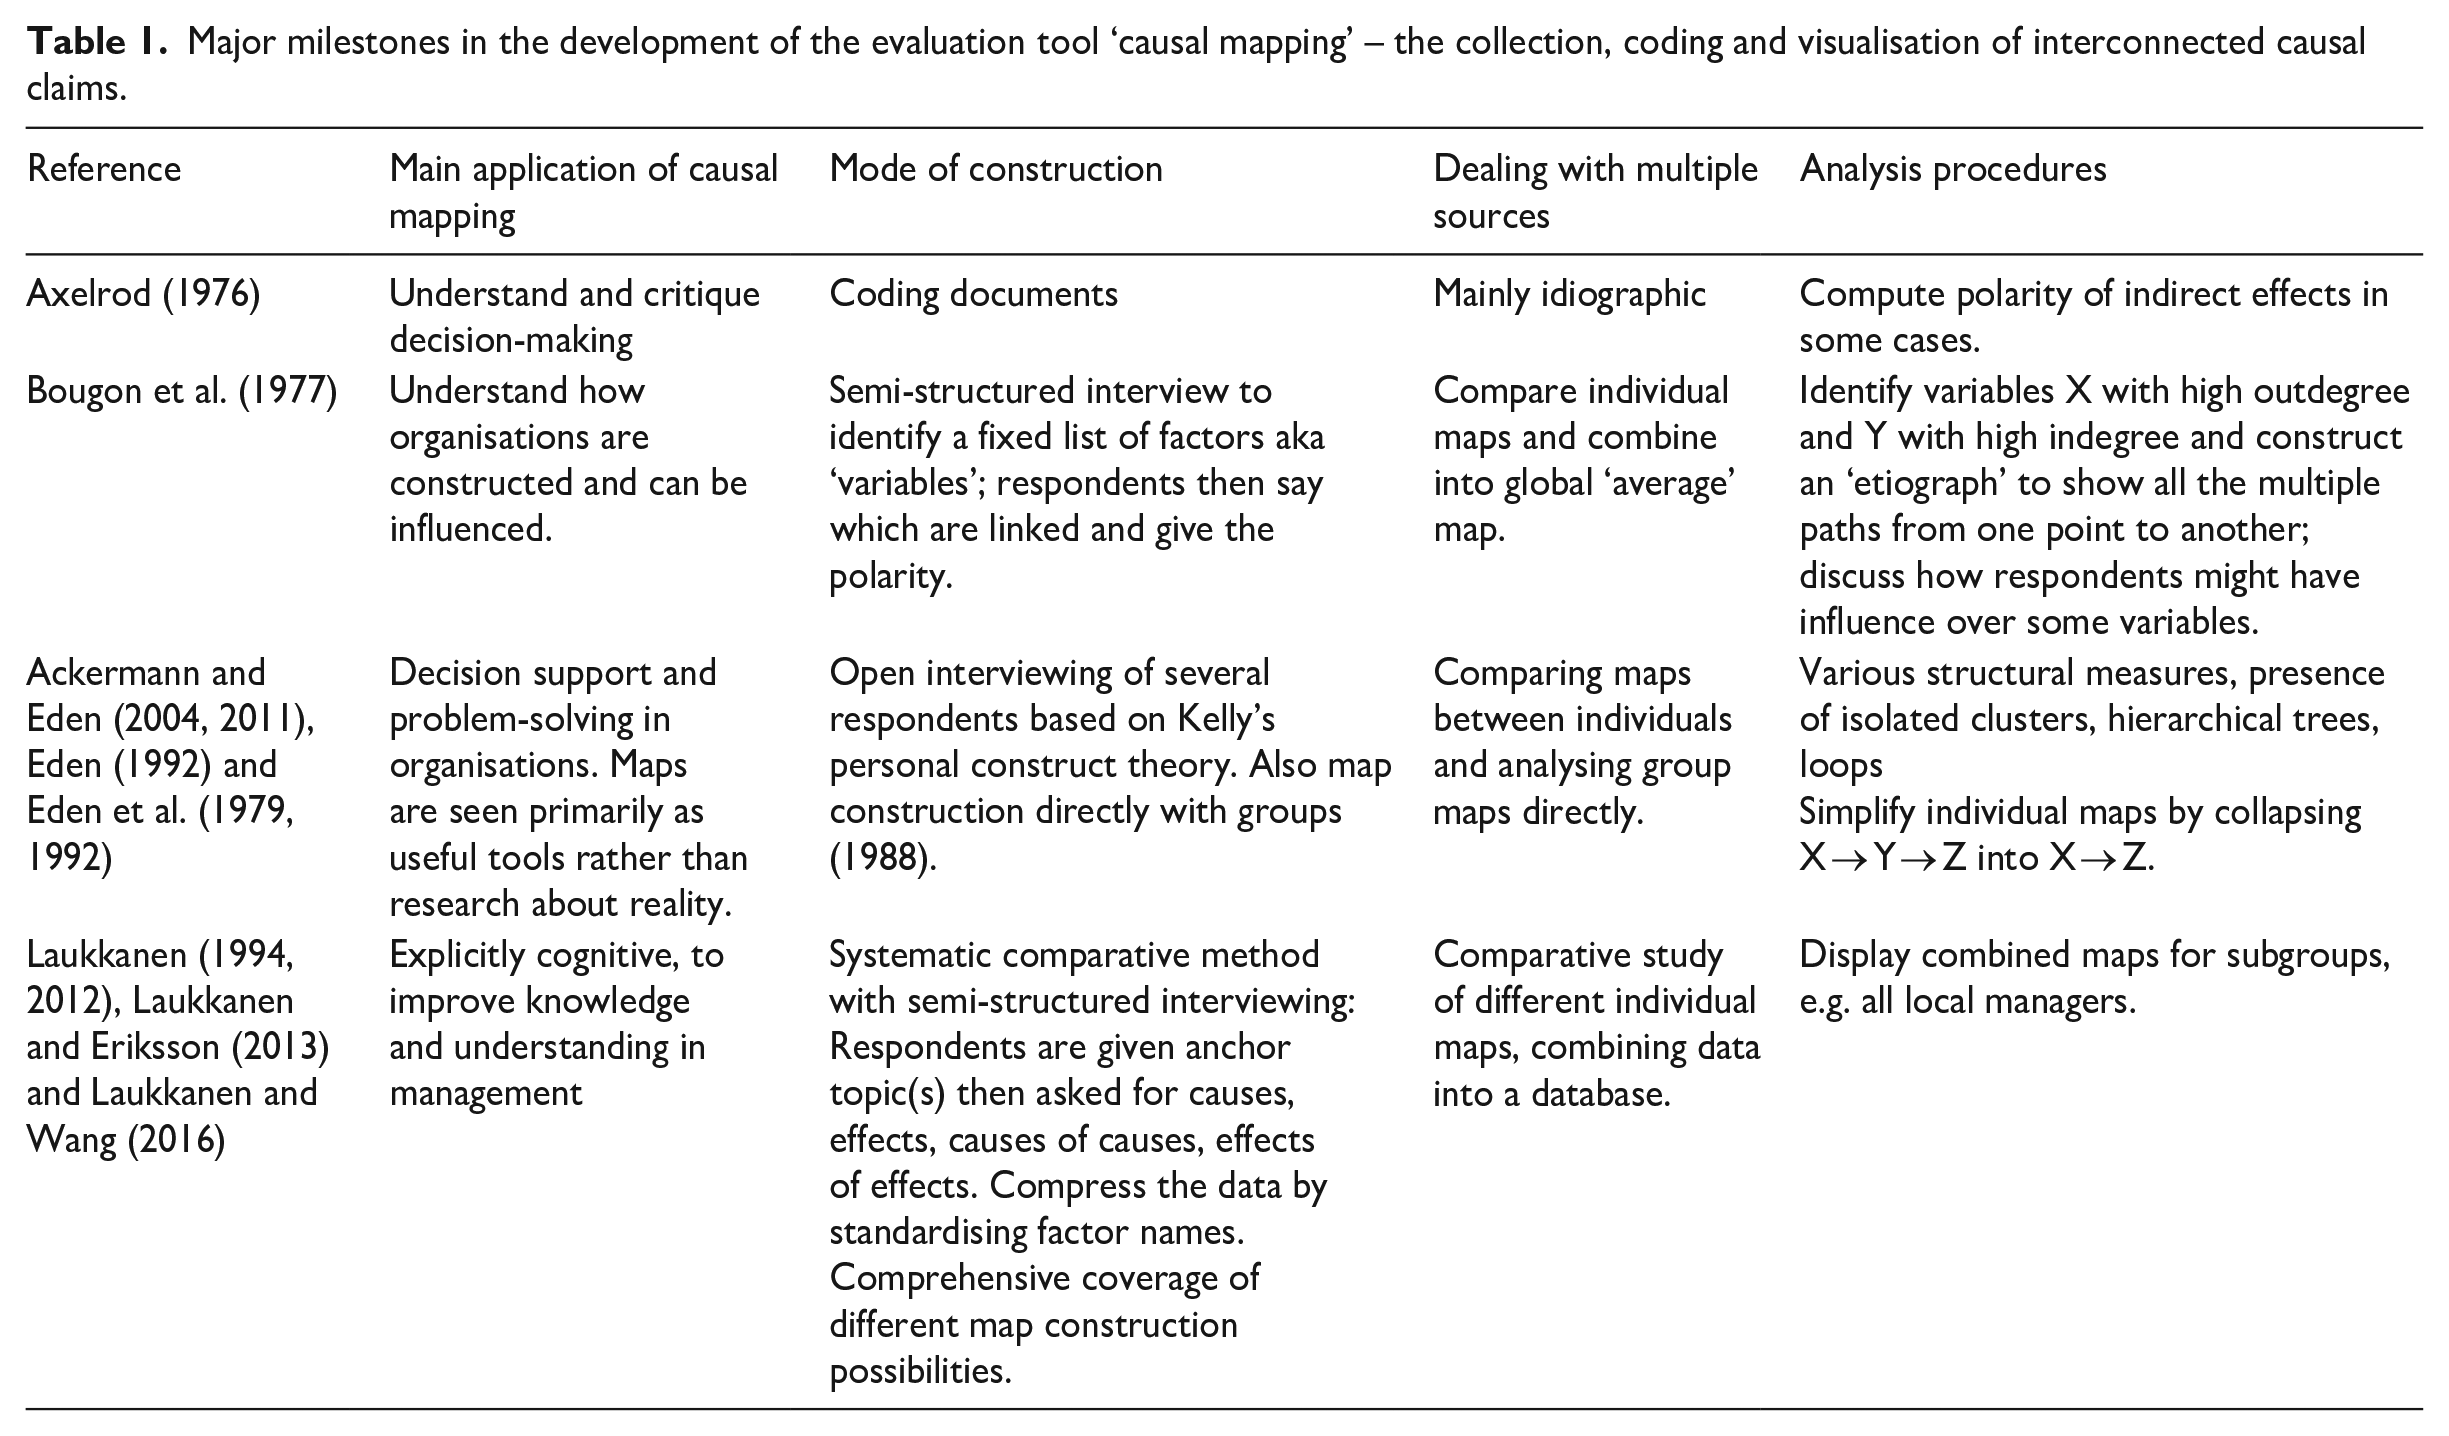
Table 1 shows some highlights from the extensive literature on causal mapping. Many of the key ideas were already in place by the end of the 1970s. The subsequent literature covers a variety of specific techniques to elicit maps from documents, individuals, sets of individuals and groups, with or without software support, following protocols from the purely open-ended to those which use strictly pre-defined lists of factors and links (see Hodgkinson et al (2004) for a comparison of methods), and with aims ranging from strictly idiographic (understanding individuals in specific contexts as Axelrod did) to more nomothetic, such as Tegarden et al. (2016).
Major milestones in the development of the evaluation tool ‘causal mapping’ – the collection, coding and visualisation of interconnected causal claims.
Renewed interest in causal mapping may also be reinforced by the ‘causal revolution’ in quantitative data science initiated by Judea Pearl (Pearl, 2000; Pearl and Mackenzie, 2018), which has fundamentally challenged the almost total taboo placed on making or assessing explicit causal claims, which was dominant in statistics for much of the twentieth century (Powell, 2018), and this has in turn helped rekindle interest in explicitly addressing causation using qualitative methods.
Causal mapping and most related approaches share the basic idea that causal knowledge – whether generalised or about a specific case or context – can be at least partially captured in small, relatively portable ‘nuggets’ of information (Powell, 2018: 52). These can be assembled into larger models of how things worked, or might work, in some cases. More ambitiously, they may contribute to constructing ‘middle-level theory’, useful for understanding causal processes in other contexts, without necessarily reaching the level of overarching scientific laws (Cartwright, 2020). Causal nuggets are also related to the mechanisms that help to explain how people behave in different contexts (Pawson and Tilley, 1997; Schmitt, 2020). These can be thought of as causal schema and linked to the hypothesis that human knowledge is stored in chunks that are activated and combined with others in relevant circumstances. This would suggest that we humans do not have a comprehensive set of causal maps in our heads at any one time, but we do have a set of more basic components and the ability to assemble them when the situation calls for it, including when prompted by a researcher.
This approach suggests that our everyday causal understanding is as primary as our perception of, say, colour and arises from more than empirical observations of associations between objects or events; our ability to infer causation goes beyond and is not primarily based on noting correlations. And for all its complexity and intuitive brilliance, it is also just as fallible as our perception of colour or size.
This reaffirms our practice as evaluators of taking the causal claims and opinions of humans (experts and non-experts) seriously (Maxwell, 2004a, 2004b); indeed, this kind of information is the bread and butter of most evaluations.
Distinguishing causal mapping from related approaches
Most evaluators are probably more familiar with related approaches under the term ‘systems mapping’, recently covered by Barbrook-Johnson and Penn (2022a). They provide an overview table of relevant methods on pp. 169 ff. – fuzzy cognitive maps (FCM), participatory systems mapping (PSM), Bayesian belief networks (BBN), causal loop diagramming (CLD), systems dynamics (SD) and theory of change (ToC) – which will be briefly mentioned here.
SD, CLDs, FCMs and BBNs are all ways to encode information about networks of interconnected causal links and follow formal inference rules to make deductions based on them, for example, to calculate the strength of indirect effects or to predict behaviour over time. The oldest of the three methods, SD (Forrester, 1971), models flows of a substance (for example, of energy or money) within a network over time, whereas the other three methods model ‘bare’ causal connections between network elements. SD uses general mathematical functions to model the connections and explicitly models non-linear relationships. CLDs are related but mathematically simpler, modelling causal effects in a semi-quantitative way. FCMs might seem to be of more interest for causal mapping; Kosko’s original article on FCM (Kosko, 1986) takes Axelrod’s work as its starting point. This tradition (Chaib-Draa and Desharnais, 1998; Khan and Quaddus, 2004; Taber, 1991) was originally introduced to model causal reasoning (Kosko, 1986: 65): If person or group P believes the set of causal propositions making up a map M, the model attempts to predict the strength with which they could or should also believe some other propositions, for example, about indirect effects and how they might change over time. In practice, however, FCM is less interested in cognition than in making predictions about the world. The difference between FCM and the other three methods is more about the fuzzy logic used to make the predictions rather than about the cognitive nature of the data.
BBNs are also designed to make causal inferences by doing calculations with data about causal connections. While FCMs make essentially qualitative predictions such as ‘increasing’ and ‘decreasing’, BBNs use directed acyclic graphs (networks without loops) to make quantitative predictions about the probability of events, particularly about the probability that one event was the cause of another.
All four approaches are primarily ways to make predictions about causal effects within a network of factors, and (despite the words ‘cognitive’ and ‘belief’ in the names of two of the four) the relative lack of interest in who is doing the reasoning sets FCM, BBNs and SD apart from causal mapping as outlined earlier.
In the last few years, PSM has featured in several publications in evaluation journals and guides (Barbrook-Johnson and Penn, 2021; Hayward et al., 2020; Sedlacko et al., 2014; Wilkinson et al., 2021), alongside mapping of ‘systems effects’ (Craven, 2020). Indeed, Craven’s work (see also Craven, 2017) can be considered causal mapping with a particular emphasis on systems aspects. Barbrook-Johnson and Penn (2022a) explicitly exclude causal maps from their overview of systems mapping because they are arguably included via FCM and because they ‘sometimes emphasise developing representations of individual mental models rather than representations of systems’ (p. 11). Nevertheless, PSM is closer to the tradition of causal mapping (and of more direct interest to evaluators) than the previous four approaches because it is a more concrete and pragmatic intervention to construct a map with specific group of stakeholders to support decisions. A devotee of causal mapping could claim that approaches like PSM are just variants of what they have been doing for the last 50 years, just as a devotee of systems mapping might consider causal mapping as a form of PSM.
Finally, logic models and ToC can be considered causal maps in which they make assertions about past or future causal links that one or more stakeholders believe to be important. They are also political artefacts that aim to justify and inform action by establishing an agreed synthesis of multiple perceptions of change and may also gain legitimacy by being the product of an agreed process of participatory planning and co-design. They do not, however, normally retain information about which stakeholder(s) believe which claim. Reflecting on logic models and theories of change provides one entry point for thinking more carefully both about who actually makes these claims and about the symbols and rules employed to construct them (Davies, 2018).
We think it is useful to distinguish this tradition of causal mapping from related activities in six ways, as set out in the following section. None of these distinctions are definitive, and many are shared with other approaches. To systems people who want to say that causal mapping is just systems mapping and to causal mappers who want to say that systems mapping is just causal mapping (and we have heard both arguments many times), we can only say, perhaps we should all just get to know each other first.
First, the raw material for causal maps comprises claims about, perceptions of or evidence for causal links. Causal maps are primarily epistemic, meaning that their constituent parts are about beliefs or evidence, not facts; yet their logic tends to be parallel to, and based upon, the logic of non-epistemic systems maps and similar diagrams that are broadly used across a range of sciences. Some systems mapping techniques are also sometimes concerned with stakeholder beliefs; causal mapping does this more systematically.
Second, causal maps tend to be unsophisticated about the types of causal connection they encode. To explain this, we should note that causal claims in ordinary language are expressed in an endless variety of ways: ‘C made E happen’, ‘C influenced E’, ‘C may have been necessary for E’, ‘C was one factor blocking E’, ‘C had a detrimental effect on E’, ‘C had a surprisingly small effect on E’ and so on. With a few exceptions, causal mapping analysts do not even try to formally encode this rich and unsystematic range of causal nuance, relying instead simply on the lowest common denominator: A link from X to Y means simply that someone claims that X somehow causally influences or influenced Y.
There is one exception: Many causal mapping approaches do accommodate information about the polarity of links, marking each link as either positive or negative, for example, the claim ‘the recession led to unemployment’ could be coded as a negative link from ‘the recession’ to ‘employment’. 4
In general, causal maps usually encode a belief about partial causal influences of C on E and only in special cases do they encode total or exclusive causation such that C entirely determines E. This also means that encoding a claim does not require us to make any judgement about the quality of the evidence or the ability of the source to judge that this link was causal (although it may be very useful to do so).
Third, causal mapping often handles large numbers of causal claims, sometimes many thousands. Handling large numbers of claims en masse in this way is made much easier because of the relatively unsophisticated nature of the way claims are coded (as discussed earlier).
Related approaches in evaluation tend to bring more sophisticated tools to bear on a much smaller number of causal links. In process tracing, for example, researchers may produce diagrams depicting claims about causal links but tend to focus on testing the strength of a relatively small number of specific ‘high-stakes’ causal links, whether through verbal reasoning, application of Boolean logic or Bayesian updating (Befani and Stedman-Bryce, 2017).
Fourth, causal maps may originate from one or many sources, each reporting on one or many cases. In a causal map, the links all originate from one person or document a ‘single-source’ or ‘individual’ or ‘idiographic’ causal map, as in Axelrod’s original work (Axelrod, 1976). But we can also draw causal maps that incorporate information from a variety of different sources, as illustrated in Figure 1.
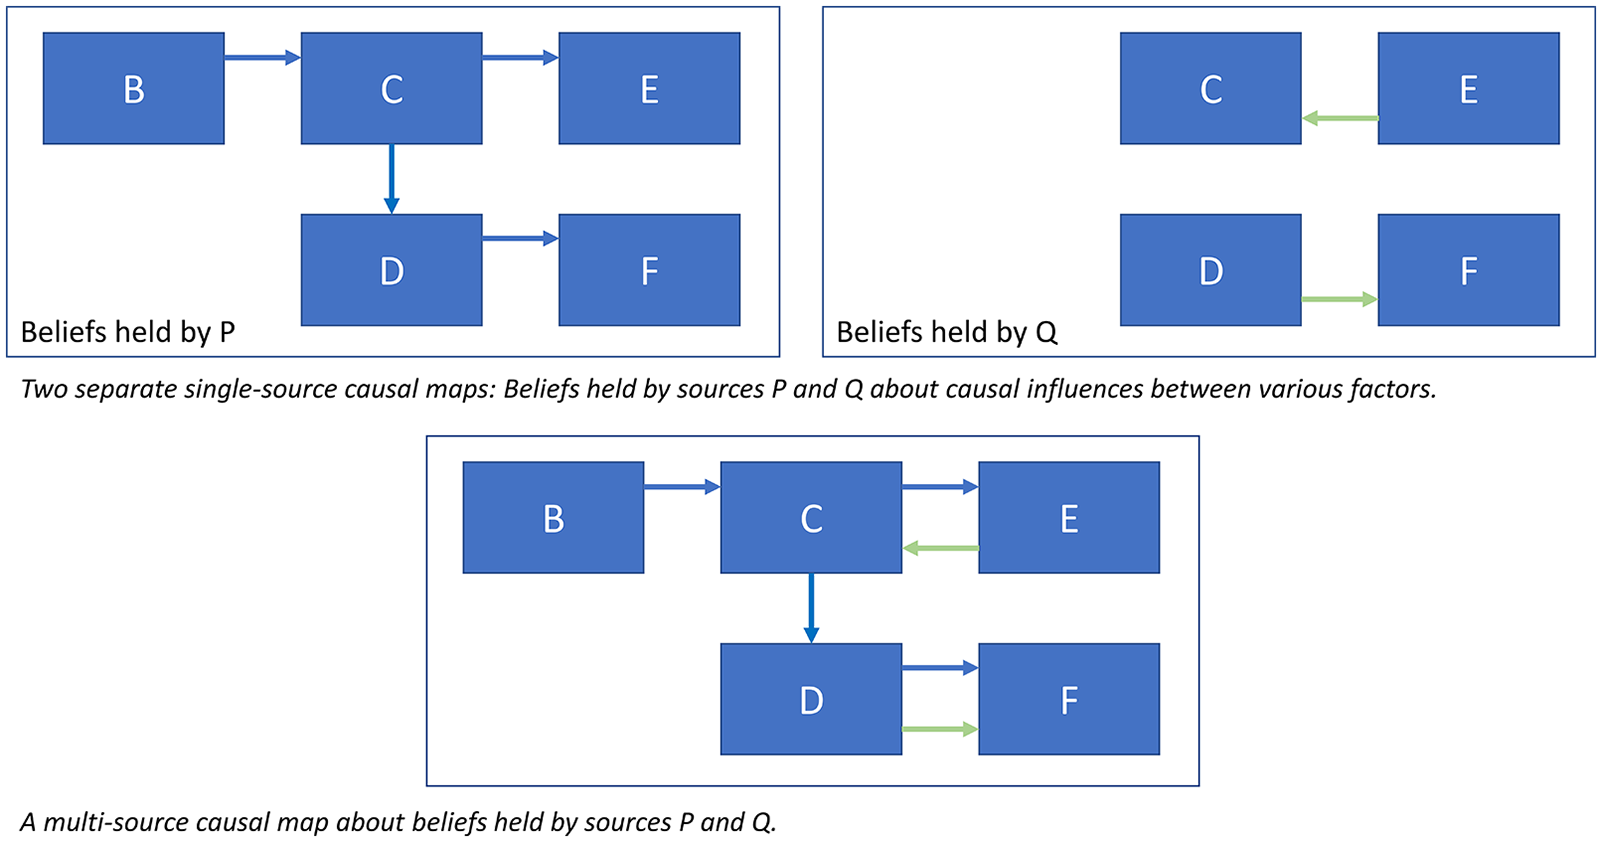
Combining two separate single-source causal maps into a multi-source map: an illustrative example.
The simplest causal maps refer to only one context and contain information from only one source (which may be the consensus view of several people, treated as speaking with a single voice). Various forms of systems mapping such as PSM could be understood as a special case of causal mapping in this sense.
There are many other variants. One source might give differentiated information about different cases or contexts, or many sources might give information about just one context, as when different water systems experts each give their (possibly differing) opinion about the same water catchment area, for example.
Another frequent type of causal map is drawn from many sources, each reporting on their own situation or context, such as their perception of drivers of change in their own lives. In coding and analysis of this sort of data, one source equals one case and one context; these can subsequently be aggregated across many sources who, for example, all share a similar context.
Fifth, causal maps do not necessarily specify a clear system boundary. The boundaries of a causal map are usually defined more loosely, partly by data collection but also by the sources themselves. Indeed, some systems proponents would say that the term ‘systems diagram’ simply signals a readiness to use systems approaches (Williams, 2022).
Finally, causal mapping, especially in management sciences and operations research, has nearly always been at least as interested in process as in the result. There is often a focus on the process of reaching consensus as part of the task of solving a business problem, rather than on the universal accuracy or validity of the final map.
Janus: Causal mappers face in two directions
It is worth concluding this section by highlighting how, like Janus, the causal mapper looks in two directions at once: sometimes interpreting maps as perceptions of causation but also often wanting to make the leap to inferences about actual causation. As Laukkanen and Wang (2016: 3) point out, while conceptually poles apart, in practice, the two functions can be hard to distinguish, particularly without sufficient explanation about source information and how this has been analysed. We see the job of the causal mapper as being primarily to collect and accurately visualise evidence from different sources, often leaving it to others (or to themselves wearing a different hat) to draw conclusions about what doing so reveals about the real world. This second interpretative step goes beyond causal mapping per se (Copestake, 2021; Copestake et al., 2019a; Powell et al., 2023).
Seen as models of the world, causal maps, like systems maps, are fallible but useful: We can use inference rules (which are explicitly set out in FCMs, SDs, BBNs and CLDs and are implicit in other related approaches) to make deductions about the world. Seen as models of individuals’ causal beliefs, we can arguably use analogous rules, perhaps also including rules from epistemic logic, to make deductions about what individuals ought to believe. 5
However, we argue that evaluators can break the Janus dilemma and make the best use of causal maps in evaluation by considering causal maps not primarily as models of either beliefs or facts but as repositories of causal evidence. We can use more- or less-explicit rules of deduction, not to make inferences about beliefs, nor directly about the world, but to organise evidence: to ask and answer questions such as:
Is there any evidence that X influences Z?
. . . directly, or indirectly?
. . . if so, how much?
Is there more or less evidence for any path from X to Z compared to any path from W to Z?
How many sources mentioned a path from X to Z?
. . . of these, how many sources were reliable?
We also argue that this is a good way of understanding what evaluators are already doing: gathering and assembling data from different sources about causal connections in order to weigh up the evidence for pathways of particular interest, like the pathways from an intervention to an outcome.
Causal mapping in evaluation: Three tasks
Causal mapping offers ways to organise, combine, present and make deductions from a large number of relatively unstructured causal claims – the sort of data that are often collected in evaluations. Different approaches to these three tasks are discussed in turn in the following sections.
Task 1: Gathering narrative data
How to collect causal claims from which to draw causal maps? There are a wide variety of options, including in-depth individual interviews (Ackermann and Eden, 2004), reuse of open-ended questions in structured surveys (Jackson and Trochim, 2002), literature reviews (in which ‘sources’ can be documents rather than individuals) and archival or secondary material within which pre-existing causal claims are already made (Copestake, 2020). Other approaches aim to build consensus by using structured collaborative processes, including Delphi studies and PSM (Penn and Barbrook-Johnson, 2019). Guidelines for causal mapping may include procedures for collecting primary data, with forms of elicitation including back-chaining (‘what influenced what?’) and forward-chaining (what resulted, or could result, from this?)
When gathering primary data, the way in which questions are asked influences the meaning of the maps and their links. For example, in the QuIP, (Copestake et al., 2019b) respondents are asked to identify causes of changes, then causes of the causes and so on. This means that most of the factors are not expressed directly as variables that may go up or down (e.g. ‘harvest’, ‘hunger’) but already as changes in something, such as ‘an improved harvest’ or ‘reduced hunger’). This has implications for how positive and negative statements are combined, as discussed in the following section.
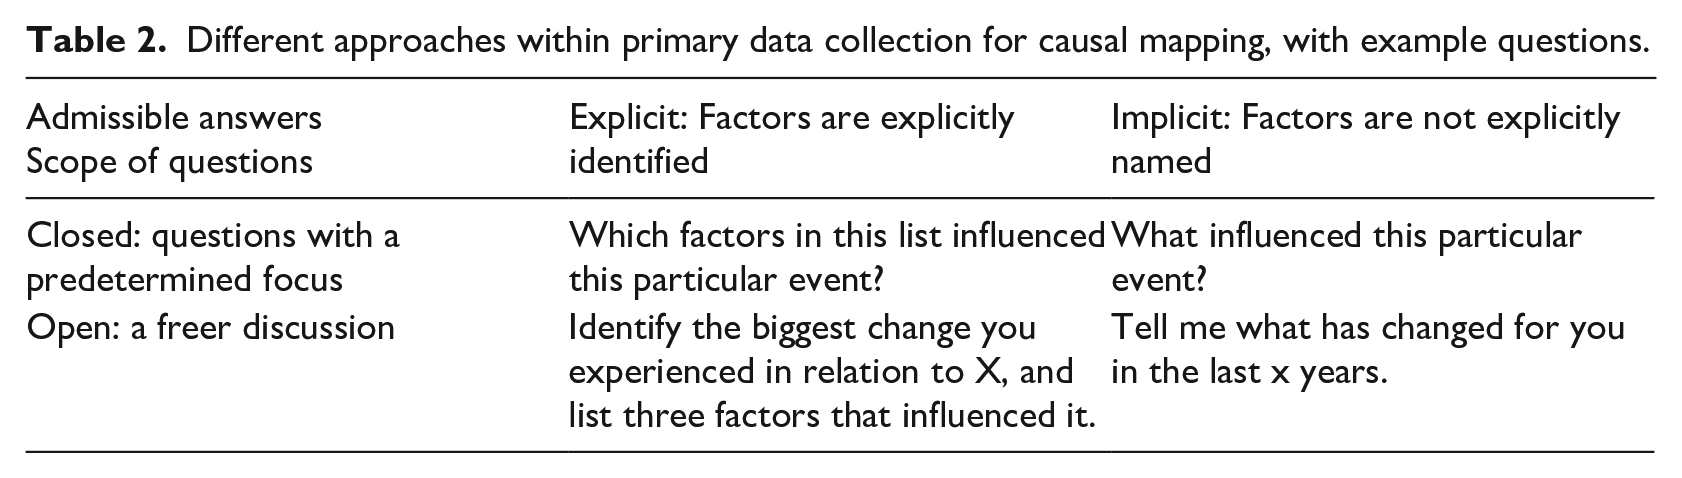
With primary data collection, we can distinguish between relatively closed and open approaches and whether respondents are forced to choose between pre-selected optional answers or can formulate their own (see Table 2). Interviewers may also be guided by a chaining algorithm; for example, they may be instructed to iteratively ask questions like ‘You mentioned X, please could you tell me what were the main factors that influenced X or led to it happening?’.
Different approaches within primary data collection for causal mapping, with example questions.
Task 2: Coding causal claims
Some approaches such as that suggested by Markiczy and Goldberg (1995) directly elicit causal links from their sources, perhaps by asking respondents to suggest causal links between a predetermined list of causal factors, and thus, after finishing Task 1, are already in a position to create causal maps. More explicitly, qualitative approaches are faced with Task 2: encoding causal claims in the form of explicit causal links and factors. This task is similar to ordinary qualitative data analysis (QDA), whether done manually or using tools like NVivo, Dedoose and AtlasTI. However, these tools are designed to capture general concepts, rather than claimed causal links between concepts, which is what we need for causal mapping. QDA for causal mapping also starts with a corpus of narrative data, but it does not create causal links between independent concepts that might already have been coded using ordinary non-causal thematic analyses. Rather, in causal QDA, the primary act of coding is to highlight a specific quote from within a statement and identify the causal claim made by simultaneously identifying a pair of causal factors: an ‘influence factor’ and a ‘consequence factor’ (see Figure 2). 6
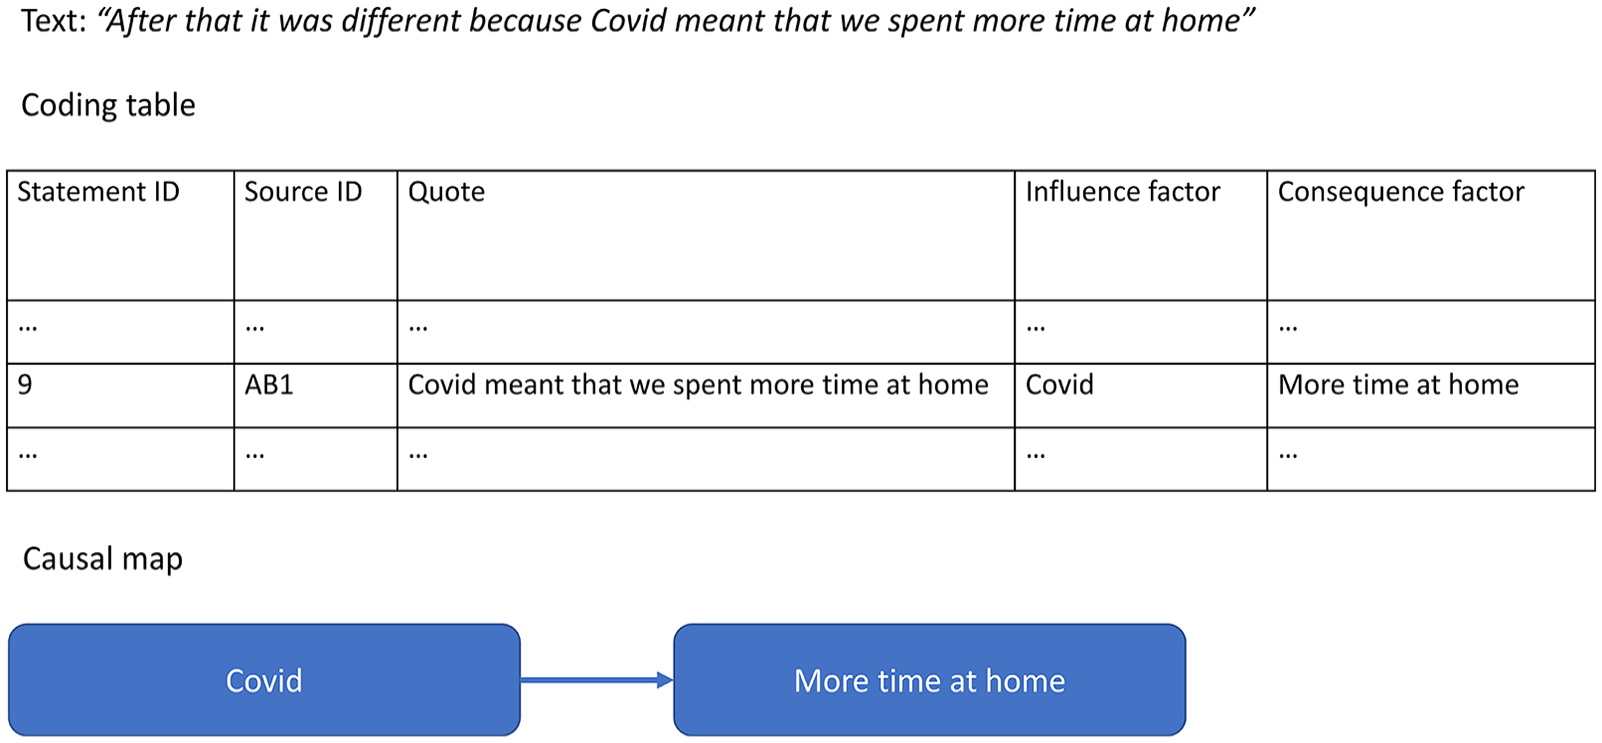
From text to causal mapping via coding, an illustrative example.
The causal factors only exist as one or other end of a causal link and have no meaning on their own. 7 Each claim forms a link in the visual representation of the causal map. The Axelrod school had its own coding manual describing how to highlight areas of text expressing causal connections and code them as links between causal factors, originally inspired by evaluative assertion analysis (Osgood et al., 1956).
Manual causal coding of text data, like ordinary thematic coding, requires a considerable investment of time and expertise to do well. We now use natural language processing to at least partially automate this; however, the process is essentially the same, and discussion of this is beyond the scope of the present article.
Where do the labels for the causal factors come from? As with ordinary QDA and thematic analysis (Braun and Clarke, 2006), approaches vary in the extent to which they are purely exploratory or seek to confirm prior theory (Copestake, 2014). Exploratory coding entails trying to identify different causal claims embedded in what people say, creating factor labels inductively and iteratively from the narrative data. Different respondents will not, of course, always use precisely the same phrases, and it is a creative challenge to create and curate this list of causal factors. For example, if Alice says ‘Feeling good about the future is one thing that increases your wellbeing’, is this element ‘Feeling good about the future’ the same as ‘Being confident about tomorrow’ which Bob mentioned earlier? Should we encode them both as the same thing, and if so, what shall we call it? We might choose ‘Positive view of future’, but how well does this cover both cases? Laukkanen (1994) discusses strategies for finding common vocabularies. As in ordinary QDA, analysts will usually find themselves generating an ever-growing list of factors and will need to continually consider how to consolidate it – sometimes using strategies such as hierarchical coding or ‘nesting’ factors (as discussed in the following section).
The alternative to exploratory coding is confirmatory coding, which employs an agreed code book, derived from a ToC and/or from prior studies. QuIP studies mostly use exploratory coding but sometimes supplement labels with additional codes derived from a project’s ToC, for example, ‘attribution coding’ helps to signify which factors explicitly refer to a specific intervention being evaluated (Copestake et al., 2019b: 257). However, careful sequencing matters here because pre-set codes may frame or bias how the coder sees the data (Copestake et al., 2019a). Again, the positionality of the coder matters just as much when doing causal coding as it does for any other form of qualitative data coding.
Combining Tasks 1 and 2
Tasks 1 and 2 result in a coded data set of causal claims, each of which consists of (at the very least) the labels for a pair of causal factors. Those using a more-explicit elicitation approach have been able to skip Task 2.
Task 3: Answering evaluation questions
Causal maps help us to assemble evidence for the causal processes at work in specified domains, including the influence of activities being evaluated. They can also help expose differences between the evidence given by different sources and differences between the analysed data and theories of change derived from other sources, including those officially espoused by the commissioner of the evaluation (Powell et al., 2023). The identification of differences in understanding can then feed into further enquiry, analysis and action concerning why people have different views, what the implications of this are and how these might be addressed.
Focusing on causal claims is of course only one way of answering evaluation questions from a corpus of text data. But it is productive because many evaluation questions are at least partly about causation and causal contribution, and we have found that causal mapping points to possible answers to these questions relatively rapidly compared to more generic QDA approaches. Answering questions about efficiency, effectiveness, impact and sustainability, for example, all depend on identifying the causal effects of a specific intervention, be they perceived as positive or negative, intended or unintended (OECD, 2010). Even ‘relevance’ can have a causal interpretation in the sense that an intervention is relevant if it is doing the right thing: Whether it is likely to help to address the needs of stakeholders is at least partly a judgement about its causal powers.
For a data set comprising hundreds or thousands of links, an unfiltered global map of all the links is a bewildering and useless ‘hairball’ that includes everything but highlights nothing. One way to simplify is to derive from the global map several smaller maps that focus on different features of the data. For example, maps may selectively forward-chain the multiple consequences of a single cause – including those activities being evaluated: effects of causes (Goertz and Mahoney, 2006) – or trace back to the multiple contributory causes of an anticipated or highly valued outcome or consequence: causes of effects. A series of simpler causal maps, each selected transparently to address a specific question, generally adds more value to an evaluation than a complicated, if comprehensive, single map that is hard to interpret. The downside of this is that selectivity in what is mapped and is not mapped from a single database opens up the possibility of deliberate bias in selection, including omitting to show negative stories. 8
Sets of individual links with the same influence and consequence factor (co-terminal links) are usually represented bundled together as a single line, often with thickness of the line indicating the number of citations, and/or with a label showing the number of links in the bundle. The map has not fundamentally changed, but the visualisation is much simpler.
Another way to simplify a global causal map is to produce an overview map showing only the most frequently mentioned factors and/or links. Care should be taken if this leads to omitting potentially important but infrequently mentioned evidence about, for example, an unintended consequence of an intervention.
Another common way to simplify is to combine sets of very similar factors into one. For example, if hierarchical coding has been used, it is possible (with caveats) to ‘roll up’ lower-level factors (such as health behaviour; hand washing and health behaviour; boiling water) into their higher-level parents (health behaviour), rerouting links to and from the lower-level factors to the parent (Bana e Costa et al., 1999).
Large causal maps can also be analysed quantitatively, including by tabulating which factors are mentioned most often, identifying which are most centrally connected or calculating indicators of overall map density, such as the ratio of links to factors (Klintwall et al., 2023; Nadkarni and Narayanan, 2005). We are wary of the value of summarising maps in this way, not least because results are highly sensitive to the granularity of coding. For example, although a specific factor such as ‘improved health’ might have been mentioned most often, if two subsidiary factors had been used instead (such as ‘improved child health’ and ‘improved adult health’), these two separate factors would not have scored so highly.
Causal mapping has some limitations. First, the credibility of the causal arguments which can be derived from a map is limited by the credibility of the original data sources. We see the job of causal mapping as collecting, organising and synthesising a large number of claims about what causes what; drawing conclusions about what this actually reveals about the world is a final step that goes beyond causal mapping per se. In specific cases, establishing explicit and context-specific rules of inference may help to make this final step. For example, it might be agreed that a reasonable threshold of evidence that C influenced E is that (i) a specified number or proportion of respondents independently mentioned the link; (ii) the connection can be plausibly explained theoretically and (iii) researchers anticipated confirmation bias and other potential sources of bias and took adequate steps to mitigate against them. See Tegarden et al. (2016) for a discussion of the role of anonymity in causal mapping in organisations.
A second limitation of causal mapping is the difficulty it has in systematically capturing the strength or type of causal influence. It is relatively rare in open conversation for people to indicate in a consistent way the magnitude of the effect of C on E, or whether C was a necessary or sufficient condition for E or precisely how certain they are about the connection. There is of course scope for framing questions to encourage people to ascribe weights to their answers, which can then be incorporated into the way maps are constructed. But imposed precision risks turning into spurious precision, and stronger framing of questions may distract from other issues and nuances that more open-ended questioning might otherwise have elicited.
An illustrative example
A positive feature of causal maps, illustrated by Figure 3, is that they capture a lot of information in a way that is quick and easy to understand. This example reveals that Source S provided a narrative that connects the intervention to improved feeling of wellbeing as a direct consequence of taking more exercise and via the effect of this on their health. This source also suggests a positive feedback loop, with more exercise making them more physically fit and encouraging even more exercise. The information from Source T is more fragmented; there are two causal statements claiming that improved feeling of wellbeing can result from more exercise and improved health, although T does not make any causal link back to the intervention. In addition, T suggests that an additional factor, ‘more confidence in the future’, also contributes to improved feeling of wellbeing. The two sources of evidence do agree on certain points; there is scope for generalisation beyond either individual source (and can be scaled up from here), both in assessing the multiple outcomes of the intervention and in understanding what explains improved feeling of wellbeing. Generalisability is strengthened when a link is reported by different sources in different contexts. We believe that within causal mapping, we should never make the mistake of thinking that stronger evidence for a causal link is evidence that the causal link is strong; only that there is more evidence for it.
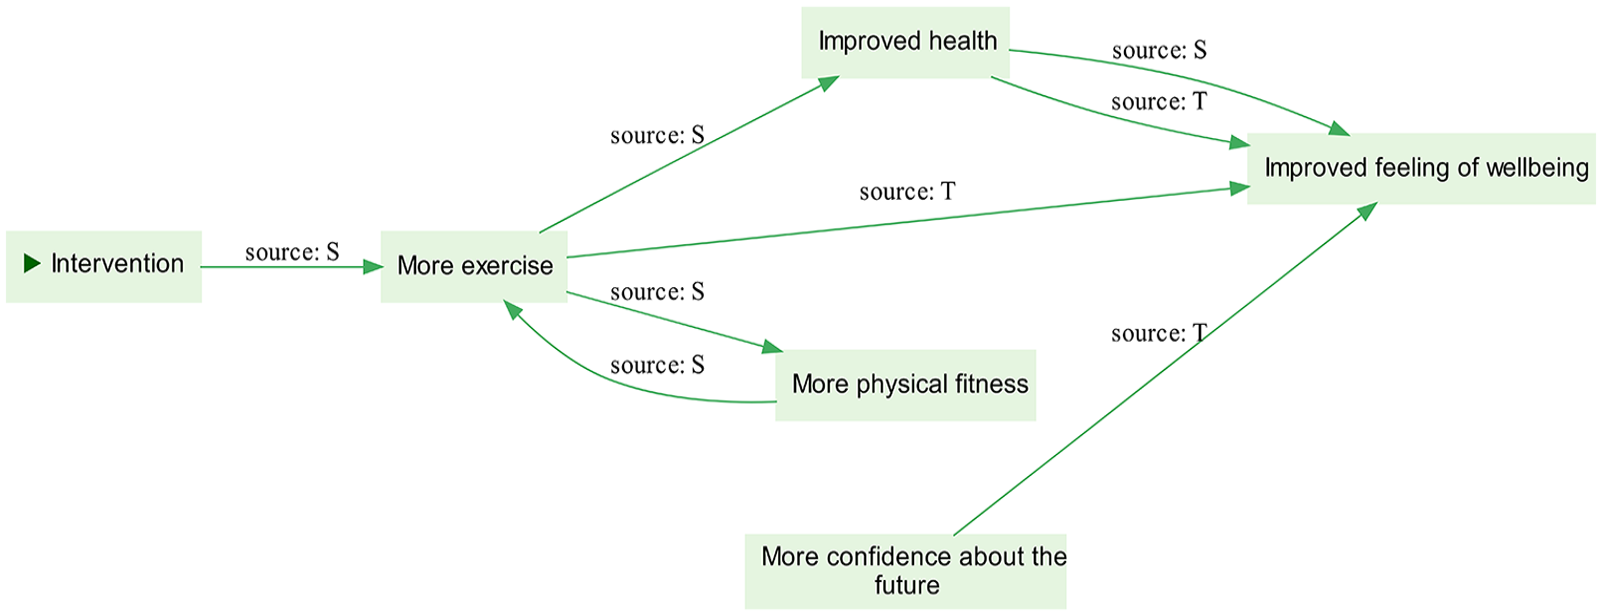
An illustrative example of a very simple causal map.
The example also reveals some weaknesses of causal maps. First, there is ambiguity about the precise meaning of the labels and the extent to which their use is conceptually equivalent between the two sources. There is also ambiguity about whether they are referring to their own personal experience (and if so, over what period) or speaking in more general terms. Furthermore, the diagram sacrifices details, including how the statements shown relate to the wider context within which each source is situated. To mitigate this, an important feature of any causal mapping procedure is how easily it permits the user to trace back from the diagram to the underlying transcripts and key information about the source (e.g. gender, age, location etc.). Where this is possible, the diagram can be regarded in part as an index or contents page – an efficient route to searching the full database to pull out all the data relating to a specific factor or causal link.
Even with a simple example like this, we can answer many questions by visually examining the paths. But analysis of larger data sets might be simplified by selecting only all the paths between a selected cause and consequence to produce what Bougon et al (1977) called an ‘etiograph’. Eden et al. (1992) go so far as to collapse some causal paths into individual links, simply removing intervening factors.
Our causal map software uses the ‘maximum flow/minimum cut’ algorithm (Erickson, 2019), which quantifies the robustness of longer paths from C to E by calculating the minimum number of causal claims which would have to be invalidated or lost to remove any possible causal pathway between them. This is simply the idea that the strength of an argument is dependent on the strength of its weakest link, extended to apply to an interconnected network rather than a single chain. In other words, we can express a path through a causal map as a possible argument: An argument can be constructed that C causally influences D, and then E. This also provides ways to formally address questions such as ‘how robust is the evidence for the influence of C on E, compared to evidence for the influence of B on E?’. As our causal evidence will often be of varying quality and reliability, we are advised to also construct and compare paths that consist only of evidence from the most reliable sources.
We prefer to talk about possible arguments here because this sidesteps the (also interesting) question of whether any individual source made any such argument in its entirety, with all its constituent links. 9 In many circumstances, evidence for a causal path derived from different sources and contexts can be considered to strengthen the argument, whereas heaps of evidence from the same source will not. To address this kind of issue directly, we can use a complementary measure ‘source thread count’ as a measure of the strength of the argument from C to E: the number of sources, each of which mentions any complete path from C to E.
Where there are many sources, it may also be useful to identify variation in which subgroups support different possible arguments. For example, Markiczy and Goldberg (1995) use dimension-reduction techniques on the table of all links reported by all sources to identify clusters of sources so that the members of each cluster are maximally similar to one another in terms of the links they report, and so that the clusters taken as a whole are maximally different from one another. These groups can also be cross-tabulated with existing metadata, to interpret them as, for example, young city-dwellers versus older rural residents.
The transitivity trap
Transitivity is perhaps the single most important challenge for causal mapping. Consider the following example. If
source P [pig farmer] states ‘I received cash grant compensation for pig diseases [G], so I had more cash [C]’, and
source W [wheat farmer] states ‘I had more cash [C], so I bought more seeds [S]’,
can we then deduce that pig diseases lead to more cash which leads to more seed (G → C → S), and therefore G → S (there is evidence for an indirect effect of G on S, i.e. that cash grants for pig diseases lead to people buying more seeds)?
The answer is of course that we cannot because the first part only makes sense for pig farmers, and the second part only makes sense for wheat farmers. In general, from G → C (in context P) and C → S (in context W), we can only conclude that G → S in the intersection of the contexts P and W.
Correctly making inferences about indirect effects is the key benefit but also the key challenge for any approach which uses causal diagrams or maps, including quantitative approaches (Bollen, 1987).
Conclusion
Constructing causal maps can help evaluators use narrative evidence from multiple sources to answer questions about the evidence for the influence of interventions on outcomes (direct and indirect; intended and unintended) along with the evidence for influence of contextual factors. Second, causal maps also enable evaluators to sort, search, summarise and analyse narrative evidence more easily and systematically and to select suitable examples and quotations to illustrate key observations and arguments. Third, done correctly, it can enhance the credibility of causal findings and conclusions by making the process by which they were generated more systematic and transparent, leaving them open to peer review. Fourth, causal maps produce graphics that can cut through the complexity of language and grammar by visualising the relatively simple cognitive connections that inform our everyday thinking and speech.
In addressing core questions which evaluators are tasked with answering, causal mapping also draws on a long if fragmented literature; it can be integrated or combined with a range of methodological approaches and methods, including realist evaluation (Pawson and Tilley, 1997), outcome harvesting (Wilson-Grau and Britt, 2012), process tracing (Bennett and Checkel, 2015), contribution analysis (Mayne, 2001), most significant change (Dart and Davies, 2003) and the QuIP (Copestake et al., 2019a). What has been lacking, we suggest, is greater clarity and consistency about what causal mapping means for evaluators.
Key to doing so is recognising head-on the ambiguity of much narrative causal data, particularly when confronted with large bodies of data collected in disparate ways. Evaluators must contend with messiness: imprecise system boundaries, differing specification of claimed causal influences and lack of clear or consistent information about what case or group of cases claims refer to. Causal mapping can contend with all this ambiguity rather than shying away from it. It can make use of messy operational data, treating urgent, unexpected and unstructured information at face value. This is made possible by distinguishing clearly between two analytical steps in evaluation: The first is to gather, understand and assemble causal evidence from different sources (those in a position to have useful evidence about relevant causal links and chains) to construct, compare and contrast the evidence for and against different possible causal pathways. By focusing on this task, causal mapping lays a more reliable foundation for the second, often critical, task of using the assembled data to make judgements about what is in fact really happening. This avoids the confusion and ambiguity that often arises when evaluators seek to address both steps simultaneously by constraining what data are collected to fit a prior view of reality which other stakeholders may or may not share.
Focusing the methodological lens on causal mapping as a discrete, central evaluation task opens promising avenues for further research. First, there is scope for causal meta-analysis of existing evaluation reports (see Powell (2020) for an example). Second, there is scope for more research into the task of integrating causal mapping with wider debates about the interface between fact and value (Powell, 2019) – evaluation as social science and as applied moral philosophy (Schwandt and Gates, 2021). Third, there is scope for delving more deeply into the process and logic of causal mapping itself, including how to manage directly conflicting causal claims, how to assess and improve inter-rater reliability of coding and how to automate coding using machine learning.
In our effort to recommend causal mapping to evaluators, we have relied heavily on the extensive causal mapping literature. In this article, we have also briefly outlined some modest contributions of our own. First, we outline a way to understand document processing for causal mapping as ‘causal QDA’, in which the tags are entire causal links. We mentioned our barefoot approach to causal QDA, which sticks close to the original text and unusually does not rest on an assumption that causal factors are variables and which therefore does not distinguish between positive and negative links. Second, we show evaluators a way out of the Janus dilemma (is a causal map a model of the world? Or is it a model only of beliefs?) by understanding causal maps as repositories of evidence for interconnected causal links, out of which it is possible to construct and compare arguments for causal pathways of interest. We also suggest the maximum flow/minimum cut algorithm as a way to calculate and compare the robustness of an argument. Third, we highlight transitivity (deducing C→E from C→D and D→E) as a key strength as well as a potential danger (the transitivity trap) within causal mapping. The risks of drawing spurious conclusions from incompletely specified data highlight the continuing importance of experienced evaluators who understand and relate findings to the context surrounding the data and refer back constantly to the original data. Causal mapping is a tool which can help to speed up the process and lift the lid on the black box of qualitative analysis, but it is no silver bullet; the findings must still be processed, digested and interpreted. Finally, we suggest that all theory-based evaluation, insofar as it involves assembling (and drawing conclusions from) evidence about causal connections within a programme model, can be understood as a kind of causal mapping.
Footnotes
Declaration of conflicting interests
The author(s) declared no potential conflicts of interest with respect to the research, authorship, and/or publication of this article.
Funding
The author(s) received no financial support for the research, authorship, and/or publication of this article.