
Abstract
Heart rate (HR) monitoring during exercise represents a potentially useful strategy for teachers delivering physical education lessons. This study examined how projecting HR monitor data onto a screen acutely affected school students’ exercise intensity during a high-intensity interval training (HIIT) session. Twenty students (12.3 ± 0.9 years, male = 8, female = 12) from one primary school volunteered to participate. Using a randomised crossover design within a 4-week period, participants completed four sessions of HIIT with HR projection and four sessions of HIIT with no ability to view HR. During the HR projection condition all participants viewed their HR on a class screen in real-time, with a changing colour according to HR level. Target intensity was 90% of age-predicted maximum HR. Peak HR and time above 90% HR (RED) were collected in all sessions. Student focus groups and teacher interviews were conducted to gain perceptions around the effects of the projection. Peak HR (p = 0.005, η2 effect size = 0.049) and RED (p = 0.000, η2 effect size = 0.083) were significantly greater during the projected condition. Qualitative data indicated that projection improved student motivation to reach the target, and ignited competition amongst peers to work harder. Projecting HR data onto a screen can increase the acute exercise intensity of school students during HIIT. HR projection therefore represents a useful strategy for the delivery of exercise sessions with an emphasis on intensity, within physical education classes.
Introduction
Heart rate (HR) monitors can provide a self-monitoring tool that elicits immediate, augmented feedback capable of quantifying effort (Clapham et al., 2015; Nichols et al., 2009). The use of HR monitors during physical education (PE) classes appears to increase physical activity levels, enhance motivation, and keep students on task (Clapham et al., 2015; Marzano, 2017; Nichols et al., 2009; Partridge et al., 2011; Petit, 2016; Stöckel and Grimm, 2021). Viewing HR fluctuations, or focusing on maintaining a HR zone, can also add interest during a session (Mitchell et al., 2001). Visualising HR data on a screen can provide students with a more intuitive understanding of their body's response to each target HR zone (Marzano, 2017). Providing real-time, individualised HR feedback can also increase students’ enjoyment and motivation to exercise (Stöckel and Grimm, 2021).
High-intensity interval training (HIIT) has attracted substantial recent attention in research and practice. Evidence supporting the health benefits of HIIT in school-aged youth is now well established (Logan et al., 2014; Lubans et al., 2021; Martin-Smith et al., 2020), hence it is clear that exercising in a manner whereby effort levels are achieved at the requisite intensity (Duncombe et al., 2023, 2024; Liu et al., 2024) is effective. However, there is still a paucity of research around the ways to better engage this cohort in the high efforts requisite in HIIT (Chandler and Stringer, 2020). The integration of HR monitoring within a HIIT training programme may be an effective tool to achieve such an effect (Lubans et al., 2022). Additionally, data from HR monitors can provide teachers with a useful pedagogical tool (Nichols et al., 2009; Partridge et al., 2011), and students with an understanding of physical activity zones, providing learners with a stronger intrinsic rationale for exercising at a high intensity (Clapham et al., 2015; Ignico et al., 2006).
We therefore investigated the effects of HR monitor projection on exercise intensity during a school-based HIIT session. Additionally, the study sought to examine whether projection improved perceived student motivation and enjoyment towards exercising at a high intensity.
Methods
Participants
We used a mixed method, within-subject crossover design with 20 students from one primary school (age range = 11–13 years). Students were excluded if they were unable to participate in PE lessons due to injury or illness. We obtained written signed assent and guardian consent. Ethics approval was provided by the Auckland University of Technology Ethics Committee prior to commencement. All data were collected during July to September 2022.
Procedure
Following an initial familiarisation session, participants completed two HIIT sessions per week (8–10 minutes excluding warm-up) separated by at least one day, over a 4-week period, randomised to one of two groups by order of projection condition. Condition A involved projection of HR data onto a screen; Condition B involved the same HIIT sessions without projection. Group one completed the sessions in condition order ABAB, and group two in order BABA. Each group was led by their usual class teacher during school time in their classroom. The classroom was divided into two for the HIIT interventions to be run side by side at the same time of day. Students could not see into the other classroom. HIIT was the only session being completed for PE during that time of the term. Both classes completed the same unit simultaneously, the only difference being the order of the projection versus non-projection. Not all sessions took place at the same time. There was variation from morning to after the lunch break, depending on scheduling.
Both teachers received a half-day professional learning session in the week preceding the study to learn how to use the HR equipment and deliver sessions. It involved some theoretical content, including a background summary of associated research and an overview of the study. There was a large amount of practical content within the session, including the teachers using the monitors, connecting to the software and performing the 10 exercises while projecting their data. Basic technique was covered, using practical demonstrations and supporting videos. Both teachers practised setting up the software and Bluetooth speaker and recording a short session in preparation for the study.
Two work–rest ratio protocols were used throughout the eight sessions, each featuring 8 to 10 minutes of simple bodyweight movements such as star jumps and squats: 10 × 30–30 second work–rest intervals and 16 × 20–10 second work–rest intervals. The first session of the week used the 10 × 30–30 and the second session of the week used the 16 × 20–10. There was no progression in the third and fourth week, just different exercises.
Participants in both groups wore a Polar H10 HR monitor (Polar H10™, Finland) for every session, regardless of condition, but only in Condition A was HR data visible to participants. The HR monitors connected via Bluetooth to an iPad™ using the Polar GoFit™ application (Polar Electro, Lake Success, NY) to record all of the data. During Condition A, participants’ individual real-time HR and percentage of age-predicted maximum using the formula 208–0.7 × age (Tanaka et al., 2001) could be viewed by all participants within a coloured square projected on a large screen in class, identified by a number known only to the respective participant. The background colour changed as HR zone changed. Participants were instructed to volitionally try their hardest. The Polar GoFit™ application collected time spent in RED zone and peak HR (beats per minute (BPM)) data during both conditions. Neither the teacher nor student participants could view the data during Condition B sessions.
Focus groups and interviews
Students were interviewed in three semi-structured focus groups (five to eight students per group) at the end of the 4-week programme. Focus groups were approximately 30 minutes, taking place during class time in the staff room. Students were excused from class to attend. Focus groups were led by one researcher who had no prior relationship with participants. Predetermined questions were asked which were open-ended, neutral and clear (Longhurst, 2003). There was opportunity to engage in casual conversation to build rapport, establish a flow to the group discussion, and ask additional questions for clarification (Partridge et al., 2011). The questions were centred on perceptions about HR monitor use, feelings around projection to achieve high intensity, and the general group dynamic. For example:
Did you enjoy using a HR monitor? If so, what aspect(s)? If not, why? Was it easier to achieve a high level of intensity when you saw your HR on the screen? Did you enjoy using HR monitors with your class? If so, what aspect(s)? If not, why? Was it helpful for you to see your students' heart rates on the screen? Do you think they enjoyed seeing their HR on the screen? What else did you notice about using HR monitors compared to usual PE fitness lessons? What are the barriers/enablers? Do you think students achieved a higher intensity when they saw their HR on the screen?
The two teachers participated in semi-structured interviews individually. Questioning lasted approximately 30 minutes per teacher. The general question subthemes were similar to the student questions, for example:
Inductive content analysis was employed to analyse the focus group and interview data (Partridge et al., 2011). Data were transcribed verbatim from audio recordings using transcription software (Otter.ai, Mountain View, CA). Themes were initially established as units of analysis from the predetermined questions (Cavanagh, 1997). Responses within each theme were identified from the transcripts and further coded as subthemes using keywords and phrases. A coding sheet was used to transfer all quotations to the relevant subthemes (Burnard et al., 2008). Similar themes were collapsed and merged to move words into fewer content-related categories with a shared meaning (Burnard et al., 2008; Cavanagh, 1997).
Statistical analyses
The difference between projection and non-projection sessions based on previous research (Stöckel and Grimm, 2021) was expected to be approximately 10 BPM for achieving above 90% of maximum HR (RED) and 17 BPM for HR, with overall standard deviation of 15 BPM for both. Similar research from Marzano (2017) and Petit (2016) demonstrated similar magnitudes of difference and variation. For a simple crossover design, a total sample of 16 was required for differences in HR and 38 for achieving RED. As there were only 20 participants in total available, the addition of a second phase of crossover sessions and replicate sessions (projection or non-projection) achieved sufficient power due to the testing of replicate and order effects.
Statistical analyses were conducted using the SAS System (v9.4). Descriptive characteristics between the Condition A and Condition B datasets were first examined using box and whisker plots for peak HR and percentage of total session time spent in above 90% of maximum HR (RED) to show trends in data centrality and spread utilising measures including median and interquartile ranges. Data were then analysed using a repeated measure mixed model analysis of variance with a compound symmetry covariance structure. Differences in peak HR and RED were analysed between conditions, group (1 or 2), and phase (projection first or second). In total, 143 out of 160 observations were analysed due to 17 missing data points. Partial eta-squared (η2) effect sizes (ES) were interpreted as: η2 < 0.01 = ‘negligible’; 0.01 ≤ η2 < 0.06 = ‘small’; 0.06 ≤ η2 < 0.14 = ‘medium’; and η2 ≥ 0.14 = ‘large’ (Cohen, 1988).
Results
The mean ± standard deviation age of all 20 student participants was 12.3 ± 0.9 years (male = 8, female = 12). Data were only included in the analyses if students participated in at least five of the eight sessions (as an arbitrary cutoff), and completed at least one of each condition. Nine participants completed all eight sessions and 13 had at least one missing value due to absences. Both teachers and 17 student participants completed the focus groups/interviews. Tables 1 and 2 present the effects for peak HR (BPM) and RED (%).
Fixed effects for peak HR (BPM) and session time spent above 90% HR maximum.
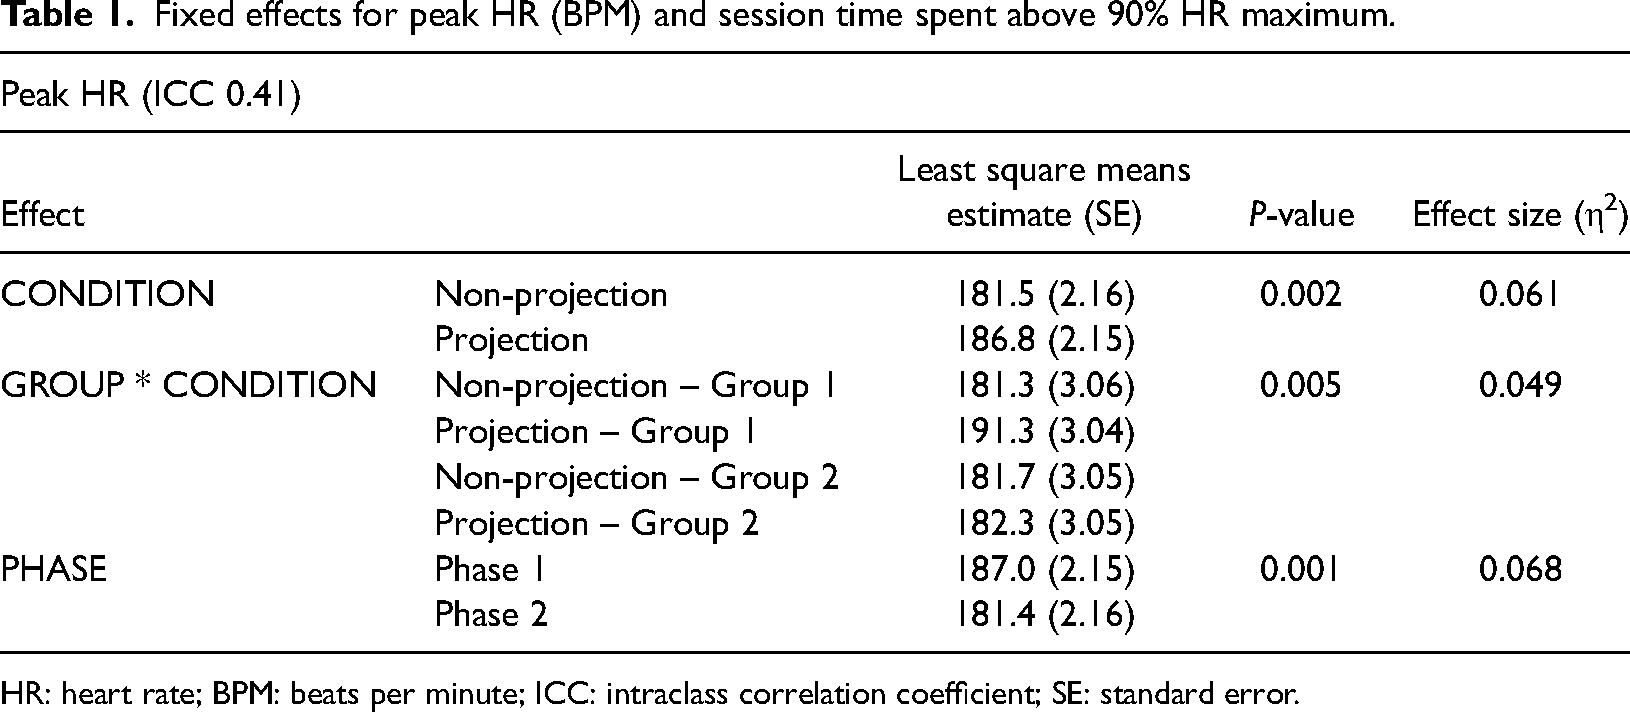
HR: heart rate; BPM: beats per minute; ICC: intraclass correlation coefficient; SE: standard error.
Fixed effects for percentage of session time >90% age-predicted HR maximum.
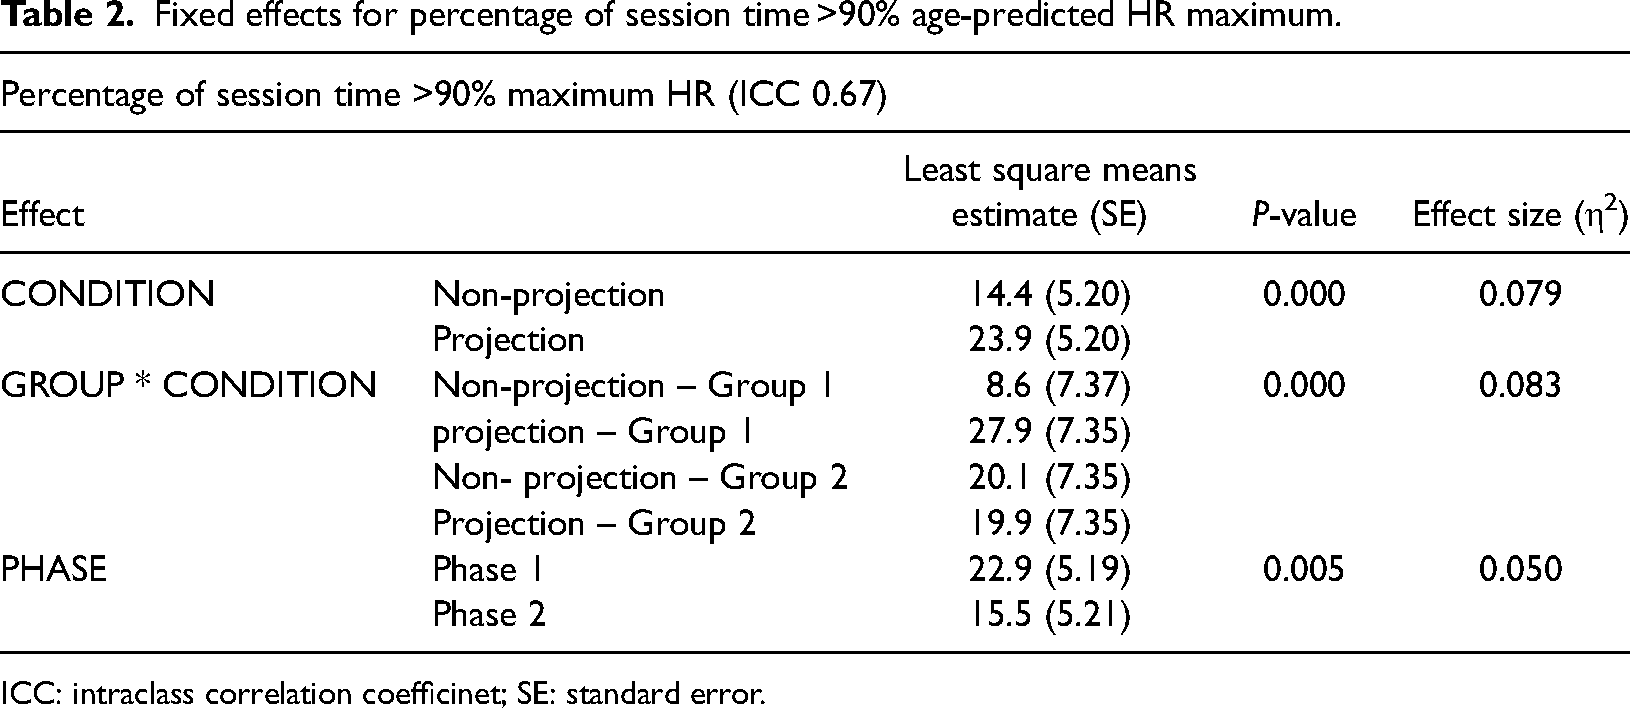
ICC: intraclass correlation coefficinet; SE: standard error.
Both peak HR and RED were significantly greater with a medium effect (p = 0.002, ES = 0.061, and p = 0.000, ES = 0.079, respectively) for the projection condition. Significantly greater peak HR with a medium effect (p = 0.005, ES = 0.049) and RED (p = 0.000, ES = 0.083) were observed for group one (projection first crossover group) than group two (non-projection first). There was a significant decrease overall in peak HR with medium effect (p = 0.001, ES = 0.068) and RED with negligible effect (p = 0.005, ES = 0.050) between the first projection or non-projection phase and the second phase for both groups.
Focus group and interview findings
One of the most consistent perceptions reported from all of the focus groups was that HR monitor projection increased motivation to work at a higher intensity. No students reported negative feelings towards the projection phase and there was an overwhelming consensus that the projection of the HR monitor data had a positive motivational effect, manifesting in comments such as ‘it motivates you to try harder’, and ‘I found it really motivating. Seeing it on the screen, it motivated me more to get to RED quicker’. Both teachers agreed there was an obvious improvement in student motivation during the projection phases, reinforced by comments such as ‘they were definitely more motivated and just focused. It did appear to sort of engage and motivate them a bit more’.
The majority of students expressed that they felt they achieved a higher intensity level when HR data was projected. For example, ‘(we) definitely all worked way harder when it was on the screen’ and ‘it would trigger me to see how hard to go’. A number of students discussed the rationale behind their increased intensity levels, citing the projection of HR gave them accountability, a ‘purpose’ or a ‘reason to try’. One student stated, ‘what's the point in doing it if you're not wearing it’. Some students discussed how the HR monitors provided more focus. One student commented, ‘Yeah I reckon I was interested just a little more’ and another said ‘it suddenly got your attention and then, yeah, you just push yourself harder’. A sense of pride around achieving the target ‘RED zone’ intensity was also expressed by many students. They also expressed their experiences of the non-projection phase, sharing negative perceptions of a lower work rate, such as ‘I don't think I tried as much in the ones that I didn't see’ and ‘I can do nothing and no one will know that I'm not trying hard’. The effects of the projection on attention to task was noted by some. For example, ‘when I saw stuff on the screen, I was only thinking about that, and then the next week, I, there was a lot more distractions’. Both teachers also emphasised the perceived difference in motivation between projection and non-projection. One teacher commented, ‘you know when the screen was black, it felt like this was a normal fitness lesson, and you wanted to kind of be a bit more motivating, but when the screen is on they wanted to do it themselves’.
All students agreed that projection of HR ignited competition among their peers. Specific examples were provided such as ‘If everyone else was in RED, and you were like in green, then you would probably work a lot harder to get into RED’. The motivational impact of other students in their group during the projection phase was acknowledged, manifesting in comments such as ‘if you're not doing that well and everyone else was pushing really hard then I would be motivated’. Other students disagreed, and explained that they mainly focused on themselves ‘because you can't really compare yourself to (others)’. Both teachers reflected on the competitive nature of the students; one stated, ‘Yes, they liked kind of competing, especially those who are competitive. I think it kind of helped the others’.
The teachers discussed how they enjoyed the projection phase and found that it provided a useful pedagogical tool to monitor student engagement and effort, and that it had potential for cross-curricular use. Both teachers stated some concern that projecting HR data could stigmatise students who had lower fitness levels, making them susceptible to decreased confidence levels or bullying, although this was not directly observed at any stage. A few students raised the issue of differing fitness levels, expressing that it was unfair how those with lower fitness levels did not have to work as hard to reach the RED target.
Discussion
The primary aim of this study was to determine whether visualising real-time HR data projected onto a screen would acutely affect the exercise effort levels of school students during a class-based HIIT session. Additionally, the study sought to examine whether it improved perceived student motivation and enjoyment towards exercising at a high intensity. Overall, results showed that projection provided significantly greater peak HR and RED to medium effect size. Hence, visualising real-time HR data projected onto a screen increased acute exercise effort. Our findings support studies by Stöckel and Grimm (2021), Marzano (2017) and Petit (2016) who reported that displaying HR on a screen significantly increased the percentage of time that students spent within their target HR zone in comparison to a non-display setting. However, these studies were based more around moderate to vigorous physical activity (MVPA) zones rather than specific HR zones.
Clear differences were evident between groups, suggesting an order effect impacted results. While group one demonstrated a clear projection effect, very little difference was found between projection and non-projection in group two. Focus group and interview findings supported these HR data. Students claimed that projection increased motivation and enjoyment, provided focus, and allowed them to see whether they achieved the target RED (>90% peak HR). These results are similar to findings from MVPA studies; real-time HR data allows students to use the data to stay on track and meet their HR target (Nichols et al., 2009; Stöckel and Grimm, 2021). Students discussed how projection introduced a positive competitive element to the lessons, and without projection there was no accountability or little motivation to push themselves. Teachers supported this concept, and expressed that students were fully engaged during the projection phases, but felt the need to motivate students during non-projection phases. All student comments around projection were positive. Both teachers raised initial concerns that projecting HR data could stigmatise students who had lower fitness levels, making them susceptible to decreased confidence levels or bullying. Similar to findings by Partridge et al. (2011), students also raised the issue of differing fitness levels, expressing that it was unfair how those with lower fitness levels did not have to work as hard to reach the RED target. It is quite conceivable that some sharing of monitor numbers occurred between peers, but that was not an aspect we were able to quantify. The social dimension of HR projection may need future consideration, particularly over a longer period.
Although HR data showed that projection resulted in greater exercise intensity than non-projection overall, this was only achieved in group one. No significant difference was found for peak HR and RED in group two. It is conceivable that the differences between groups were due to learning and/or carryover effects that cannot be ruled out in a randomised crossover design (Cederström et al., 2021). It has been suggested that by first viewing projected HR data on the screen, students are able to gain a perceptual understanding of how the target intensity level should physically feel when projection is removed (Marzano, 2017). However, in the present study, group two achieved a relatively similar intensity within the first non-projection phase to the subsequent projection phase, so the perceptual understanding proposed by Marzano (2017) is not supported by our results. It could be conjectured that students were influenced by the novelty of performing HIIT in the first lesson, regardless of the projection. The initial excitement was supported by the group two teacher who commented on the ‘novelty value’ at the beginning of the brief study period. A similar novelty effect was reported by Foster et al. (2015) who found enjoyment for HIIT declined over the 8-week intervention period. A significant reduction in both peak HR and RED was found between the first projection or non-projection phase and the second phase in both groups, although no student mentioned that they were getting bored of the HIIT lessons, and there were no comments to support a boredom or fatigue effect between phases. Similarly, neither of the teachers commented on any differences in performance, motivation or behaviour between the two phases. Petit (2016) also reported no increase in MVPA during the final goal setting stage of a HR projection study, and concluded that boredom may have been a contributing factor. More familiarisation sessions (without projection) prior to the study commencement could have helped to reduce the overall novelty effect, and a longer study period would disentangle novelty from medium term effects.
Another potential explanation for the difference in group results is the different participant characteristics within each group; although we did not assess them, baseline body mass index and fitness testing could have been used to stratify groups by physical fitness, or groups could have been allocated via a minimisation approach (Hecksteden et al., 2018). The group two teacher emphasised that there were several students who were ‘obviously unfit’ in the group. This might explain the greater distribution of data found in group two, especially for RED in both projection and non-projection phases.
A further explanation for the differences between groups may be owing to teacher delivery differences. Although students and teachers received the same instructions during the initial familiarisation sessions, there may still have been some discrepancies between teacher instructions over all eight sessions. Teachers were instructed to remain neutral and impartial during the HIIT exercises. However, a difference in the teachers’ personas was highlighted during the student focus group as one teacher was described as ‘really hard’ and the other ‘calming’. This is speculative, and represents an opportunity for future research to monitor.
It is likely that the positive effect of HR projection shown in this study is underpinned by the self-determination theory (SDT) (Deci and Ryan, 1985; Ryan and Deci, 2000). SDT proposes that autonomous motivation can be enhanced when the three basic psychological needs of competence, autonomy and relatedness are achieved (Deci and Ryan, 1985; Ryan and Deci, 2000). SDT is applicable to PE lessons and HIIT programmes (Costigan et al., 2015; Jaakkola et al., 2008; Owen et al., 2014; Stöckel and Grimm, 2021). Competence was supported during the projection phase, as students were provided with individualised biofeedback that evidently facilitated greater effort. Students expressed pride and enjoyment around hitting the target RED zone, and discussed a lack of motivation and accountability during the non-projection phase. This finding is in line with previous PE studies reporting individual feedback improved interest and motivation (Mitchell et al., 2001; Ntoumanis, 2001). Stöckel and Grimm (2021) also concluded that the students who received real-time feedback from projected data achieved competence through the ability to adjust the intensity of their running speed. Autonomy was partly facilitated during the projection phase of this study, as students were actively able to adjust their intensity levels based on the feedback from the projected data. Similarly, Marzano (2017) found projected HR data provided students with an intuitive understanding of their body's response to each target HR zone, enabling them to take control of their performance to meet their goal during that session. Relatedness was achieved through the apparently positive and supportive group dynamic that was established when data was projected. Previous research has emphasised that a motivational climate and supportive behaviours are required to satisfy the need for relatedness (Owen et al., 2014). Qualitative findings from both teachers and students indicated that the projection of HR encouraged competition, and students perceived this to be a positive effect that increased motivation within the group to work harder. Stöckel and Grimm (2021) also suggested that the projection of group data facilitated a competition or group pressure to improve running intensity. It was posited that the relatedness element caused a form of externally driven motivation that may have assisted with motivating students who suffered from low autonomous motivation in PE to run (Stöckel and Grimm, 2021). Further investigation into the impact of group dynamics on the performance of projected HR data is warranted.
Overall, both the HR data and qualitative findings support the use of HR monitor projection during HIIT in a class setting to raise student motivation. Teachers could utilise HR monitor projection to inform the design of effective PE programmes and evaluate student workload and effort (Freedson and Miller, 2000; Marzano, 2017; Nichols et al., 2009; Partridge et al., 2011). HR monitor projection could also be used to teach students about their own HR to develop an understanding of physical activity zones. Developing understanding around activity and healthy lifestyles can improve inherent satisfaction (Ferrer-Caja and Weiss, 2000; Ryan and Deci, 2017; Vallerand, 2007). Enhanced knowledge can also increase intrinsic motivation by providing a strong rationale for exercising at a high intensity (Clapham et al., 2015; Ignico et al., 2006).
Our study addresses gaps highlighted in the existing literature and has a number of strengths. Firstly, the within-subject crossover design enabled order effects to be tested. The use of both quantitative HR data and qualitative focus group and interview data also provided a greater understanding around whether projection affected motivation.
Limitations of the study are the small sample size, and that the study was only conducted over a short timeframe. Additionally, we did not collect all demographic and physical data at baseline. It should also be noted that use of HR monitoring in practice is limited in many settings given the cost of their purchase.
Conclusion
This study provides initial evidence that projecting HR can enhance intensity (effort) levels during school-based HIIT sessions delivered by a non-PE specialist teacher to school students aged 12 years.
Footnotes
Acknowledgements
The authors are grateful to the teachers and participants involved.
Declaration of conflicting interests
The authors declared no potential conflicts of interest with respect to the research, authorship, and/or publication of this article.
Funding
The authors received no financial support for the research, authorship, and/or publication of this article.