
Abstract
Objective
Admissions for ambulatory care sensitive conditions (ACSCs) are often used to measure potentially preventable emergency care. Visits to emergency departments with ACSCs may also be preventable care but are excluded from such measures if patients are not admitted. We established the extent and composition of this preventable emergency care.
Methods
We analysed 1,505,979 emergency department visits (5% of the national total) between 1 April 2015 and 31 March 2017 at six hospital Trusts in England, using International Classification of Diseases diagnostic coding. We calculated the number of visits for each ACSC and examined the proportions of these visits that did not result in admission by condition and patient characteristics.
Results
11.1% of emergency department visits were for ACSCs. 55.0% of these visits did not result in hospital admission. Whilst the majority of ACSC visits were for acute rather than chronic conditions (59.4% versus 38.4%), acute visits were much more likely to conclude without admission (70.3% versus 33.4%). Younger, more deprived and ethnic minority patients were less likely to be admitted when they visited the emergency department with an ACSC.
Conclusions
Over half of preventable emergency care is not captured by measures of admissions. The probability of admission at a preventable visit varies substantially between conditions and patient groups. Focussing only on admissions for ACSCs provides an incomplete and skewed picture of the types of conditions and patients receiving preventable care. Measures of preventable emergency care should include visits in addition to admissions.
Keywords
Introduction
Avoidable health care utilization is of growing concern as it represents an unnecessary use of resources and is often regarded as symptomatic of suboptimal community and primary health care.1-9 Emergency admissions for ambulatory care sensitive conditions (ACSCs) are frequently used as a measure of potentially preventable hospitalizations. 1 These include chronic conditions such as asthma and diabetes, where good quality care should prevent exacerbations; acute conditions such as dehydration and gastroenteritis, where timely and effective care stops the condition deteriorating; and vaccine preventable conditions. 2
Admissions for ACSCs have been validated as performance indicators in many countries, such as the US, Germany, Spain and the UK.3-6 The Organization for Economic Co-operation and Development reports rates of ‘avoidable admissions’ from all 34 member countries as indicators of the quality of primary care. 7 Systematic reviews show that physician supply and longitudinal continuity of care reduce avoidable admissions for chronic conditions 8 and that better access to primary health care reduces ACSC admission rates. 9
However, focussing only on admissions will not capture all clinically preventable emergency care. This is because only a subset of patients visiting an emergency department (ED) are admitted, and their composition and patient characteristics may be different from non-admitted attendances. Consequently, policies to reduce preventable utilization may not be targeting all conditions or patients who experience preventable episodes of emergency care.
ACSC ED visits have so far only been studied in the US context,10-12 where variations in insurance coverage confound comparisons across population groups. Furthermore, US EDs act as ‘safety net’ providers for those without insurance or a regular doctor. We focus here on EDs in England which are available to all, free at the point of access.
The prevalence of potentially preventable ED visits in England has not been examined due to limitations in how ED data are recorded. ACSCs are identified using international classification of diseases (ICD) diagnosis codes, but most EDs in England use a diagnosis classification system that is too broad to code preventable visits in this way.
However, we identified six National Health Service (NHS) hospital Trusts in England that do in fact use ICD classification in their EDs. For the first time, this enables identification of ED attendances for ACSCs in England and therefore an estimate of potentially preventable attendances. We also used these data to establish the extent and composition of preventable emergency care missed when focussing only on admissions. We also examined the proportions of preventable visits not resulting in admission across conditions and patient characteristics.
Methods
Data
We used patient-level data on all visits to major (known as ‘type 1’) EDs in England from Hospital Episode Statistics between 1 April 2015 and 31 March 2017 inclusive. 13 We obtained the following information from each visit record: patient age, gender, ethnicity, area of residence, arrival mode, diagnosis and whether the visit resulted in admission to hospital. We attached quintiles of the Index of Multiple Deprivation 2019 14 to the patient’s lower layer super output area of residence. 15
Identification of potentially preventable ED visits
There is no universally agreed definition of ACSCs. 2 We used the definition of ACSCs used in both the NHS Outcomes Framework and Clinical Commissioning Group (CCG) Outcomes Indicator Set, since these admissions are used to measure performance in the English NHS.16-17 We used the 19 conditions contained in two CCG Outcome Indicator Set indicators: ‘Indicator 2.6 Unplanned hospitalizations for chronic ambulatory care sensitive conditions’, 16 and ‘Indicator 3.1 Emergency admissions for acute conditions that should not usually require hospital admission’ which includes acute and vaccine preventable conditions. 17 The codes and full descriptions are listed in the Online Supplement 1 Table S1.
Hospitals can report up to 12 diagnoses fields on ED visit records, but 94.5% of visits have only one diagnosis. In the main analysis, we classified visits only using the first diagnosis field. In two sensitivity checks, we first analysed only visits with one diagnosis field completed and then we classified visits as preventable if any diagnosis field was an ACSC.
Identification of hospital Trusts using ICD diagnoses in their EDs
Hospitals in England can record diagnoses based on three coding schemes: Accident and Emergency diagnosis, Read Coded Clinical Terms and ICD-10. 18 The coding system is determined by the software in each hospital’s patient administration system. As ACSCs are identified using ICD codes, we restricted our sample to hospitals that only used this classification system and had few missing diagnoses.
We checked the coding of diagnoses using Stata’s ‘icd10 check’ command 19 in data from all 140 hospital Trusts in England. We identified nine Trusts where over 99% of visits with non-missing diagnosis fields contained a valid ICD code. We then ranked these Trusts by levels of missing diagnosis data. We selected the six Trusts with less than 12.5% missing data, as this was a natural cut-off point since the extent to which data were missing was almost twice as high (24.7%) in the next Trust. Our chosen cut-off was approximately half the extent to which data was missing in diagnostic coding in the Trusts not using the ICD classification system (25.7%).
In total, the six included Trusts recorded 1,505,979 ED visits over the 2 years, representing 4.9% of total visits in England across the same period. Two of the six Trusts are in the West Midlands region of England, three are in the South West, and one is in the South East of England. Online Supplements 2 and 3 provide details of data cleaning, levels of missing diagnosis and results of Stata’s ‘icd10 check’ command.
Statistical methods
First, we examined how the visits at the six selected Trusts compared to those at Trusts in the rest of England in terms of patient age, gender, area deprivation, arrival mode and discharge method.
We then estimated the prevalence of preventable ED visits at the six hospital Trusts as measured by the number of ACSC visits. We report this in absolute volumes and as a proportion of all ED visits. We classified the preventable visits into three groups: chronic, acute or vaccine preventable. We then examined which of the 19 preventable conditions were most prevalent. We also stratified this by age group.
Finally, we explored the characteristics of patients whose preventable care would be missed if only admissions had been counted. We examined how the proportion of ACSC visits that did not result in admission varied across patient age group, gender, ethnicity, area deprivation and presenting condition.
Results
Visits at the six selected hospital Trusts had broadly similar characteristics as visits at all other Trusts in England (Online Supplement 4 Table S4). A higher proportion of visits at the six selected Trusts were by patients living in the most deprived areas (35.7% versus 27.4%).
Emergency department visits for ambulatory care sensitive conditions, by hospital Trust.
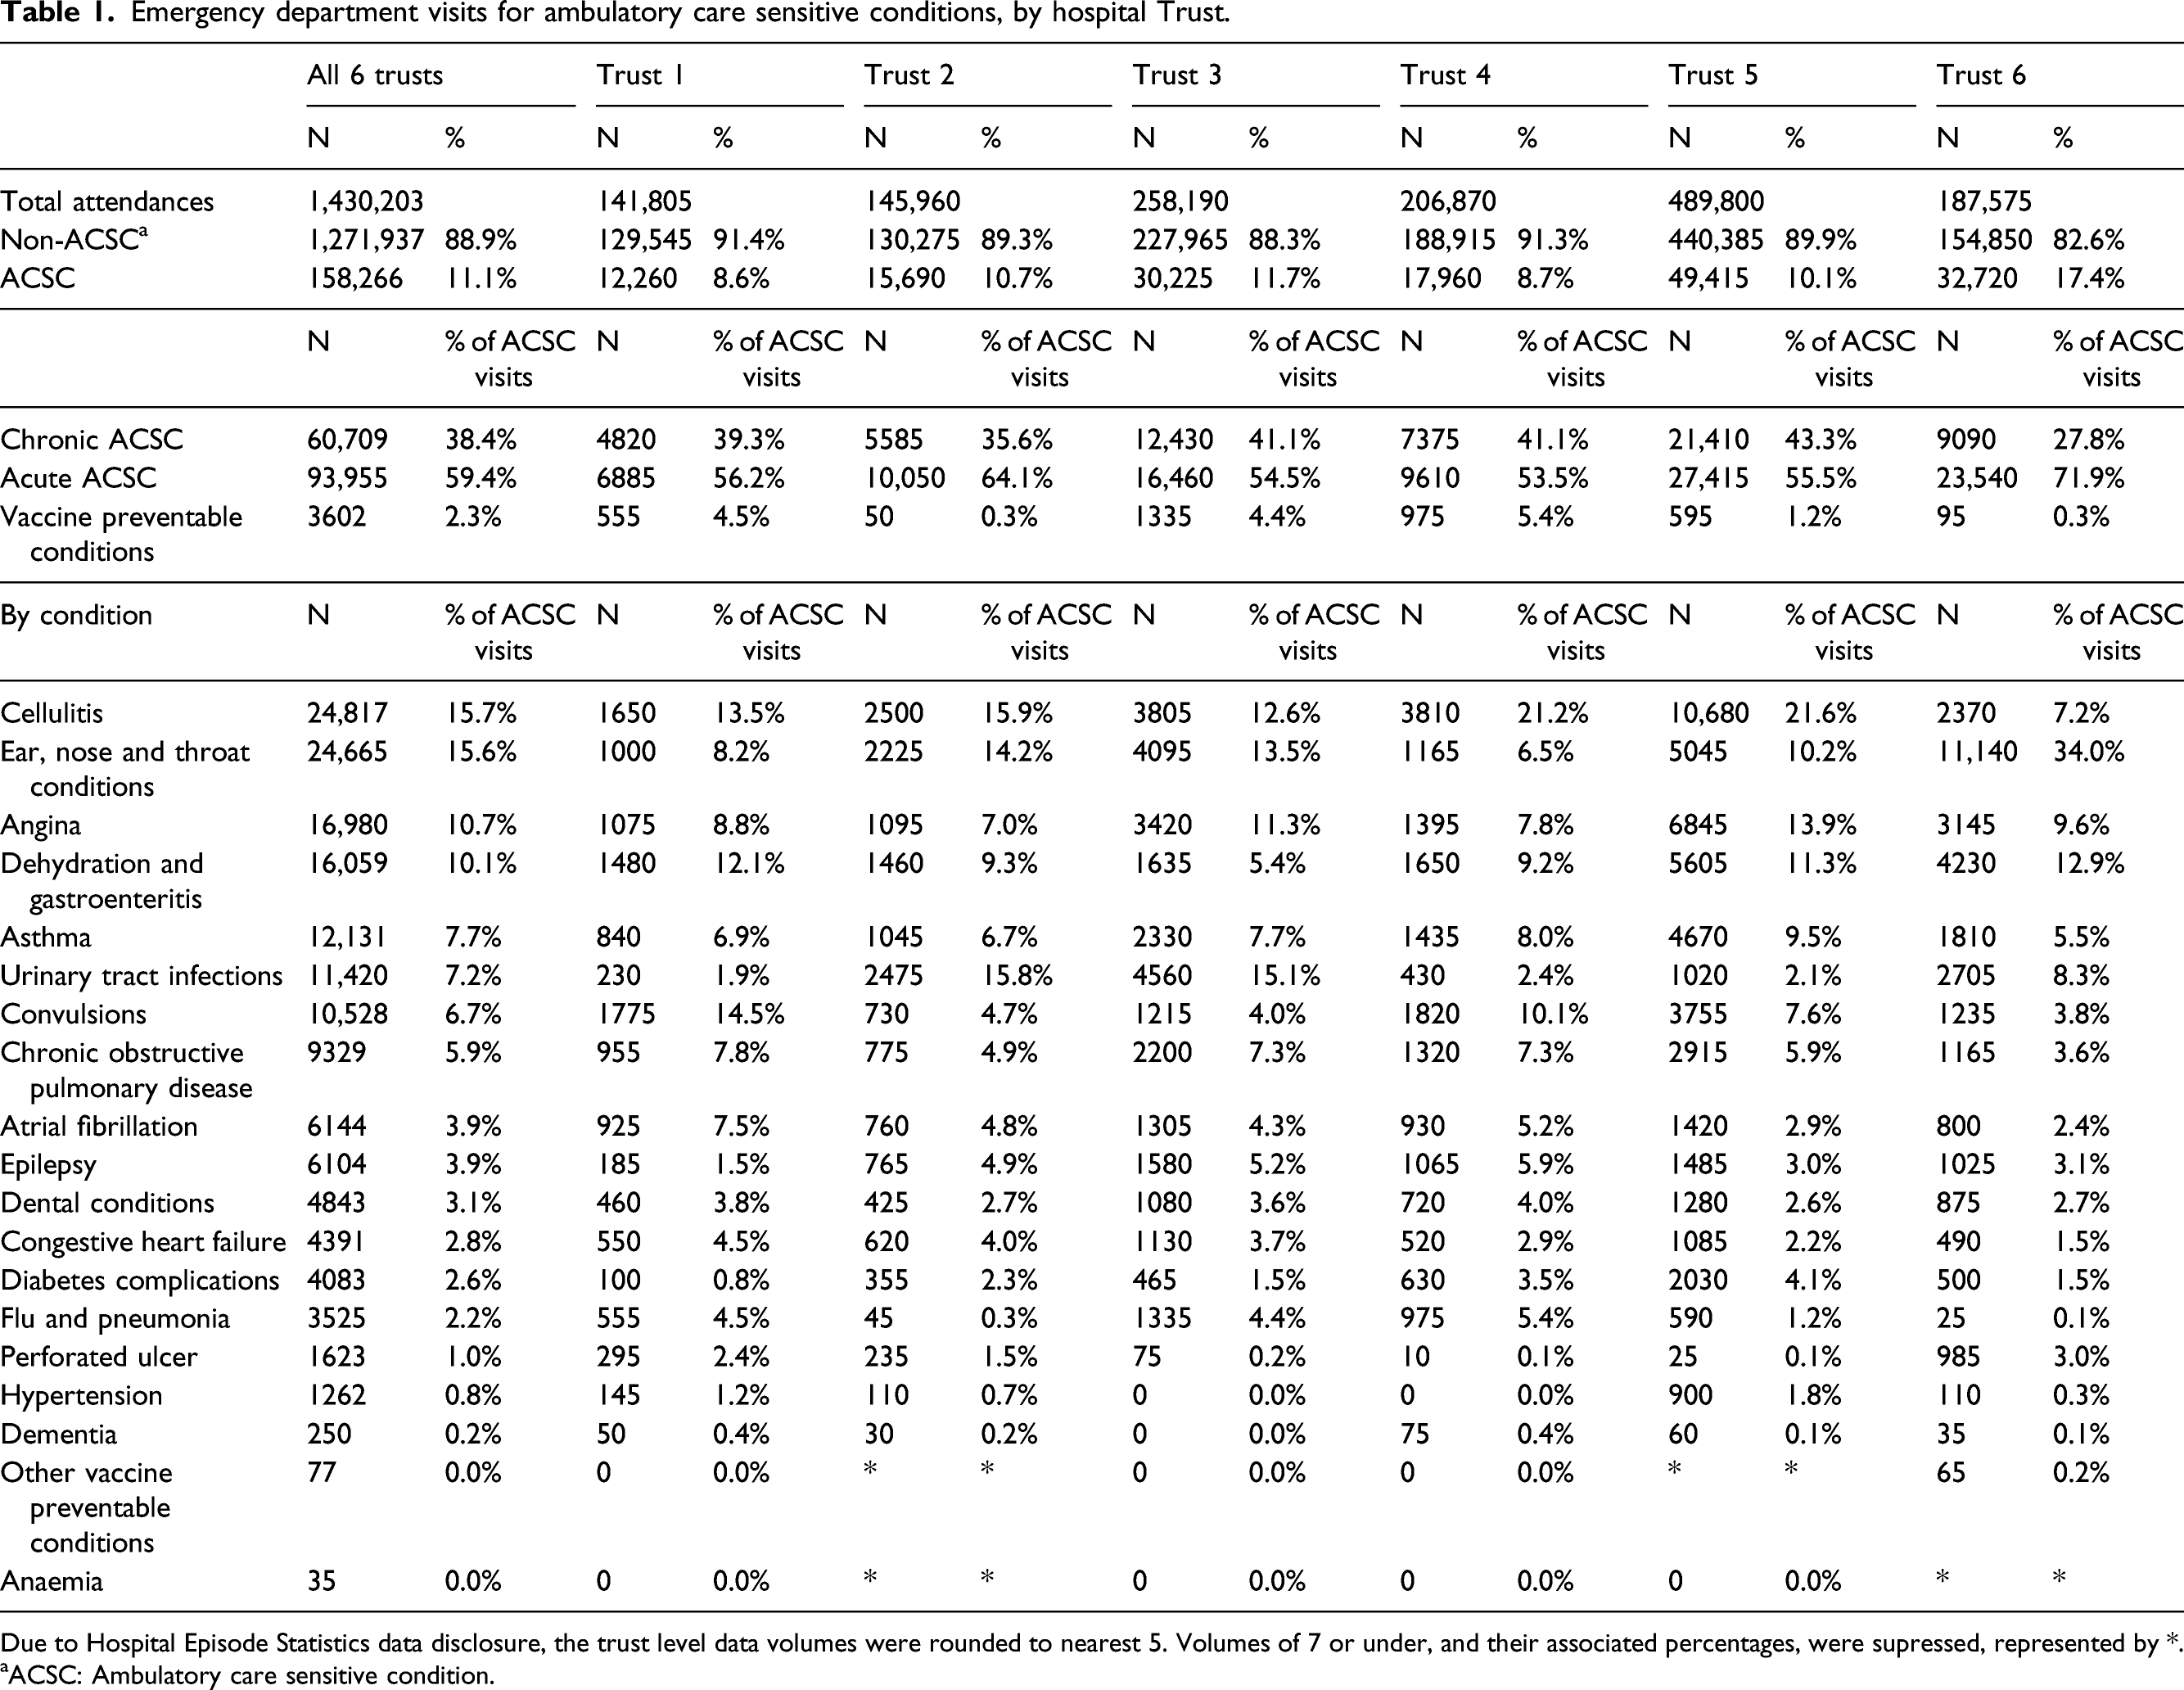
Due to Hospital Episode Statistics data disclosure, the trust level data volumes were rounded to nearest 5. Volumes of 7 or under, and their associated percentages, were supressed, represented by *.
aACSC: Ambulatory care sensitive condition.
Restricting to visits with no secondary diagnoses recorded resulted in 11.0% (149,109/1,352,135) of visits classified as preventable. 11.5% of visits were classified as preventable when we considered any diagnosis field (Online Supplement 5 Table S5).
Returning to Table 1, five of the 19 ACSCs accounted for almost 60% of preventable visits. These were cellulitis (24,817 visits, 15.7% of all ACSC visits); ear, nose and throat infections (24,665, 15.6%); angina (16,980, 10.7%); dehydration and gastroenteritis (16,059, 10.1%); and asthma (12,131, 7.7%). The five least frequent ACSCs were anaemia (35, 0.0%), other vaccine preventable conditions (77, 0.0%), dementia (250, 0.2%), hypertension (1,262, 0.8%), and perforated ulcer (1623, 1.0%).
Emergency department visits for ambulatory care sensitive conditions, by age group.
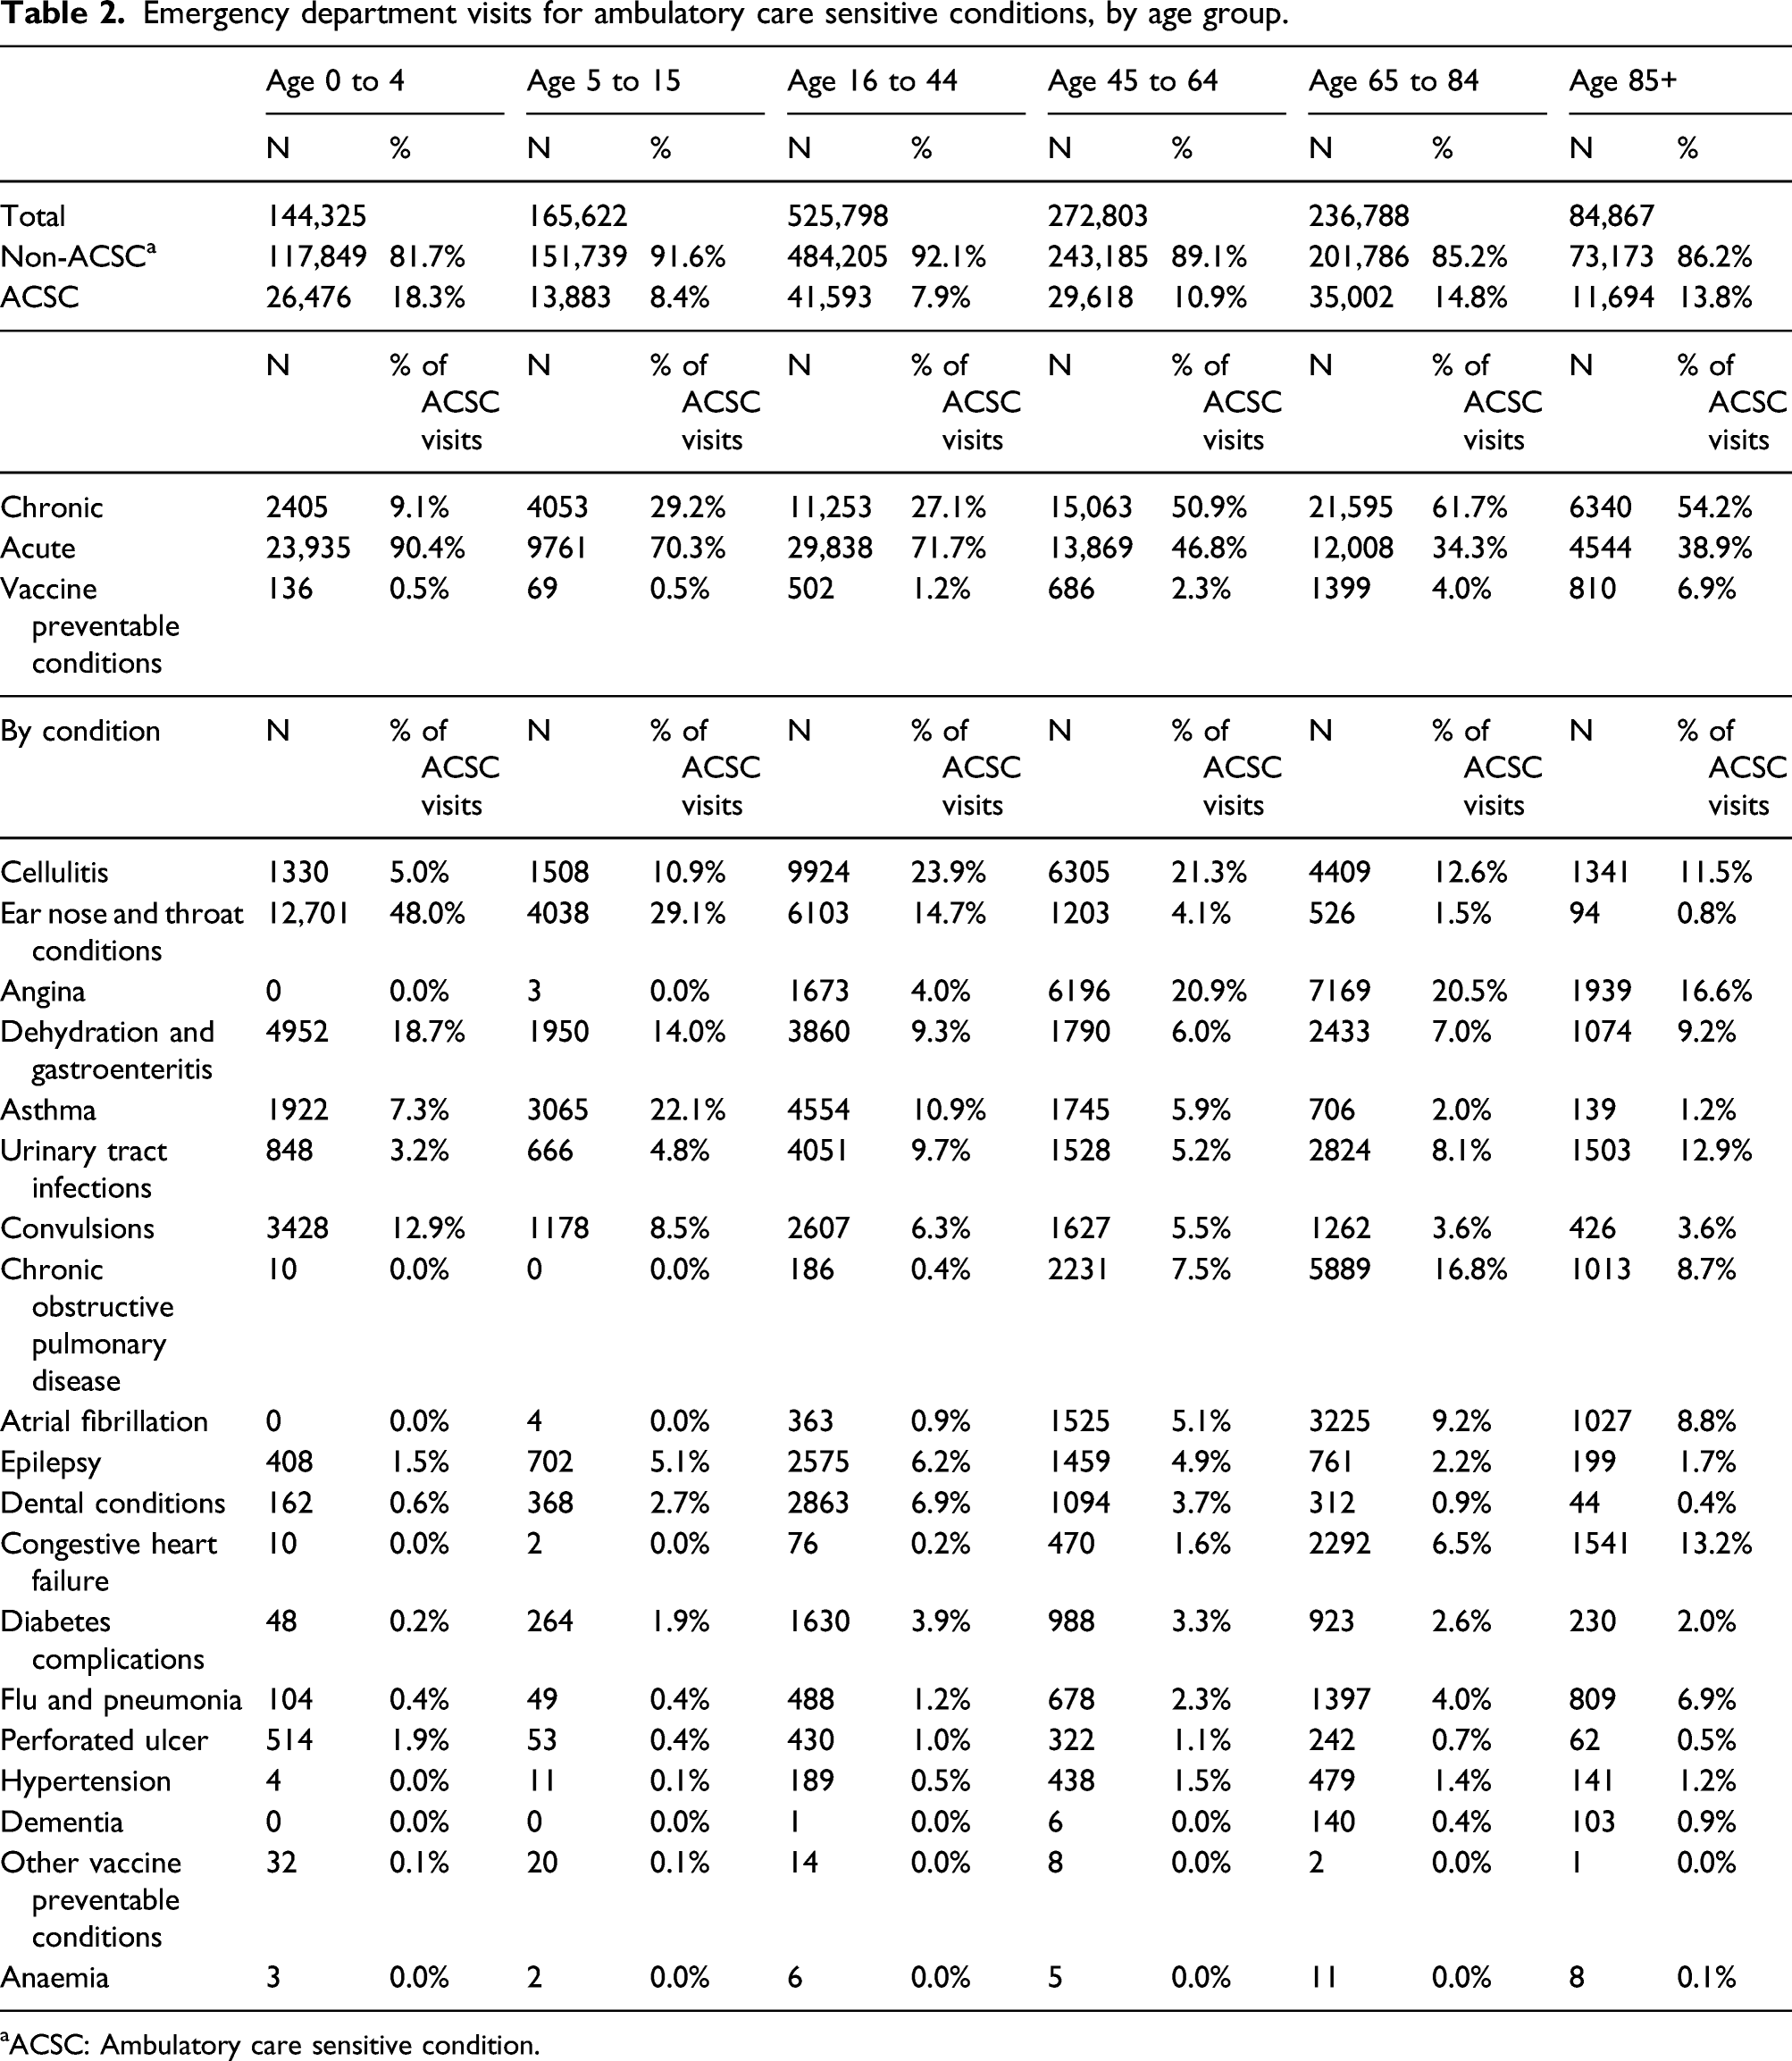
aACSC: Ambulatory care sensitive condition.
Proportion of visits for ambulatory care sensitive conditions not admitted to hospital, by condition.
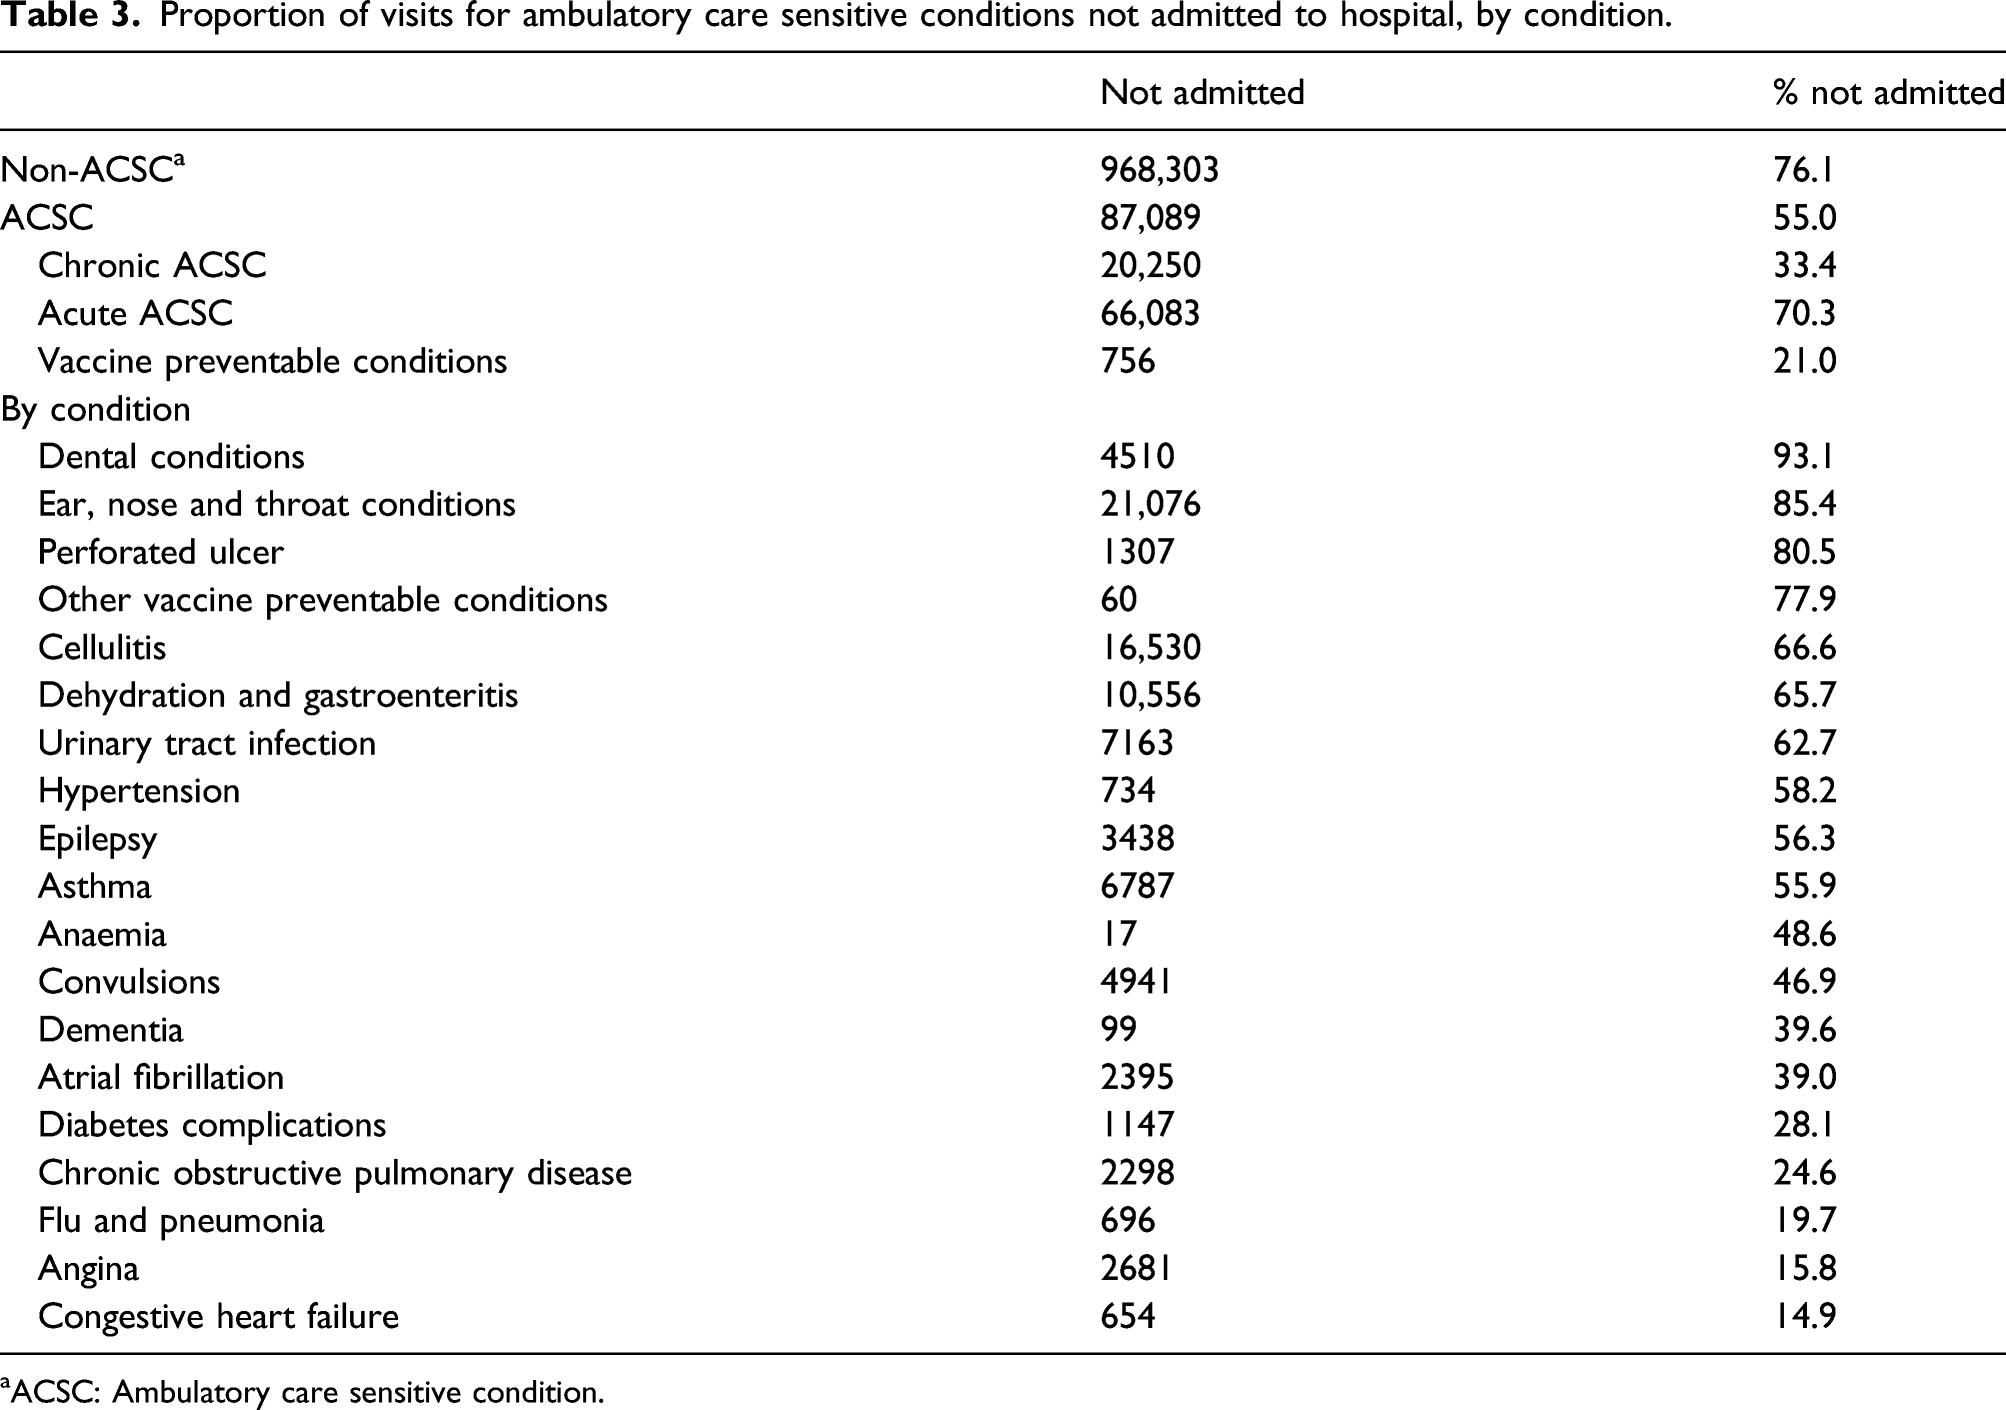
aACSC: Ambulatory care sensitive condition.
Returning to Table 3, the ACSCs for which visits most often concluded without hospital admission were dental conditions (93.1%), ear nose and throat infections (85.4%), perforated ulcer (80.5%), other vaccine preventable conditions (77.9%) and cellulitis (66.6%). Conversely, the ACSCs for which visits most often resulted in admission (the conditions that appear at the bottom of Table 3) were congestive heart failure (85.1% or 100%–14.9%), angina (84.2%), flu and pneumonia (80.3%), chronic obstructive pulmonary disease (75.4%) and diabetes (71.9%).
Proportion of attendances for an ambulatory care sensitive condition not admitted to hospital, by patient characteristics.
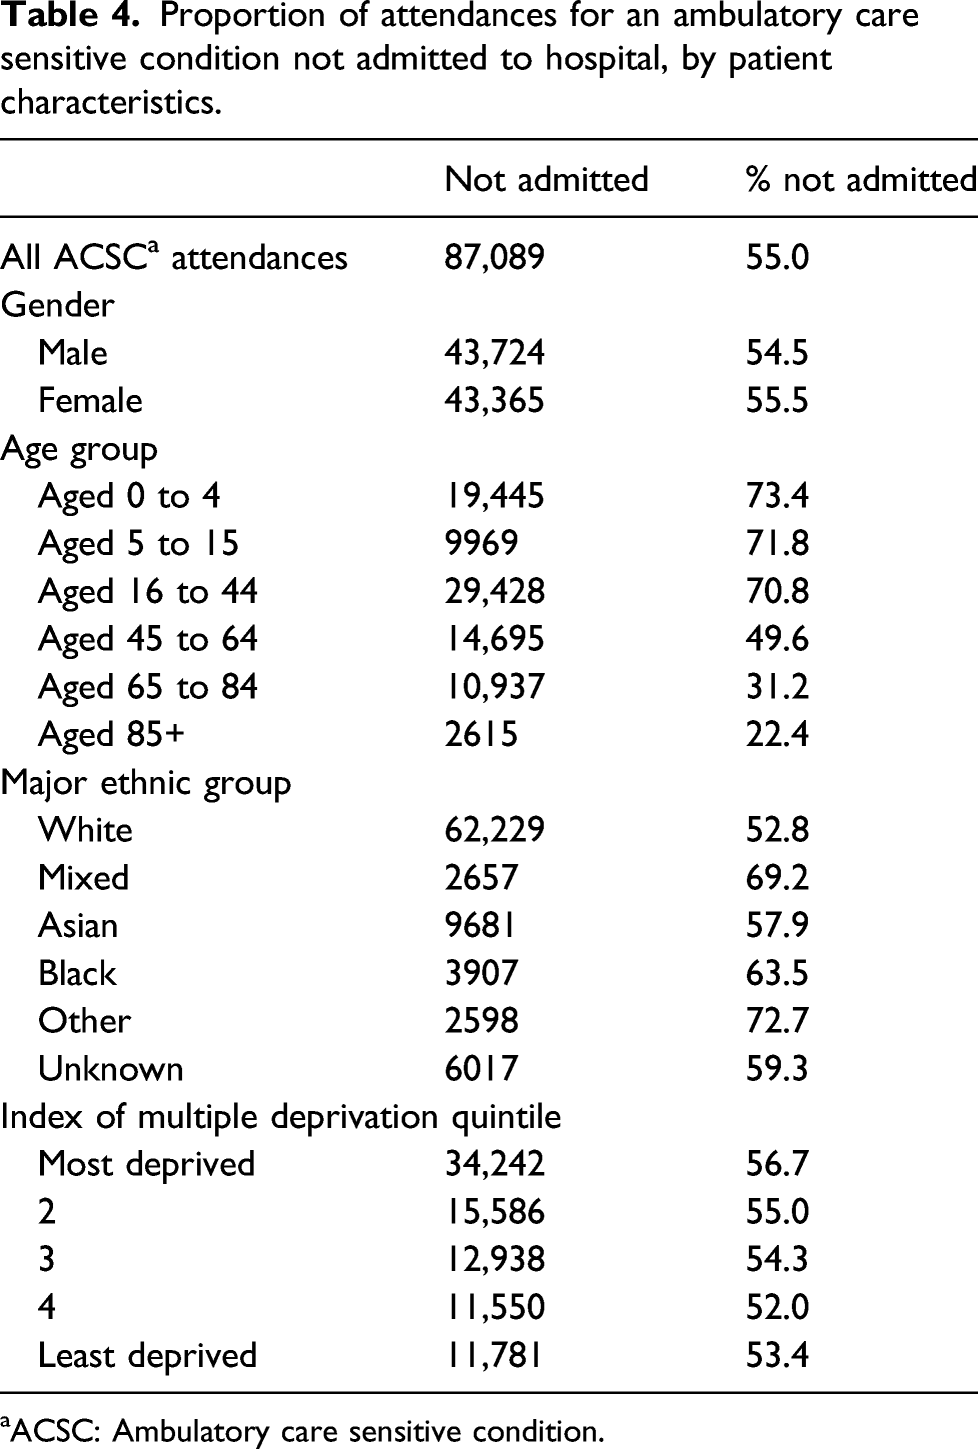
aACSC: Ambulatory care sensitive condition.
The highest proportion of ACSC visits that did not result in hospital admission were seen amongst patients of Other and Mixed ethnicity (72.7% and 69.2%, respectively). ACSC visits by Black patients concluded without admission in 63.5% of instances, and 57.9% of instances for Asian patients. White patients had the lowest proportion of ACSC visits not resulting in admission, in 52.8% of instances.
ACSC visits concluded without admission more often for patients living in the most deprived areas compared to patients living in the least deprived areas (56.7% versus 53.4%).
Discussion
Emergency admissions for ACSCs are widely used as performance indicators, to determine where quality improvements are necessary and where best to direct resources. However, focussing only on admissions fails to account for a significant element of potentially preventable emergency care use. The majority of patients seeking care in an emergency do so by first attending the ED. When we examined patients attending the ED for an ACSC, we found that 55% of these visits did not conclude with hospital admission. Focussing only on ACSC admissions, therefore, misses over half of the instances in which patients accessed emergency care for a potentially preventable reason.
We found that 11.1% of all ED visits at the six hospital Trusts we analysed were preventable. In 2016/17 there were 15.5 million visits to type 1 EDs in England. 13 If this 11.1% figure was applied to all hospital Trusts in England, this would suggest that 1.7 million potentially preventable ED visits occur annually, or approximately 31 potentially preventable visits per 1,000 population annually.
Acute conditions made up the majority of ACSC visits (60%), yet they had a much lower rate of admission to hospital than visits for chronic ACSCs. Widening the scope of current performance measures to examine ED visits, as well as admissions, would therefore reveal that a greater number of potentially preventable episodes of emergency care are the result of acute rather than chronic conditions.
The most frequent ACSCs among ED visits were cellulitis; ear, nose and throat infections; angina; dehydration and gastroenteritis; and asthma. However, the propensity to be admitted following a visit for an ACSC varies substantially between conditions, meaning that examining only emergency admissions for ACSCs provides a skewed picture of the types of conditions resulting in potentially preventable emergency care.
For example, ear, nose and throat infections were the second most frequent reason for an ACSC visit. However, 85% of these visits concluded without admission. Similarly, although dental conditions are a relatively rare presentation among ACSCs (3.1% of all presentations. see Table 1), visits for dental conditions conclude without admission to hospital in 93% of cases. Our results suggest that the focus only on admitted patients would underestimate the relative importance of such conditions in emergency care, and such conditions may warrant investigation and potential investment to improve the management of them in the community.
The propensity to be admitted following a visit for an ACSC was also found to vary substantially between patient groups. As expected, admission rates following ACSC visits were found to be higher in older patients. However, we also found the likelihood of admission following a visit for an ACSC to be highest for White patients, and lower for Black and Asian patients. The lowest proportion of ACSC visits resulting in admission to hospital was seen amongst patients of Other or Mixed ethnicity. Admission rates following visits for an ACSC were also lower amongst patients from the most deprived areas. Focussing only on admissions therefore disproportionately misses preventable episodes of emergency care experienced by young people, ethnic minority groups and more deprived populations.
Comparison with previous literature
Whilst there is a large literature examining preventable health care utilization in terms of emergency admissions for ACSCs, few studies have extended the concept of ACSCs to ED visits. The findings and conclusions from international studies are highly dependent on the health care system. Those that have examined ACSCs in the context of the ED have done so in the US, where EDs often serve the role of a safety net providers and are often the main source of primary care for uninsured individuals or those that do not have a regular doctor, 20 because services are provided regardless of insurance status or ability to pay. 21 This is very different to their role in health care systems with universal coverage such as the UK. Therefore, in the US, ACSCs ED visits are used as an indicator of suboptimal access to primary care. However, in countries with universal health care such as the UK, where access to primary care is not determined by one’s ability to pay, the interest in these conditions is as measures of the quality of care delivered. 2
Studies from the US suggest that ACSCs make up a substantial proportion of ED visits. However, prevalence estimates varied substantially by study setting. Johnson et al. found that 8.4% of ED visits by US adults were for ACSCs using survey data, 10 Chukmaitov et al. estimated that 17.6% of ED visits in all Florida hospitals were for ACSCs, 11 and Brownell et al. 12 found that 28% of ED visits by elderly nursing home patients were for ACSCs.
An important reason for the difference in prevalence across studies is the use of different sets of conditions classified as ambulatory care sensitive. Any prevalence estimates will depend on the definition of ACSCs utilized, and there is no set of ACSC which is universally applied. Frick et al. 22 examined the prevalence of ACSCs taken from various definitions amongst patients admitted to hospital from the ED, to determine the appropriateness of the conditions included in the definitions for use when analysing the ED population. They suggest the need for an ED optimised set of ACSCs, as some conditions seem particularly relevant for the population of patients attending the ED but are not included in most sets of ACSCs. In particular, they found that convulsions, urinary tract infections and atrial fibrillation are of particular relevance for the ED population but are excluded from most lists. These conditions are included in our definitions. However, Frick et al. analysed conditions amongst patients admitted from the ED, rather than all ED visits.
In England, a recent report found that ACSCs make up 23% of emergency admissions. 23 This study used the same set of indicator measures to construct their list of ACSCs as in our analysis. The report showed that influenza and pneumonia, urinary tract infection, chronic obstructive pulmonary disease, dehydration and gastroenteritis and ear nose and throat conditions were the most frequent conditions amongst emergency admissions. The young and the elderly were shown to have the highest rates of ACSCs, and a strong correlation was found between deprivation and the rate of ACSC admissions. Another recent study found that several ethnic minority groups (Bangladeshi, Pakistani, Black African, White other or other background) had higher risks of ACSC admission compared to the White British majority group. 24 Our results would suggest therefore that the disparities seen in the rate of ACSC admissions across these patient characteristics would be even more pronounced amongst ACSC visits.
Limitations
This study adds to the recent growing literature highlighting the limitations of ACSCs admissions as indicators of the performance of primary care. One of the most notable limitations of using ACSCs as such an indicator is the inability to assess the preventability of individual presentations for ACSCs. 25 One study found marked disagreement between admissions classified as preventable according to practice teams and the NHS list of ACSCs. 26 Such limitations will also likely apply to ACSC ED visits. However, in the absence of methods to assess individual preventability, rates of emergency visits or admissions for ACSCs can still provide valuable area level information on preventable demand for care following adequate risk adjustment. 27 In addition to these limitations we find that ACSC admissions also omit other important sources of preventable demand for emergency care.
Our study also has limitations. First, the experience at the six Trusts we looked at may not be generalizable to the whole country. This is the first study to estimate the prevalence of ED visits for ACSCs in England, using 2 years of patient-level data. We were able to do this by identifying six NHS hospital Trusts which utilize the ICD-10 diagnoses classification system in their ED records, therefore allowing for identification of visits for ACSCs. Although it is uncommon for diagnoses to be recorded in this way, the ICD-10 diagnosis classification is acknowledged as one of the diagnosis schemes hospitals are permitted to use in their ED records and is primarily a result of the computer software in use at the Trusts. Nonetheless, visits at these Trusts may not be representative of visits at all English hospitals. We compared characteristics of visits at these six Trusts to the rest of England and, encouragingly, we found broadly similar patterns with a slightly higher proportion of visits from patients living in the most deprived areas. However, none of the six Trusts are located in the north of England, whereas a recent report found that rates of admissions for ACSCs were higher in the north than the south of the country, after accounting for age, gender and deprivation. 23
Second, our analysis was limited to visits at type 1 major EDs, and excluded visits at type 2–4 departments, which either offer specialised services or are intended for more minor complaints. Type 1 EDs are the most resource intensive of the emergency care facilities. Preventable demands placed on these services may therefore be diverting resources away from the most severely ill patients unnecessarily. Furthermore, this study only assesses emergency care sought through EDs. The majority of patients seeking care in an emergency do so by first attending the ED 28 ; however, some emergency admissions will be admitted directly.
Third, there are limitations with ICD diagnosis codes. These codes are not used for reimbursement purposes in EDs in England therefore there is no financial incentive for accurate diagnosis record keeping. On average, ED diagnosis codes were missing in 25.3% of visits across EDs in England over the 2-year period we examine. To mitigate this issue, we limited our analysis to Trusts with levels of missing data below 12.5% for diagnosis codes. We checked the validity of the ICD-10 codes in the visit records and found that 99.93% of the codes were valid codes.
Furthermore, up to 12 diagnosis fields can be completed on the visit record, 18 but we found that 94.54% of visits at the six Trusts in our analysis had just one diagnosis field completed. For the 5% of visits that do have more than one diagnosis field completed, we used the first diagnosis field (‘diag_01’) to classify a visit as ACSC, assuming that the first diagnosis is the primary reason for the visit. We examined the sensitivity of our results to this assumption, and found it made a negligible difference.
Moreover, not all patients attending an ED will receive a clear diagnosis during their visit. Patients attend with symptoms that will be investigated and treated, but a full diagnosis may not be formed whilst the patient is in the ED. Diagnosis fields in these cases may therefore represent presenting symptoms or the chief complaint of the patient. This is in comparison to admitted care, where diagnosis is made on the conclusion of the stay, when the clinical team have had more time to examine the underlying cause of a patient’s illness. Approximately, 18% of visits have a diagnosis recorded as an R chapter ICD code, which refer to symptoms, signs and abnormal clinical or laboratory findings, rather than a conclusive diagnosis. Therefore, our figures are likely to underestimate the true size of potentially preventable visits. Future research is needed to assess the extent of the problem posed by the reliance on ED diagnostic coding, by cross-referencing ED diagnostic coding with admitted care diagnosis using linked ED and admission records.
Conclusions
Better management of patients with ACSCs has been a significant focus for health systems for many years, and admissions for ACSCs is a metric by which many organizations are monitored and compared internationally. Our results suggest that admissions for ACSCs do not provide the full picture when aiming to improve outcomes for patients. Whilst the cost consequences for the NHS of an ED visit are substantially lower than for an admission (average costs £148 vs £1590 in 2016/17), 29 ED visits are experienced by a greater number of patients than hospital admission. Many ED visits do not result in admission to hospital, and these lower severity visits may be more sensitive to the quality and availability of services in the community. If we are concerned with preventing avoidable hospital use, then it is crucial to consider the potential to prevent ED visits in addition to admissions. Following on from this identification and descriptive analysis of ACSC ED visits, future research should focus on assessing the mechanisms that drive potentially preventable demand for emergency care, in order to inform policy.
To facilitate the development of a national performance indicator for ACSC visits, the recording of diagnoses in EDs would need to be standardised across all hospitals in the country, using more detailed diagnoses such as the ICD-10 classification system. A new emergency care data set has been introduced in England from October 2017, 30 that requires the recording of ‘SNOMED’ diagnoses classifications, which are an even more granular and detailed classification system than the ICD. 31 The identification of ED visits for ACSCs will therefore be possible on a national scale in the future. The calculation of such a measure would provide policy makers with a fuller picture of preventable emergency care, who experiences it, and for what illnesses. Our results suggest that it would likely highlight not only additional potentially preventable utilization, but different patterns of potentially preventable care – in terms of clinical conditions and patient groups – than those shown by existing measures based only on admissions. This could, in turn, identify new priority areas where emergency care use could potentially be prevented.
Supplemental Material
sj-pdf-1-hsr-10.1177_13558196211059128 - Supplemental material for Unseen patterns of preventable emergency care: Emergency department visits for ambulatory care sensitive conditions
Supplemental material, sj-pdf-1-hsr-10.1177_13558196211059128 for Unseen patterns of preventable emergency care: Emergency department visits for ambulatory care sensitive conditions by Beth Parkinson, Rachel Meacock, Katherine Checkland and Matt Sutton in Journal of Health Services Research & Policy
Supplemental Material
sj-pdf-2-hsr-10.1177_13558196211059128 - Supplemental material for Unseen patterns of preventable emergency care: Emergency department visits for ambulatory care sensitive conditions
Supplemental material, sj-pdf-2-hsr-10.1177_13558196211059128 for Unseen patterns of preventable emergency care: Emergency department visits for ambulatory care sensitive conditions by Beth Parkinson, Rachel Meacock, Katherine Checkland and Matt Sutton in Journal of Health Services Research & Policy
Supplemental Material
sj-pdf-3-hsr-10.1177_13558196211059128 - Supplemental material for Unseen patterns of preventable emergency care: Emergency department visits for ambulatory care sensitive conditions
Supplemental material, sj-pdf-3-hsr-10.1177_13558196211059128 for Unseen patterns of preventable emergency care: Emergency department visits for ambulatory care sensitive conditions by Beth Parkinson, Rachel Meacock, Katherine Checkland and Matt Sutton in Journal of Health Services Research & Policy
Supplemental Material
sj-pdf-4-hsr-10.1177_13558196211059128 - Supplemental material for Unseen patterns of preventable emergency care: Emergency department visits for ambulatory care sensitive conditions
Supplemental material, sj-pdf-4-hsr-10.1177_13558196211059128 for Unseen patterns of preventable emergency care: Emergency department visits for ambulatory care sensitive conditions by Beth Parkinson, Rachel Meacock, Katherine Checkland and Matt Sutton in Journal of Health Services Research & Policy
Supplemental Material
sj-pdf-5-hsr-10.1177_13558196211059128 - Supplemental material for Unseen patterns of preventable emergency care: Emergency department visits for ambulatory care sensitive conditions
Supplemental material, sj-pdf-5-hsr-10.1177_13558196211059128 for Unseen patterns of preventable emergency care: Emergency department visits for ambulatory care sensitive conditions by Beth Parkinson, Rachel Meacock, Katherine Checkland and Matt Sutton in Journal of Health Services Research & Policy
Supplemental Material
sj-pdf-6-hsr-10.1177_13558196211059128 - Supplemental material for Unseen patterns of preventable emergency care: Emergency department visits for ambulatory care sensitive conditions
Supplemental material, sj-pdf-6-hsr-10.1177_13558196211059128 for Unseen patterns of preventable emergency care: Emergency department visits for ambulatory care sensitive conditions by Beth Parkinson, Rachel Meacock, Katherine Checkland and Matt Sutton in Journal of Health Services Research & Policy
Footnotes
Declaration of conflicting interests
The author(s) declared no potential conflicts of interest with respect to the research, authorship, and/or publication of this article.
Funding
The authors disclosed receipt of the following financial support for the research, authorship, and/or publication of this article: BP is funded by a Wellcome Trust doctoral studentship, grant reference: 208183/Z/17/Z. The Wellcome trust had no involvement in the design of the study, analysis and interpretation of data and or writing the manuscript. MS is a NIHR Senior Investigator. The views expressed are those of the authors and not necessarily those of the NIHR or the Department of Health and Social Care.
Ethics approval
Ethics approval was not required for this research article.
Supplemental Material
Supplemental material for this article is available online.
References
Supplementary Material
Please find the following supplemental material available below.
For Open Access articles published under a Creative Commons License, all supplemental material carries the same license as the article it is associated with.
For non-Open Access articles published, all supplemental material carries a non-exclusive license, and permission requests for re-use of supplemental material or any part of supplemental material shall be sent directly to the copyright owner as specified in the copyright notice associated with the article.