
Abstract
Objective
Younger people, minority ethnic groups, sexual minorities and people of lower socioeconomic status report poorer experiences of primary care. In light of NHS ambitions to reduce unwarranted variations in care, we aimed to investigate whether inequalities in patient experience of primary care changed between 2011 and 2017, using data from the General Practice Patient Survey in England.
Methods
We considered inequalities in relation to age, sex, deprivation, ethnicity, sexual orientation and geographical region across five dimensions of patient experience: overall experience, doctor communication, nurse communication, access and continuity of care. We used linear regression to explore whether the magnitude of inequalities changed between 2011 and 2017, using mixed models to assess changes within practices and models without accounting for practice to assess national trends.
Results
We included 5,241,408 responses over 11 survey waves from 2011–2017. There was evidence that inequalities changed over time (p < 0.05 for 27/30 models), but the direction and magnitude of changes varied. Changes in gaps in experience ranged from a 1.6 percentage point increase for experience of access among sexual minorities, to a 5.6 percentage point decrease for continuity, where experience worsened for older ages. Inequalities in access in relation to socio-economic status remained reasonably stable for individuals attending the same GP practice; nationally inequalities in access increased 2.1 percentage points (p < 0.0001) between respondents living in more/less deprived areas, suggesting access is declining fastest in practices in more deprived areas.
Conclusions
There have been few substantial changes in inequalities in patient experience of primary care between 2011 and 2017.
Introduction
In the United Kingdom’s (UK’s) National Health Service (NHS), patient experience is a fundamental component of the quality of health care, alongside clinical effectiveness and patient safety. 1 The NHS continuously seeks to reduce variations in the quality of health care and variations in patient experience are a current policy concern. 2 , 3 Many of the recent proposals for improvements in primary care services throughout the UK, set out in the NHS Long Term Plan, are driven by the goal of improving patients’ experiences of care. 4
Despite these priorities, headline figures highlight that patient experiences of primary care are worsening, particularly in terms of access to and continuity of care. 5 Public satisfaction with the NHS is declining and is at its lowest level since 2007. 6 Set alongside this, there are well documented variations in patient experiences of primary care in relation to sociodemographic characteristics. Analyses show that younger patients, 7 minority ethnic groups, 7 , 8 sexual minority women and men, 9 patients living in more deprived areas, 7 , 10 , 11 and those living in London 11 report less positive experiences of primary care. However, there is limited evidence on longitudinal trends in inequalities in patient experience of primary care. 12
High quality evidence is essential to map the impact of statutory and policy initiatives to reduce inequalities – and in the UK, there are many such initiatives. In 2010, the Equalities Act introduced a statutory duty on public bodies to monitor and address inequalities, including by age, sex, ethnicity and sexual orientation. 13 The Health and Social Care Act of 2012 set out a duty for health care commissioners and providers, including NHS England and local Clinical Commissioning Groups, to reduce inequalities in both access to and outcomes of care, especially those experienced by people living in the most deprived areas. 2
Within primary care, one major source of evidence of care quality is the General Practice Patient Survey (GPPS), commissioned by NHS England to record and monitor patient experiences of primary care. The survey was first administered in 2007 and is now in its thirteenth year. Each year it is sent to around 2 million patients registered with a general practice in England and includes questions investigating patient experiences in accessing services, making appointments, waiting times and interpersonal care delivered by primary care professionals. 14 The results are published in a variety of formats and are available for public review (www.gp-patient.co.uk).
In light of the continued policy focus on improving patient experience of primary care and persistent concerns about inequalities in care, we sought to trace variations in primary care experience over recent years. The aim of this study was to investigate whether inequalities in reported patient experience of primary care in relation to age, sex, deprivation, ethnicity, sexual orientation and geographical region had widened, narrowed, or remained the same between 2011 and 2017.
Methods
We used GPPS data from 2011 to 2017. During this period the survey was conducted twice per year from 2011 to 2016 and once in 2017, resulting in 11 waves of the survey available for analysis. Questionnaires are sent to a random sample of adult patients over 18 years of age who have been continuously registered with a general practice for at least 6 months, with sampling stratified by GP practice, age and sex. 19 , 20 Smaller practices and practices that have had lower response rates in prior years are over-sampled. Additional details regarding the questionnaire design, sampling and data collection are published elsewhere. 14
We explored whether inequalities by age, sex, deprivation, ethnicity, sexual orientation, geographical region and, in a supplementary analysis, multimorbidity, had changed over time across five dimensions of patient experience in primary care: overall experience, doctor communication, nurse communication, access to care (measured as ability to get through to a practice by phone – telephone access - and, in a supplementary analysis, overall experience of access) and continuity of care. The selection of these dimensions responds to past research that has demonstrated the importance of a small number of factors driving patient experiences of primary care, namely access, continuity of care and interpersonal skills. 15 Full question wording, which was consistent across the study period and details of these measures, are presented in online Supplement Table S1 and Table S2. Non-evaluative response categories were excluded. For doctor and nurse communication measures, a composite score was calculated for respondents who completed at least three of the five sub-items. 7 For the measure of continuity, responses were included only from people who reported in a previous question that they had a preference to see or speak to a particular doctor. We rescaled all patient experience outcomes from the measured ordered Likert scales to linear measures on a 0 (most negative) to 100 (most positive) scale, to allow differences in experience to be interpreted as percentage point changes.
In our first analysis we described the characteristics of the survey respondents and, in our second analysis, overall average patient experience from both the most recent and the earliest survey years, using the cross-sectional survey weights to give nationally representative estimates of the population and experience measures at these time points. Briefly, these survey weights include three dimensions: a design weight to account for the unequal chance that someone is sent a survey, a non-response weight to account for differences between responders and non-responders and a weight to calibrate respondents to the population of eligible patients. Because of seasonal variation in experience (reported patient experience is slightly poorer in the winter compared with the summer) and in line with guidance from NHS England, we used data from the January-March sampling period only for these weighted/unadjusted estimates.
Using the whole data set, we then used linear regression to explore, in turn, whether the magnitude of inequalities in patient experience by age, sex, deprivation, ethnicity, deprivation, region and sexual orientation across the five patient experience outcomes changed between 2011 and 2017. To formally assess whether inequalities were changing over time we used a separate regression model for each characteristic.
All models were adjusted for sex, age, ethnicity, deprivation, geography and survey wave. We additionally included survey wave as a categorical variable to account for seasonality effects in patient experience; results are presented only for January-March each year although all waves were included in our analyses.
This modelling approach means that analyses were only carried out among survey respondents with complete data for these six covariates (5,241,408 out of 5,415,560 total responses over the 11 survey waves, full details in online Supplement Table S3). We included sexual orientation and long-term health conditions only in models specifically considering these inequalities due to the higher amount of missing data. We then excluded respondents with missing data for each outcome on a model by model basis.
In each adjusted regression model, we included an interaction term between the sociodemographic characteristic of interest and survey wave. From these model outputs we estimated the change in the size of the inequalities on the 0–100 scale, from 2012–2017 between groups with the most and least positive experience for each socio-demographic characteristic and additionally estimated the adjusted patient experience score for each group over time to allow absolute estimates of the differences in experience.
Inequalities in patient experience might be driven by two reasons; some population groups may be more likely to live in areas which are served by more poorly performing GP practices or, alternatively, some patients within the same practice may receive worse care than other patients. We used regression models with no adjustment for practice to quantify overall inequalities including contributions from both within and between practice differences in experience. We also used mixed-effects models with a random effect for practice to ascertain whether any changes in inequalities over time were occurring within an individual practice (i.e. for patients attending the same practice). Comparison of these two models gives insight into the contribution of between-practice differences to the overall differences. The mixed-effects models additionally included a random slope for survey wave to account for the variation between and potential heterogeneity of changes over time in patient experience across practices. 7 , 16
All analyses were carried out on a secure analysis server at the University of Cambridge using Stata 15.0, with the runmlwin add-in for mixed models (using MLWIN 3.02). Data were provided to the research team under a data sharing agreement with NHS England.
Results
A total of 5,241,408 responses over 11 survey waves from 2011–2017 were included in the analysis. The overall response rate was 36.0% (a breakdown of responses and response rates by survey wave is provided in online Supplement Table S3).
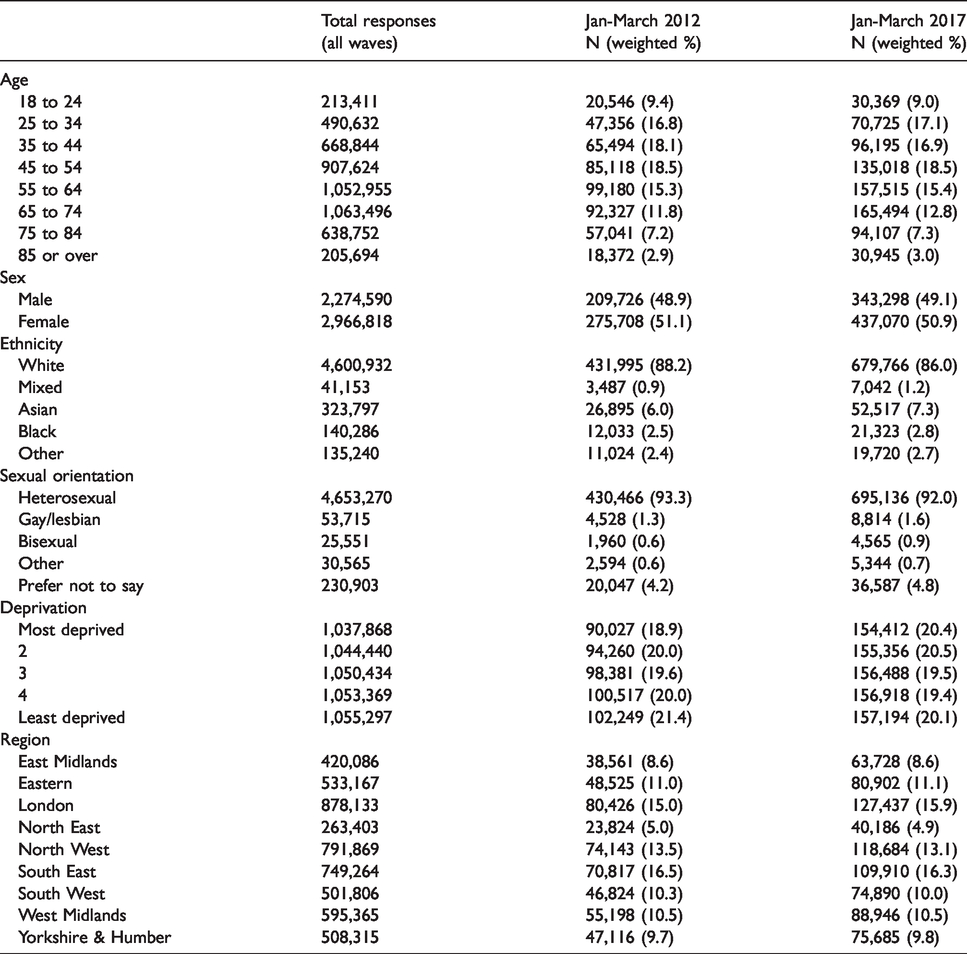
Table 1 presents the characteristics of survey responders by age, sex, deprivation, ethnicity, deprivation, region and sexual orientation in 2012 and 2017. Because the survey weights have been applied (and there is near universal registration with primary care in England) these estimates can be interpreted as nationally representative and changes between 2012 and 2017 represent demographic changes in the population of England. There is a small (0.1 to 0.2 percentage point) shift towards older age groups consistent with the aging population, and 2.2 percentage point increase in the number of respondents from ethnic minority groups.
Characteristics of survey respondents, 2012 and 2017.
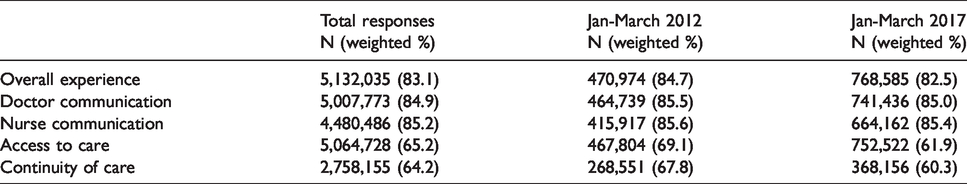
As noted in Table 2, in both 2012 and 2017 ratings of overall experience (82.5 in 2017 on a scale calibrated from 0 (the worst possible) to 100 (the best possible)), doctor communication (85.0) and nurse communication (85.4) were higher than ratings of access to care and continuity of care. Nationally, from 2012 to 2017, patient experiences of access to care decreased by 7.2 percentage points, whilst continuity of care decreased by 7.5 percentage points. There were smaller (0.2 to 2.3 percentage point) drops in ratings of overall experience, doctor communication and nurse communication over the same period.
Numbers of included responses and weighted national patient experience in England, 2012 and 2017.
For the multivariable analysis, we first present the results from the models with random effect for practice, which estimate the inequalities in reported experience between patients attending the same general practice. Across all patient experience dimensions, variation between groups was largest in relation to age and smallest in relation to sex and deprivation, with intermediate variation in relation to ethnicity, sexual orientation and region (Figures 1 and 2 and online Supplement Figures S1-S4). Within practices, there was evidence (p < 0.05) that inequalities in relation to age, sex, ethnicity, sexual orientation, deprivation and region changed between 2011 and 2017 for all experience dimensions, with four exceptions: overall experience and doctor communication in relation to sex, doctor communication in relation to sexual orientation and nurse communication in relation to region (Table 3). For continuity of care, differences between the most and least positive age groups reduced by 5.6 points, reflecting overall larger decreases in reported experiences of continuity of care in older age groups (Figure 2). The magnitude of other changes between the most and least positive groups for each sociodemographic measure were small ranging from a 1.6 percentage point increase (for experience of access among sexual minorities) to a 2.3 percentage point decrease (for continuity, where experience worsened for ethnicity). This is reflected in the ‘parallel lines’ for the experiences between groups over time seen in Figure 1 (overall experience of care) and online Supplement Figures S1-S4 (other measures); the fact that they neither get further apart nor closer together suggest that inequalities across all measures remained constant.
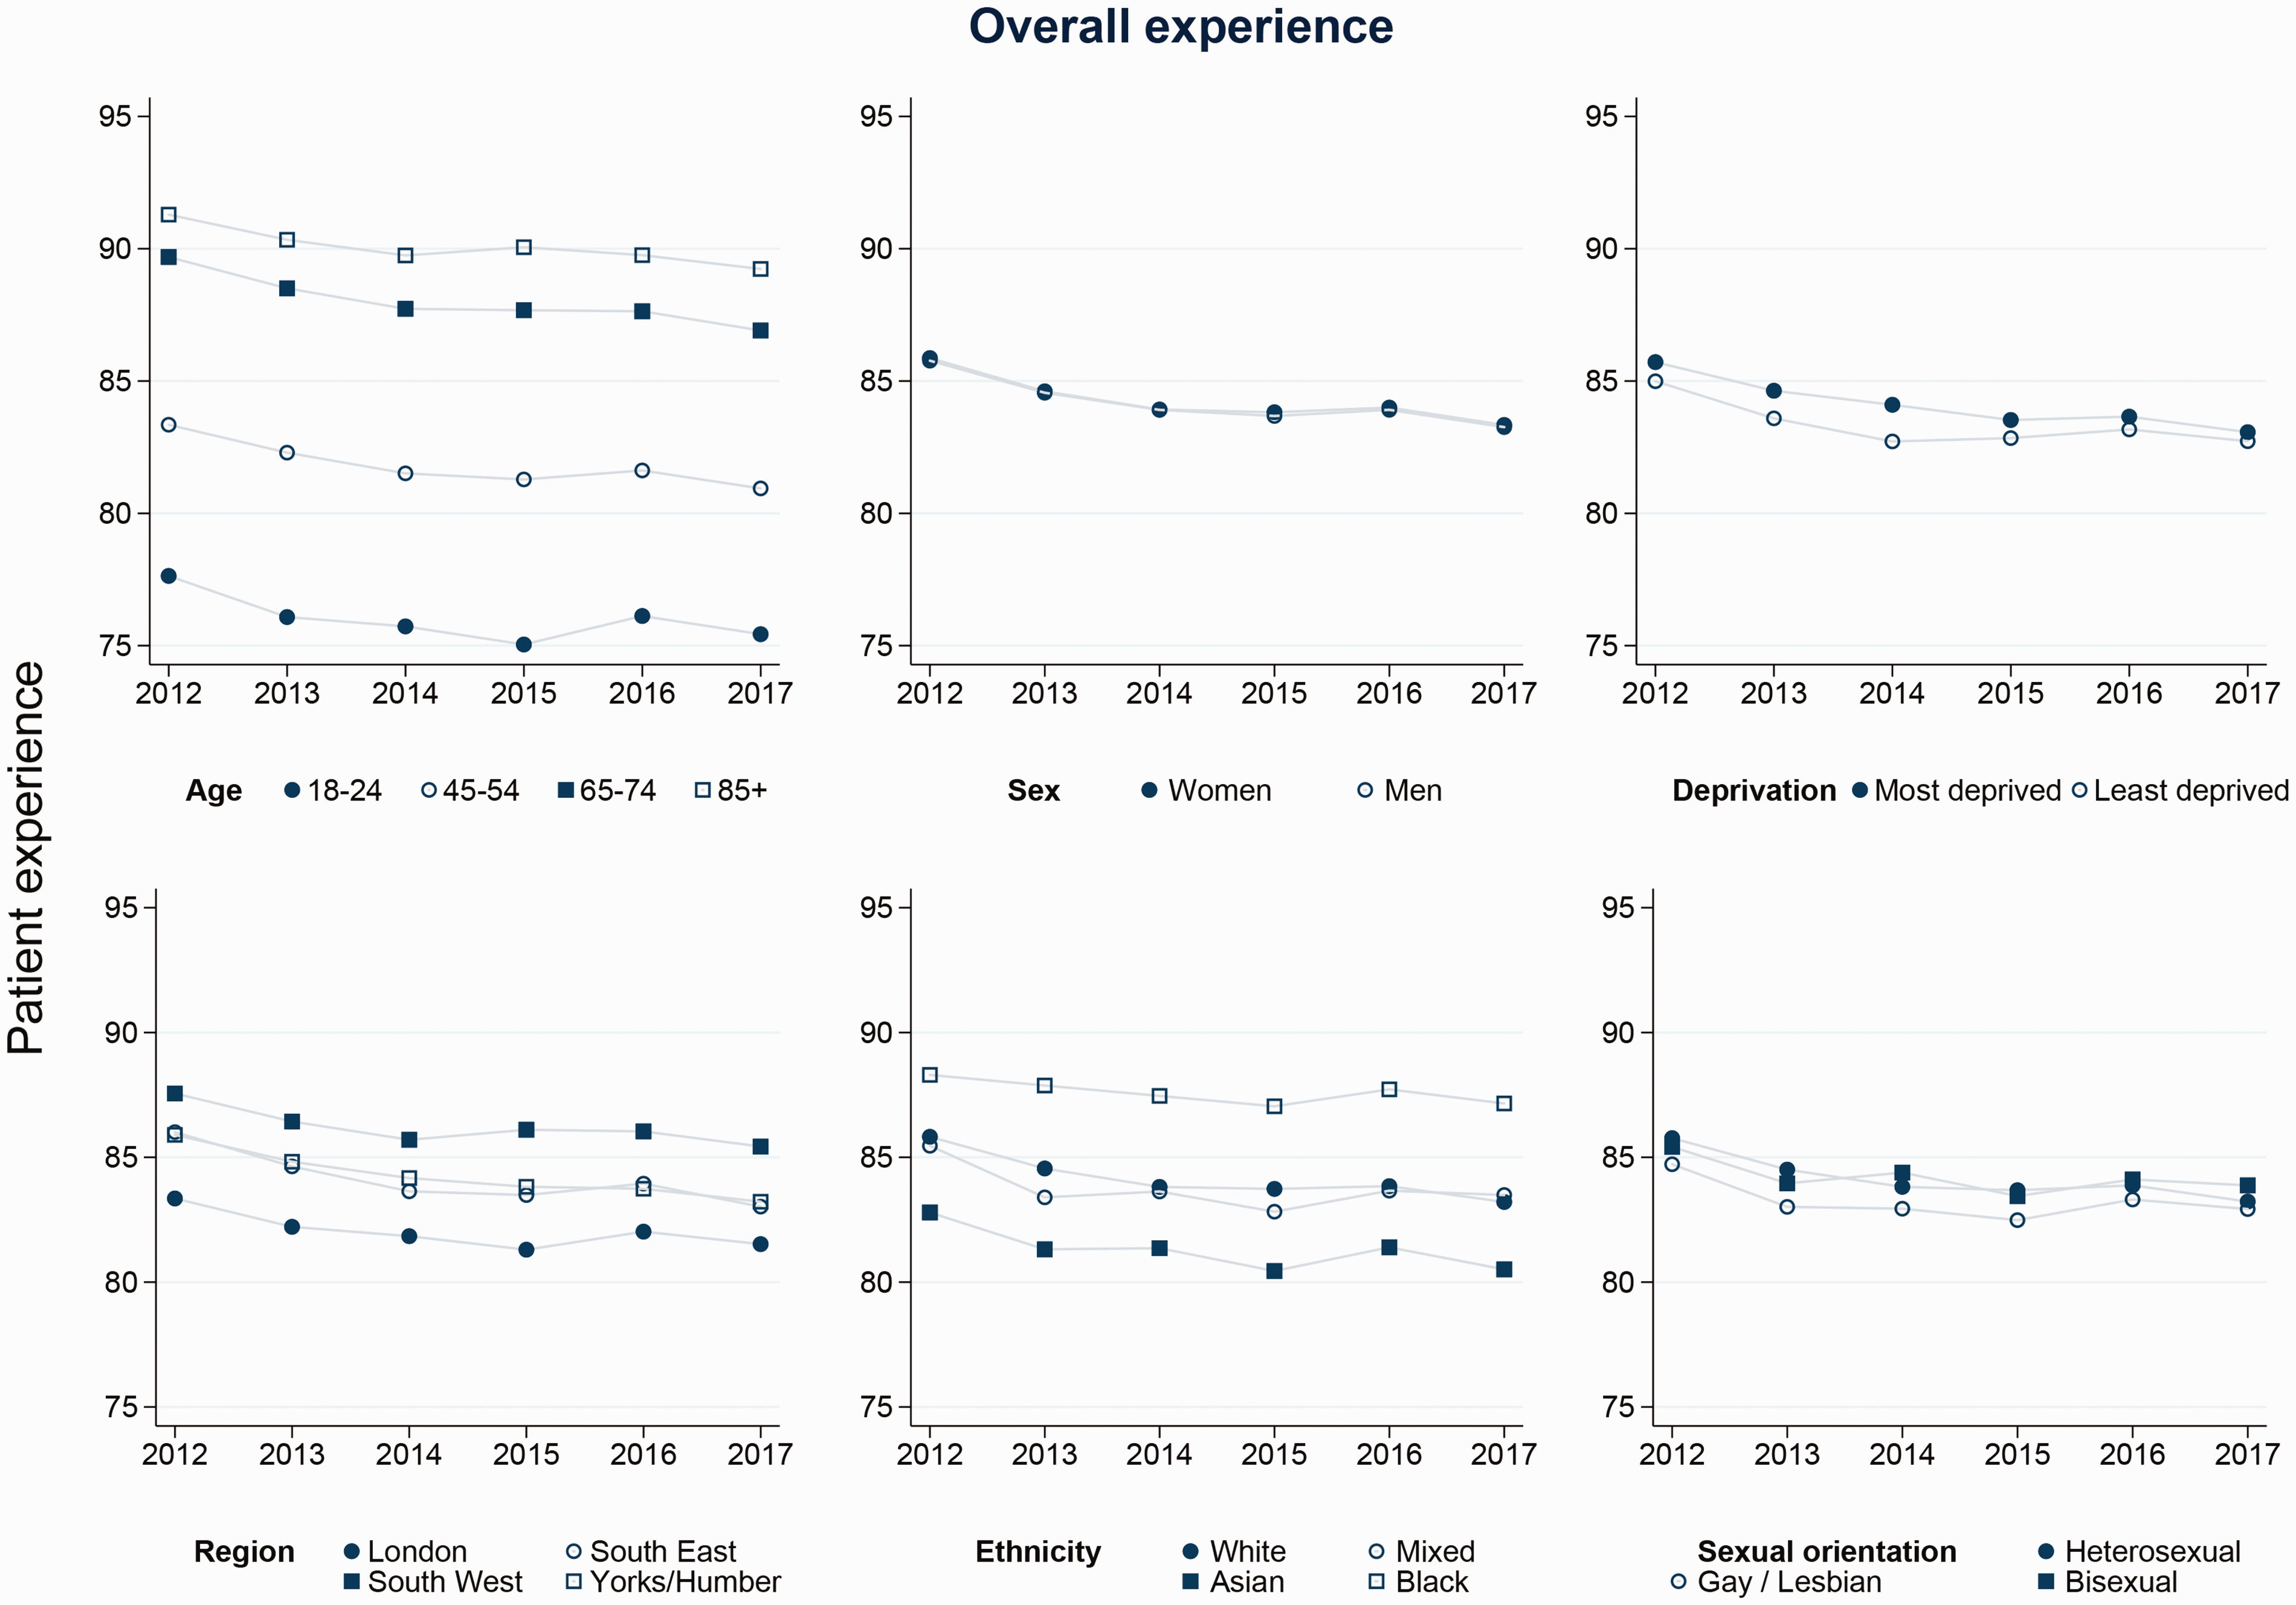
Trends in inequalities in overall patient experience.
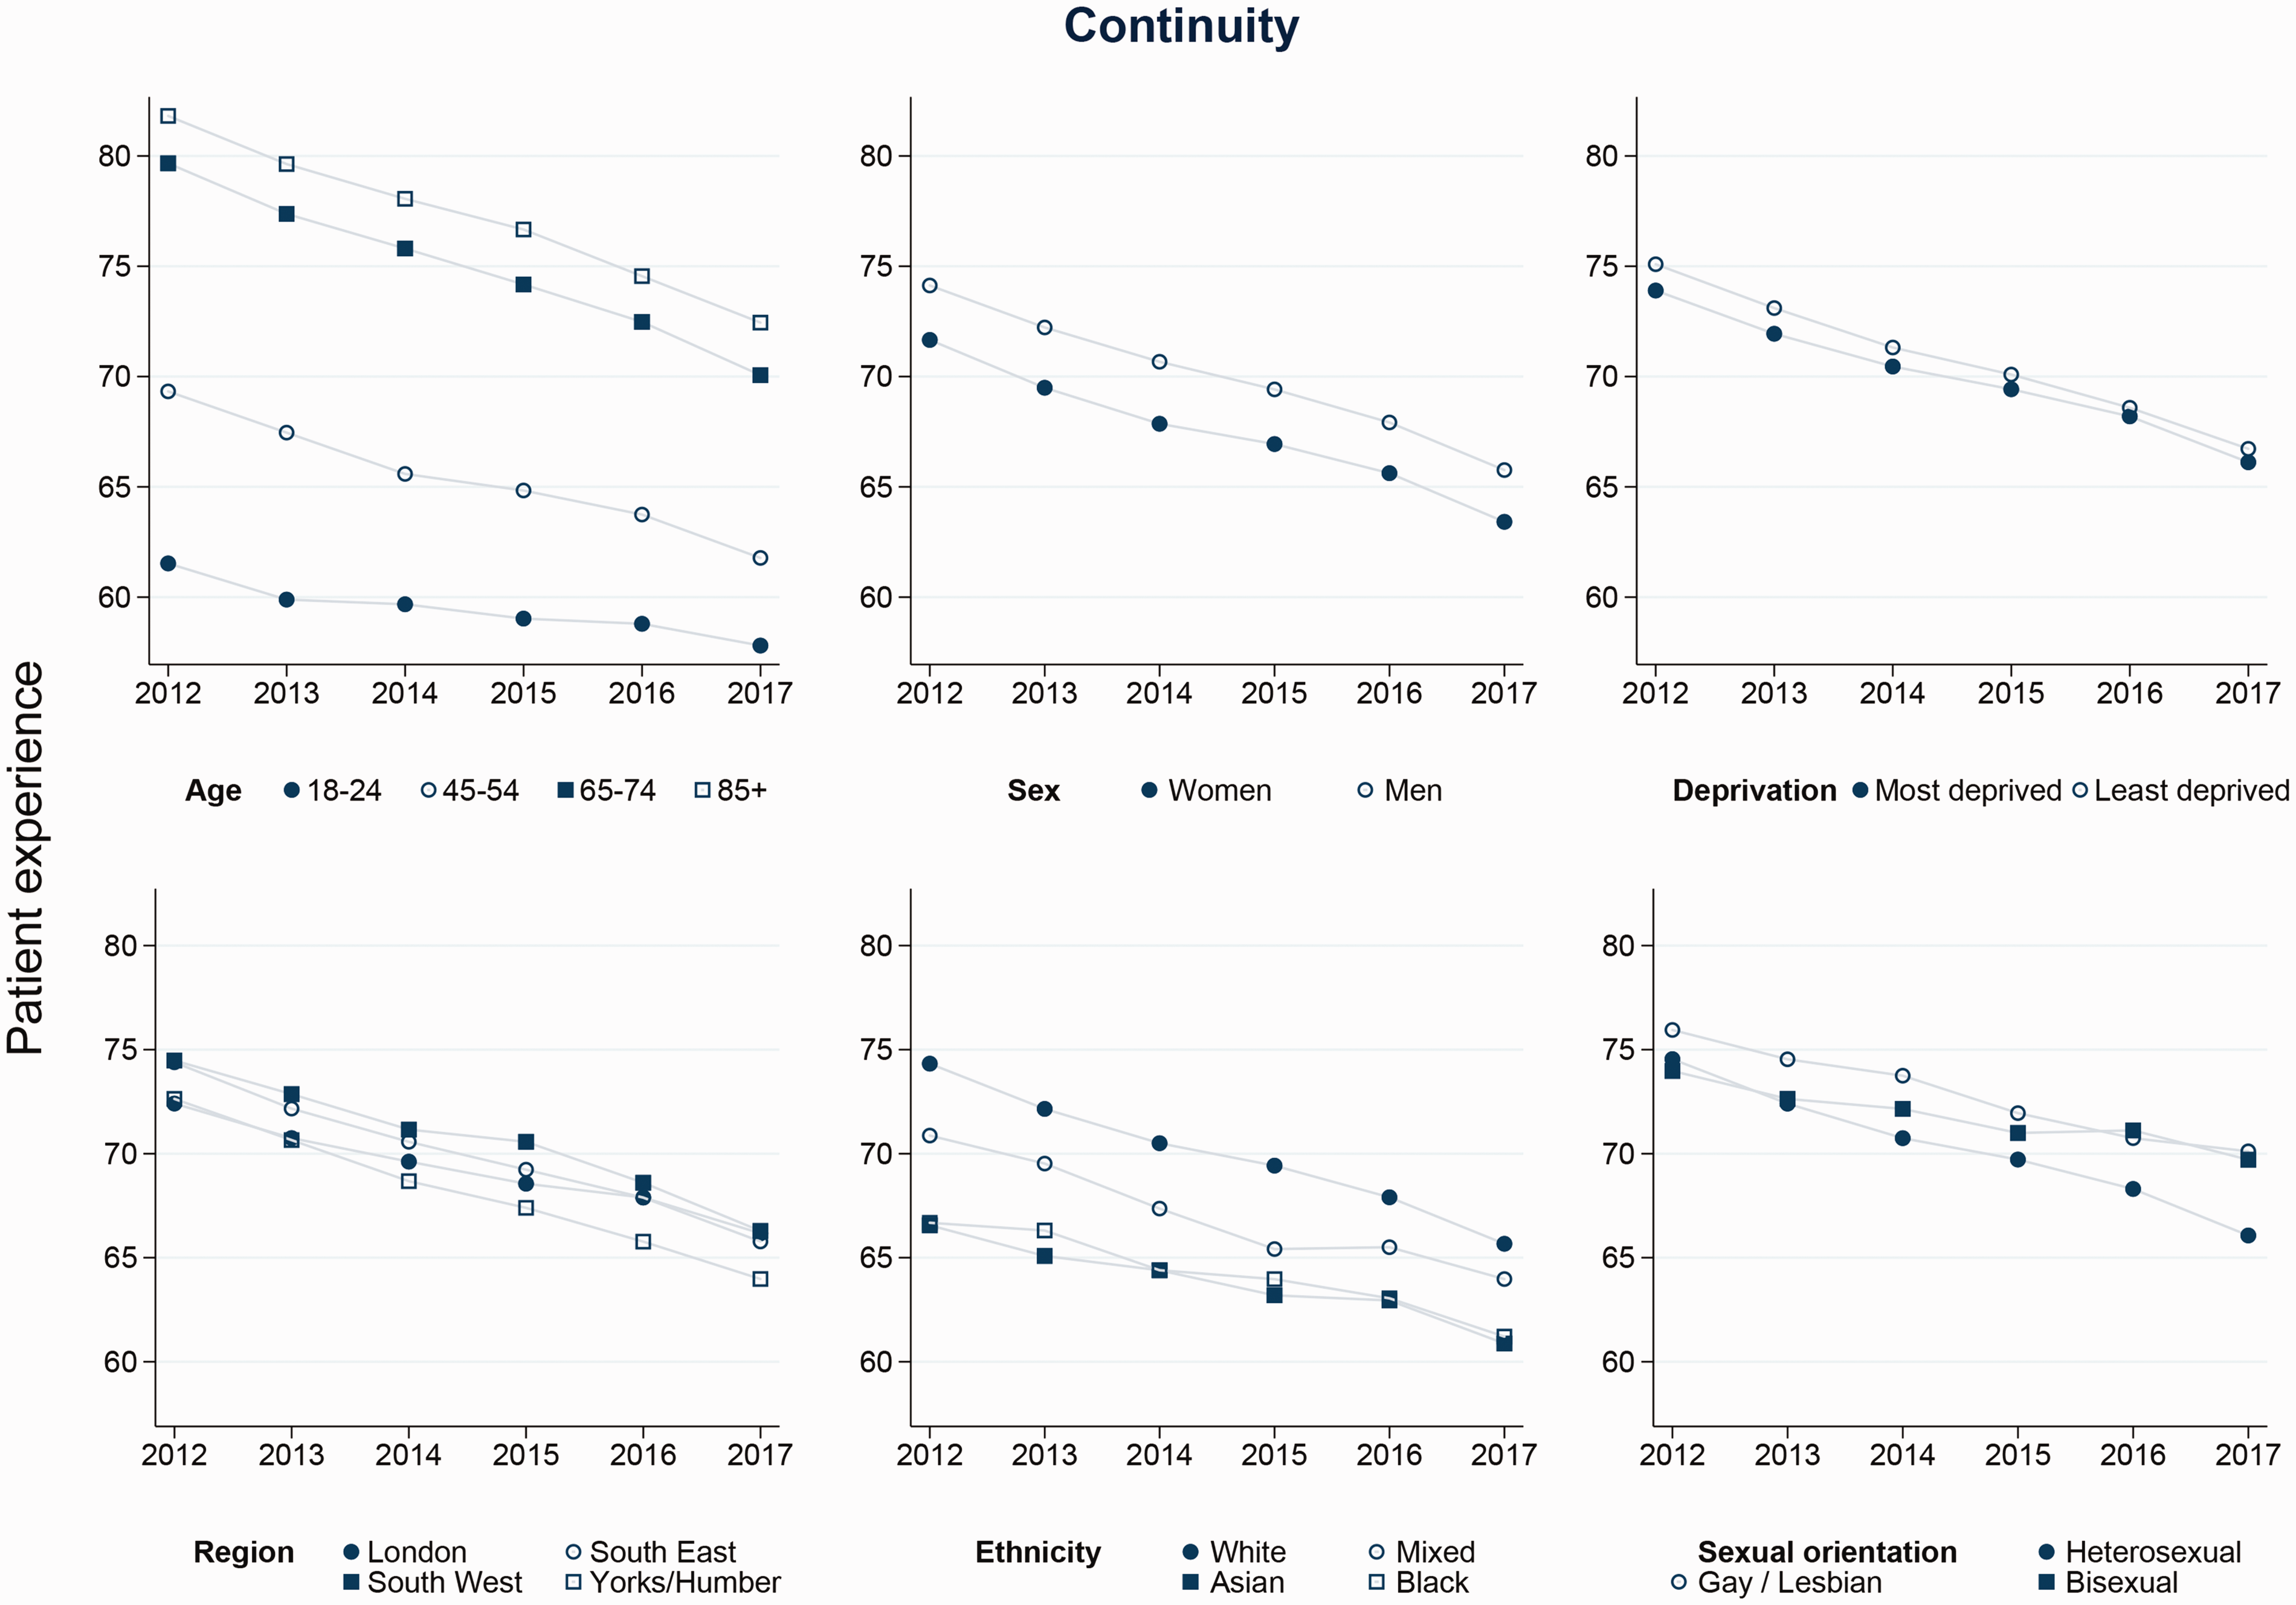
Trends in inequalities in continuity.
Changes in inequalities in patient experience, 2012–2017.
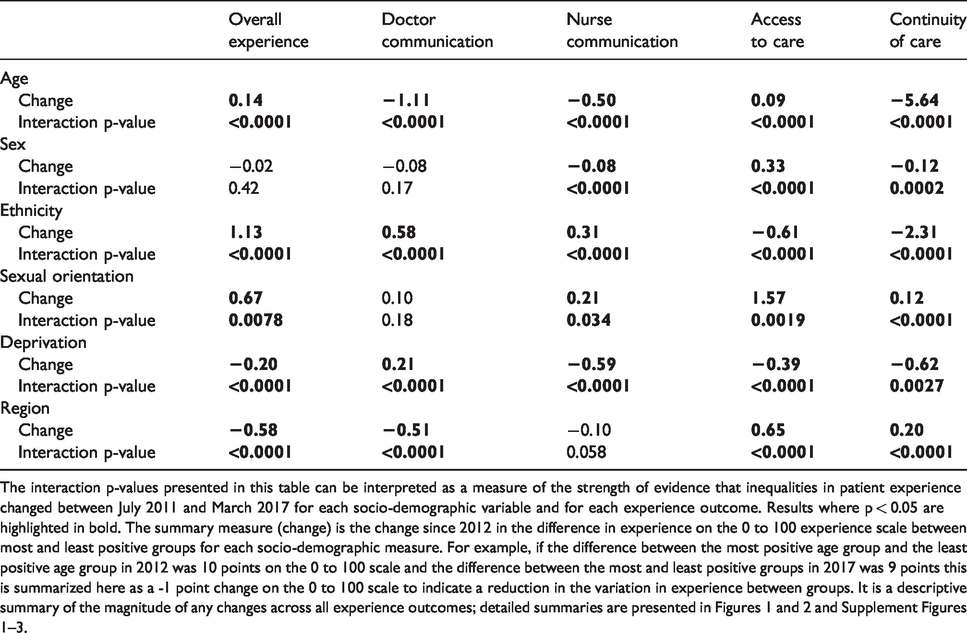
The interaction p-values presented in this table can be interpreted as a measure of the strength of evidence that inequalities in patient experience changed between July 2011 and March 2017 for each socio-demographic variable and for each experience outcome. Results where p < 0.05 are highlighted in bold. The summary measure (change) is the change since 2012 in the difference in experience on the 0 to 100 experience scale between most and least positive groups for each socio-demographic measure. For example, if the difference between the most positive age group and the least positive age group in 2012 was 10 points on the 0 to 100 scale and the difference between the most and least positive groups in 2017 was 9 points this is summarized here as a -1 point change on the 0 to 100 scale to indicate a reduction in the variation in experience between groups. It is a descriptive summary of the magnitude of any changes across all experience outcomes; detailed summaries are presented in Figures 1 and 2 and Supplement Figures 1 –3.
We see similar patterns in results from the fixed-effects regression models (i.e. models without a random effect for practice), which describe national changes in inequalities that may be occurring due to changes within practices, or changes occurring between different practices across the country. Inequalities between patient groups across experience dimensions were consistent with the within-practice results and typically did not improve at a national level (online Supplement Table S4), with one important difference: experiences of access to care declined faster among respondents living in more deprived areas, by 2.1 percentage points. As Figure 3 shows, for both the primary measure of access considered in this study (telephone access) and also the supplementary measure (overall experience of making an appointment) socio-economic inequalities in access were not seen at the start of the study period (2012) – patient experience scores for people living in the most and least deprived areas were very similar. Differences between most and least deprived areas started to appear from 2015 as the lines diverge, a pattern that is seen nationally, but not within practices.
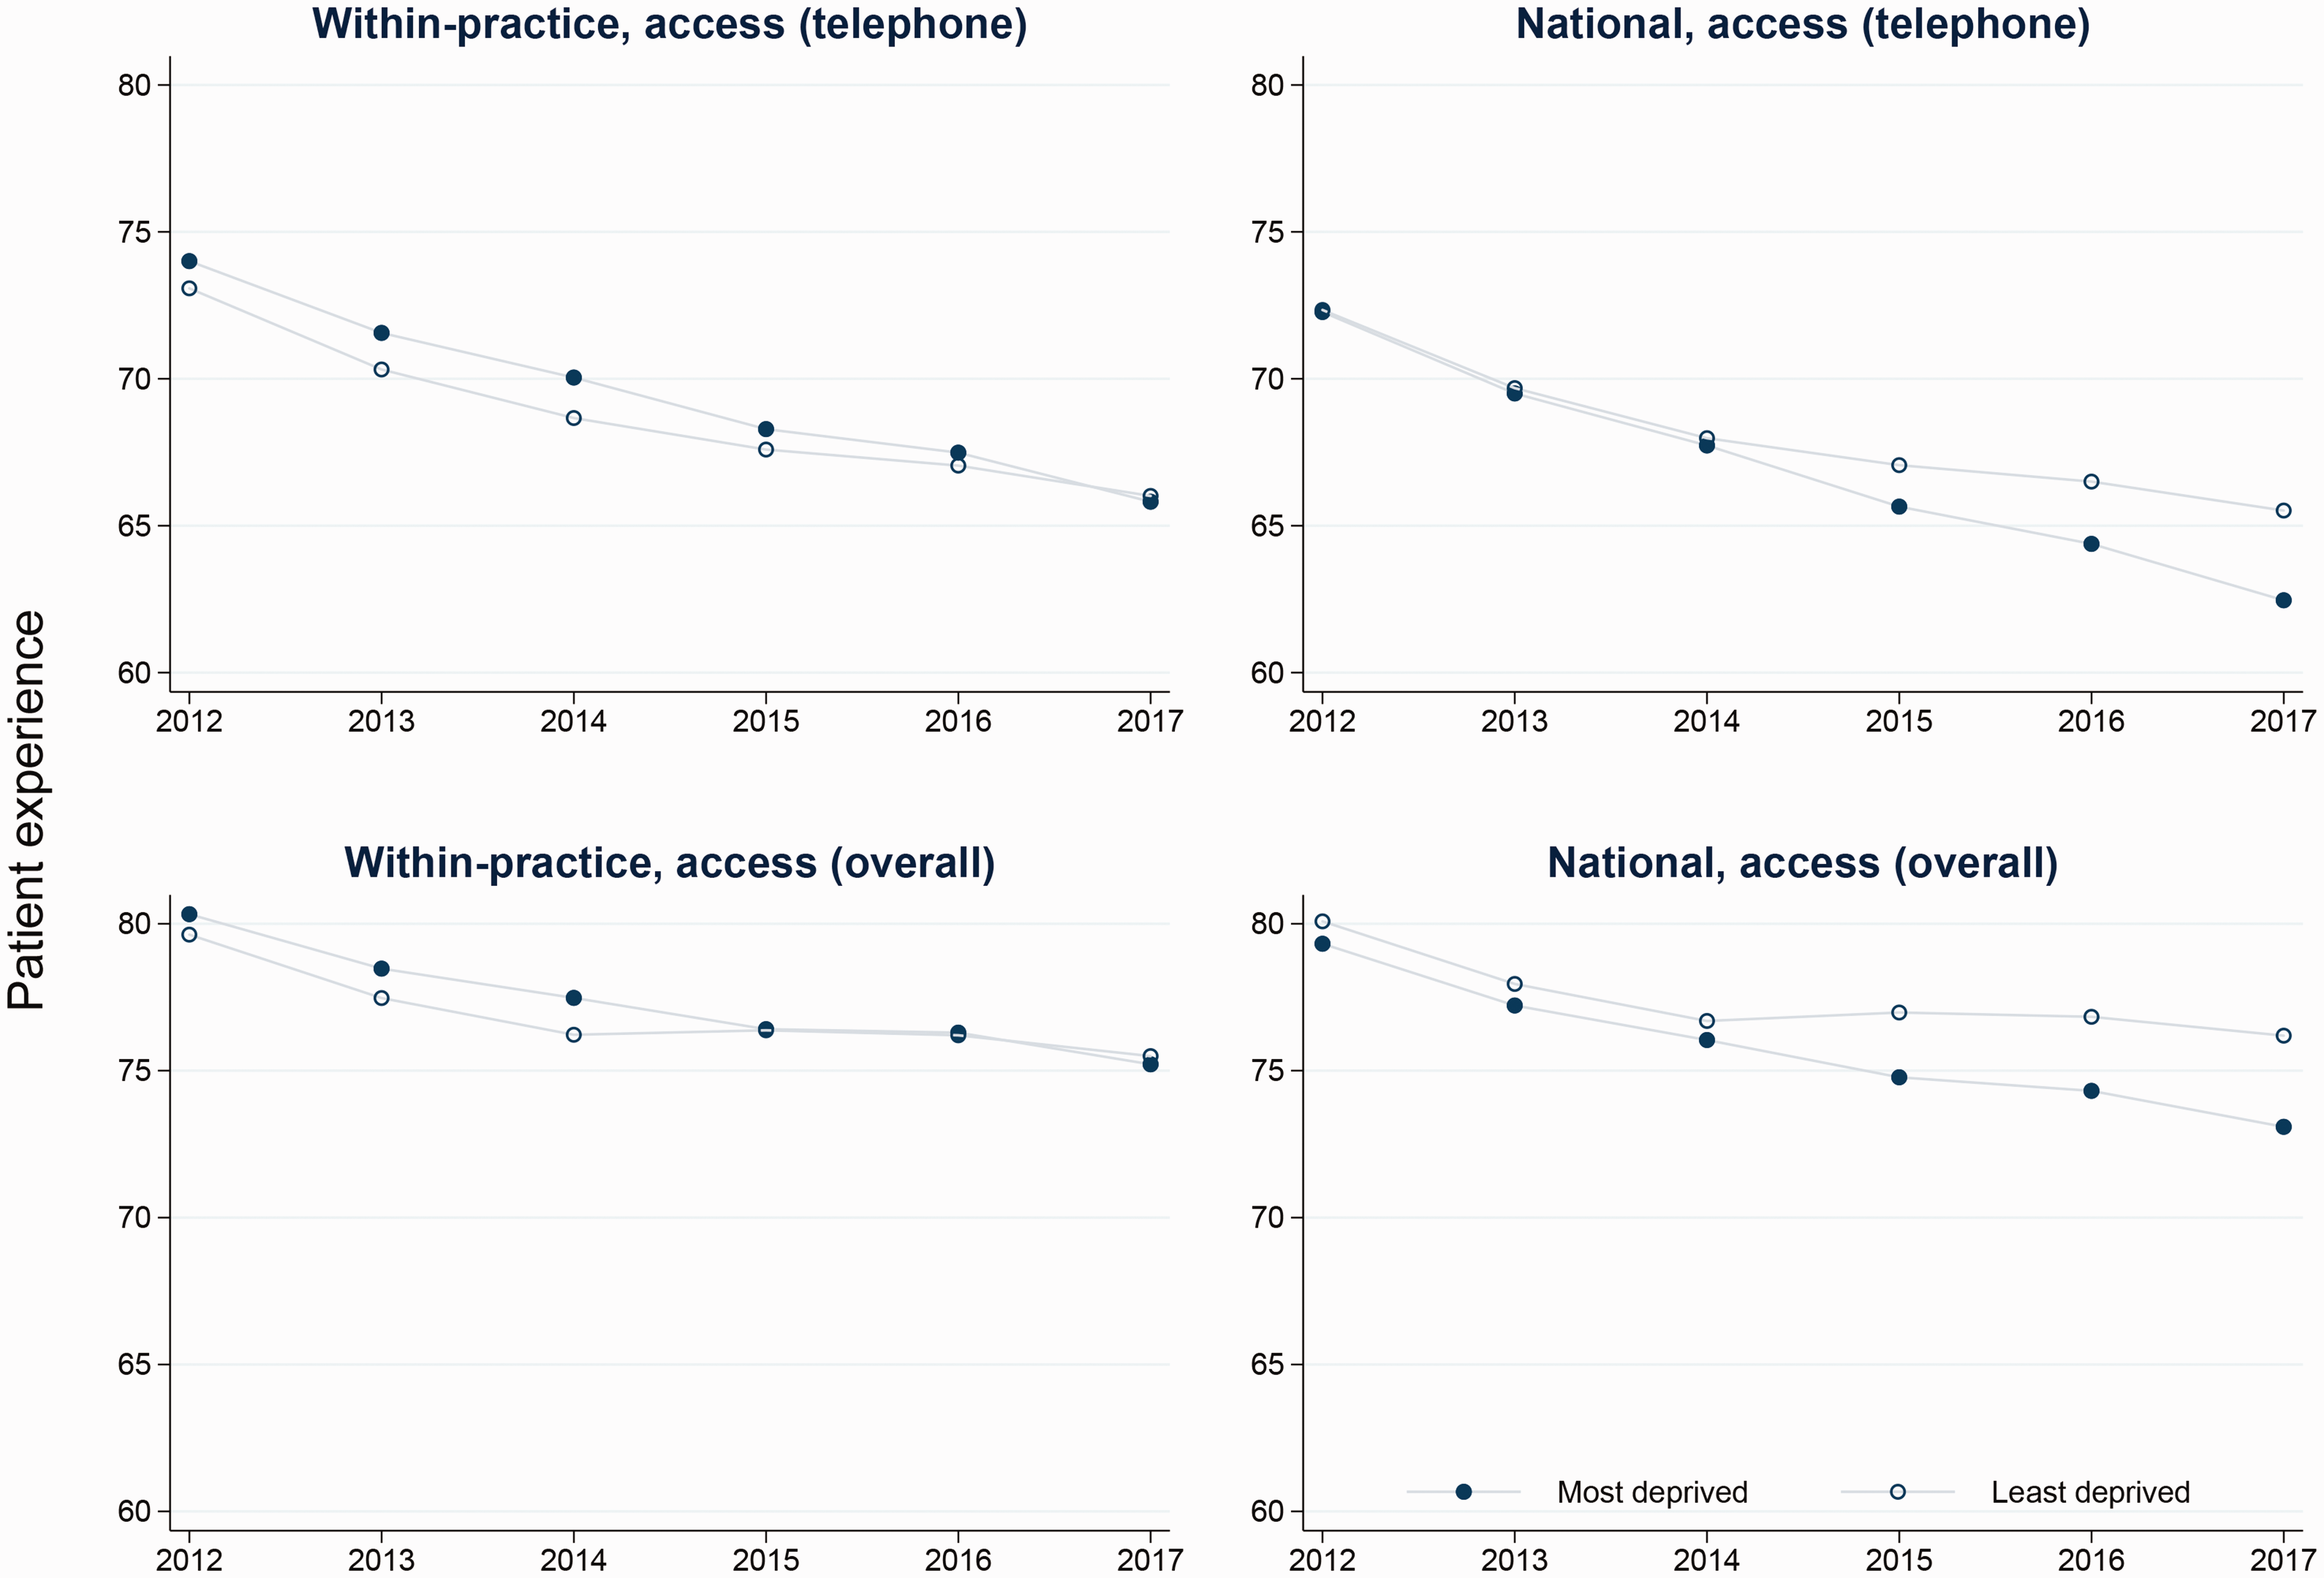
Comparison of national and within practice trends in inequalities in access by socio-economic status.
For presentational reasons 95% CI and some population groups (age groups 25–44, 55–64 and 75–84, the middle 3 deprivation quintiles, five out of nine regions, and people reporting “other” ethnicity and sexual orientation) are omitted from Figures 1 and 2 and online Supplement Figures S1-S4. Full model outputs for these groups are presented in online Supplement Tables S5-S10. Supplementary analyses, showing little changes in experience of people living with multiple long term conditions, and full details of all five deprivation quintiles are presented in online Supplement Figures S5 and S6.
Discussion
There were few substantial changes in inequalities in reported experience of primary care between 2011 and 2017, despite statutory and policy commitments to reduce disparities in care. At both practice and national level, variations in patient experience persist, notably in relation to age, deprivation, ethnicity, sexual orientation and geographical region. In addition, at a national levels, socioeconomic inequalities in access to care start to appear from 2015, with access declining fastest amongst people registered with practices serving the most deprived areas. Furthermore, reported continuity of care is declining fastest amongst the oldest age groups when compared to other patients registered at the same practice.
Notable decreases in access to care, consistent with prior analyses, 17 have occurred despite policy efforts such as the 2013 establishment of the GP Access Fund, which provided financial support to stimulate innovative solutions to improve primary care access throughout England.18–20 The worsening of socioeconomic inequalities in access at a national level has been noted previously within the NHS Outcomes Framework Health Inequalities Indicators, in which inequalities in access to GP services between the most and least deprived areas worsened between 2014/2015 and 2015/2016. 21 Although there is evidence that suggests inequalities in the supply of primary care doctors between the most and least deprived areas of the country actually improved between 2004–2005 and 2011–2012, the number of primary care providers in an area is only one measure of access. 22 In the current analysis, access was evaluated in relation to how easy it was for respondents to speak with someone at their practice on the phone and through overall experience of making an appointment.
Nationally, declining continuity of care is likely to reflect the move towards larger practices and changes in GP working patterns, with many GPs in portfolio careers working fewer clinical sessions. 23 Changes in inequalities in continuity of care at a practice level may reflect the differential impact of efforts to ensure that patients see a GP quickly, often at the expense at reducing the ability of patients to see their preferred doctors. 24 Continuity of care in primary care is not only valued by both patients 23 and providers, 25 it is also associated with improved patient outcomes. 26 Our longitudinal analysis demonstrates that continuity of care is worsening faster for older individuals. Poorer continuity of care has been associated with higher rates of both generalized and preventable hospitalizations in older adults and higher rates of mortality. 27
The introduction of the Equality Act in 2010 mandated the measurement and reporting by public bodies including the NHS of any inequalities experienced by ethnic minorities and people from sexual minorities, with the expectation that this would be a mechanism through which improvement might be mediated. 18 Evidence from other contexts suggests that reporting can be associated with decreasing inequalities: for example, analyses of US patient experience survey data have demonstrated a clear association between public reporting and a narrowing of variations between hospitals in patient experience measures. 28 Our analyses provide little evidence that this has been an effective strategy within the NHS and suggest that public reporting alone is not an effective tool to drive reductions in inequalities in the UK. The different funding mechanisms for health care between the US and the UK may, in part, explain this disparity: pay for performance has been demonstrated to be an effective lever for reducing inequalities in process measures of clinical quality in the UK. 22
The analyses presented here are based on survey responses prior to the COVID-19 pandemic. As the pandemic took hold, primary care providers in the UK and across the world were required to shift rapidly to remote consultations. Our findings that socio-economic inequalities in telephone access have been worsening over time, prior to the COVID-19 pandemic, provide a stark warning that COVID-induced reorganizations of care risk a rapid worsening of existing disparities.
Limitations
There were main three limitations with our study. First, the overall response rate of the GPPS survey waves included in this analysis (36.0%) was low, as with most patient experience surveys. Although nonresponse may result in slightly overestimating overall national levels of performance, it does not appear to meaningfully bias comparisons of case-mix-adjusted organization performance. 29 Analyses of GPPS data benefit from the robust sampling approach used within this survey to ensure generalizability of findings within the UK. Additional strengths include the large sample size, low amount of missing data and inclusion of five years of survey data in our analysis.
Second, the GPPS does not specifically sample people who have been to a GP practice within a certain period. This introduces possible recall bias in respondents’ recollections of details of their most recent GP experience.
Third, we did not adjust for co-morbid conditions in our models. There may be an interrelation between co-morbidities, patient experience and the socio-demographic characteristics considered in these analyses. 30 Given the differing health needs of these populations, we would argue that this is not something that should be adjusted for in the analysis; additionally, we found that trends in inequalities experienced by people with multiple long term conditions did not change substantively over time.
Conclusions
Despite a sustained policy focus on reducing unwarranted variations in care, there have been no substantial improvements in inequalities in primary care patient experience between 2011 and 2017. With UK primary care under increasing pressure, widening socio-economic inequalities in access to care at a national level are of particular concern. Whilst access is getting worse everywhere, it is declining faster at those practices that serve deprived populations. Changes in continuity of care are also of note – in the context of declining rates of continuity, the accelerated declines in continuity seen for older patients will impact those for whom arguably it is most important.
Supplemental Material
sj-pdf-1-hsr-10.1177_1355819620986814 - Supplemental material for Sociodemographic inequalities in patients’ experiences of primary care: an analysis of the General Practice Patient Survey in England between 2011 and 2017
Supplemental material, sj-pdf-1-hsr-10.1177_1355819620986814 for Sociodemographic inequalities in patients’ experiences of primary care: an analysis of the General Practice Patient Survey in England between 2011 and 2017 by Catherine L Saunders, Sarah Flynn, Efthalia Massou, Georgios Lyratzopoulos, Gary Abel and Jenni Burt in Journal of Health Services Research & Policy
Supplemental Material
sj-pdf-2-hsr-10.1177_1355819620986814 - Supplemental material for Sociodemographic inequalities in patients’ experiences of primary care: an analysis of the General Practice Patient Survey in England between 2011 and 2017
Supplemental material, sj-pdf-2-hsr-10.1177_1355819620986814 for Sociodemographic inequalities in patients’ experiences of primary care: an analysis of the General Practice Patient Survey in England between 2011 and 2017 by Catherine L Saunders, Sarah Flynn, Efthalia Massou, Georgios Lyratzopoulos, Gary Abel and Jenni Burt in Journal of Health Services Research & Policy
Footnotes
Acknowledgements
We thank all the survey respondents, NHS England and Ipsos MORI for their contributions and support.
Declaration of conflicting interests
The author(s) declared the following potential conflicts of interest with respect to the research, authorship, and/or publication of this article: GL and GAA have served as technical adviser consultants to NHS England regarding the Cancer Patient Experience Survey 2015–2019. JAB is a member of the GP Patient Survey Steering Group convened by Ipsos MORI.
Ethics approval
The authors declare that all the research meets the ethical guidelines. The GP Patient Survey has been designed to give patients the opportunity to give feedback about their experiences of their GP practice. It is carried out by Ipsos MORI for NHS England. Ipsos MORI is a registered and independent survey organization that strictly adheres to the Market Research Society's ethical code of conduct. ![]()
Funding
The author(s) disclosed receipt of the following financial support for the research, authorship and/or publication of this article: CS was funded by an Understanding Society Survey Methods Fellowship. ESRC grant ES/S007253/1. GL is supported by Cancer Research UK Clinician Advanced Scientist Fellowship [grant number: C18081/A18180].
Supplemental Material
Supplemental material for this article is available online.
References
Supplementary Material
Please find the following supplemental material available below.
For Open Access articles published under a Creative Commons License, all supplemental material carries the same license as the article it is associated with.
For non-Open Access articles published, all supplemental material carries a non-exclusive license, and permission requests for re-use of supplemental material or any part of supplemental material shall be sent directly to the copyright owner as specified in the copyright notice associated with the article.