
Abstract
Objectives
As part of the Vanguard programme, two integrated care models were introduced in South Somerset for people with complex care needs: the Complex Care Team and Enhanced Primary Care. We assessed their impact on a range of utilization measures and mortality.
Methods
We used monthly individual-level linked primary and secondary care data from April 2014 to March 2018 to assess outcomes before and after the introduction of the care models. The analysis sample included 564 Complex Care Team and 841 Enhanced Primary Care cases that met specific criteria. We employed propensity score methods to identify out-of-area control patients and difference-in-differences analysis to isolate the care models’ impact.
Results
We found no evidence of significantly reduced utilization in any of the Complex Care Team or Enhanced Primary Care cohorts. The death rate was significantly lower only for those in the first Enhanced Primary Care cohort.
Conclusions
The integrated care models did not significantly reduce utilization nor consistently reduce mortality. Future research should test longer-term outcomes associated with the new models of care and quantify their contribution in the context of broader initiatives.
Introduction
Improvements in life expectancy 1 are partly due to better and more accessible health care. 2 However, although people are living longer, many are living with at least one long term condition (LTC) requiring ongoing health and social care support. Unless care is integrated, patients may not be cared for in the most appropriate setting or at the right time.
These demographic and system challenges face South Somerset in the UK: over 20% of the population is aged over 65 and around 4% consume 50% of the health care resources. 3 As one of the integrated primary and acute care systems (PACSs) 4 in the English national Vanguard programme, 5 two new models of integrated care (IC) were introduced in South Somerset.
The first IC model, the Complex Care Team (CCT), provides senior medical input, care coordination, and a personalized care plan to support self-care. Staffed by GPs with expertise in chronic care management, complex care nurses and other keyworkers, the CCTs aim to prevent avoidable hospitalizations or, for those in hospital, to support appropriate inpatient care.
In February 2015, a single CCT was set up, covering the whole of South Somerset. CCT staff identified complex patients already in hospital to support them there and post-discharge. In August 2016 two additional CCTs were established. GPs could either refer their complex patients to the local CCT, or continue managing them with CCT support. The latter model became the norm in March 2017.
The second IC model, Enhanced Primary Care (EPC), supports people with complex conditions to manage their own conditions, primarily through health coaching. EPCs bring together primary care clinicians, health coaches, musculoskeletal practitioners, pharmacists, and mental health workers.
Individuals with three or more LTCs from a list of eight (cancer, chronic obstructive pulmonary disease, dementia, stroke, cardiac problems, depression, diabetes, chronic kidney disease) and/or a history of frequent admissions were eligible for the CCT. These criteria subsequently broadened to include patients’ social circumstances (information that is not routinely recorded). EPC was initially targeted at people likely to become future complex patients, usually those with one or more LTC and/or fragility and/or a complex social situation. Gradually, the distinction between the CCT and EPC care models blurred into a care continuum, with EPC also acting as step-down care for patients no longer needing CCT input. 6
The care models were intended to support joint working and ‘reduce reliance on hospital care’. 4 In this article, we assess the impact of the two models (‘interventions’) on utilization and mortality.
Methods
Data
The study analysed pseudonymized patient-level primary and secondary care data from April 2014 to March 2018, covering the entire Somerset population and capturing information about each resident's characteristic, health care utilization, care home residency, and date of death (if applicable). Those enrolled in the CCT or EPC models can be identified, but intervention costs are not reported.
Datasets were accessed as part of a Data Sharing Agreement between the University of York and the NHS South, Central and West Commissioning Support. 7
Cohorts
Evaluating the impact of the two IC models faced two key challenges. Firstly, IC interventions and eligibility criteria evolved over time, to ensure care was patient-centered, and to facilitate ‘reflexive learning’. 8 Thus, in addition to evaluating the overall effects of CCT and EPC, we also performed sub-group analyses of CCT and EPC enrollees divided into 6-month cohorts to assess whether effects varied as the interventions evolved.
Secondly, patients were not randomized to the IC interventions. We used propensity score matching techniques to identify suitable controls and capture the ‘counterfactual’ – namely, what would have happened in the absence of the IC intervention. Controls should resemble cases in all relevant characteristics with the exception that they are not exposed to the IC intervention.
As it was intended that the two care models would be rolled out to all eligible people in South Somerset, matched controls were selected ‘out of area’, in other parts of Somerset where these IC interventions were not introduced.9,10 Table 1 shows the period covered by each cohort and the period midpoint (columns (2) and (4) respectively). In total, 661 CCT cases and 908 EPC cases had valid or imputed enrolment dates (column (6)). Of those, 564 CCT cases and 841 EPC cases were suitable for matching (column (7)).
Overview of the intervention cohorts.
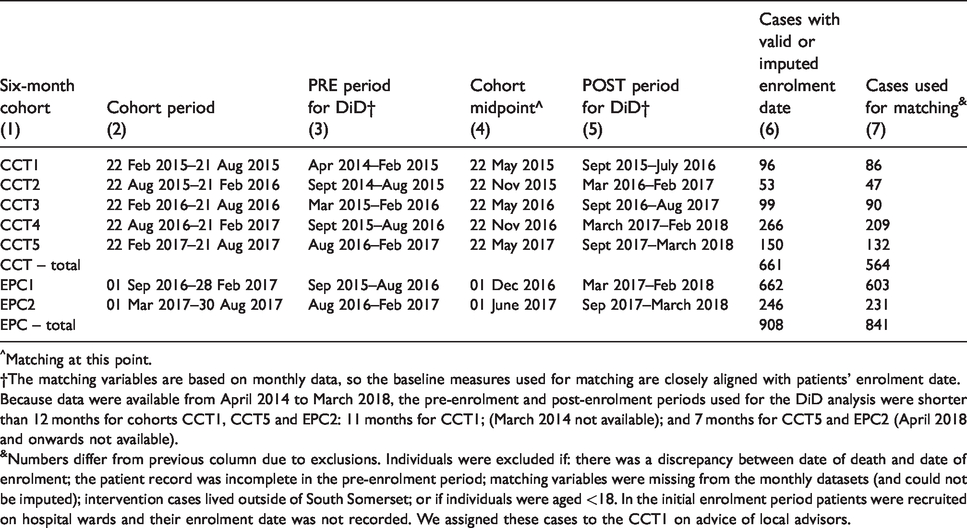
^Matching at this point.
†The matching variables are based on monthly data, so the baseline measures used for matching are closely aligned with patients’ enrolment date. Because data were available from April 2014 to March 2018, the pre-enrolment and post-enrolment periods used for the DiD analysis were shorter than 12 months for cohorts CCT1, CCT5 and EPC2: 11 months for CCT1; (March 2014 not available); and 7 months for CCT5 and EPC2 (April 2018 and onwards not available).
&Numbers differ from previous column due to exclusions. Individuals were excluded if: there was a discrepancy between date of death and date of enrolment; the patient record was incomplete in the pre-enrolment period; matching variables were missing from the monthly datasets (and could not be imputed); intervention cases lived outside of South Somerset; or if individuals were aged <18. In the initial enrolment period patients were recruited on hospital wards and their enrolment date was not recorded. We assigned these cases to the CCT1 on advice of local advisors.
Base case analysis
For each 6-month cohort, matching variables capturing patient profiles at baseline were used to derive a ‘propensity score’ for each individual in Somerset. 11 The score reflects the likelihood of being exposed to the IC model, given a set of individual characteristics. For each cohort, we based the matching variables on the cohort midpoint and generated variables from monthly data. For both CCT and EPC, our matching variables were: age, gender, socio-economic status, a count of 8 LTCs, a count of GP visits in the past 12 months, a count of prescriptions received in the past 12 months, a ‘HealthNumerics-RISC score’, 12 and care home residency. Derived from demographic, clinical and utilization data, the RISC score represents the likelihood of inpatient admission over the next 12 months and is calculated each month for everyone in Somerset. The binary measure of care home residency captures individuals’ capacity for independent living.
We used information corresponding to enrolment criteria in undertaking matching and compared various matching algorithms, opting for Single Nearest Neighbour without replacement (see Appendix 1 online). The propensity scores are estimated for the South Somerset population using logistic regression and then predicted for the population in the other areas of Somerset that were not exposed to the interventions (see Appendix 1 online).
We employed a ‘difference in differences’ (DiD) regression approach (Appendix 1 online) that includes a single IC intervention, and pre- and post-enrolment periods to compare the utilization of the matched cohorts of cases and controls. By comparing matched cases and controls over time, the DiD evaluative approach isolates differences attributable to the intervention from underlying trends.
Matched controls may have been exposed to other forms of IC intervention in other parts of Somerset. If so, this would violate the assumption that changes in utilization for controls reflect only general time trends. 13 Our analysis therefore controls for the Somerset Practice Quality Scheme (SPQS), introduced in 2014 to encourage multi-disciplinary working in general practice. 14
Sensitivity analyses
There are two reasons why cases and controls may not be well-matched. First, there is considerable variation among cases in terms of complexity, diagnosis, and care needs. If those enrolled were close to death, and died between enrolment and follow up, they were no longer at risk of an ‘event’ such as a hospital admission. Including the zero or low utilization of those who died reduces the mean value in their cohort. In recognition of this potential bias, we performed a robustness check in the form a DiD for the subgroup of survivors (only) by matching survivors in the intervention group to comparable (surviving) controls.
Second, some patients may have been exposed to both IC models. To account for the possibility of crossover, we tested the impact of prior use of CCT in a sensitivity analysis.
All analyses were conducted in Stata Statistical Software: Release 14.
Service utilization measures
The analysis tests for the effect of CCT and EPC on a range of service utilization measures, all based on monthly values. For CCT, there are five measures: outpatient visits, accident and emergency (A&E) attendances, emergency admissions, bed days, and the total cost of primary, community and hospital care. For EPC, there are three measures: acute inpatient admissions, acute outpatient admissions, and the costs of primary care and community care as a proportion of total cost.
Figures 1 and 2 show trends in utilization for the CCT and EPC cohorts, with the vertical lines and shading indicating the evaluation periods. In Figure 1, all utilization measures are shown on a scale of 0 to 1, except for bed days (0 to 5) and total monthly costs (£0 to £3000). In Figure 2, acute outpatient visits and acute admissions are shown on a scale of 0 to 0.5 and the proportion of total costs spent on out-of-hospital care is shown on a scale of 0 to 1. For the analysis, outcomes are aggregated over the relevant period. We applied a standardized follow-up period for each cohort, as is usual evaluative practice. For most cohorts, the period is 12 months pre and 12 months post the 6-month window. For the fifth CCT cohort and the second EPC cohort, the periods are each 7 months due to limited follow-up data (Table 1).
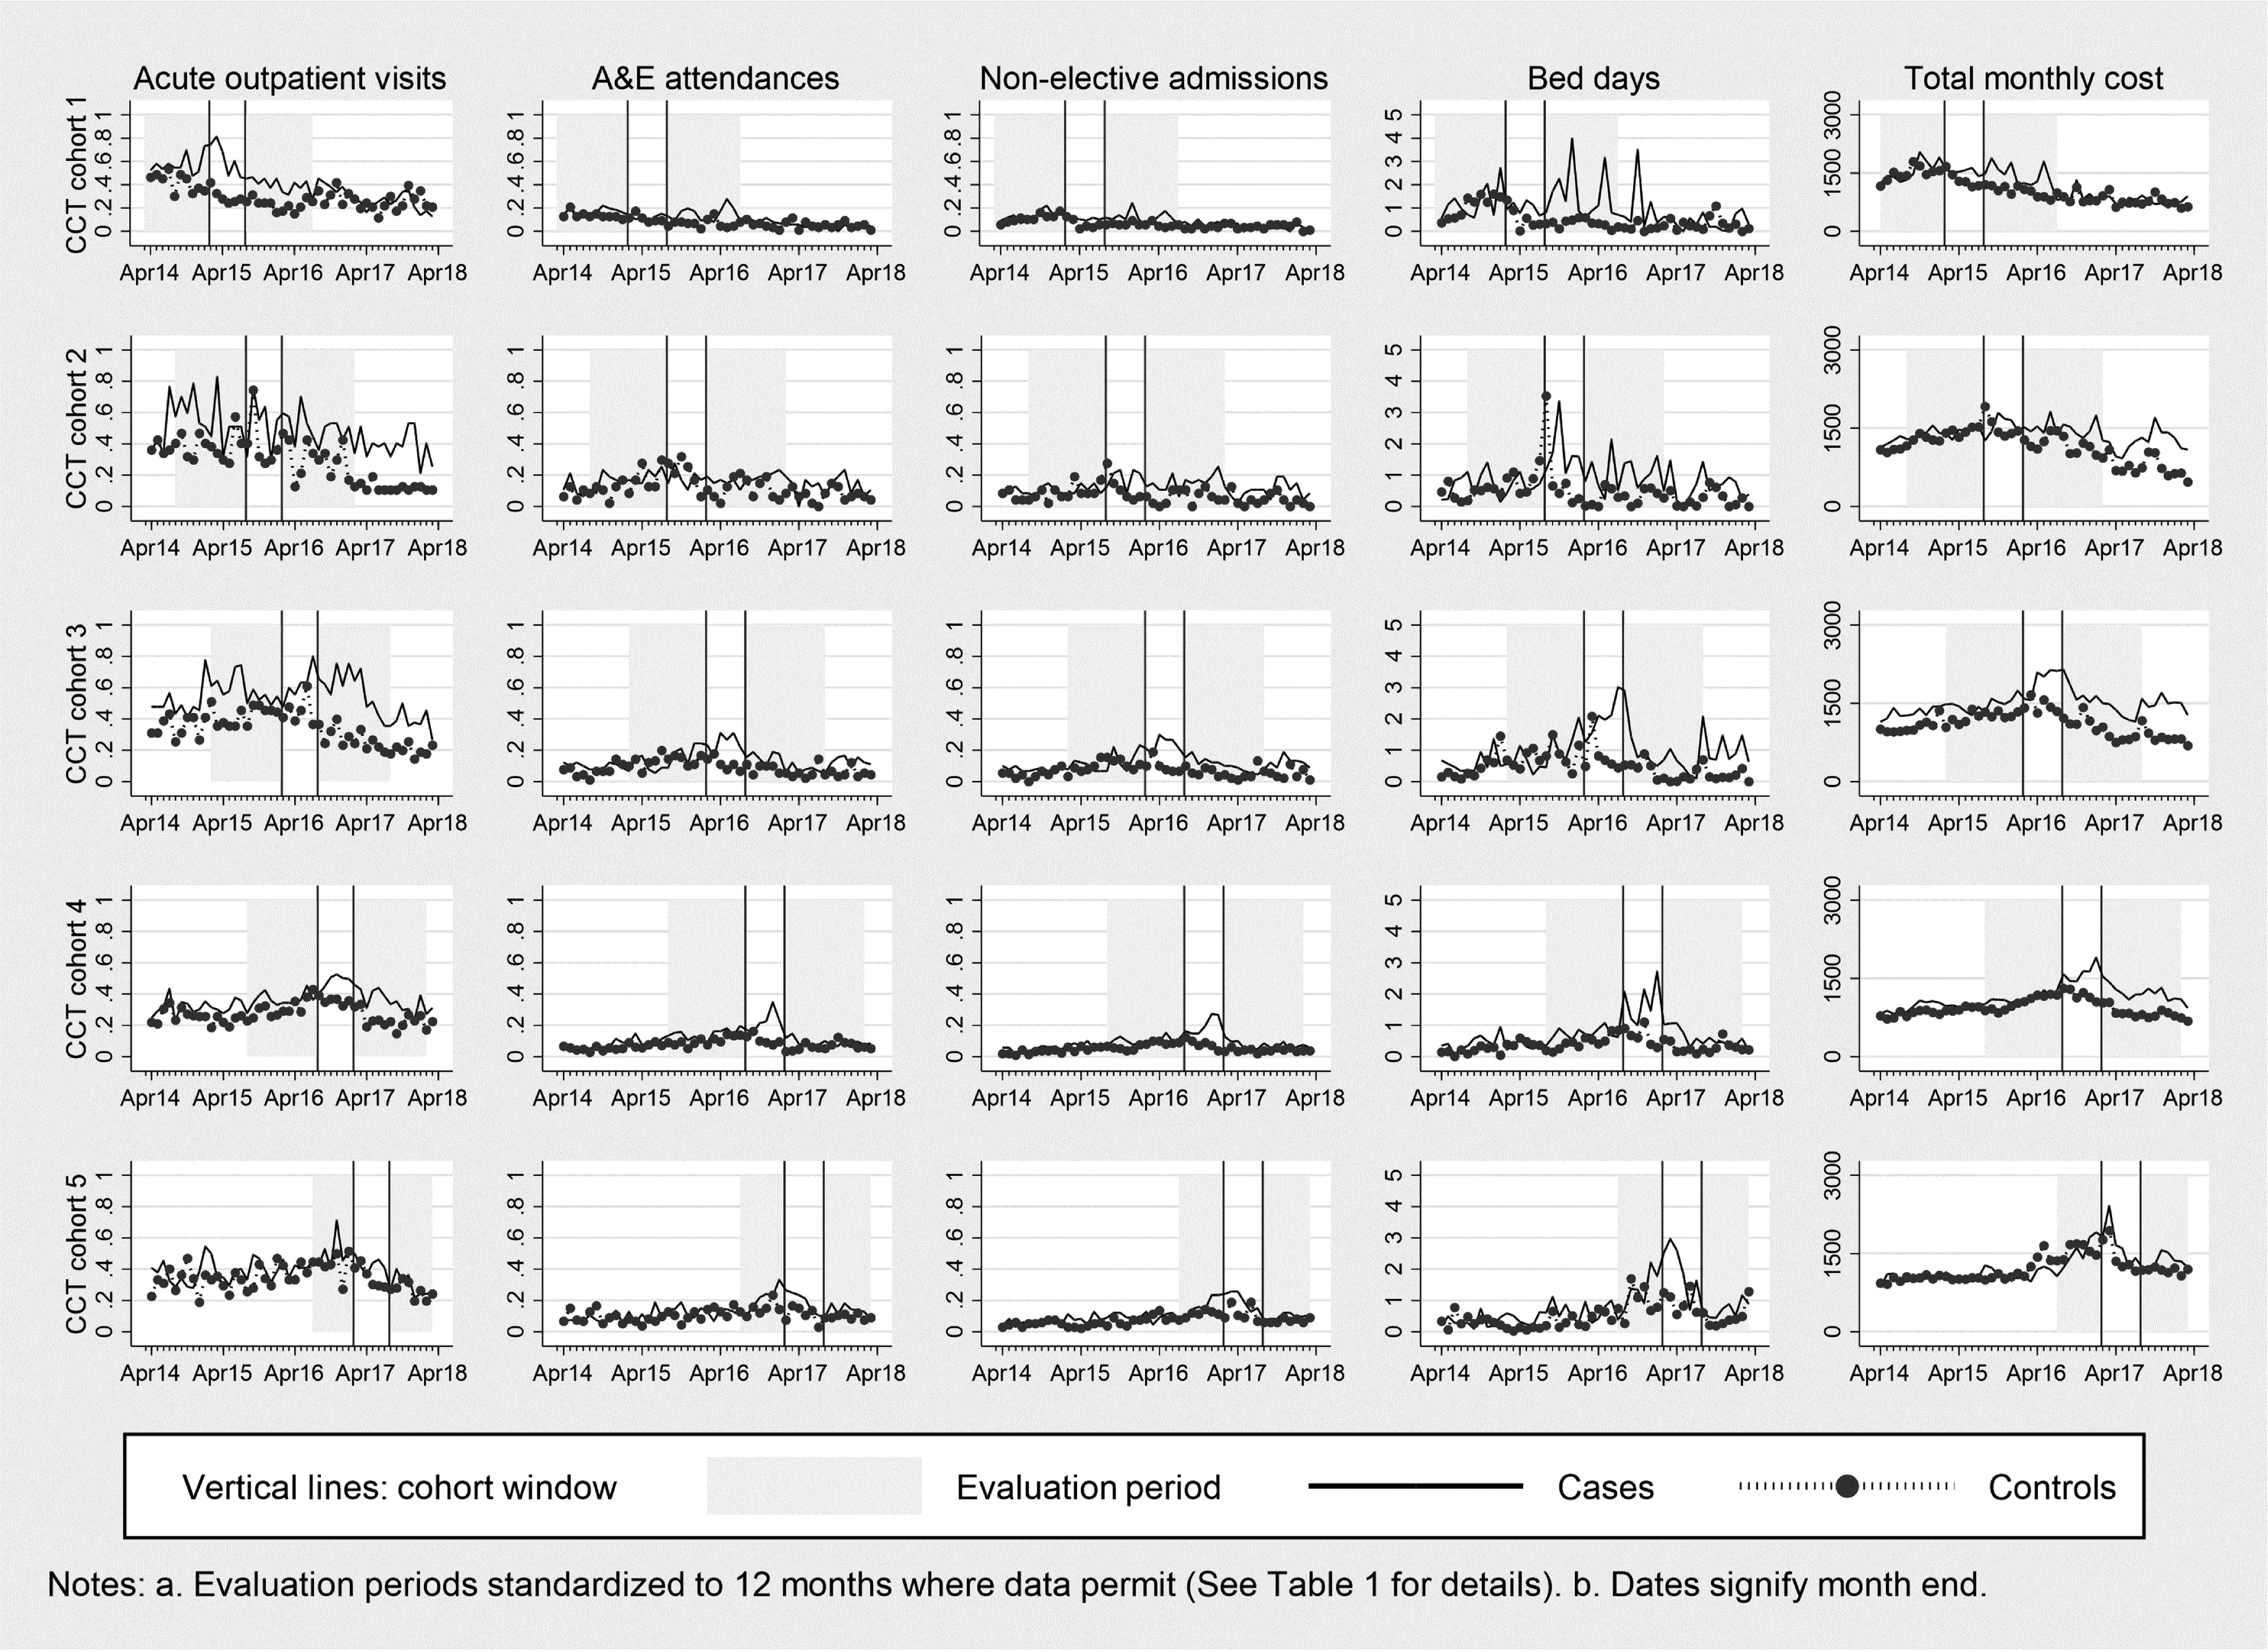
Utilization for CCT cohorts.
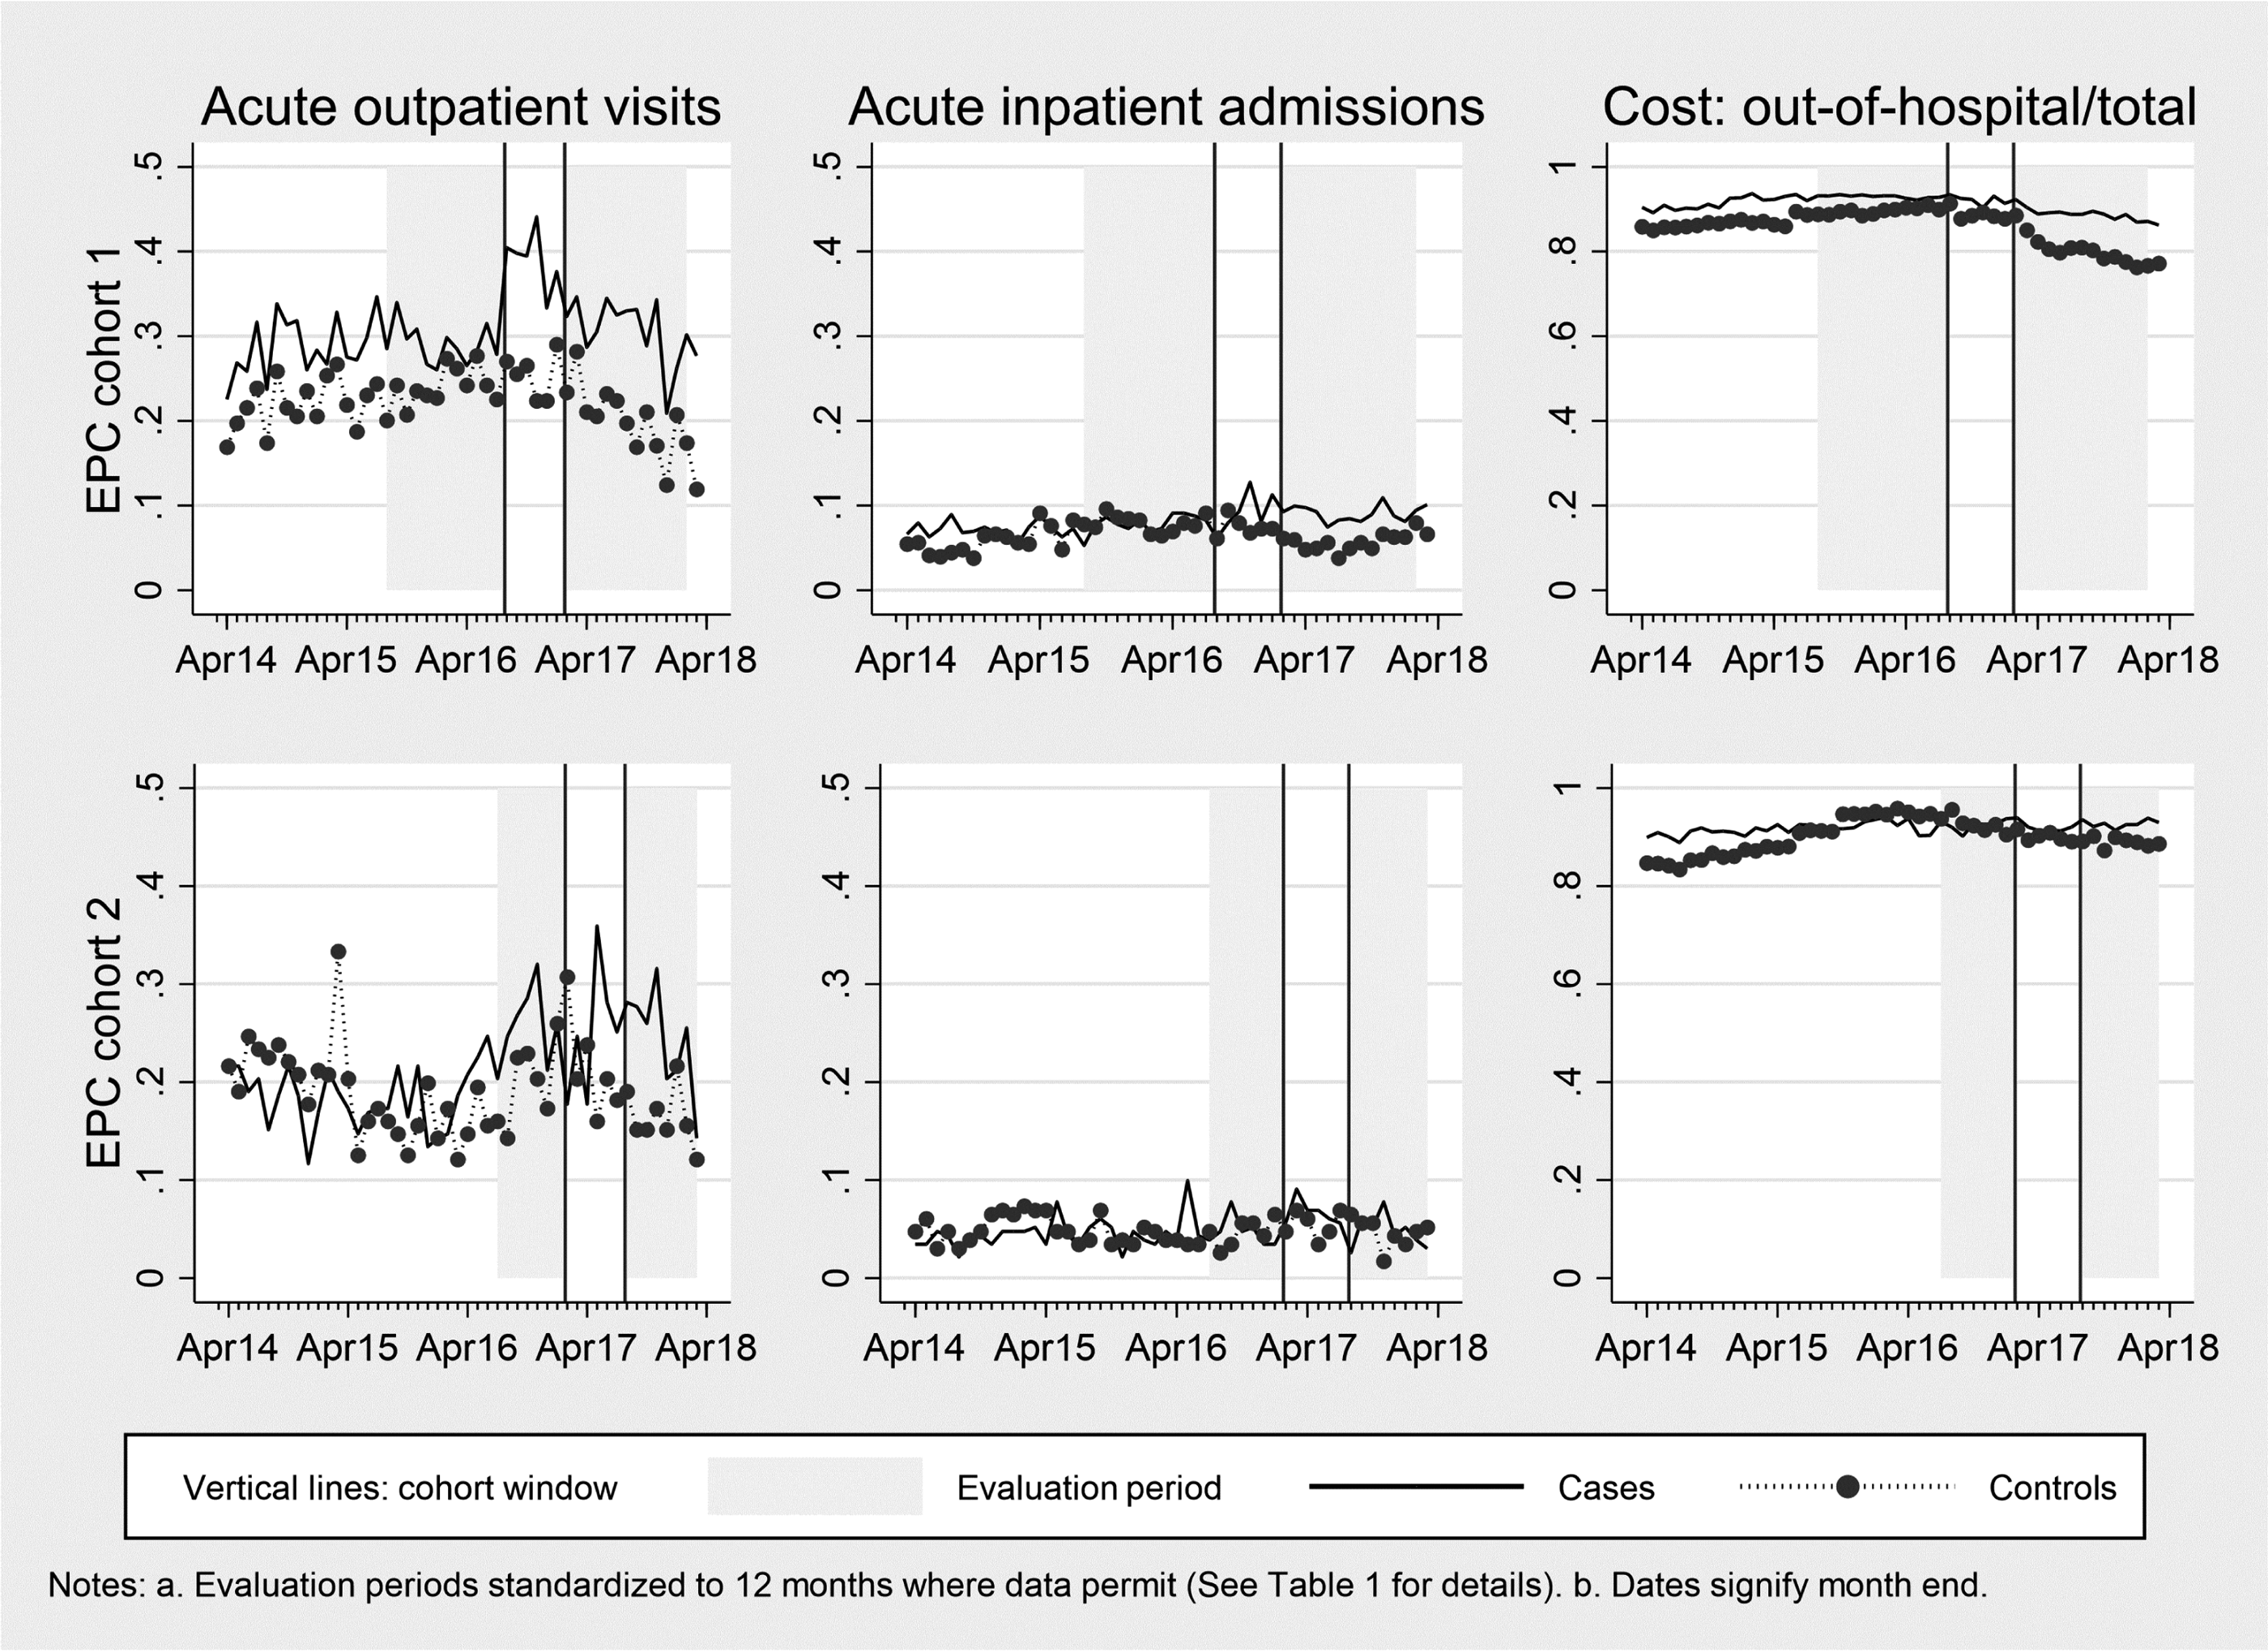
Utilization for EPC cohorts.
Results
Balance graphs
In all CCT and EPC cohorts, matching worked well in terms of the baseline (midpoint) comparability of cases and controls on the matching variables. Descriptive statistics and balance graphs are in Appendix 2 online.
Impact on utilization
Table 2 reports the impact for the five CCT cohorts in turn, together with a pooled analysis that assesses the overall impact of the CCT intervention. The pooled analysis has the advantage of including all CCT cases and controls, but assumes that cases were exposed to the same form of CCT, ignoring its evolution.
DiD results for utilization: CCT cohorts.
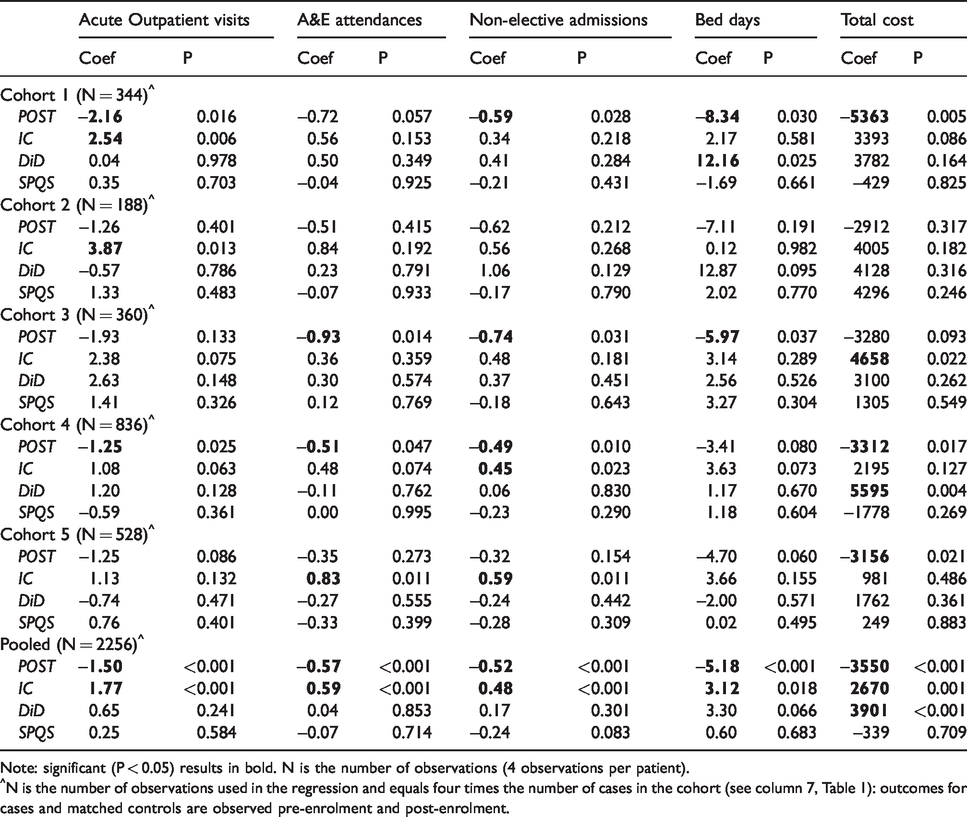
Note: significant (P < 0.05) results in bold. N is the number of observations (4 observations per patient).
^N is the number of observations used in the regression and equals four times the number of cases in the cohort (see column 7, Table 1): outcomes for cases and matched controls are observed pre-enrolment and post-enrolment.
Each DiD equation contains four key variables that disentangle general temporal changes (POST), differences between the control and treatment groups (IC), the impact of the care models (DiD), and the effect of the SPQS scheme (SPQS).
First, utilization or costs may change over time irrespective of the introduction of the CCT intervention. These general temporal changes are captured by the POST variable, which is always negative and often significant. The pooled analysis shows that a significant decline (P < 0.001) in utilization and costs occurred independently of the CCT intervention.
Second, the variable IC captures differences in utilization in the pre-enrolment period between the case and control groups. Such differences may reflect imperfect matching, and the IC variables account for this possibility. The pooled analysis shows that CCT cases had significantly higher utilization and costs than controls in the pre-enrolment period. Cases had more outpatient visits in CCT1 (P = 0.006) and CCT2 (P = 0.013), higher total costs in CCT3 (P = 0.022), more non-elective admissions in CCT4 (P = 0.023) and CCT5 (P = 0.011) and more A&E attendances in CCT5 (P = 0.011).
Third, the variable DID captures the variable of policy interest: the impact of the CCT intervention on utilization or costs, after accounting for time trends and pre-enrolment differences with the controls. The pooled analysis found no significant impact of the CCT intervention on utilization but CCT cases had significantly higher costs than the controls (P < 0.001). Bed days were significantly higher for cases in CCT1 (P = 0.025) and costs were significantly higher for cases in CCT4 (P = 0.004).
Fourth, the variable SPQS captures the effect of the Somerset Practice Quality Scheme. This scheme had no significant effect on any utilization measure.
Table 3 shows the impact of the EPC intervention on utilization for the two EPC cohorts, and a pooled analysis featuring all EPC cases and controls. In the pooled analysis, the proportion of out-of-hospital costs fell over time (POST P < 0.001) and, pre-enrolment, cases had more outpatient visits (IC P < 0.001) and a higher proportion of out-of-hospital costs (IC P < 0.001) than controls. The non-significant DiD coefficients indicate that the EPC intervention had no impact on utilization or costs, and neither did the SPQS arrangements.
DiD results for utilization: EPC cohorts.
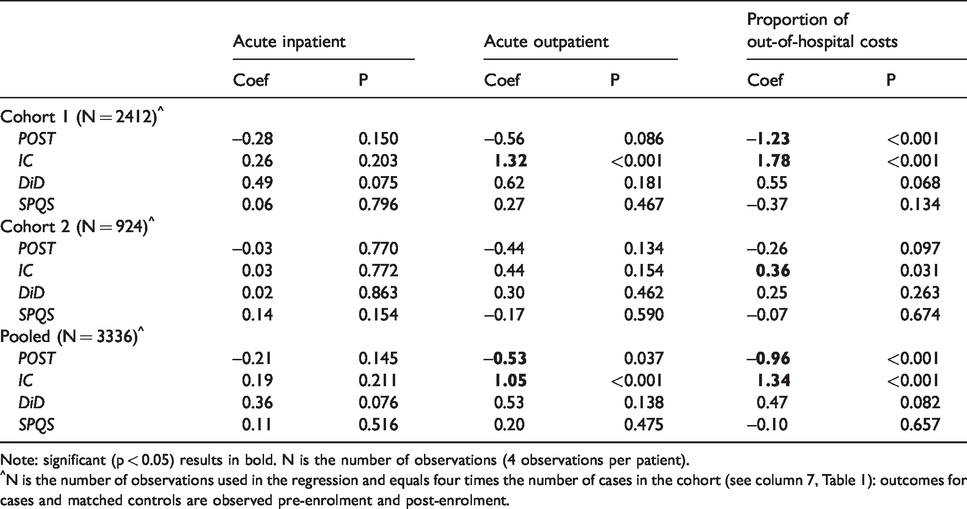
Note: significant (p < 0.05) results in bold. N is the number of observations (4 observations per patient).
^N is the number of observations used in the regression and equals four times the number of cases in the cohort (see column 7, Table 1): outcomes for cases and matched controls are observed pre-enrolment and post-enrolment.
Impact on mortality
Table 4 reports the analysis of mortality. The only significant differences were for CCT5, where the mortality rate of cases was higher (P = 0.002), and for EPC1 where the mortality rate of cases was lower (P = 0.003).
DiD results for mortality: CCT and EPC cohorts.
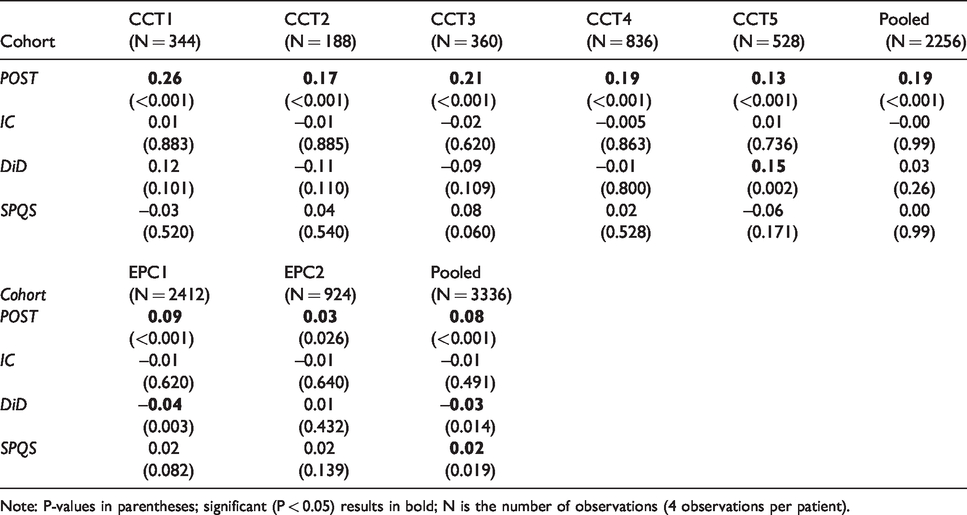
Note: P-values in parentheses; significant (P < 0.05) results in bold; N is the number of observations (4 observations per patient).
Sensitivity analyses
There is considerable variation in death rates across cohorts and between cases and controls (see Appendix 3, Table A3.1, and Figures A3.1 and A3.2, all online).
In general, the analysis of the subgroup of survivors supported findings from the main analyses (Appendix 3, Tables A3.2-A3.4, online).
Table A3.5 in Appendix 3 online shows the results accounting for prior use of CCT on EPC patients. In the EPC1 cohort, there were three significant differences. For the subgroup of cases that used both CCT and EPC (captured by DiD-dual), acute inpatient use was higher (P = 0.002) and the proportion of out-of-hospital costs was lower (P = 0.017) compared with controls. The remaining EPC patients (captured by DiD) had a significantly higher proportion of out-of-hospital costs (P = 0.001) than controls. There was no effect of prior CCT use on utilization in EPC2 cohort.
Discussion
Establishing the impact of IC models is challenging if the intervention is not subject to a randomized controlled trial. Challenges also arise because the nature, purpose and target population of the IC intervention are difficult to define and evolve over time. 13
To tackle these challenges, we used propensity score matching to identify out-of-area controls and divided enrollees into 6-monthly cohorts in recognition of the evolving nature of the care models and changes in the characteristics of enrollees. We employed DiD analysis to capture the impact of the intervention and to account for time trends.
We found no robust evidence that either intervention significantly reduced utilization during the 12-month follow-up period. Rather, cases had significantly more bed days in CCT1, and costs were higher in CCT4 compared with controls. There was no conclusive evidence that the care models had an impact on mortality. International reviews of integrated care support our findings, with limited evidence of impacts on utilization or costs.15,16
Limitations
Our findings should be interpreted with caution. First, there are concerns about the comparability of cases and controls. Differences in death rates across controls and cases may reflect systematic unobserved differences in severity. Consequently, our findings may underestimate the true impact of the care models.
Second, this evaluation is of evolving care models during their developmental stages and follow up was limited to 12 months for each cohort.
Third, although we were able to account for the SPQS, other less formalized integrated care initiatives may also have been operating. Data about these initiatives is lacking but circumstantial evidence suggests they may have contributed to reduced non-elective inpatient admissions. 17
Nonetheless, our findings do not validate the logic underpinning the new care models – namely, that integrating care reduces hospital utilization.
Conclusion
Our analysis found no evidence that either IC intervention significantly reduced utilization over the 12-month follow-up period, and no consistent evidence that the care models had an impact on mortality. However, this was not an effectiveness study of fully-fledged integrated models of care. Future research should test longer-term outcomes associated with the new models of care and quantify their contribution in the context of broader initiatives.
Supplemental Material
sj-pdf-1-hsr-10.1177_1355819620931872 - Supplemental material for Evaluating integrated care for people with complex needs
Supplemental material, sj-pdf-1-hsr-10.1177_1355819620931872 for Evaluating integrated care for people with complex needs by Panagiotis Kasteridis, Anne Mason and Andrew Street in Journal of Health Services Research & Policy
Footnotes
Acknowledgements
We are grateful to Deborah Lane and Jeremy Martin (Yeovil District Hospital), and to Chris Morris, Kevin Reaney, Ebuka Nrialike and colleagues at the NHS South, Central and West Commissioning Support Unit (CSU). The data were provided by the Health and Social Information Centre to the NHS South, Central and West CSU through its Data Access Request Service, application number NIC-43362-G7T9X. Any errors are the responsibility of the authors. The views expressed are those of the authors and not necessarily those of the funder or data provider.
Declaration of conflicting interests
The author(s) declared no potential conflicts of interest with respect to the research, authorship, and/or publication of this article.
Ethics approval
The authors confirm that ethical review was not required.
Funding
The author(s) disclosed receipt of the following financial support for the research, authorship, and/or publication of this article: This work was funded by NHS England as part of their national evaluation strategy, via the Symphony Project board and Yeovil District Hospital NHS Foundation Trust.
Supplemental material
Supplemental material for this article is available online.
References
Supplementary Material
Please find the following supplemental material available below.
For Open Access articles published under a Creative Commons License, all supplemental material carries the same license as the article it is associated with.
For non-Open Access articles published, all supplemental material carries a non-exclusive license, and permission requests for re-use of supplemental material or any part of supplemental material shall be sent directly to the copyright owner as specified in the copyright notice associated with the article.