
Abstract
This study integrates customer satisfaction with cost and revenue data in upscale chain hotels using a two-stage Network Data Envelopment Analysis approach. Stage 1 assesses Cost-to-Satisfaction (C-S) efficiency; Stage 2 measures Satisfaction-to-Revenue (S-R) efficiency. By comparing two-stage results to traditional one-stage accounting-only DEA, the study exposes limitations in current accounting systems that overlook customer feedback. Findings reveal consistently high C–S but declining and fluctuating S–R efficiency, indicating untapped revenue potential. We advance hotel efficiency research by integrating customer metrics with accounting data in DEA and propose practical guidance in setting priorities in either cost or revenue management.
Keywords
Introduction
Strategic management accounting (SMA) empowers accountants to contribute to strategic decision-making by integrating cost and revenue insights with customer and competitor perspectives (Bromwich, 1990; Hogreve et al., 2017; Roslender and Hart, 2003). In the demanding lodging industry, where managing both costs and revenues is especially demanding, success depends on placing the customer at the core of business decisions (Carlbäck, 2022; Downie, 1997; McManus, 2013; Nemeschansky, 2020). A central component of SMA is the integration of marketing and accounting information, which enables cross-functional collaboration and straightens firm’s strategic positioning (Downie, 1997; McManus, 2013).
Several scholars have demonstrated the value of combining financial and customer-related data in hospitality management. Assaf and Magnini (2012) showed that integrated hotel datasets provide deeper managerial insights than accounting-only data. Andersson and Carlbäck (2009) and (Carlbäck, 2022) advocated for customer-value-informed accounting in restaurant management, later implemented in a real-life case by Nemeschansky (2020). Cugini et al. (2007) further illustrated how detailed cost data aligned with customer satisfaction can guide better resource allocation.
A key challenge for such integrated approaches is that customer-level behavioral outcomes occur outside accounting systems, making them difficult to capture and systematize (Ingenbleek, 2014; Van der Rest et al., 2018). However, the growing mass of Internet customer reviews and the maturity of analytical tools help overcome historic limits to systematic analysis of reliable customer feedback (e.g., Boccali et al., 2022; J. Park and Lee, 2021). These developments support empirical investigations into cross-level profitability models that align internal cost controls with external customer feedback, as envisaged by Banker and Johnston (2007) and Carlbäck (2022).
Upscale chain hotels provide a useful setting for studying SMA, as their standardized operations and premium services make performance differences more attributable to managerial capabilities (e.g., Kim and Chung, 2022). Despite these strong foundations, significant room for research remains for integration of customer metrics with accounting systems to enhance internal collaboration between departments such as operations and marketing (Assaf and Magnini, 2012; Cugini et al., 2007; Downie, 1997; Kim and Chung, 2022; McManus, 2013; Van der Rest et al., 2018; Yin et al., 2020).
This study advances integration of accounting and marketing data and contributes to the SMA literature by empirically linking customer satisfaction to hotel cost and revenue efficiency in a two-stage Network Data Envelopment Analysis (DEA) model (e.g., Kao, 2014). Stage 1 analyzes Cost–Satisfaction (C-S) efficiency; the lower the cost to produce a certain level of customer satisfaction, the higher the C-S efficiency. Stage 2 analyzes Satisfaction-Revenue (S-R) efficiency: the greater the revenue a hotel generates from a given level of customer satisfaction, the higher the S-R efficiency.
Our approach expands traditional DEA applications by incorporating both cost and revenue dimensions of performance, consistent with SMA’s holistic orientation (Cui et al., 2025). Distinct from prior studies focusing only on revenue generation (Brown and Ragsdale, 2002; Mariani and Visani, 2019; Morey and Dittman, 1995; J. Park and Lee, 2021), we use departmental costs and revenues under direct management control, also moving beyond structural cost perspectives that incorporate non-manageable fixed assets (for example, Kim and Chung, 2022). While building on approaches by Yin et al. (2020) and Kim and Chung (2022), our model aligns closer with Assaf and Magnini (2012) call for integrated accounting and customer-based performance assessment. We further perform a comparison with one-stage Cost-to-Revenue DEA, highlighting the strengths of our two-stage approach in diagnosing where inefficiencies arise (Assaf and Agbola, 2011; Barros, 2005; Barros and Dieke, 2008; Günaydın et al., 2022; Hsieh and Lin, 2010; Lado-Sestayo and Fernández-Castro, 2019).
Our results demonstrate stable, high C-S efficiency across hotels, but a widening gap in their ability to convert customer satisfaction into revenue. These findings reveal shortcomings in current accounting systems that often fail to incorporate customer feedback into cost and revenue management decisions. This study promotes customer-centric decision making for management practices by extending beyond the traditional Cost-to-Revenue perspective commonly adopted in accounting DEA research 1 . We propose a 2 × 2 matrix that classifies hotel performance relative to competitors based on C-S and S-R efficiencies, and uses specific examples to explain whether a hotel should prioritize improvements in cost or revenue management relative to customer satisfaction.
Furthermore, our model integrates short-term, internally focused cost efficiency with a long-term, externally focused revenue perspective driven by customer satisfaction, thus extending the role of DEA beyond the technical measure of productive efficiency and repositioning it as a strategic tool within SMA, capable to provide a holistic performance assessment (Assaf and Magnini, 2012; Cui et al., 2025).
Literature review
Customer satisfaction has often been overlooked in hotel DEA studies despite its recognized importance in long-term hotel success (Demydyuk and Carlbäck, 2024; Ittner and Larcker, 1998; Srinivasan et al., 2005). Assaf and Magnini (2012) addressed this gap by framing customer satisfaction as the output of a hotel’s operational activities and emphasizing the input-to-satisfaction link. They found that integrating customer satisfaction into datasets produces different and more interpretable efficiency scores, acknowledging the broader role of satisfaction in driving repeat patronage and attracting new customers. This recognizes satisfaction as both an immediate output and a critical driver of future revenue. Accordingly, hotel performance can be conceptualized as a two-stage process in which operational inputs influence customer satisfaction, which in turn drives financial outcomes, a structure still underexplored in hotel efficiency research.
While Assaf and Magnini (2012) pioneering the integration of customer satisfaction into hotel DEA, subsequent research shifted toward broader financial and brand performance contexts rather than operational efficiency modelling. This provided considerable opportunities to expand their approach. Assaf and Magnini emphasized DEA’s ability to track efficiency changes over time and accommodate multiple outputs, features leveraged by later studies. We address the practical challenges identified in their study, such as incomplete ACSI coverage, and discuss how recent research has overcome this limitation using customer review data. Building on this foundation, we position customer satisfaction as an intermediate output linked to operational capabilities, advancing the integration of satisfaction into hotel DEA.
Online satisfaction ratings as a reflection of management capabilities
Customer satisfaction is a widely recognized but historically difficult-to-measure indicator in the hotel market. Online reviews on platforms such as TripAdvisor and Booking.com now play a central role in transient customer decision making, with travelers first checking overall satisfaction scores and then details on specific aspects of the stay (Boccali et al., 2022; J. Park and Lee, 2021). These reviews influence price sensitivity, and distinguish hotels with similar locations, prices, and facilities (Park and Kim, 2008; Park and Lee, 2021). Lockyer (2005) outlined the typical hotel selection process in which customers narrow options by location, price, and amenities before using online reviews to make a final choice.
From a revenue management perspective, hotels rely on dynamic pricing strategies that adjust rates based on booking patterns, relative to their forecasts (e.g., Chen and Kachani, 2007). This approach does not explicitly consider the current satisfaction ratings posted on websites, which are known to influence booking decisions simultaneously with pricing (Wang, 2012). From a cost management perspective, hotels must allocate resources efficiently to achieve customer satisfaction by maintaining the quality of rooms, food, and amenities without overspending (Arbelo et al., 2017; Assaf and Magnini, 2012; Brown and Ragsdale, 2002). While review scores are subject to biases such as extreme responses and non-representative sampling, they remain highly influential. As Phillips et al. (2015) and Srinivasan et al. (2005) emphasize, customers actively use these ratings to evaluate hotels, making them commercially impactful regardless of their methodological imperfections. From the customer perspective, the visibility of review scores is more important than their accuracy. Hotels cannot ignore these ratings, because they strongly influence booking decisions. Therefore, our study treats customer reviews as a practical measure of satisfaction that is directly linked to pricing and revenue potential.
Therefore, hotels need two critical capabilities: Cost-Satisfaction (C-S) capability – the ability to deliver high satisfaction cost-effectively, and Satisfaction-Revenue (S-R) capability – the ability to leverage review scores to attract transient customers. We develop a two-stage analytical model to capture how cost management shapes satisfaction, which, in turn, drives future bookings and revenue, as depicted in Figure 1. Conceptual model of customer satisfaction efficiency in hotel operations.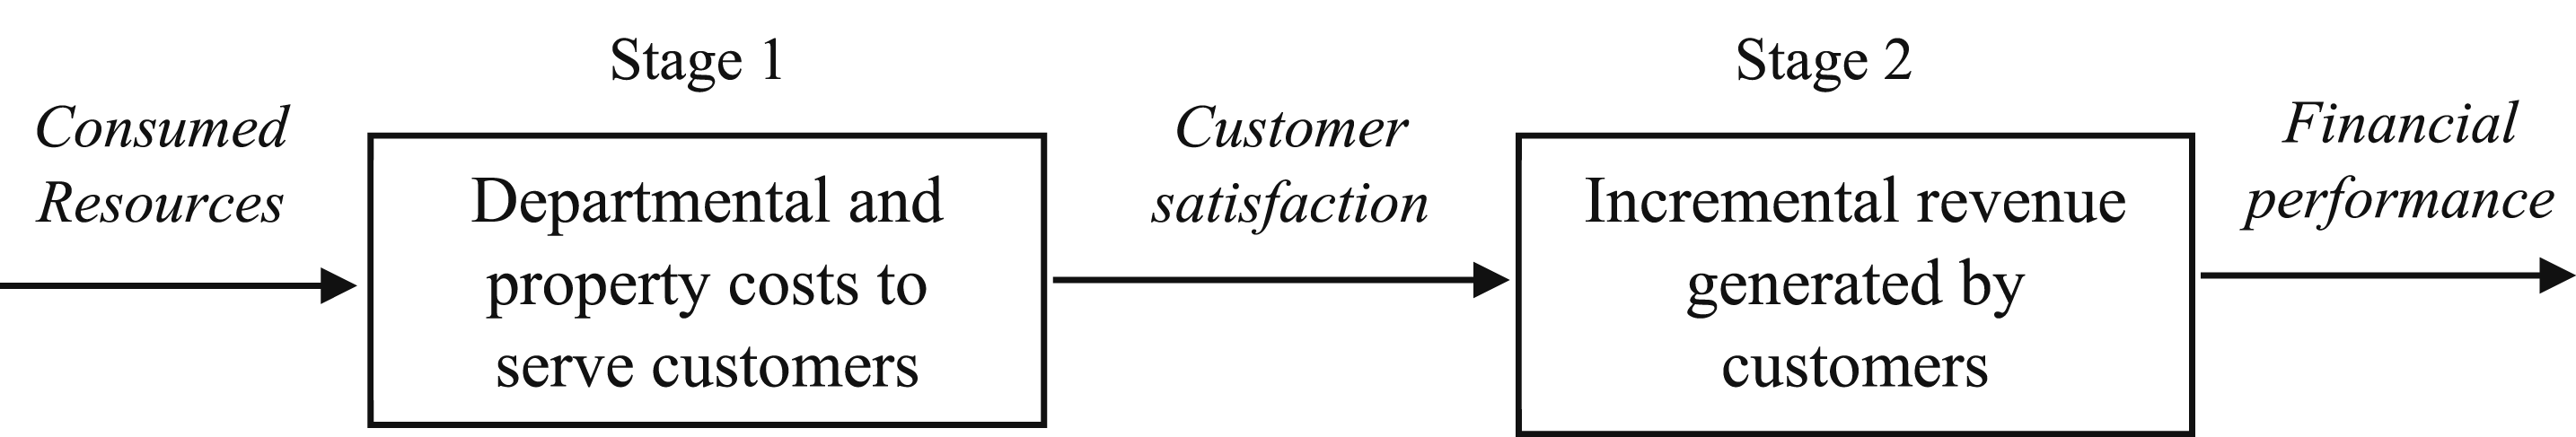
Hotel efficiency research
A significant body of research has examined hotel performance and capabilities using efficiency methods such as DEA and stochastic frontier models, with most focusing on overall efficiency in using resources and costs to generate revenues and volumes (Arbelo et al., 2017; Assaf and Agbola, 2011). A smaller stream incorporates customer satisfaction into efficiency analysis (Assaf and Magnini, 2012; Boccali et al., 2022; Morey and Dittman, 1995). Assaf and Magnini (2012) compared DEA models with and without customer satisfaction and found that average efficiency increased from 81% to 89% when satisfaction was included. Few efficiency studies have explicitly considered hotels’ capabilities (Kim and Chung, 2022; Yin et al., 2020). Recent studies have highlighted the need for holistic views on how activities jointly drive costs, revenues, and satisfaction, including Cugini et al. (2007) holiday resorts and Nemeschansky (2020) restaurants, showing a frequent misalignment between resources and the satisfaction they generate.
Summary of studies using DEA models on hotel data.

Despite the range of perspectives in prior studies, their approaches have limitations in assessing revenue and cost capabilities that integrate customer satisfaction; gaps this study aims to address when designing its DEA model. First, as Table 1 shows, most existing models adopt a full-production perspective, including fixed assets from historical investment decisions. Fixed assets are difficult to adjust, and may not reflect managerial responses to shifts in customer satisfaction. Fixed assets span multiple years and operating expenses are incurred annually, creating a temporal mismatch (Cui et al., 2025). Cui et al. (2025) caution that firm-level models often include supporting activities that are not directly tied to customer-facing performance, thus diluting relevance for operational decision-making. Accordingly, this study excludes fixed assets and uses department-level revenue and costs to focus on managers’ capabilities. Additionally, we disaggregated hotel revenue into rooms, food and beverage (F&B), and amenities, allowing for an analysis of how hotels align these streams with associated costs based on strategic priorities.
Second, we address the shortcomings of customer satisfaction data. Prior research uses metrics such as the ACSI (Assaf and Magnini, 2012), J.D. Power’s Hotel Guest Satisfaction Index (Kim and Chung, 2022), or internal satisfaction measures (Brown and Ragsdale, 2002). This highlights a historic hurdle in SMA research: external metrics may lack property-level precision, whereas internal metrics may lack consistency. For example, ACSI is an aggregate brand index that limits its value for property-specific analysis. We address these gaps by using customer satisfaction scores from user-generated online reviews, which are readily available as large datasets. As Boccali et al. (2022) note, DEA can support value-based pricing through online data. Unlike their study, which focused on individual satisfaction attributes, our study used overall satisfaction ratings from booking websites.
Third, we focus on evaluating distinct capabilities, not just overall efficiency. Network DEA models aim to unpack the ‘black box’ of production by examining the separate stages. Kao (2014) recommended a two-stage approach to identify where inefficiencies arise, noting that an overall efficient system may contain inefficient components. Independent models typically estimate efficiencies separately. We designed the selection of inputs and outputs in our network DEA model to capture different efficiency measures. Relevant to this study, Yin et al. (2020) and Kim and Chung (2022) examined different hotel functions. Yin et al. (2020) conceptualized hotel performance as comprising operations and marketing, with operations using physical measures (e.g., number of employees, rooms, and F&B floor space) to generate occupancy and F&B service scores, and marketing using those scores along with marketing expenses to produce room and F&B revenue. Kim and Chung (2022) defined performance as service productivity (how resources generate customer satisfaction) and service effectiveness (how satisfaction drives occupancy, ADR, and RevPAR). We follow the overall approach of Kim and Chung (2022), whose distinction between service productivity and effectiveness aligns with our focus on cost and revenue management capabilities. However, we use department-level revenue and costs, excluding fixed assets and aggregate revenue measures. We also applied a two-stage model that separates customer satisfaction from financial outputs, unlike Assaf and Magnini (2012), who includes satisfaction, total revenue, and occupancy as outputs, thus enabling trade-offs between satisfaction and revenue. Our aim is to evaluate distinct capabilities to improve overall firm performance.
Methodology
Sample and datasets
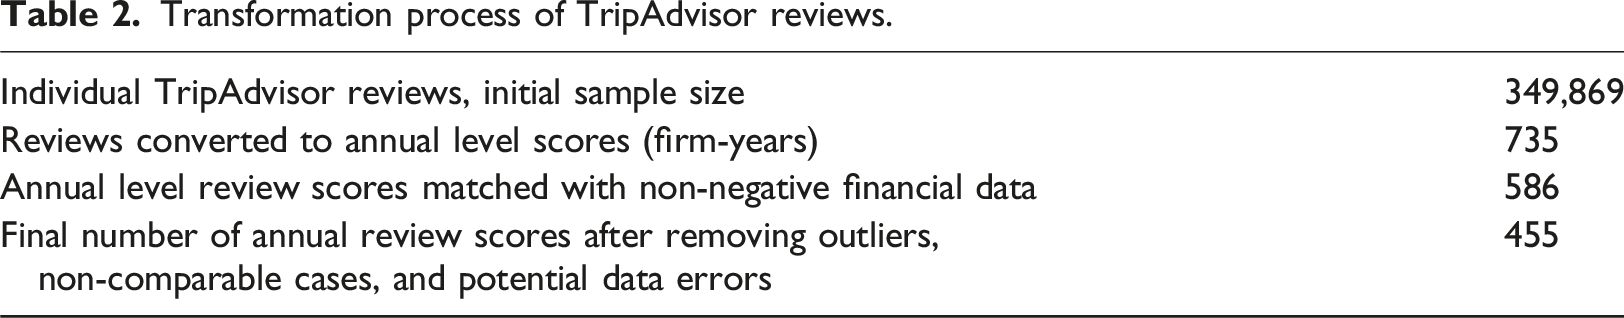
The initial sample covers 263 corporate-owned hotels from six publicly listed U.S. hotel chains using two datasets matched through unique identification numbers (ID), anonymized, and merged. The list of owned and managed properties was manually collected from the 10-K statements 2 of the SEC Edgar database to guide the data collection. The first dataset comprised annual STR Host Reports containing detailed operating (e.g., average occupancy rate and room nights sold), cost, revenue, and profitability information formatted by USALI 11 3 . The anonymization restrictions imposed by the data provider meant that the hotel brand or parent corporation was not identifiable. The accounting data initially consisted of 1549 firm-year data points. Revenue and cost data were organized into three main departments: Rooms, F&B, and Amenities. The second dataset consisted of Internet customer reviews collected from the TripAdvisor website using a PHP 7.4 web crawler. The data included user ratings and comments for overall satisfaction, and individual categories rated from one to five. Each entry included the review date and hotel name, enabling the assignment of a unique hotel ID. The STR removed review text and titles to ensure hotel anonymity. The number of individual reviews from 2015 to 2021 was 349,869.
Dataset matching was performed using STR via the assignment of SHARE ID to each firm-year’s financial data and individual reviews. To match hotel ratings to the accounting data, we aggregate individual review ratings at the reviewer level to the firm-year level by calculating the average ratings of the reviews collected for the given hotel and year. This process resulted in 735 matched data points for 7 years (2015-2021).
The appendix provides detailed information on the selection and definition of variables (Remark A1b and Table 1(A1a), respectively). In the period 2015-2021, we defined 2019 as the benchmark pre-COVID-19 year for hotel performance. Moving backward, the 2015-2018 period analyzes performance during a time of stability. Moving forward, 2020 and 2021 analyze the under-demand-shock period.
Preparation of data for DEA modelling
First, we addressed DEA homogeneity requirements by selecting hotels with comparable strategies aligned with the benchmarking logic of the SMA. Cui et al. (2025) warned that heterogeneous accounting data can obscure important contextual differences and risks when comparing dissimilar units. All properties were U.S.-based and part of hotel chains in the upscale and upper-upscale segments. Midscale and luxury hotels were excluded because of their small number and distinct pricing. Only hotels offering food, beverages, and amenities were included, and those with missing revenues or costs in these areas were excluded.
Second, firm-years with missing or negative values in the variables were excluded, as the DEA was designed to analyze only positive values (Dyson et al., 2001; Tone et al., 2020). Specifically, hotel years with missing or zero departmental revenues, as well as those with negative EBIT, were manually removed, reducing the sample to 586 observations (see Online Appendix Remark A2a). These exclusions, while focusing the analysis on financially viable chain hotels with at least some service offerings, inevitably introduced biases into the dataset. Removing firm-years with negative EBIT introduces survivorship bias and may lead to inflated efficiency scores. Similarly, excluding observations without reported F&B or amenities revenue or costs creates a selection bias by limiting the dataset to hotels that actively operate these departments. Nevertheless, the data capture realistic conditions faced by hotels operating in competitive markets. The sample includes marginally profitable hotels with low but positive EBIT, levels often insufficient for long-term survival, and also contains limited-service properties that, while lacking full facilities such as restaurants or spas, still report reduced F&B and amenities operations.
Third, we reviewed and removed outliers and potential data entry errors, as they can distort the frontier, making normal, well-performing units appear inefficient compared with the unrealistic standard set by the outlier. Outliers can arise when a hotel’s performance in a given year far exceeds industry standards, which we review in two phases. We first examined hotel ratios to identify whether each hotel had plausible data with respect to its own information, identifying cases with unusually high ratios or hotels with results that appear inconsistent across years. We next identified outliers based on the box-whisker method, defining them as observations that exceeded 1.5 × the interquartile range 4 (i.e., Q3 + 1.5 IQF and Q1 – 1.5IQF). See Online Appendix A2b for the detailed remarks.
Transformation process of TripAdvisor reviews.
Descriptive statistics of Variables (scaled by POM).
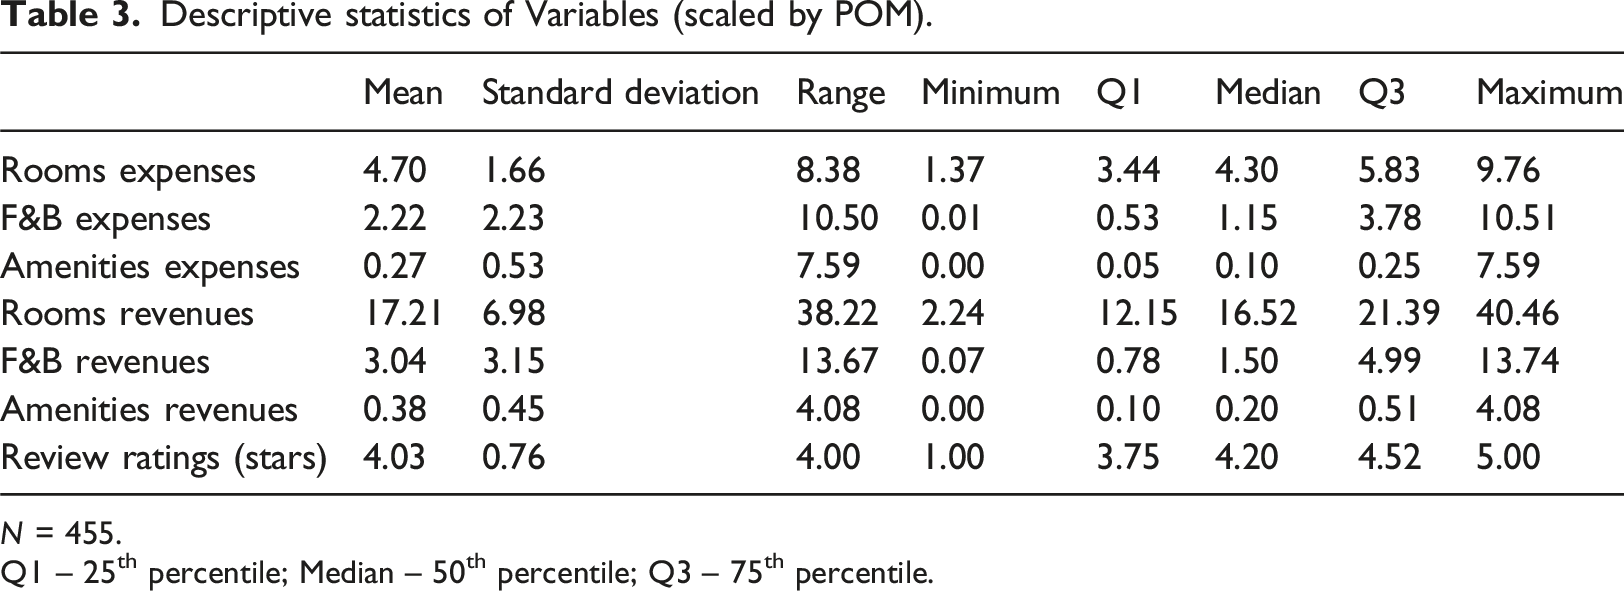
N = 455.
Q1 – 25th percentile; Median – 50th percentile; Q3 – 75th percentile.
Analytical model and variables
To operationalize the conceptual model of this study, as presented in Figure 1, we use a two-stage Network DEA model, as shown in Figure 2. Stage 1 measures how efficiently hotels convert inputs (costs) into an intermediate outcome (satisfaction), termed C-S efficiency. Stage 2 assesses how efficiently satisfaction translates into revenue, which is termed S-R efficiency. The definitions and selection of the variables are provided in Online Appendix A1. Two-stage analytical model of customer satisfaction efficiency in hotels. Note: The X, Z, and Y, represent the data matrices of inputs of Stage-1, intermediate product, outputs of Stage-2, respectively.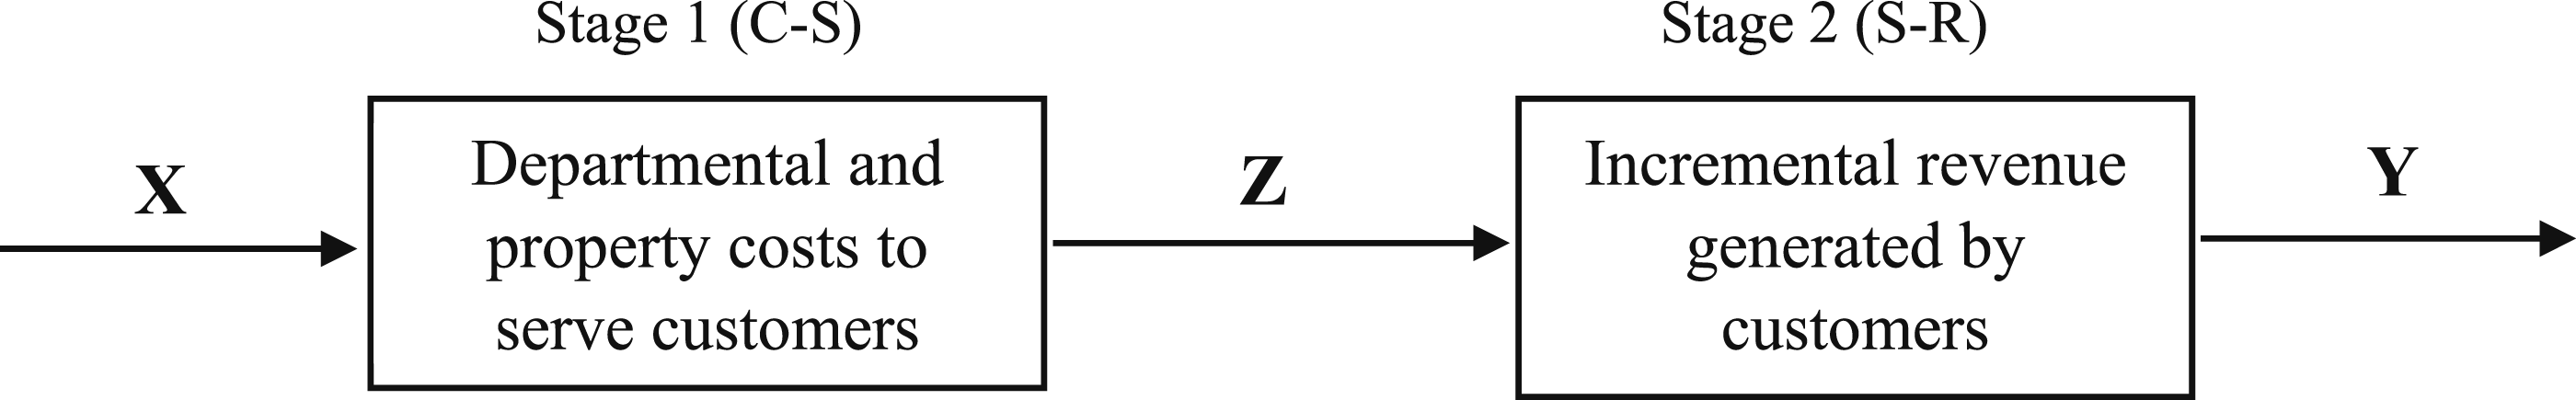
Output factor (Y): The revenue generated by the hotel’s core operations, room revenue, F&B revenue, and amenities. Input factor (X): To match input to output, we used the costs associated with the core revenue streams, including total room expenses, total F&B expenses, and total amenity costs. Intermediate factor (Z): Customer satisfaction proxied by the overall satisfaction rating on TripAdvisor. For each hotel, we calculated the annual mean of all the review ratings. These ratings capture the customer perceptions that influence booking decisions. Satisfied customers are more likely to return, pay premium rates, and spend on non-core services such as F&B and amenities, while dissatisfied customers look elsewhere. Thus, customer review ratings serve as an important intermediate variable for evaluating hotels’ resource-utilization efficiency.
As Figure 2 shows, we focus on areas where managers can take short-term action exclusively, using departmental cost and revenue data. This indicates that factors such as room count, brand image, and facility quality are largely fixed and not easily adjusted in response to customer satisfaction. Cui et al. (2025) warned that mixing multiyear fixed assets with annual expenses obscures cost-revenue relationships and introduces heterogeneity, especially when firm-level data include broader support activities. Therefore, we also exclude other operating costs such as utilities, support staff wages, insurance, and maintenance, prioritizing core hotel operations (rooms, F&B, amenities). This focus on financial data ensures alignment with our research objectives and allows for a clearer assessment of the operational performance.
It is important to note that customer reviews use a 1-5 ordinal scale, which does not reflect hotel size. To account for this, we scale all expenses and revenues by dividing them by Total Property, Operation, and Maintenance (POM) expenses, which reflect both property scale and investment needs (Online Appendix Remark A2c). Kruskal-Wallis tests were used to assess whether scaling by Total POM addressed sample heterogeneity, indicating that this scaling method effectively accounted for differences in hotel size, quality, and unique characteristics (Remark A2d).
We also examine the cost-to-revenue (C-R) efficiency to assess the added information from customer reviews. The C-R efficiency aligns with prior studies that examine how hotels convert costs into revenue, reflecting a traditional financial efficiency approach (Cui et al., 2025). This enables comparisons across three efficiency dimensions: cost-to-satisfaction (C-S), satisfaction-to-revenue (S-R), and cost-to-revenue (C-R). The two-stage model treats satisfaction as both an outcome of resource use and a revenue driver, revealing that a single-stage C-R model may miss. We report these additional C-R findings along with our main results.
To test whether efficiency differences across years were statistically significant, we supplemented the DEA with non-parametric Mann–Whitney U and Kruskal–Wallis tests. Widely used in DEA studies, these tests suit unbalanced panel data and allow group-level comparisons without distributional assumptions.
Findings
Descriptive statistics for efficiency scores.
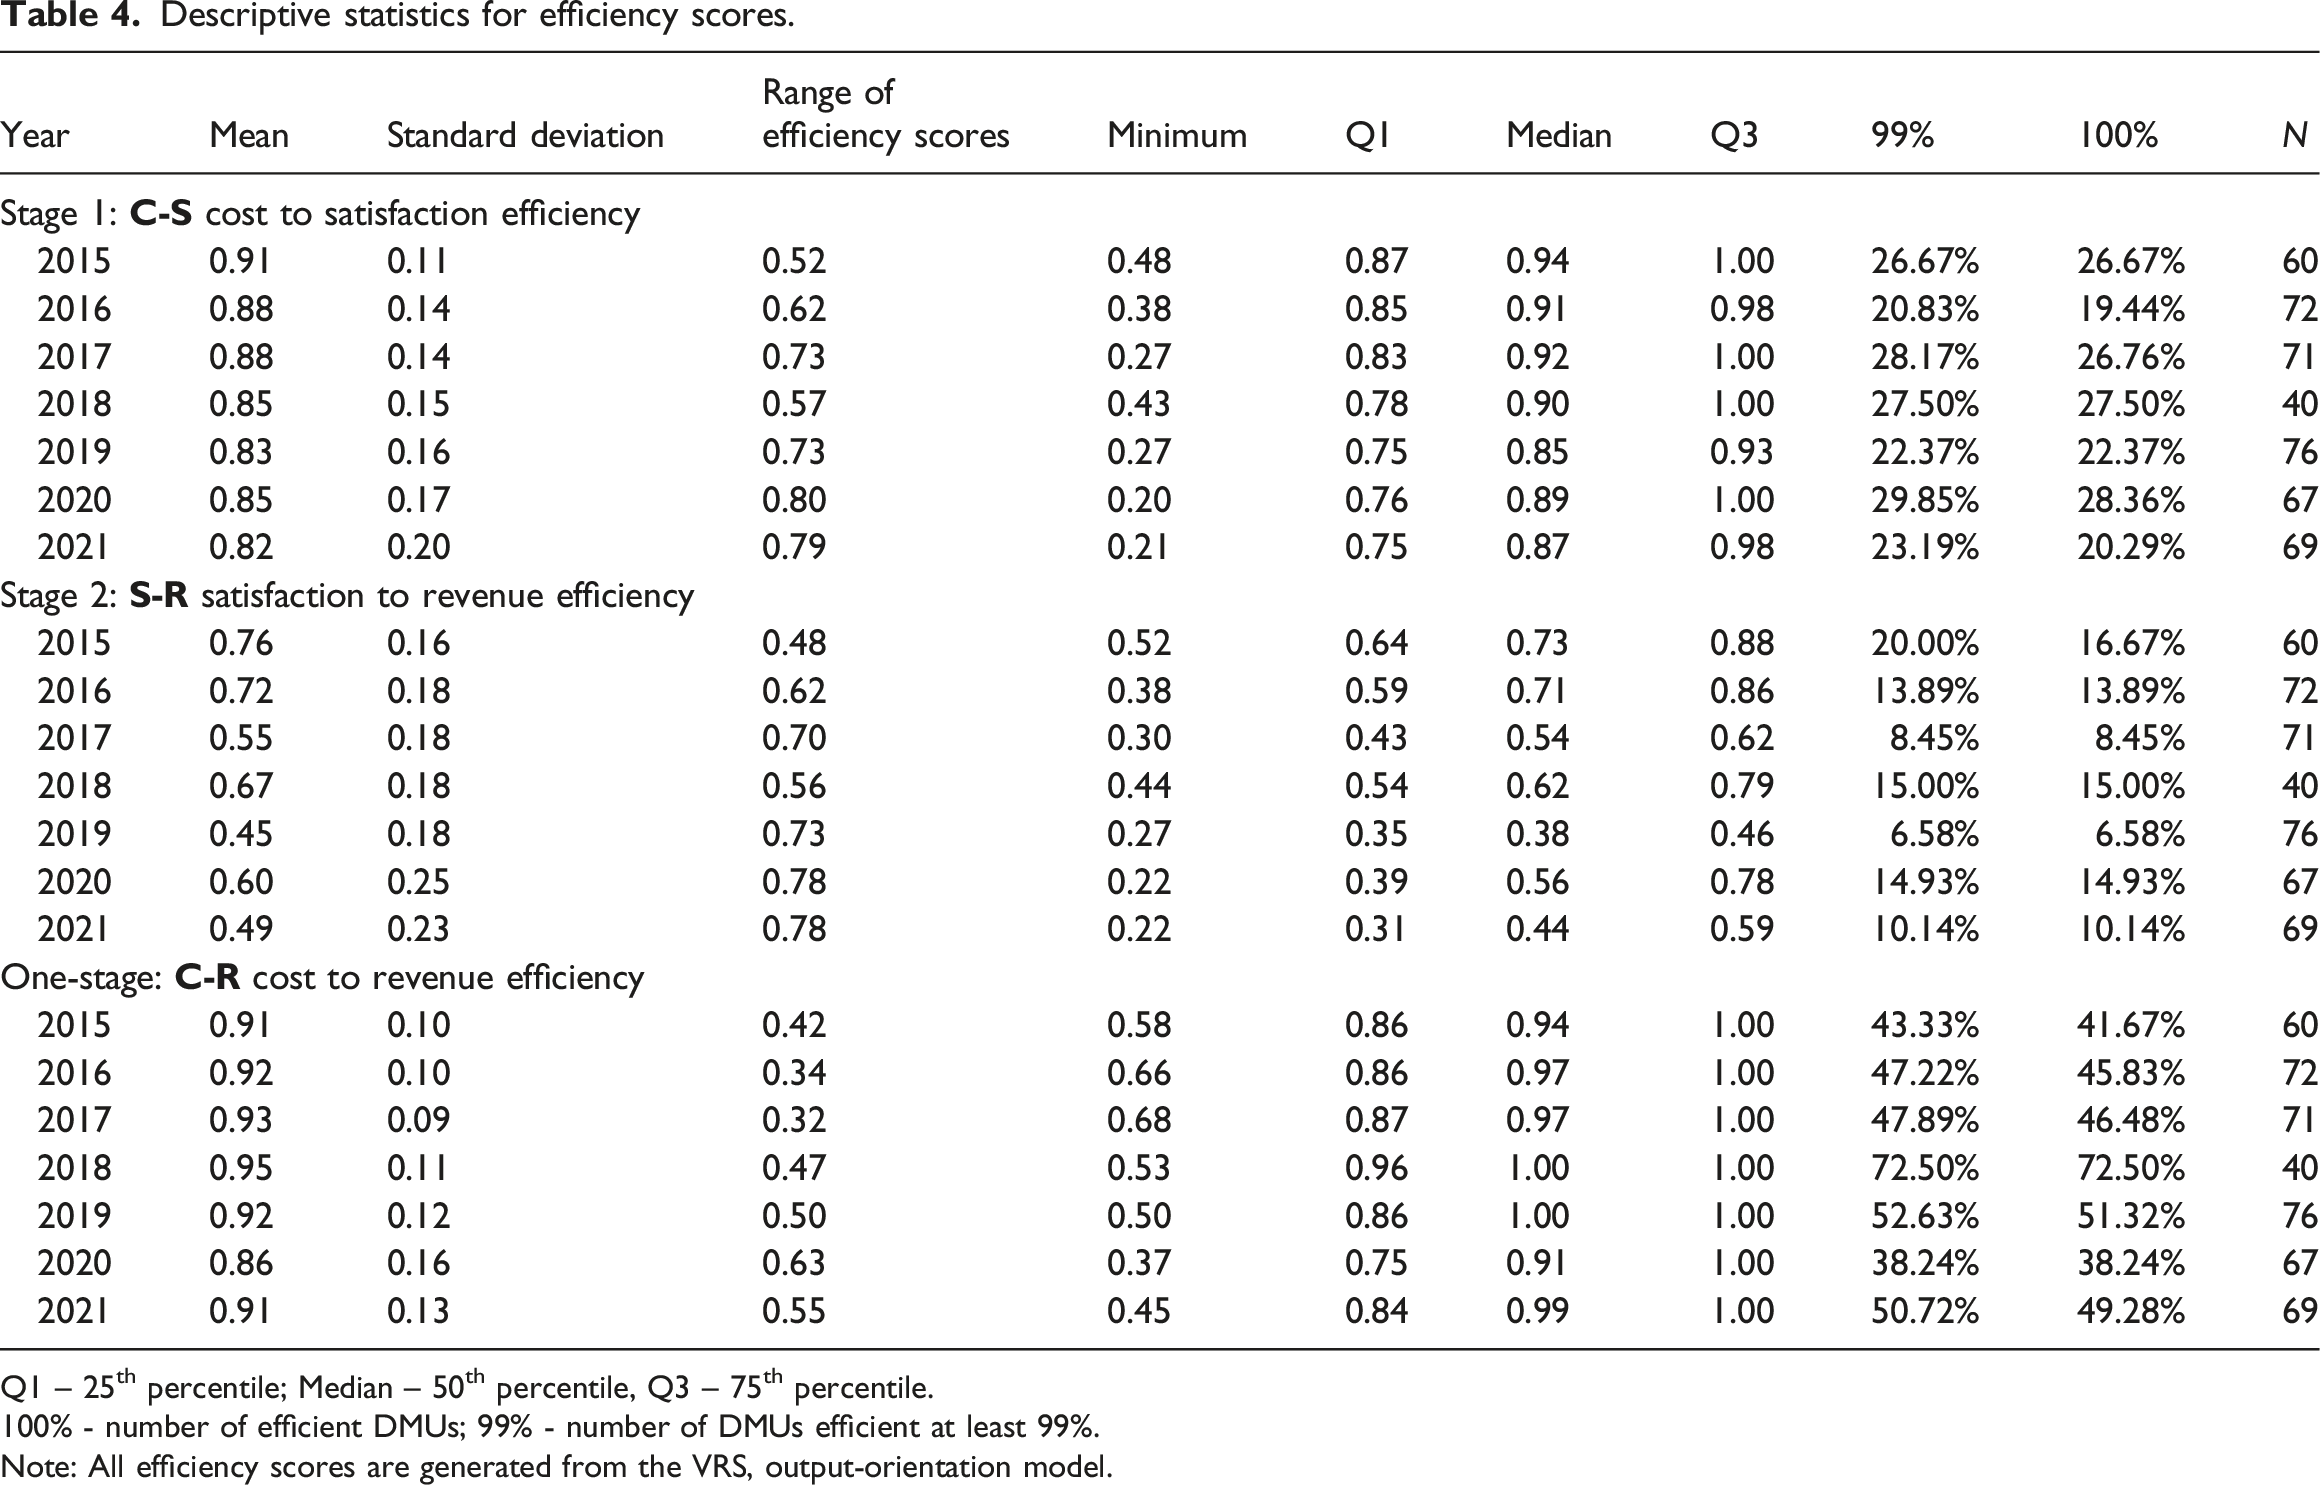
Q1 – 25th percentile; Median – 50th percentile, Q3 – 75th percentile.
100% - number of efficient DMUs; 99% - number of DMUs efficient at least 99%.
Note: All efficiency scores are generated from the VRS, output-orientation model.
Baseline year 2019
Figure 3 illustrates the analysis conducted in 2019. The x-axis plots the C-S efficiency and the y-axis plots the S-R efficiency. Each point represented a separate hotel. For example, the upper- and left-most hotels achieved an S-R efficiency score of 1 (100%), indicating that they generated the highest observed revenue relative to their peers, with similar satisfaction scores. However, the hotel has a C-S efficiency score of 0.27, meaning that it operates at only 27% efficiency compared to its best-performing peers in converting costs into customer satisfaction. This suggests a substantial opportunity for improvement (up to 73%) in how effectively input costs are transformed into guest satisfaction. C-S and S-R efficiency plot for 2019.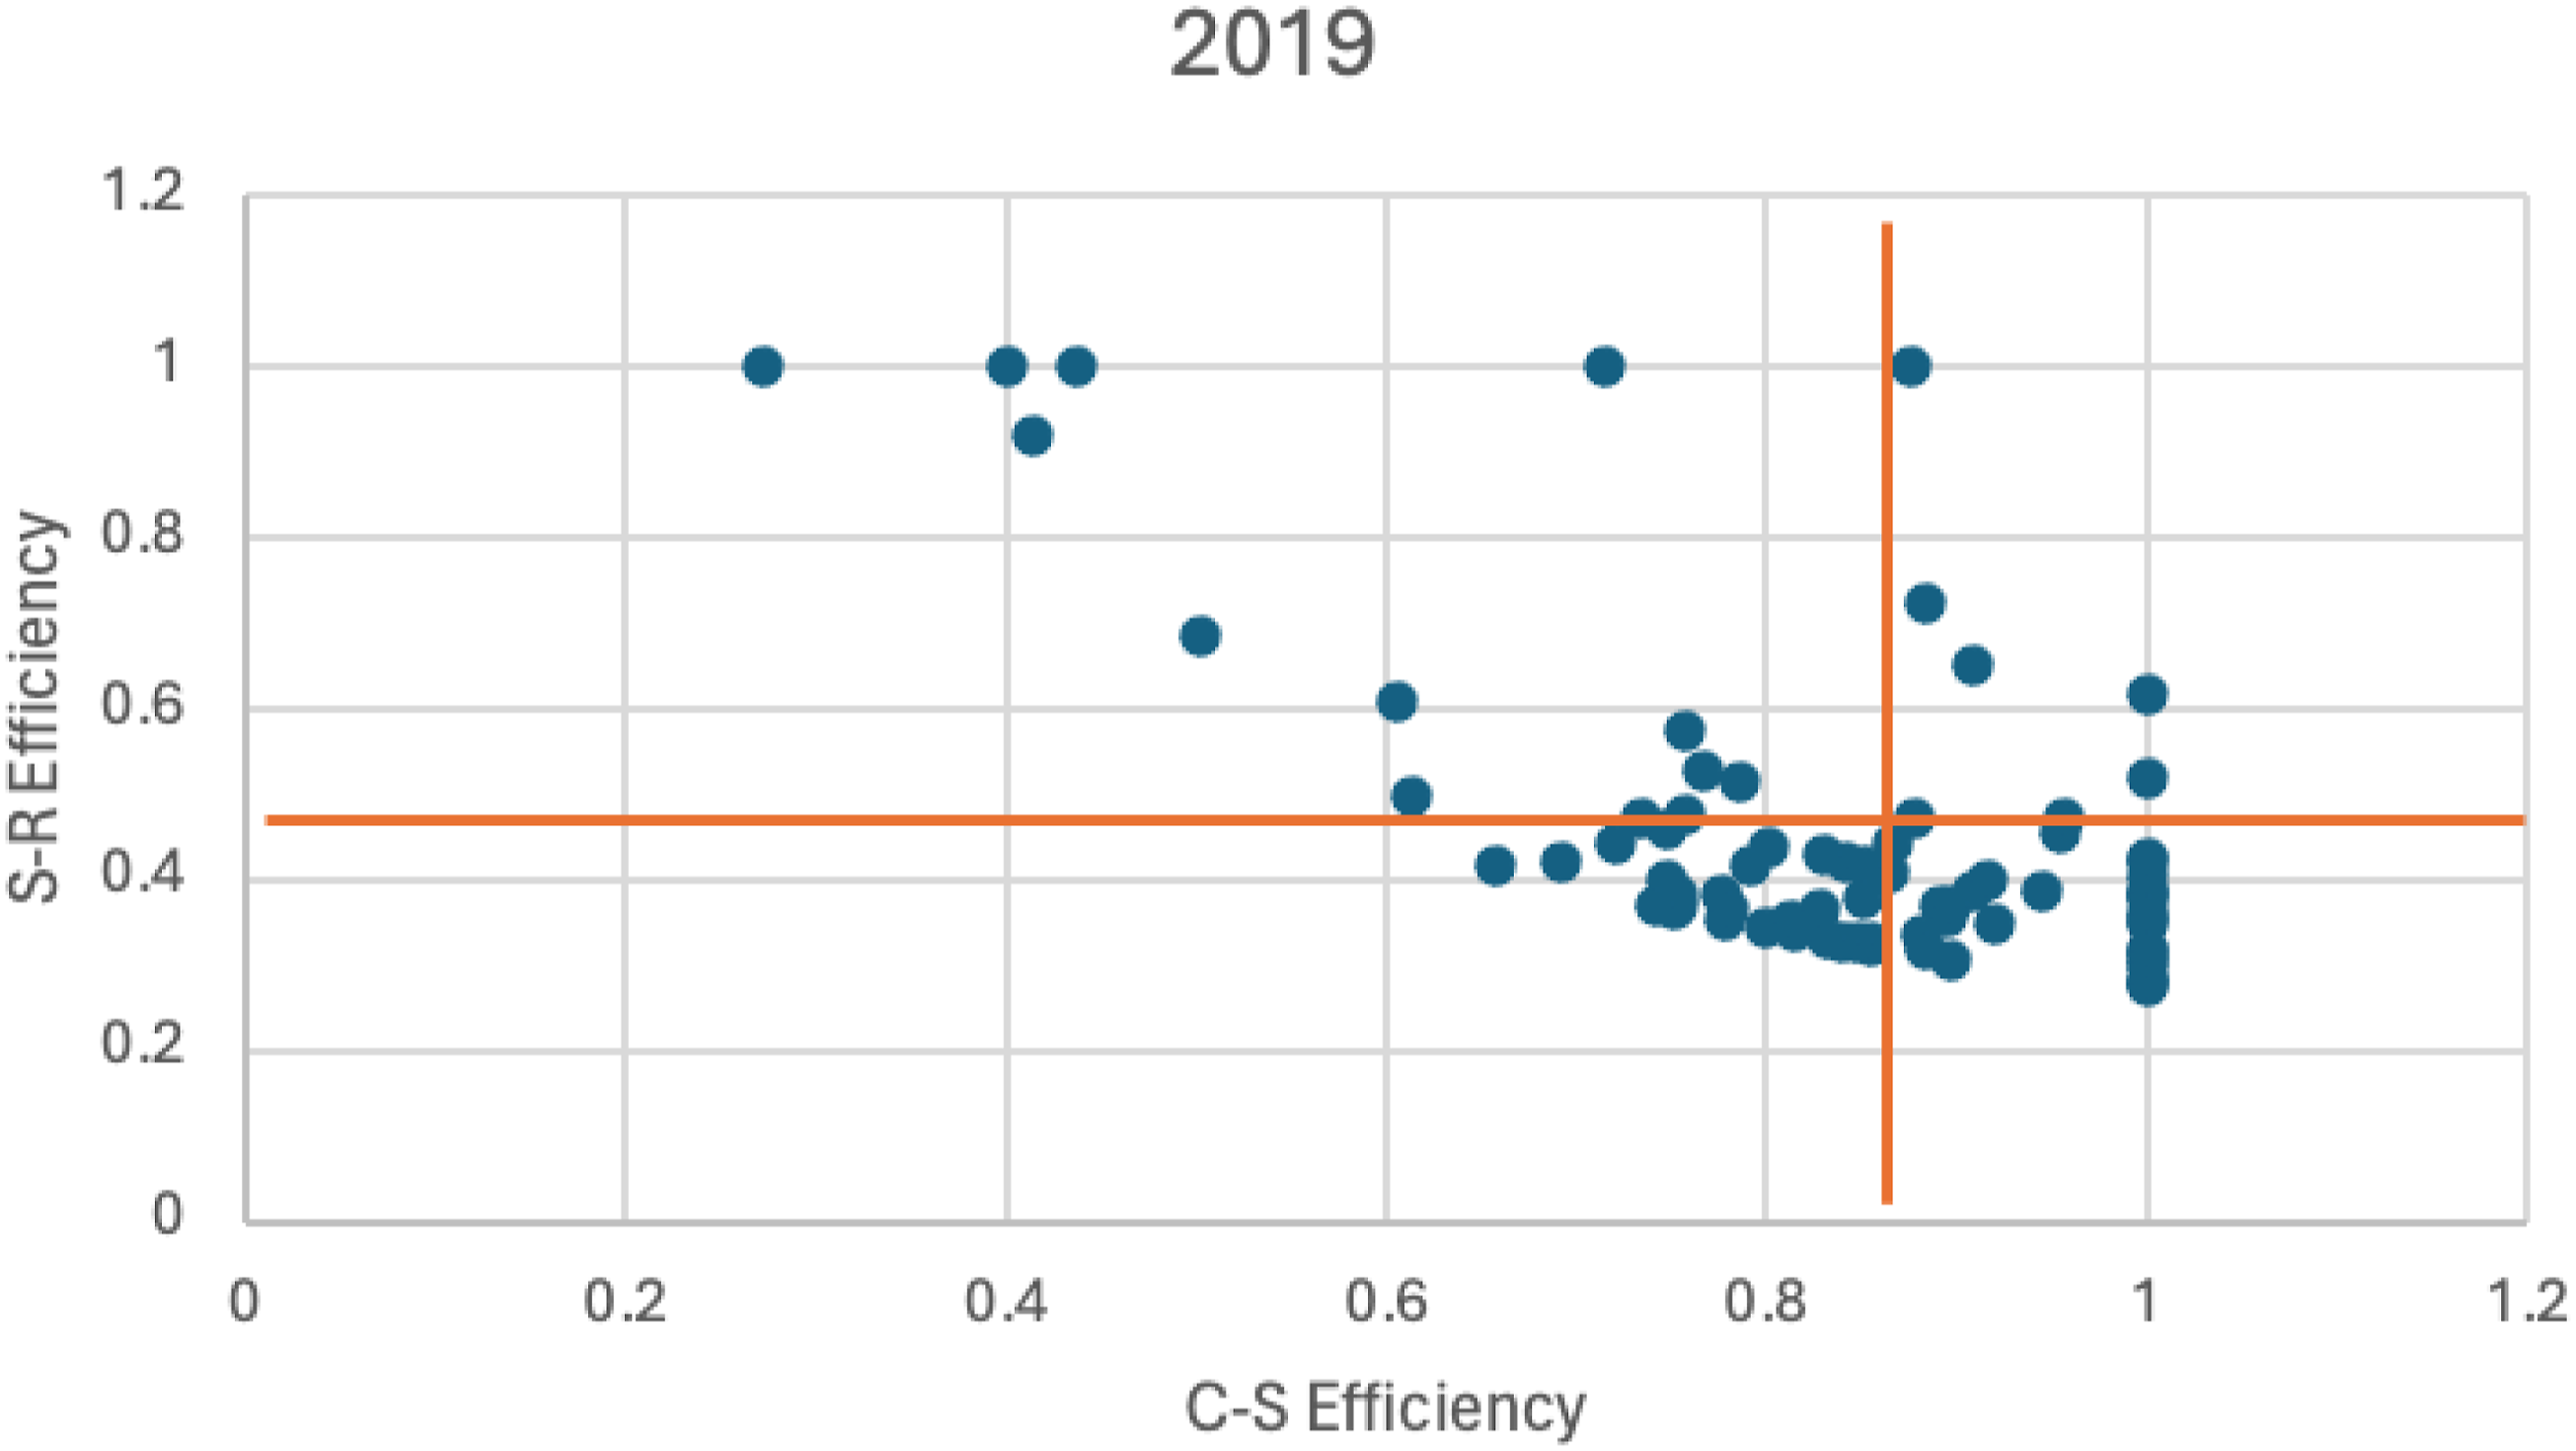
To support the interpretation of the mean efficiency scores, we provided C-S and S-R plots, which allowed us to observe the relative efficiencies across the sample (Figure 4). DEA estimates the mean efficiencies based on relative performance. Low mean efficiency indicates that hotels significantly exceed the performance of other hotels, thereby reducing average efficiency. A high mean efficiency for a given year indicates that hotels performed well relative to top performers, on average. The orange lines plot the means for C-S (vertical line) and S-R efficiency (horizontal line). C-S and S-R efficiency plots for 2015 to 2021.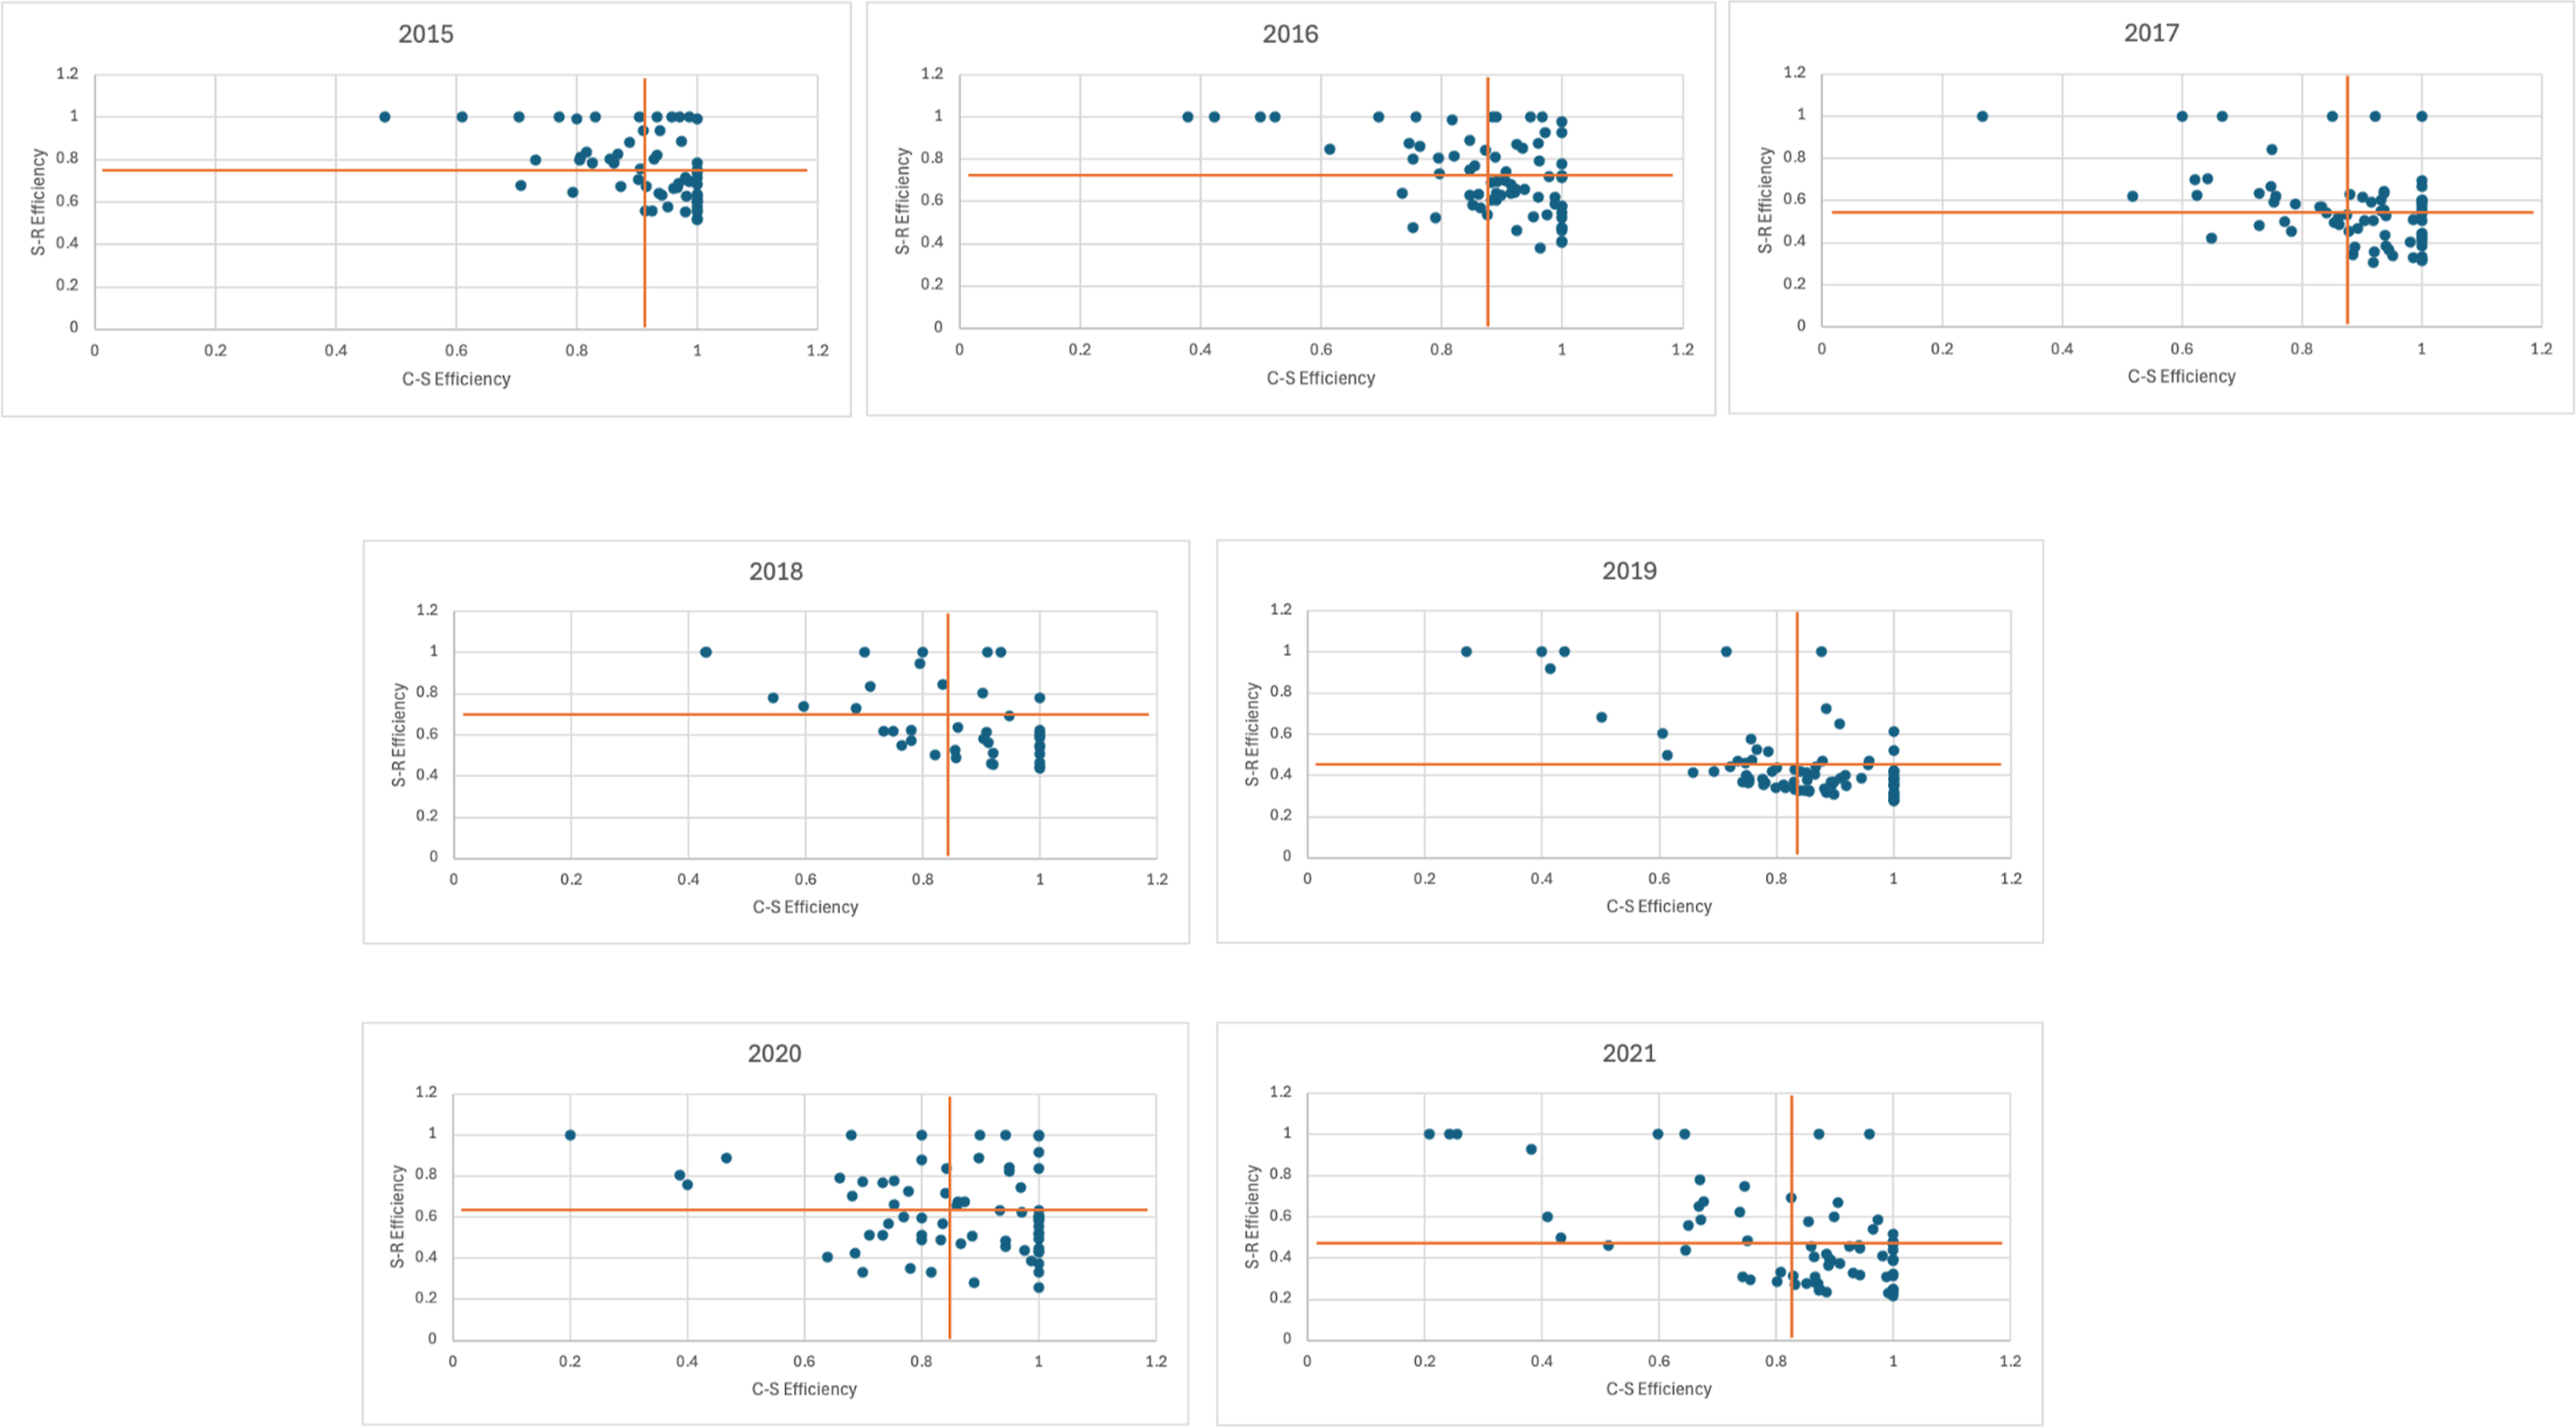
In 2019, mean C-S efficiency was 0.83 (SD 0.15), indicating hotels performed with similarly high efficiency in converting cost expenditure into customer satisfaction relative to top-performing hotels. In contrast, when considering how hotels convert customer satisfaction into revenue, mean S-R efficiency was 0.45 (SD 0.18), identifying the best-performing hotels did so at a much better rate compared to the wider sample. For 2019 we observe a large cluster of hotels in the bottom right of the graph, with high C-S efficiency (0.83 or higher) but low S-R efficiency (0.45 or lower). This clustering shows that most hotels in the sample achieved similar levels of performance, characterized by high C-S but low S-R efficiency. One implication is that these hotels need to emphasize their revenue capabilities and look at top performers to consider what improvements might be appropriate. In 2019, another observation was that there were hotels that achieved full S-R or C-S, but no hotels had full efficiency in both. This is because hotels need to outperform competitors in both cost-to-satisfaction and satisfaction-to-revenue to be fully efficient. Increased competition places pressure on revenue and costs, meaning that fewer hotels can significantly outperform others in both aspects.
Main sample (2015-2021)
Mean efficiencies 2015-2021.
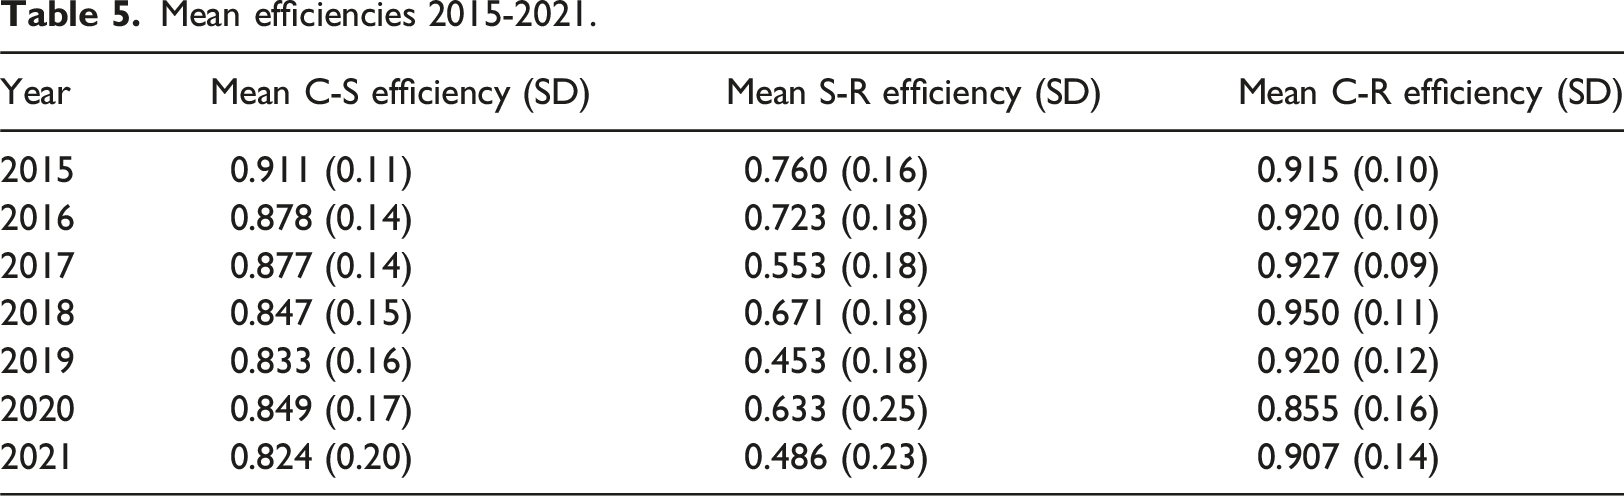
We observed a small overall decreasing trend in cost efficiency and a large decrease in revenue efficiency (from 0.76 in 2015 to 0.49 in 2021). This finding suggests that the hotel industry demonstrates a relative consistency in its ability to produce satisfaction from costs. By contrast, the scores vary significantly in terms of efficiency in producing revenue from satisfaction. The way to interpret this decreasing trend in scores is that, on a year-to-year basis, there is an increasing deviation in S-R efficiency between top-performing hotels and all others. In other words, the best hotels are improving faster (or declining more slowly) than the industry average.
Figure 5 presents the efficiency plots for 2015-2021, illustrating the year-to-year patterns of the hotel efficiency scores. Across all years, a similar triangular pattern was evident, with no hotels exhibiting very low C-S and S-R efficiency scores. 2015 and 2016 showed the least dispersion, indicating that the best-performing hotels did not substantially outperform the rest of the industry. From 2017 to 2019, the distribution began to widen, with greater clustering of hotels achieving high C-S efficiency but low S-R efficiency. Graph of mean efficiencies.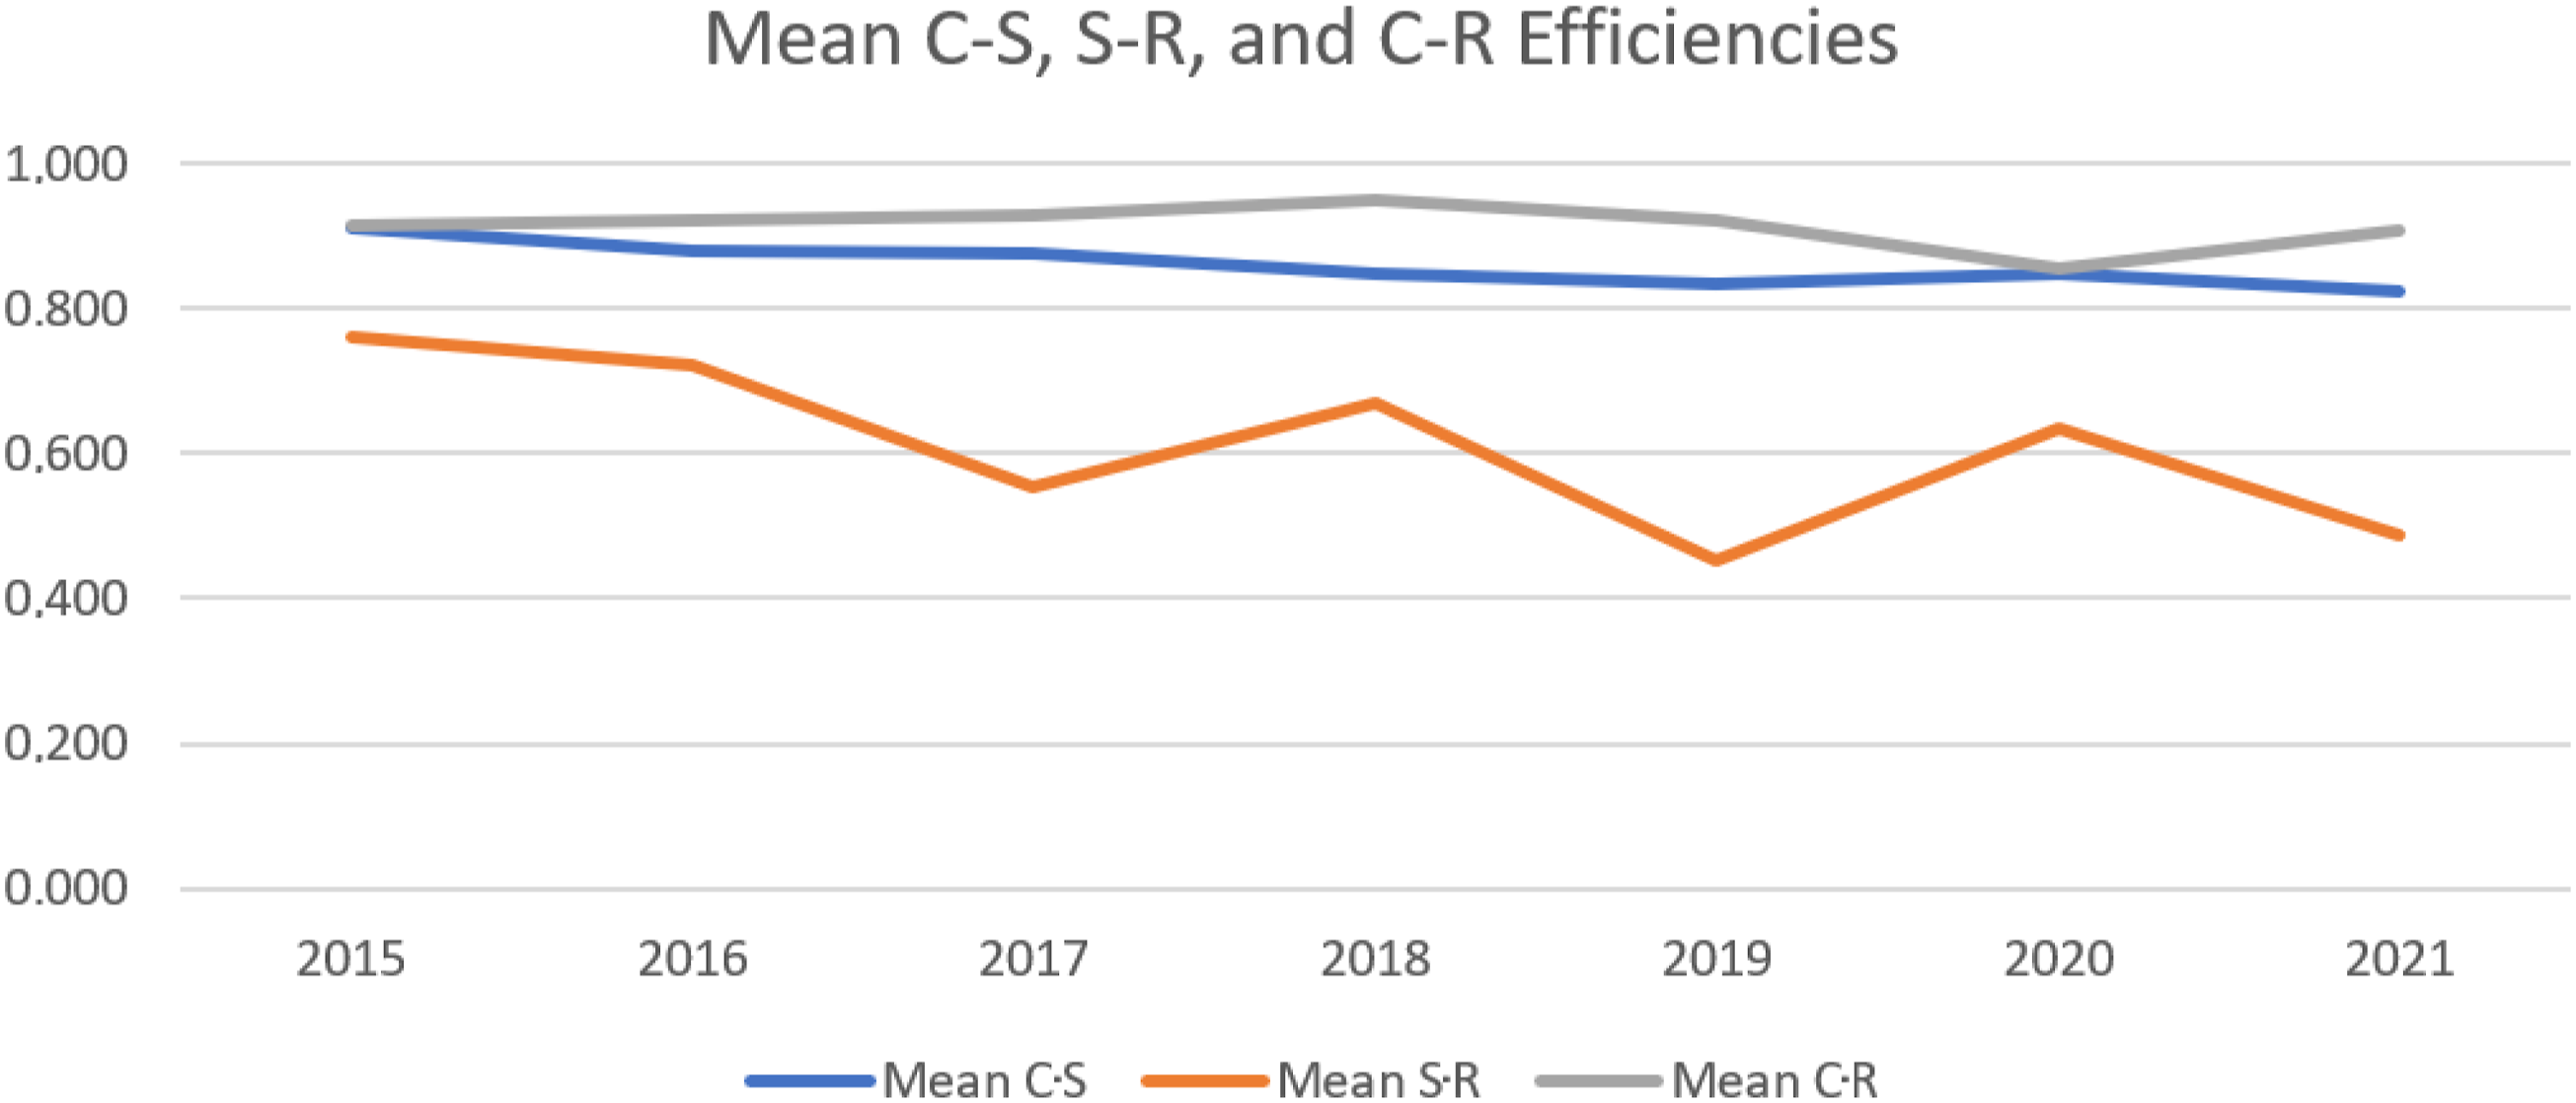
During the stability period, this range was highest in 2019, signifying that the best performers were able to achieve significantly higher efficiency scores. The dispersion was greater in terms of S-R efficiency than the C-S efficiency. While 2019 was regarded as a benchmark year for the travel and leisure industry, the analysis indicates that the selected hotels were able to far exceed performance in terms of leveraging customer satisfaction.
In 2020 and 2021 (crisis years following the COVID-19 demand shock), dispersal across the range of C-S and S-R efficiencies increased. This means large variances, where top performers outperform the industry, reinforce the declining S-R scores. This could potentially be explained by the fact that all hotels were grappling to simultaneously cut costs, keep customers happy, and compensate for low occupancies at higher prices; however, some of them might have better management skills and/or a more relaxed COVID-related environment. In 2020, the mean S-R score was 0.60, declining to 0.49 in 2021. This shows that as conditions begin to stabilize, some hotels are once more able to maximize revenue relative to other hotels with the same satisfaction rating.
Our comparison of C-R, C-S, and S-R is important because it reveals that performance differences are primarily driven by revenue, whereas cost management capabilities relative to review scores appear relatively uniform across the industry. Table 5 and Figure 5 indicate consistently high average efficiency scores for C-R across all years, suggesting that top performers do not substantially outperform the rest of the industry. The lowest score was recorded in 2020, reflecting disruption caused by COVID-19. The graph of the mean efficiencies over time shows that the C-S and C-R efficiencies follow a similar trajectory, with C-R maintaining a slight advantage. In contrast, a more pronounced gap was observed between C-R and S-R averages.
Additional analysis – industry-plateau effect
To assess the robustness of our findings and the influence of DEA’s mechanical structure, we report an additional analysis that scales cost and revenue data by room nights sold instead of Total POM expenses. This test highlights how the inherent tradeoffs in DEA efficiency scores reflect consistent industry markups between cost and revenue per room. The results, detailed in Online Appendix Remark A4a, reveal a systematic pattern: hotels operating near the industry-average markup tend to display an inverse relationship between cost-to-satisfaction and satisfaction-to-revenue efficiency. This supports our interpretation that DEA efficiency scores reflect not only performance variation, but also structural constraints shaped by pricing strategy and positioning within the market. As Figure 6 shows, some hotels perform above the industry-average plateau, indicating that they exceed the typical markups. The plateau itself reflects a baseline in which most hotels operate with standard cost–revenue ratios. Industry plateau as seen in 2021 results.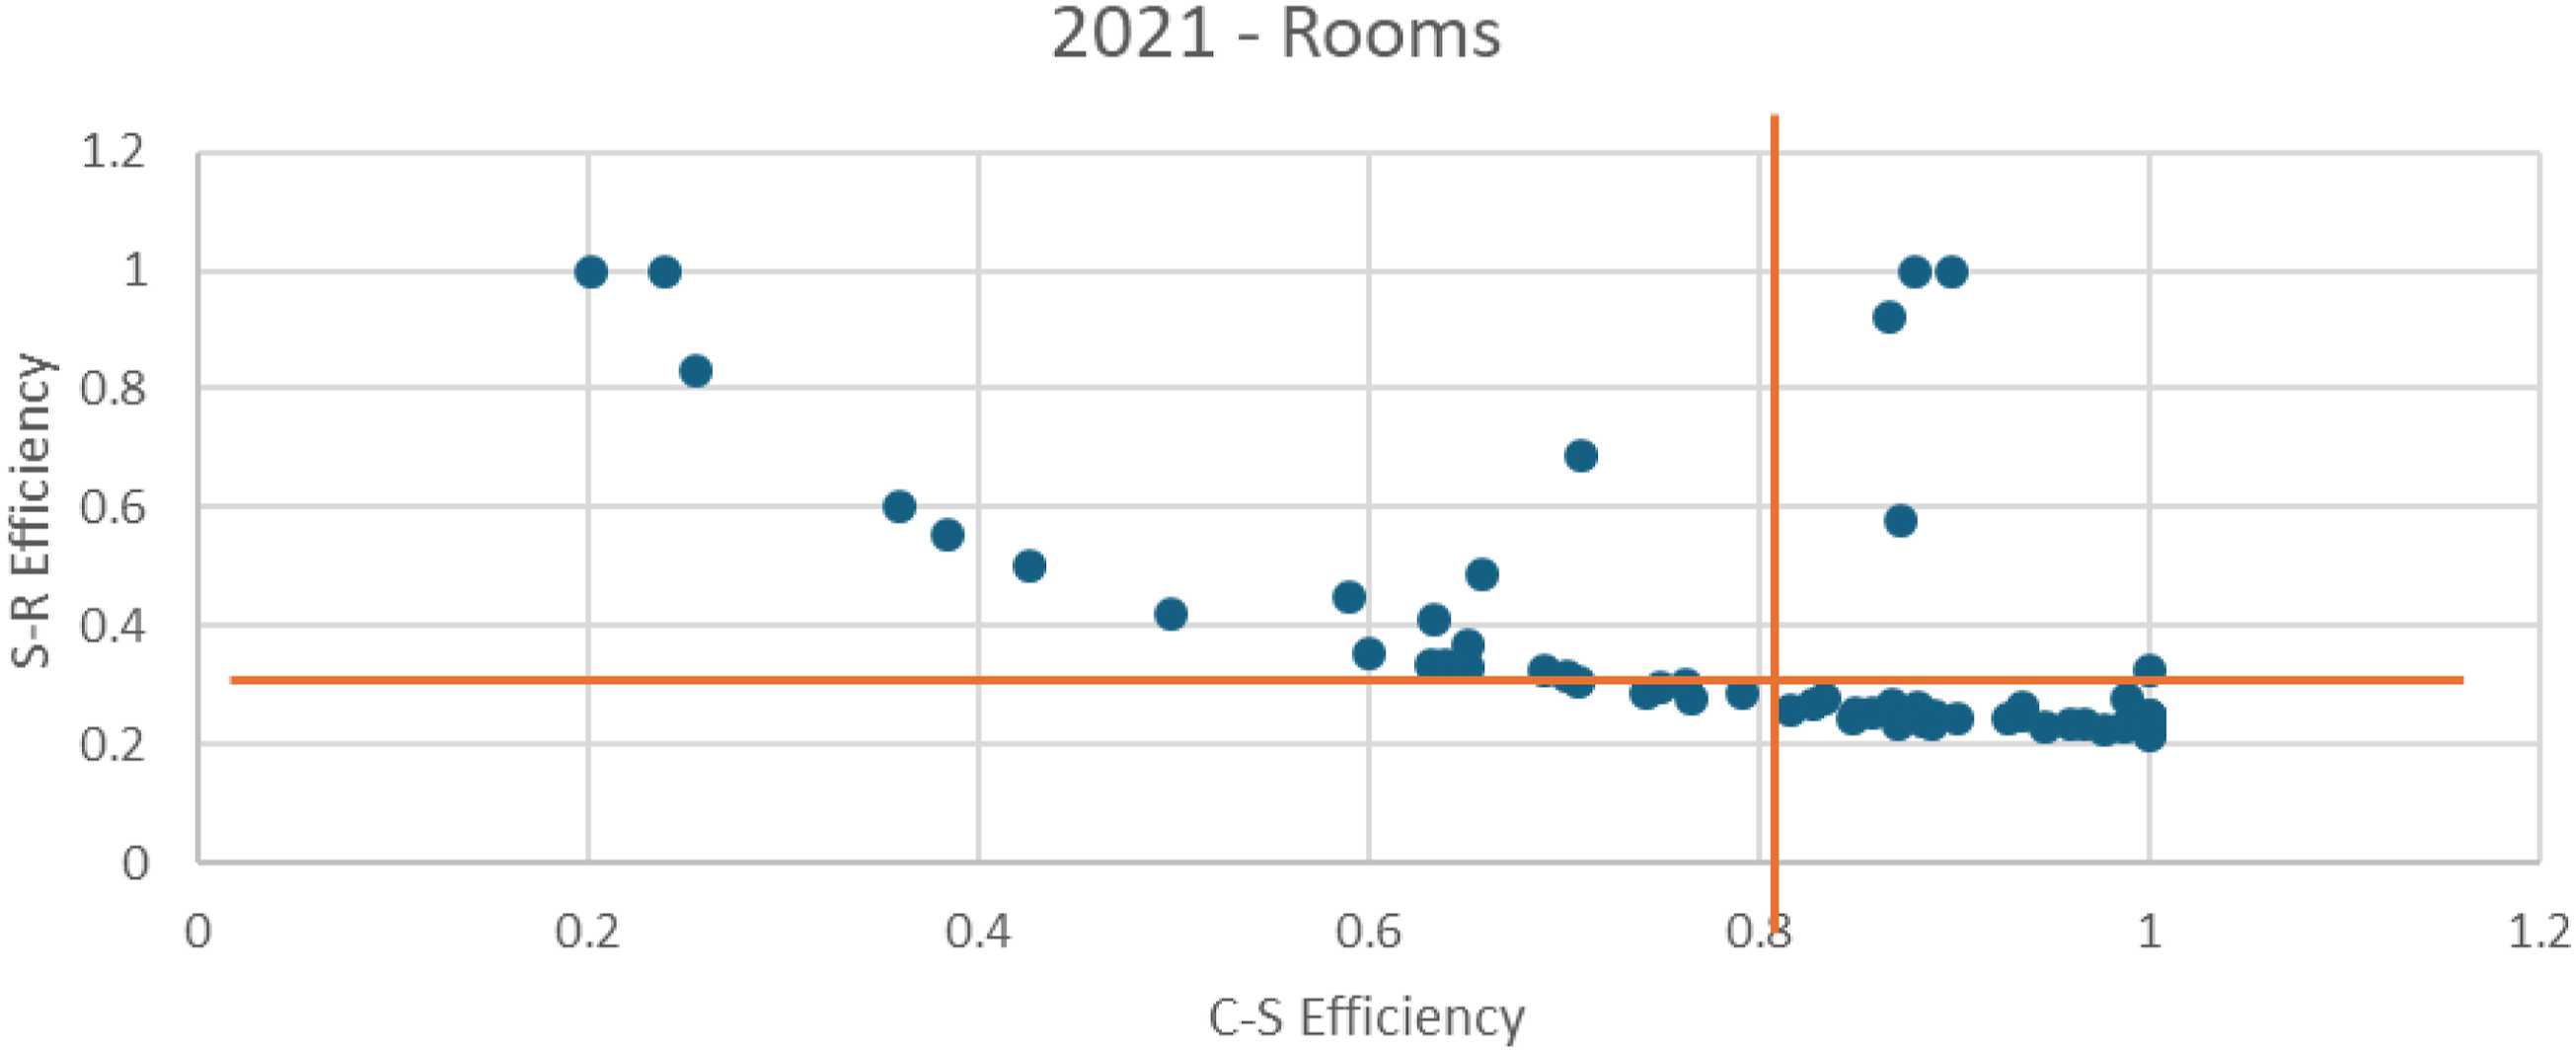
When DEA results are clustered along this curve, they reveal limited variations in performance or greater dispersion beyond the plateau, signaling meaningful performance differences. Thus, in 2019, most hotels remained close to the plateau (see Remark A4a), suggesting that intensified competition limited their ability to outperform the industry markups. This pattern confirms that scaling by Total POM expense (Figure 4) enhances DEA’s ability to detect relative performance across hotel size, quality, and condition.
Discussion
Using a two-stage Network DEA model to measure efficiency relative to customer satisfaction, this study focuses on evaluating the revenue and cost management capabilities of upscale chain hotels. By combining a two-stage approach with a large property-level dataset, the resulting efficiency scores yield more nuanced and informative insights. Our results show that hotels exhibit high average efficiency in generating customer satisfaction from resources (departmental costs), which remains relatively stable over the study period (Stage 1, C-S efficiency). The same hotels exhibited a low average efficiency in generating revenue from customer satisfaction, with a declining trend over the study period (Stage 2, S-R efficiency). In general, inefficiencies can arise from input and output prices as well as productive inefficiencies. Our results demonstrate that foregone rent is on the revenue side, as hotels are highly efficient on the cost side and exhibit high unrealized revenue potential relative to customer satisfaction levels.
Similar to Assaf and Magnini (2012), our DEA analysis using integrated marketing and accounting data produced efficiency scores that differed from those based solely on accounting inputs. Our findings for C-S (ranging from 82% to 91% average efficiency) and higher C-R (from 86% to 95%) are opposite to those of Assaf and Magnini (2012), who report an average efficiency of 89% when including customer satisfaction and 81% without (lower). However, our S-R analysis highlights differences in revenue management capabilities (45%–76%), suggesting that hotel accounting efficiency is driven by cost capabilities. This divergence in the results compared to prior research indicates the importance of considering capabilities separately.
These results provide evidence for the call by Assaf and Magnini (2012) promoting the integration of customer and accounting data for better decision-making. Although novel, our results support and extend those of previous studies. Our findings are similar to those of Yin et al. (2020), who found that hotels exhibit greater operational capability than marketing capability. Their study focused only on the number of available rooms. Therefore, we extended their findings by focusing on customer satisfaction and widening the analytical perspective. Our findings further extend the results of Kim and Chung (2022), who found that the inclusion of customer satisfaction scores in DEA produces different hotel brand rankings but does not break down whether it applies to the revenue or cost side of the operations. We further contribute to refinements of how the models are developed to ensure consistency in cross-level analytical models (Banker and Johnston, 2007; Shields and Shields, 2005).
While C-S efficiency remains relatively consistent over the years, S-R efficiency fluctuates and declines, exacerbated further by the COVID-19 demand shocks. This trend indicates an increasing gap in hotels’ ability to recognize and benefit financially from a given level of customer satisfaction. Our analysis and findings have several important theoretical and practical implications.
Theoretical implications
The novelty of this study lies in its two-stage network approach, which proposes conceptual refinements to improve the understanding of revenue and cost capabilities, integrating customer and competitor information, thus adding a more strategic dimension to DEA in general and FinDEA in particular. We build on previous DEA studies that incorporate review scores as model outputs (Boccali et al., 2022; Mariani and Visani, 2019; J. Park and Lee, 2021). Inspired by SMA principals, our analysis uses accounting information that shows incremental revenues generated by customers and the associated costs that can be controlled at the hotel manager level. This focus on operating factors that are both controllable in the short term yet reflected in long-term performance aligns well with hotels’ cost and revenue management capabilities. Moreover, it plays an important role in accounting, going beyond routine transaction recording and cost allocation (Bromwich, 1990; Hogreve et al., 2017; Roslender and Hart, 2003).
This study opens new avenues for accounting and revenue management system design that integrates customer satisfaction and insights gained from a two-stage analysis. Our findings show that hotels exhibit low average satisfaction and revenue efficiency with a declining trend. Across the competitive lodging landscape, properties generally execute cost management to a strong degree such that the best performers do not significantly outperform the market. In contrast, the best-performing hotels in revenue management outperform the market, and the gap between the best performers and the market is increasing. This increasing gap is possibly due to deficiencies in current information systems that support pricing decisions, and hotels have the potential to incorporate customer satisfaction information into their analysis and control.
We contribute to the growing literature by integrating non-financial customer-level metrics with accounting controls (Assaf and Magnini, 2012; Cugini et al., 2007; Demydyuk and Carlbäck, 2024; Ittner and Larcker, 1998; Srinivasan et al., 2005). Integrating a customer-centric view of accounting and comparing hotels’ performance relative to that of competitors provides a practical demonstration of the original aims of SMA (Bromwich, 1990; Hogreve et al., 2017; Roslender and Hart, 2003), which examines how a firm’s cost structure serves customers relative to competitors. Our approach addresses longstanding challenges in SMA regarding the historical lack of access to customer and competitor cost data.
Building on Assaf and Magnini (2012), we extend the understanding of how integrating customer satisfaction enhances hotel DEA analysis by disentangling their combined approach into separate C-R and C-S scores, positioning customer satisfaction as a distinct relative performance factor. Our contrasting results arise from this model split: we find that customer satisfaction yields a slightly lower average industry performance than revenue, suggesting that hotel performance is only marginally affected when evaluated flexibly using either metric. Our S-R analysis further supports this finding, revealing low average industry performance driven by the differences in revenue capabilities between top-performing hotels and the rest of the sector. Therefore, our integrated two-stage approach covers short- and long-term performance horizons – the immediate cost efficiency in the current accounting period and revenue efficiency based on customer satisfaction, leading performance indicators – repositioning DEA as a strategic SMA instrument that supports richer insights into competitive positioning and customer value creation.
Our additional analysis revealed a curve illustrating the trade-off between hotel revenue and cost, which we term the ‘industry plateau,’ reflecting baseline performance across the sector. The dispersion of performance above this plateau shows how some hotels outperform the baseline by achieving customer satisfaction at lower costs or maximizing revenue from their current level of satisfaction by capturing customers’ willingness to spend. This industry plateau provides theoretical insights into the DEA information content. Using different scaling methods can risk merely capturing industry markups rather than true efficiency differences. Examining dispersal above the plateau helps confirm that the analysis reflects variations in performance.
Practical implications
The findings of this study provide actionable insights for effective customer-centric management. Our analysis indicates current information systems serve cost management fairly well, yet is lacking in capture of customer perspective; they are not helpful in supporting decisions such as value-informed pricing and product offerings. While this problem is not new (Carlbäck, 2022; Ingenbleek, 2014; Van der Rest et al., 2018), our study provides empirical evidence of the unrealized revenue potential in relation to customer satisfaction.
The conservative approach to revenue management and dynamic pricing is to open and close hotel rate fares depending on the pattern of actual bookings relative to the forecast. This approach does not explicitly consider customer satisfaction information and often does not integrate upselling options. By understanding the value of their products and services to customers, hotels can tailor and enhance their offerings beyond standard accounting and competitive market information (Ingenbleek, 2014; Van der Rest et al., 2018).
Selected efficiencies from 2019.
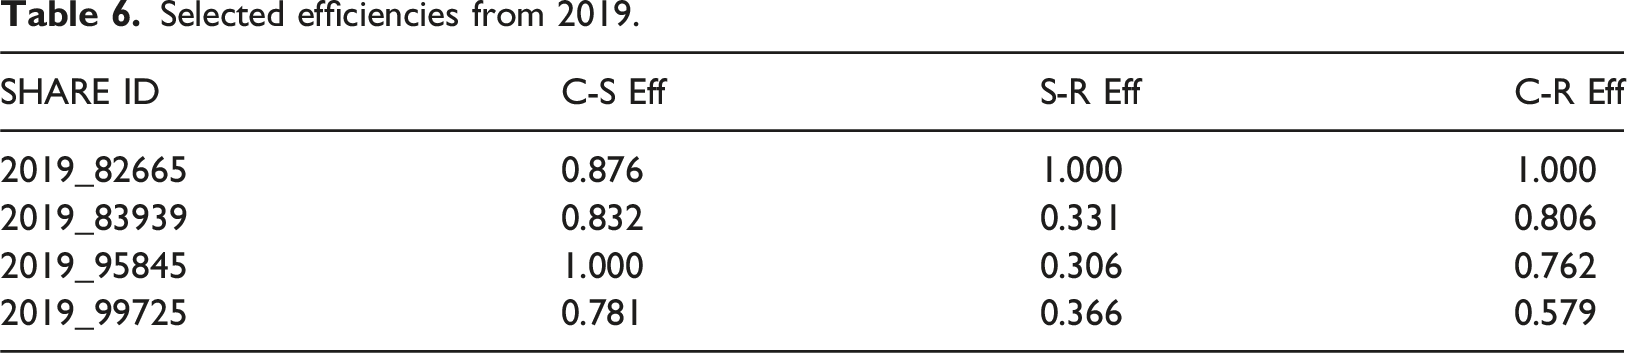
Hotel 82,665 achieved full C-R efficiency (1.000), showing strong performance when viewed through a single-stage lens. While its current revenue generation appears optimal given its satisfaction levels (S-R = 1.000), its C-S efficiency score (0.876) reveals that the hotel could incrementally improve its ability to convert costs into customer satisfaction, which may pose long-term risks if guest satisfaction begins to decline. In contrast, Hotel 95,845 achieved full C-S efficiency (1.000), but a low S-R score (0.306). While it efficiently creates satisfaction from its costs, it struggles to convert that satisfaction into revenue – a missed opportunity to capitalize on guest goodwill. Other examples are hotels with low C-S but high S-R efficiency, which may be extracting strong short-term revenue from limited satisfaction, but risks future customer loss. These contrasting profiles highlight the diagnostic value of separately examining the C-S and S-R stages. Such dynamics were not captured by the C-R score alone.
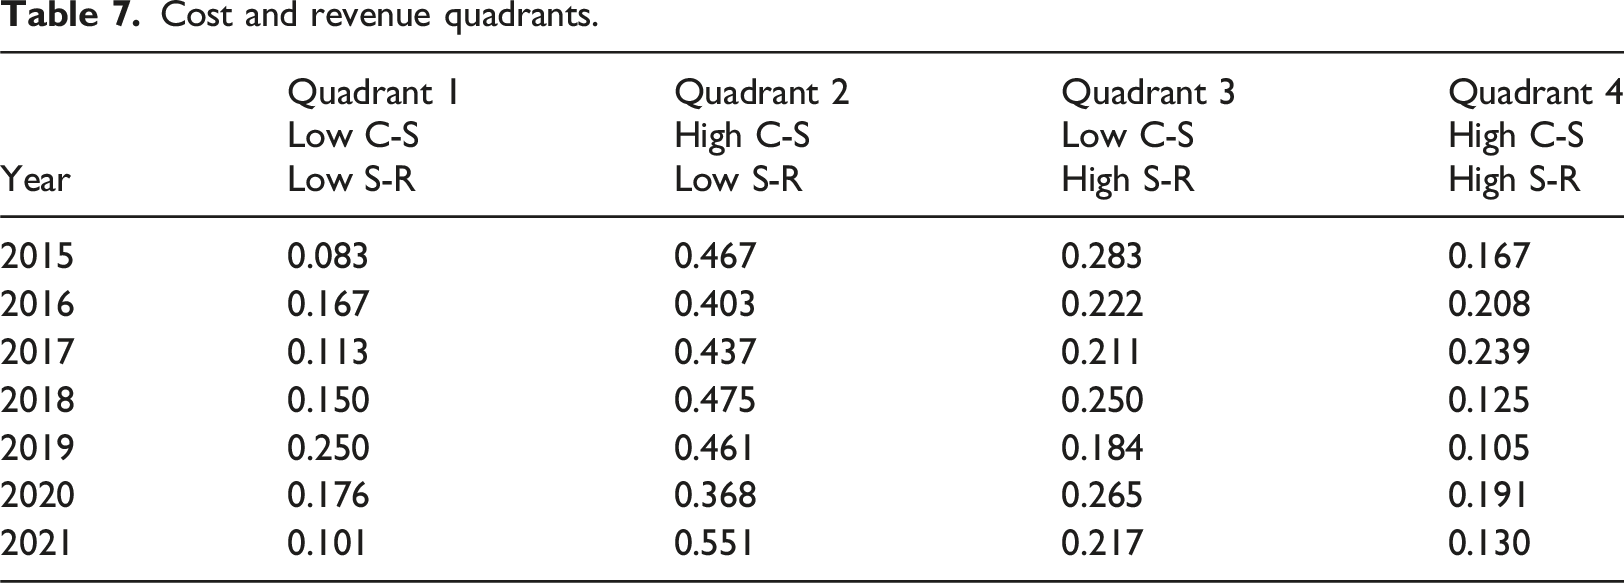
Therefore, categorizing cost-to-satisfaction and satisfaction-to-revenue efficiency provides valuable insights into whether a hotel should prioritize cost control or revenue optimization. For example, Assaf and Magnini (2012) consider that DEA results can inform possible changes if managers consider all inputs and outputs. Our use of two-stage analysis signals for managers where this search begins. As a practical benchmarking tool, we propose a 2 × 2 matrix that positions hotels relative to their competitors in these two dimensions. This framework enables analysts to track performance dynamics at both the individual property level and across industry (further illustrated in Online Appendix Figure 11(A4c)). Table 7 presents the matrix classifying hotels based on their cost-to-satisfaction (C–S) and satisfaction-to-revenue (S–R) efficiency scores using the mean efficiency values (illustrated by the orange lines in Figure 4). We grouped hotels into four strategic quadrants that highlighted value-generation patterns. This matrix helps identify whether hotels effectively convert operational spending into guest satisfaction, and whether satisfaction translates into revenue. Quadrant 1: Low C-S, Low S-R: Operational and commercial underperformance. Quadrant 2: High C-S, Low S-R: Guest satisfaction not effectively monetized. Quadrant 3: Low C-S, High S-R: Strong revenue returns relative to low satisfaction. Quadrant 4: High C-S, High S-R: Top performers in both dimensions. Cost and revenue quadrants.
Our overall results point towards the challenge of generating more revenue for hotels with higher customer satisfaction relative to competitors. Thus, current dynamic pricing tools are not always connected with customer satisfaction and do not cover “the Full House” potential. Industry analytics can explore the potential of incorporating customer satisfaction into dynamic pricing approaches and upselling options, thereby enriching in-house sales information with customer feedback. Similar to our approach, these data can be crawled in real time, analyzed, and systemized in an automated process, thus evolving into an accounting-ready state to refine pricing algorithms and dashboards. Such integration and a two-stage approach can help uncover hidden erosion patterns and support operators in optimizing their costs and improving satisfaction ratings.
Limitations and directions for future research
This study highlighted DEA’s need for deeper sample homogeneity, leaving potential for further research into other aspects of heterogeneity. For example, luxury hotels with older facilities may face different dynamics of customer satisfaction and costs compared with newly built economical hotels. Furthermore, our analysis does not incorporate explanatory contextual or operational factors that may influence efficiency scores. By decomposing the overall performance into C-S and S-R components, our approach provides a framework that can support localized manager-led investigations into the underlying causes of inefficiency, where other variables can be successfully incorporated. Future research could link efficiency scores to contextual variables such as staffing, location, or available facilities to better explain differences in performance and further uncover the strategic or organizational drivers of cost-to-satisfaction and satisfaction-to-revenue efficiency. In addition, we scaled the data by Total POM expenses to control for hotel size, class, and facilities, to account for differences in hotel types. Other DEA methods such as categorical DEA can directly capture these differences.
Finally, customer reviews are inherently subjective, reflecting customer satisfaction rather than objective service quality, which may affect the accuracy of efficiency measurements. An important avenue for future research is to examine whether the ordinal nature of rating scales influences efficiency outcomes. Although this issue may not be critical in all contexts, conducting robustness tests using alternative transformations of ordinal data can provide valuable insights into its potential effects. Our current analysis offers a foundation for such investigations. Additionally, longitudinal studies tracking changes in hotel industry scores over time could help disentangle inefficiencies attributable to internal management practices from those driven by external factors such as market competition.
Supplemental Material
Supplemental Material - Maximizing revenue from satisfaction: Customer-centric perspective on revenue and cost management in hotels
Supplemental Material for Maximizing revenue from satisfaction: Customer-centric perspective on revenue and cost management in hotels by Frederick Ng, Ganna V Demydyuk and Claire Cui in Tourism Economics.
Footnotes
Acknowledgements
We are grateful to the participants of the 9th IATE Conference for their insightful questions and comments, and to the anonymous reviewers for their valuable and thought-provoking suggestions. We also extend our heartfelt thanks to Maryam Hasannasab, Julie Harrison, and Paul Rouse from the University of Auckland, New Zealand, for their supportive feedback on the manuscript and their ongoing guidance on the analysis and modelling.
Declaration of conflicting interests
The authors declared no potential conflicts of interest with respect to the research, authorship, and/or publication of this article.
Funding
The authors received no financial support for the research, authorship, and/or publication of this article.
Supplemental Material
Supplemental material for this article is available online.
Notes
Author biographies
References
Supplementary Material
Please find the following supplemental material available below.
For Open Access articles published under a Creative Commons License, all supplemental material carries the same license as the article it is associated with.
For non-Open Access articles published, all supplemental material carries a non-exclusive license, and permission requests for re-use of supplemental material or any part of supplemental material shall be sent directly to the copyright owner as specified in the copyright notice associated with the article.