
Abstract
This paper aims to investigate the heterogeneous effects of the Southern Oscillation Index (SOI) on the tourism Sector of International Stock Markets under varying climate conditions and time-frequency using the Quantile-on-Quantile Regression (QQR) method, the quantile Granger-causality test and Wavelet Coherence method. The study’s findings reveal that: (1) Pacific Rim countries exhibited greater sensitivity to SOI fluctuations, while developed markets demonstrated greater resilience; (2) the quantile Granger-causality test revealed a strong causal relationship between the SOI and tourism indices, particularly during periods of moderate market fluctuations (at the 0.25 and 0.75 quantiles); (3) since 2022, climate sensitivity of tourism markets has intensified, especially in the mid-frequency domain; and (4) during the COVID-19 pandemic, the results remained robust, suggesting that the influence of extreme climate on the tourism market persisted. These findings not only enhance our understanding of the effects of extreme seasonal phenomena on the tourism industries of different countries but also provide insights for the tourism market’s adaptation to climate change.
Keywords
Introduction
The tourism sector ranks among the most significant contributors to the global economy (Manzoor et al., 2019). In 2022, the growth of the global tourism economy contributed 5.49% to the world’s GDP growth, with the contribution to GDP growth in developed economies reaching 9.10%, and 4.24% in emerging economies. Tourism has already become a vital economic pillar in many countries, providing employment and income opportunities for local residents. The major tourism nations, including the United States, China, the European Union, the United Kingdom, Thailand, Japan, Turkey and Australia, are characterized by rich histories, cultures, and traditions, and are relatively well-developed in terms of tourism infrastructure (Huang et al., 2021; Wang et al., 2022).
The Southern Oscillation is an irregular and cyclical climate phenomenon (Lee et al., 2023), typically manifested as a seesaw oscillation of atmospheric pressure (Zhang et al., 2023). The Southern Oscillation consists of El Niño, representing the warming phase of ocean temperatures, and La Niña, representing the cooling phase (Boljka et al., 2022; Feng et al., 2022; Zeng et al., 2025). However, since the 1950s, the average global temperature has increased by approximately 0.2°C per decade, compared to the previous one, leading to a surface temperature increase of approximately 1.0°C (1.8°F) above pre-industrial levels. In the context of global warming, La Niña events have weakened, while El Niño events have intensified (Peter et al., 2023). The world is now facing a future of more heat, drought, and flooding, with rising temperatures making extreme precipitation and flood events more frequent (Tabari, 2020). These extreme climatic events significantly impact freshwater resources, affecting countries and industries that rely heavily on rainfall and groundwater as sources of freshwater (Wei et al., 2022). As a result, scholars are increasingly recognizing the nonlinear dynamic changes within the Earth’s system (Meyfroidt et al., 2018) and continuously evaluating the uncertainties associated with climate change, aiming to predict its impact on financial markets as accurately as possible.
El Niño and La Niña are natural climate patterns that cause variations in rainfall and sea surface temperatures in the central and eastern equatorial Pacific. Given the high sensitivity and correlation between climate and tourism (Mooser et al., 2021), these fluctuations significantly impact major tourism countries, including the United States, China, the United Kingdom, the European Union, and Australia. The prosperity of these countries’ tourism markets directly affects the financial performance of their tourism sectors. While climate change should typically follow specific seasonal or cyclical patterns, ongoing global warming is intensifying El Niño events, causing them to deviate from established patterns. This climate change inevitably introduces substantial uncertainties to climate conditions across different countries and regions, posing significant challenges to tourism markets.
Against the backdrop of global warming, the compounding effects of moderate to strong El Niño events may lead to more frequent, widespread, and intense extreme climate, with the most direct and severe consequences being the increased occurrence, strength, and concurrency of extreme climate events. These events pose serious threats to tourists’ safety and result in varying degrees of risk and loss to the tourism economy. Moreover, extreme climate events may profoundly affect the financial conditions and operations of tourism-related companies in different countries, heightening risks and causing investors to focus more on companies’ climate adaptability and resilience, as well as their performance in sustainability and environmental management. Consequently, the volatility induced by extreme climate change could further influence investor sentiment, making the tourism market indices in various countries highly sensitive to such changes.
From a behavioral finance perspective, climate change is increasingly recognized as a critical factor influencing market behavior and investment decisions. The environmental risks and opportunities triggered by climate change, coupled with the growing societal focus on sustainability, are shaping investors’ choices. For instance, climate factors impact investors’ risk perception. Extreme climate events like floods, droughts, and hurricanes can significantly affect the financial conditions and operations of tourism-related companies. The resultant risk intensification leads investors to focus more on companies’ climate adaptability, resilience, and performance in sustainability and environmental management. As a result, investors may reduce their investments in industries and companies more vulnerable to climate change risks to mitigate personal investment risks.
This study employs the QQR method, a quantitative, dynamic, and nonlinear quantile approach, to evaluate the asymmetric effects of quantile-dependent variables on quantile-independent variables under diverse market conditions (including bearish, normal, and bullish). Through this method, we explore the relationship between independent and dependent variables across different quantiles, with particular attention to potential nonlinear asymmetric causal relationships during normal, extreme La Niña, and extreme El Niño conditions in the price fluctuations of major economics with significant tourism industries, such as United States, China, the European Union, the United Kingdom, Thailand, Japan, Turkey and Australia. The method is also used to determine the quantile causal relationship between La Niña and El Niño phenomena and tourism market returns in these countries, further confirming and predicting the effects of extreme climate events on tourism markets. Unlike earlier studies that relied on mean-based analysis to assess market influences, this research offers a rare and unique perspective by examining the relationship between independent and dependent variables across different quantiles (particularly extreme quantiles), highlighting the importance of these variables’ distribution. However, because QQR is a univariate-based technique, it may overlook other significant factors influencing the dependent variable in the analysis. Despite the limitation, the QQR outperforms traditional Quantile Regression (QR) in terms of accuracy in variable relationships and in identifying outliers and handling nonlinear distributed data series.
Subsequently, we applied the quantile Granger-causality test to examine cross-frequency causality between SOI and various tourism sectors. The quantile Granger-causality test offers several advantages, particularly in handling complex economic and financial data. Unlike traditional mean-based Granger causality tests, the Quantile Granger test captures causal relationships between variables under different conditions, allowing for the analysis of interactions across various distribution states rather than just around the mean. For highly volatile datasets like financial data, the Quantile Granger test can reveal causal relationships that exist under extreme market conditions (such as during market crashes or bubbles) that might be overlooked in mean-based analysis.
Additionally, this study employs Wavelet Coherence (WC) technology to detect the connectivity between SOI and various tourism sector markets at different frequencies. The main benefit of WC analysis is its capacity to estimate the spectral characteristics of time series over time, enabling us to examine the dynamic interrelationship between two series across both time and frequency domains (Zeng et al., 2024a). This allows us to investigate the lead-lag relationships and the strength of associations over different investment horizons.
Our findings add to the literature in two key aspects: First, we identify the time-varying relationships between the SOI and the tourism markets of countries like China, the United States, the United Kingdom, Australia, and the European Union. Additionally, this study is first to analyze the interactions between specific national tourism markets and extreme climate. Second, through the use of QQR, Quantile Granger Causality, and Wavelet Coherence methods, we offer a novel interpretation of the overall relationship between these factors, advancing the existing research and enriching the literature on the relationship between climate change and tourism markets in specific economics.
Literature review
The existing literature pertinent to our study can be categorized into three main streams: the relationship between climate indices and financial markets, which establishes the fundamental framework for understanding climate-market interactions; the specific impact of climate change on the tourism industry, which emphasizes the sector’s unique vulnerability and geographical heterogeneity; and the predictability of tourism stock market returns, which explores how traditional market efficiency frameworks apply to tourism stocks under various conditions.
The relationship between climate indices and other markets
As global climate change intensifies, the influence of climate indices on financial markets has increasingly captured the attention of both academics and practitioners. Climate indices, such as temperature, precipitation, and the occurrence of extreme climate events, has been widely demonstrated to significantly affect various financial markets (Ahmed et al., 2024). These impacts not only directly influence industries closely related to climate, such as agriculture and energy, but also indirectly affect other financial markets through complex economic mechanisms (Rao et al., 2023). These effects manifest through multiple transmission mechanisms, creating complex interconnections within the financial system. For instance, Hong et al. (2023), by using the SOI to capture climate change, found significant variations in their in-sample estimates, highlighting the dynamic nature of climate-market relationships.
In industries with high climate risk, the effect of climate indices on financial markets is particularly pronounced. Hong et al. (2019) pointed out that the risks of climate change significantly affect stock market volatility, especially in the energy and insurance sectors. Additionally, climate risk may further impact overall stock market performance by altering investor expectations and behaviors (Krueger et al., 2020). Mao et al. (2023), using quantile regression analysis, revealed the positive impact of climate risk on the overall connectivity of the financial system, finding that the bond and stock markets act as the primary conduits for climate shocks, whereas the foreign exchange and commodity markets exhibit higher sensitivity to climate-related information. Over time, the susceptibility of financial asset price volatility to climate risk may vary significantly. Wei et al. (2022) discovered that under most market conditions, ENSO significantly impacts the EU renewable energy stock market, with limited effects on the U.S. market. Notably, the EU renewable energy stock market’s response to ENSO shows marked asymmetry in different market environments, such as bull and bear markets, with the strong La Niña event during the COVID-19 potentially exacerbating its performance.
Given the widespread and profound effect of extreme climate events on the tourism market, it is crucial to conduct in-depth research in this area. As the frequency and severity of extreme climate events continue to rise, understanding their impact on tourism market performance is not only essential for investor decision-making but also provides critical guidance for tourism industry practitioners and policymakers in addressing climate risks. Based on this, this paper reviews and analyzes relevant studies on the effect of climate on the tourism sector.
The impact of climate change on the tourism industry
The tourism industry is considered one of the sectors highly sensitive to climate change. Climate change not only directly affects the supply and demand dynamics of the tourism market but also indirectly influences market performance through various economic and environmental mechanisms (Dogru et al., 2019; Perch-Nielsen, 2010). Therefore, understanding the effect of climate change on tourism and the potential risks it poses is crucial.
Scott et al. (2012) highlighted that the tourism industry is not only strongly affected by the environmental and socio-economic changes brought about by climate change but also contributes significantly to human-induced climate change. Zeng et al. (2024b), by studying the dependency between U.S. tourism, leisure, and clean energy, analyzed the impact of climate change from the perspectives of short-term stability and long-term volatility. Pang et al. (2013) emphasized that while the tourism sector could emerge as one of the leading economic victims of climate change, it also serves as a major source of greenhouse gas emissions as a result of widespread tourism activities. Hoogendoorn and Fitchett (2018) found that research on tourism and climate change has primarily focused on the Global North, particularly the Mediterranean, Northern Europe, and North America, with relatively little attention given to Africa.
Furthermore, Scott et al. (2019) indicated that in countries where tourism contributes a significant portion to GDP and is expected to grow strongly in the future, the vulnerability of the tourism industry is the highest, especially in Africa, the Middle East, South Asia, and Small Island Developing States. In contrast, the vulnerability is relatively low in Western Europe, Northern Europe, Central Asia, Canada, and New Zealand. At the same time, the negative impact of climate change on the tourism industry poses greater challenges to achieving global sustainable development goals. Xiong et al. (2021) further revealed that the rise in ENSO events causes a notable decline in visitors to natural attractions in the US, although this relationship is mitigated by factors such as disposable income, per capita GDP, and population growth.
In summary, existing literature still falls short in exploring the impact of extreme climate phenomena on the risk connectivity of tourism markets in different countries. This paper employs QQR and Quantile Granger Causality methods, using the pressure oscillations between the eastern and western regions of the Pacific Ocean as independent variables, to analyze the quantile-dependent variables of tourism market price fluctuations in major countries. Through this approach, the study comprehensively reveals the heterogeneity in the dynamics of tourism market stock prices across countries and accurately captures the uneven and varied impacts of La Niña and El Niño phenomena on the tourism markets of major countries, thereby filling a gap in the existing research.
Predictability of stock market returns
The predictability of stock market returns has long been a central issue in financial research, with significant practical implications, particularly across different industry sectors (Dai et al., 2022; Pan et al., 2020; Phan et al., 2015). For the tourism sector, which is heavily influenced by macroeconomic factors and global events, the predictability of stock market returns is even more complex (Hadi et al., 2022; Pan et al., 2021). As the EMH, market prices already reflect all available information, making future stock returns random and unpredictable (Fama, 1970). However, the tourism sector’s unique characteristics often lead to deviations from the EMH, as it is frequently affected by seasonal demand, global economic fluctuations, and unexpected events such as natural disasters and pandemics.
Fama and French (1989) demonstrated that changes in interest rates and economic growth rates have a significant influence on stock markets. As a sector reliant on consumer discretionary income, tourism is particularly sensitive to changes in macroeconomic variables. Moreover, stock market returns in the tourism sector are not only influenced by macroeconomic variables but also driven by specific events. Events such as terrorist attacks, natural disasters, and global health crises (e.g., the COVID-19) can have immediate and dramatic effects on tourism demand, leading to significant volatility in the stock prices of tourism companies. Gössling and Peeters (2015) attempted to capture these event-driven impacts on the tourism stock market sector by constructing an event-driven model to improve prediction accuracy. Hadood and Irani (2021), using an OLS model, explored the effects of market sentiment and Economic Policy Uncertainty (EPU) on tourism stock markets. Their empirical results denoted that transitions in European economic sentiment had a strong positive impact on future tourism and leisure stock returns in Spain and the UK in the short term, while in France, changes in European EPU had a weak negative impact on future tourism and leisure stock returns in the medium term.
The study most closely related to ours is that of Jareño et al. (2022), which applied the five-factor model to empirically analyze the stock returns of European tourism and service companies, validating the model’s effectiveness.
Based on the literature review above, while existing studies have examined climate-market relationships and tourism sector performance, there remain significant gaps in understanding how extreme climate phenomena affect tourism market risk connectivity across different countries, particularly through non-linear relationships and during extreme market conditions. Our study addresses these gaps by employing a series methods to analyze the impact of SOI on tourism market performance across major global markets, thereby providing comprehensive insights into how climate phenomena affect tourism markets across different geographical regions and market conditions, with particular attention to market behavior during extreme climate events such as La Niña and El Niño phenomena.
Methodology
Quantile Granger test
This section will provide a detailed introduction to the quantile Granger-causality test method used to examine the causal relationship between the Southern Oscillation Index (SOI) and the tourism markets. The basic concept of Granger causality is that if a time series
Where,
We change the null hypothesis as (
The specify
Given the independent variable
Assuming that
Using the statistic of test as introduced by Troster (2018):
Let
Quantile-on-quantile regression approach
We adopt the quantile-on-quantile (QQ) regression introduced by Sim and Zhou (2015), which builds upon the principles of quantile regression. This method is particularly effective in handling outliers and non-normal data distributions. As a nonparametric local linear regression technique, it provides insights into the conditional distribution and can identify underlying structural changes. Unlike the OLS and traditional quantile regression methods, the QQ regression approach allows for a detailed analysis of the marginal effects between variables across different quantiles. To demonstrate the QQ regression method more clearly, we use the SOI and its impact on the tourism market as an example. The steps involved in this process:
We set the nonparametric quantile regression for the Tourism stock return
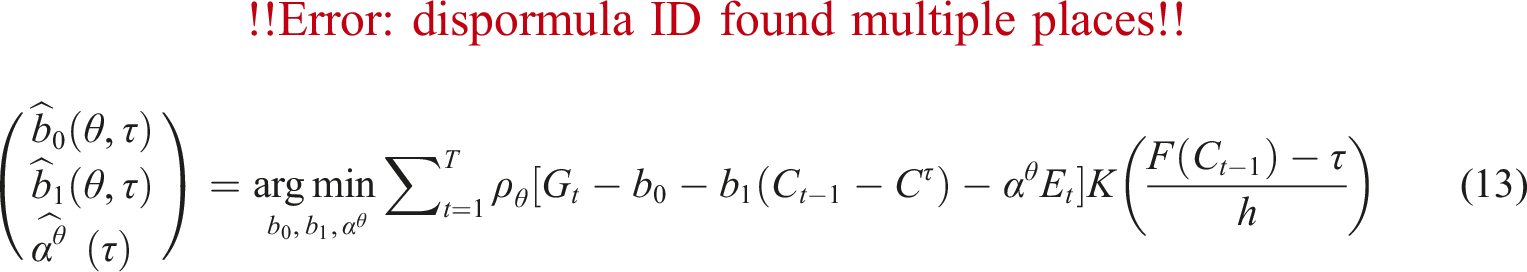
To estimate the influence (described by
From the above equations, we have:
Then, we make
Finally, we employ the cross-validation (CV) approach to determine the optimal bandwidth
Wavelet analysis
Wavelet analysis facilitated the examination of lead-lag dynamics and the degree of association across different investment horizons. Additionally, this method enabled the detection of structural breaks within the time-varying relationships between indices, as well as the identification of any emerging seasonal or cyclical patterns. By employing this approach, the limitations of quantile methods—specifically their inability to capture the comovement of variables within the time-frequency domain or to discern leading and lagging information—were effectively addressed.
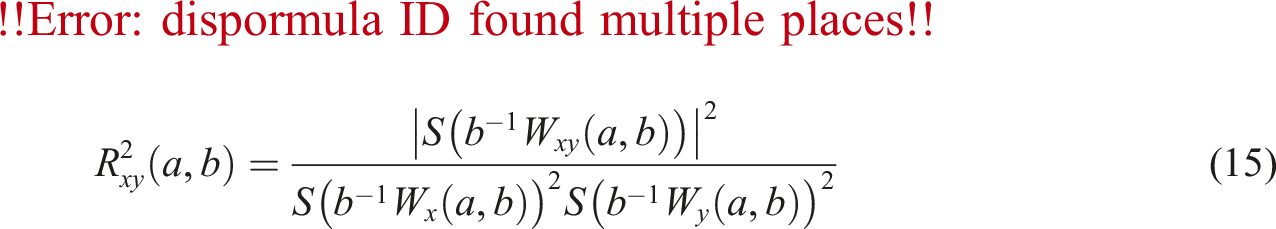
Following the definition of Torrence and Compo (1998), we let WC equals to
Next, the phase difference in the wavelet as,
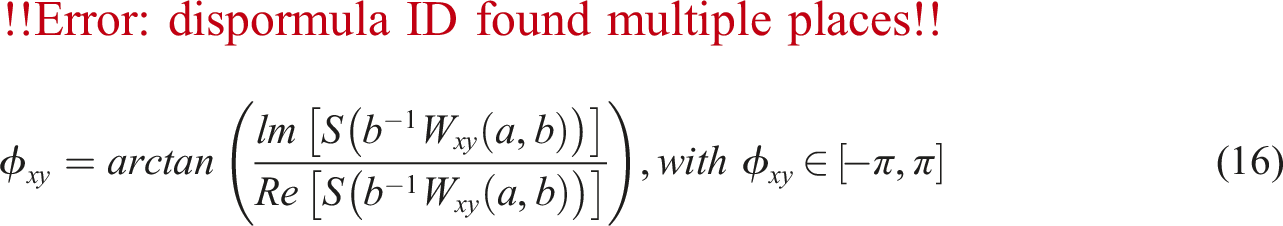
In this context, Im and Re denote the imaginary and real parts of the smoothed power spectrum, respectively. The phase angle
Empirical results and analysis
Data description
This study utilises a dataset that encompasses several tourism-related sectors from major global stock markets, including: the Istanbul Stock Exchange Tourism Index (TR) in Turkey, the Stock Exchange of Thailand Tourism and Leisure Index (THA), the Australian Tourism Index (AU), the GSXAJPTR Index (Japan), the STOXX 600 Travel & Leisure Index in Europe (EURO), the S&P 500 Tourism Industry Index in the United States (US), the CSI Tourism Thematic Index in China (CN), and the FTSE 350 Travel & Leisure Index in the United Kingdom (UK). Additionally, the Southern Oscillation Index (SOI) was selected as a proxy for climate risk (Zeng et al., 2024c). The SOI is a critical indicator of the El Niño-Southern Oscillation (ENSO) phenomenon and provides valuable insight into the potential impacts of global climate change on the tourism industry.
The data used in this study were sourced from Datastream, Bloomberg, S&P Global databases, and the official website of the Queensland Government. The sample period spans from 3 November 2014 to 18 October 2024, representing the most comprehensive dataset currently available. To facilitate rigorous empirical analysis, this study follows the data processing method outlined by Zeng et al. (2024d). Specifically, the returns of the tourism sectors in the major global stock markets were calculated as the natural logarithmic first differences of closing prices, 1 while the SOI data remained untransformed.
Summary statistics.
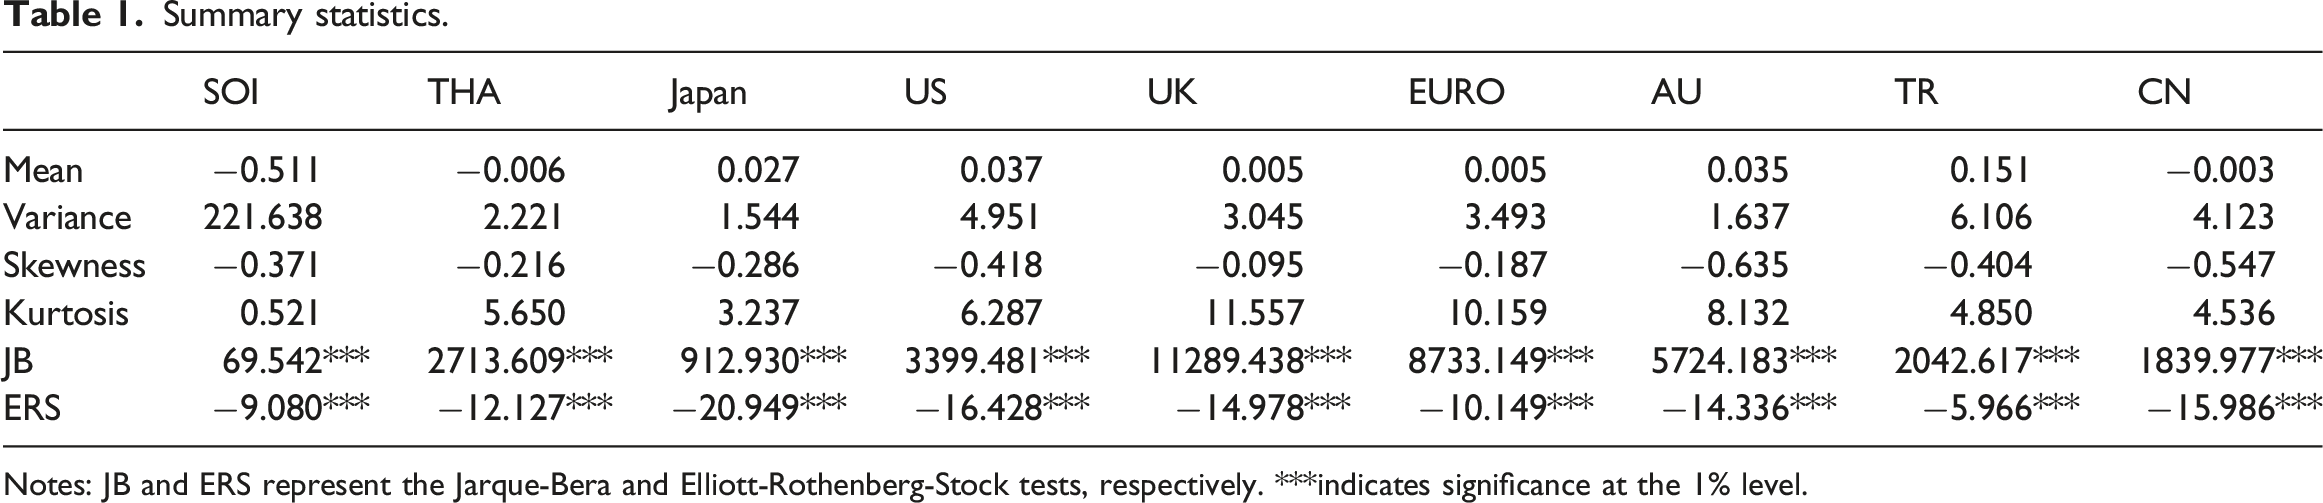
Notes: JB and ERS represent the Jarque-Bera and Elliott-Rothenberg-Stock tests, respectively. ***indicates significance at the 1% level.
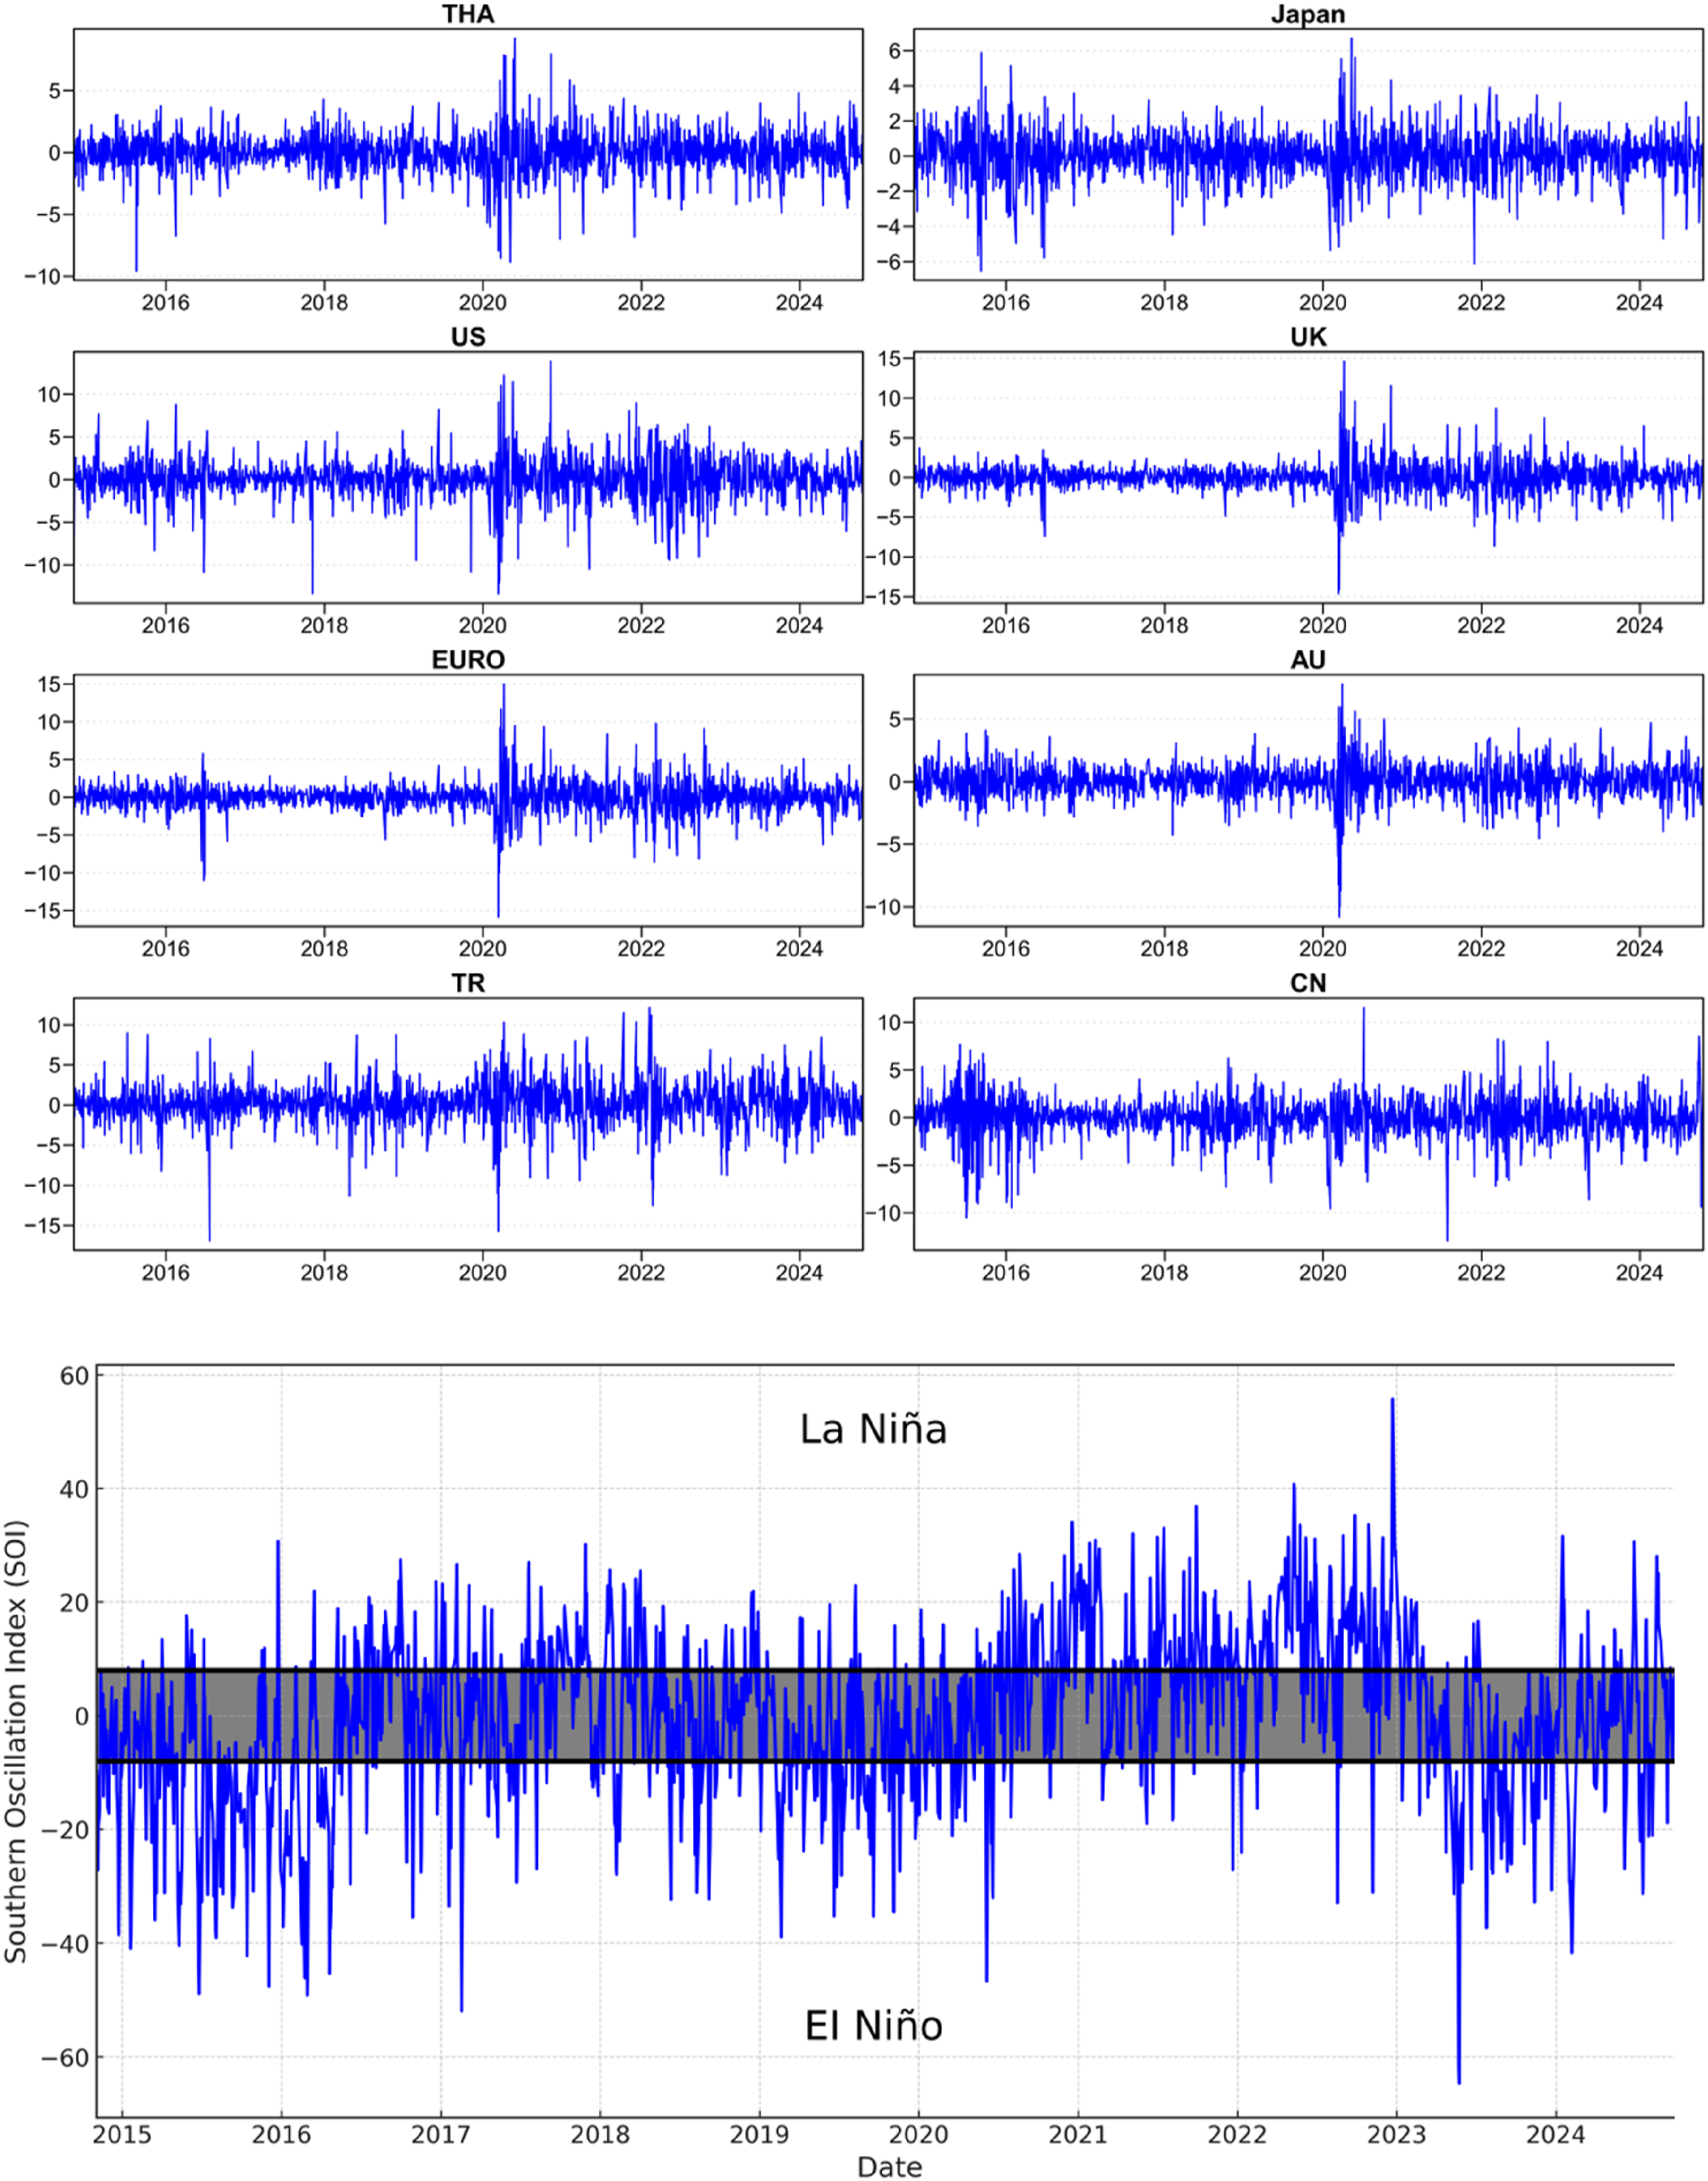
Trends of SOI and tourism sectors of stock market in sample period.
Overall, the tourism-related industries across major stock markets experienced significant fluctuations in 2020, aligning closely with the global outbreak of COVID-19.
First, it is essential to understand the SOI and its critical role in climate phenomena. SOI is a key indicator of pressure differences in the Pacific region, vital for predicting El Niño and La Niña events (Kwok et al., 2016; Melice and Servain, 2003; Nicholls, 2008). Typically, an SOI value greater than 8 signals the occurrence of La Niña, while a value less than 8 indicates El Niño. This clear threshold provides a reliable basis for identifying and quantifying these two significant climate patterns.
When delving into the quantile method, its remarkable alignment with the characteristics of SOI data becomes evident. The quantile method, which arranges data in order and divides it into equal parts, can accurately capture SOI’s behavior under different climatic conditions. For instance, the extreme upper quantiles of SOI are often associated with La Niña, while the extreme lower quantiles correspond to El Niño. This correspondence is not only intuitive but also provides a more detailed and flexible analytical tool, allowing for a more precise capture of SOI’s trend changes, thereby enhancing the ability to predict and analyze El Niño and La Niña events.
From an economic perspective, accurately predicting and analyzing El Niño and La Niña events holds profound significance. These climate patterns have substantial impacts on agricultural production, fisheries resources, water resource management, and energy demand across various global regions (Adams et al., 2003; Callahan and Mankin, 2023; Yang et al., 2018). For example, El Niño may lead to reduced rainfall in certain areas, affecting crop yields and driving up food prices, while La Niña might bring excessive rainfall, increasing the risk of flooding and affecting infrastructure development and the insurance industry. Therefore, utilizing the SOI and quantile methods for more precise predictions can assist governments and businesses in developing more targeted economic policies and risk management strategies.
We performed descriptive statistics on the time series of all variables, with the results presented in Table 1.
We first examine the kurtosis and skewness of the data and observe that all variables deviate from the normal distribution, exhibiting characteristics of leptokurtosis and fat tails. Additionally, the results of the Jarque-Bera test indicate that none of the series follow a normal distribution. The ERS unit root test results further support this observation, confirming that all series are stationary.
Results
This section aims to explore the nonlinear and asymmetric causal relationships between the SOI (Southern Oscillation Index) and the tourism markets of major countries, such as China, Turkey, Thailand, Japan, the United States, the European Union, the United Kingdom, and Australia, particularly under different climate conditions (normal, extreme La Niña, extreme El Niño). First, we analyze the market responses of these countries’ tourism sectors to price fluctuations using the Quantile-on-Quantile Regression method, revealing the heterogeneous impact of climate phenomena on global tourism markets. Next, we apply the quantile Granger-causality test to investigate the time-varying causal relationships between the SOI and these countries’ tourism markets. This method allows us to uncover how the causal relationship between the SOI and tourism market performance changes over time under different market conditions, particularly during normal, extreme La Niña, and extreme El Niño climate events. Finally, we employ the Wavelet Coherence analysis method to further examine the dynamic correlation between the SOI and tourism markets. Wavelet Coherence analysis can capture the relationship between variables across different time scales, especially the coupling patterns at short-term and long-term scales, helping us better understand the complex influence of climate factors on tourism markets. Through these analyses, this section provides new perspectives and in-depth insights into the impact of climate change on global tourism markets.
We first analysed the QQR results of SOI in relation to tourism sectors across major national stock markets, as illustrated in Figure 2. The SOI-AU relationship demonstrated distinct non-linear characteristics. Specifically, when SOI was within the 0.3–0.7 quantile range, its impact on AU remained relatively moderate and stable, fluctuating primarily between −0.05 and 0.05. This stability reflected the operational resilience of Australia’s tourism industry under normal climatic conditions. However, when SOI fell to lower quantiles (approximately below 0.2), it exhibited significant negative impacts, reaching a peak of approximately −0.15. These extreme cases were typically associated with strong El Niño phenomena, which led to abnormally dry weather patterns in Australia. Such weather patterns not only directly affected outdoor tourism activities but also potentially triggered natural disasters such as bushfires, severely impacting tourism infrastructure and site accessibility (Zeng et al., 2024e). This impact was particularly evident in Australia’s renowned natural landscapes, such as the Great Barrier Reef and inland desert regions. QQR result of SOI on specify tourism sector.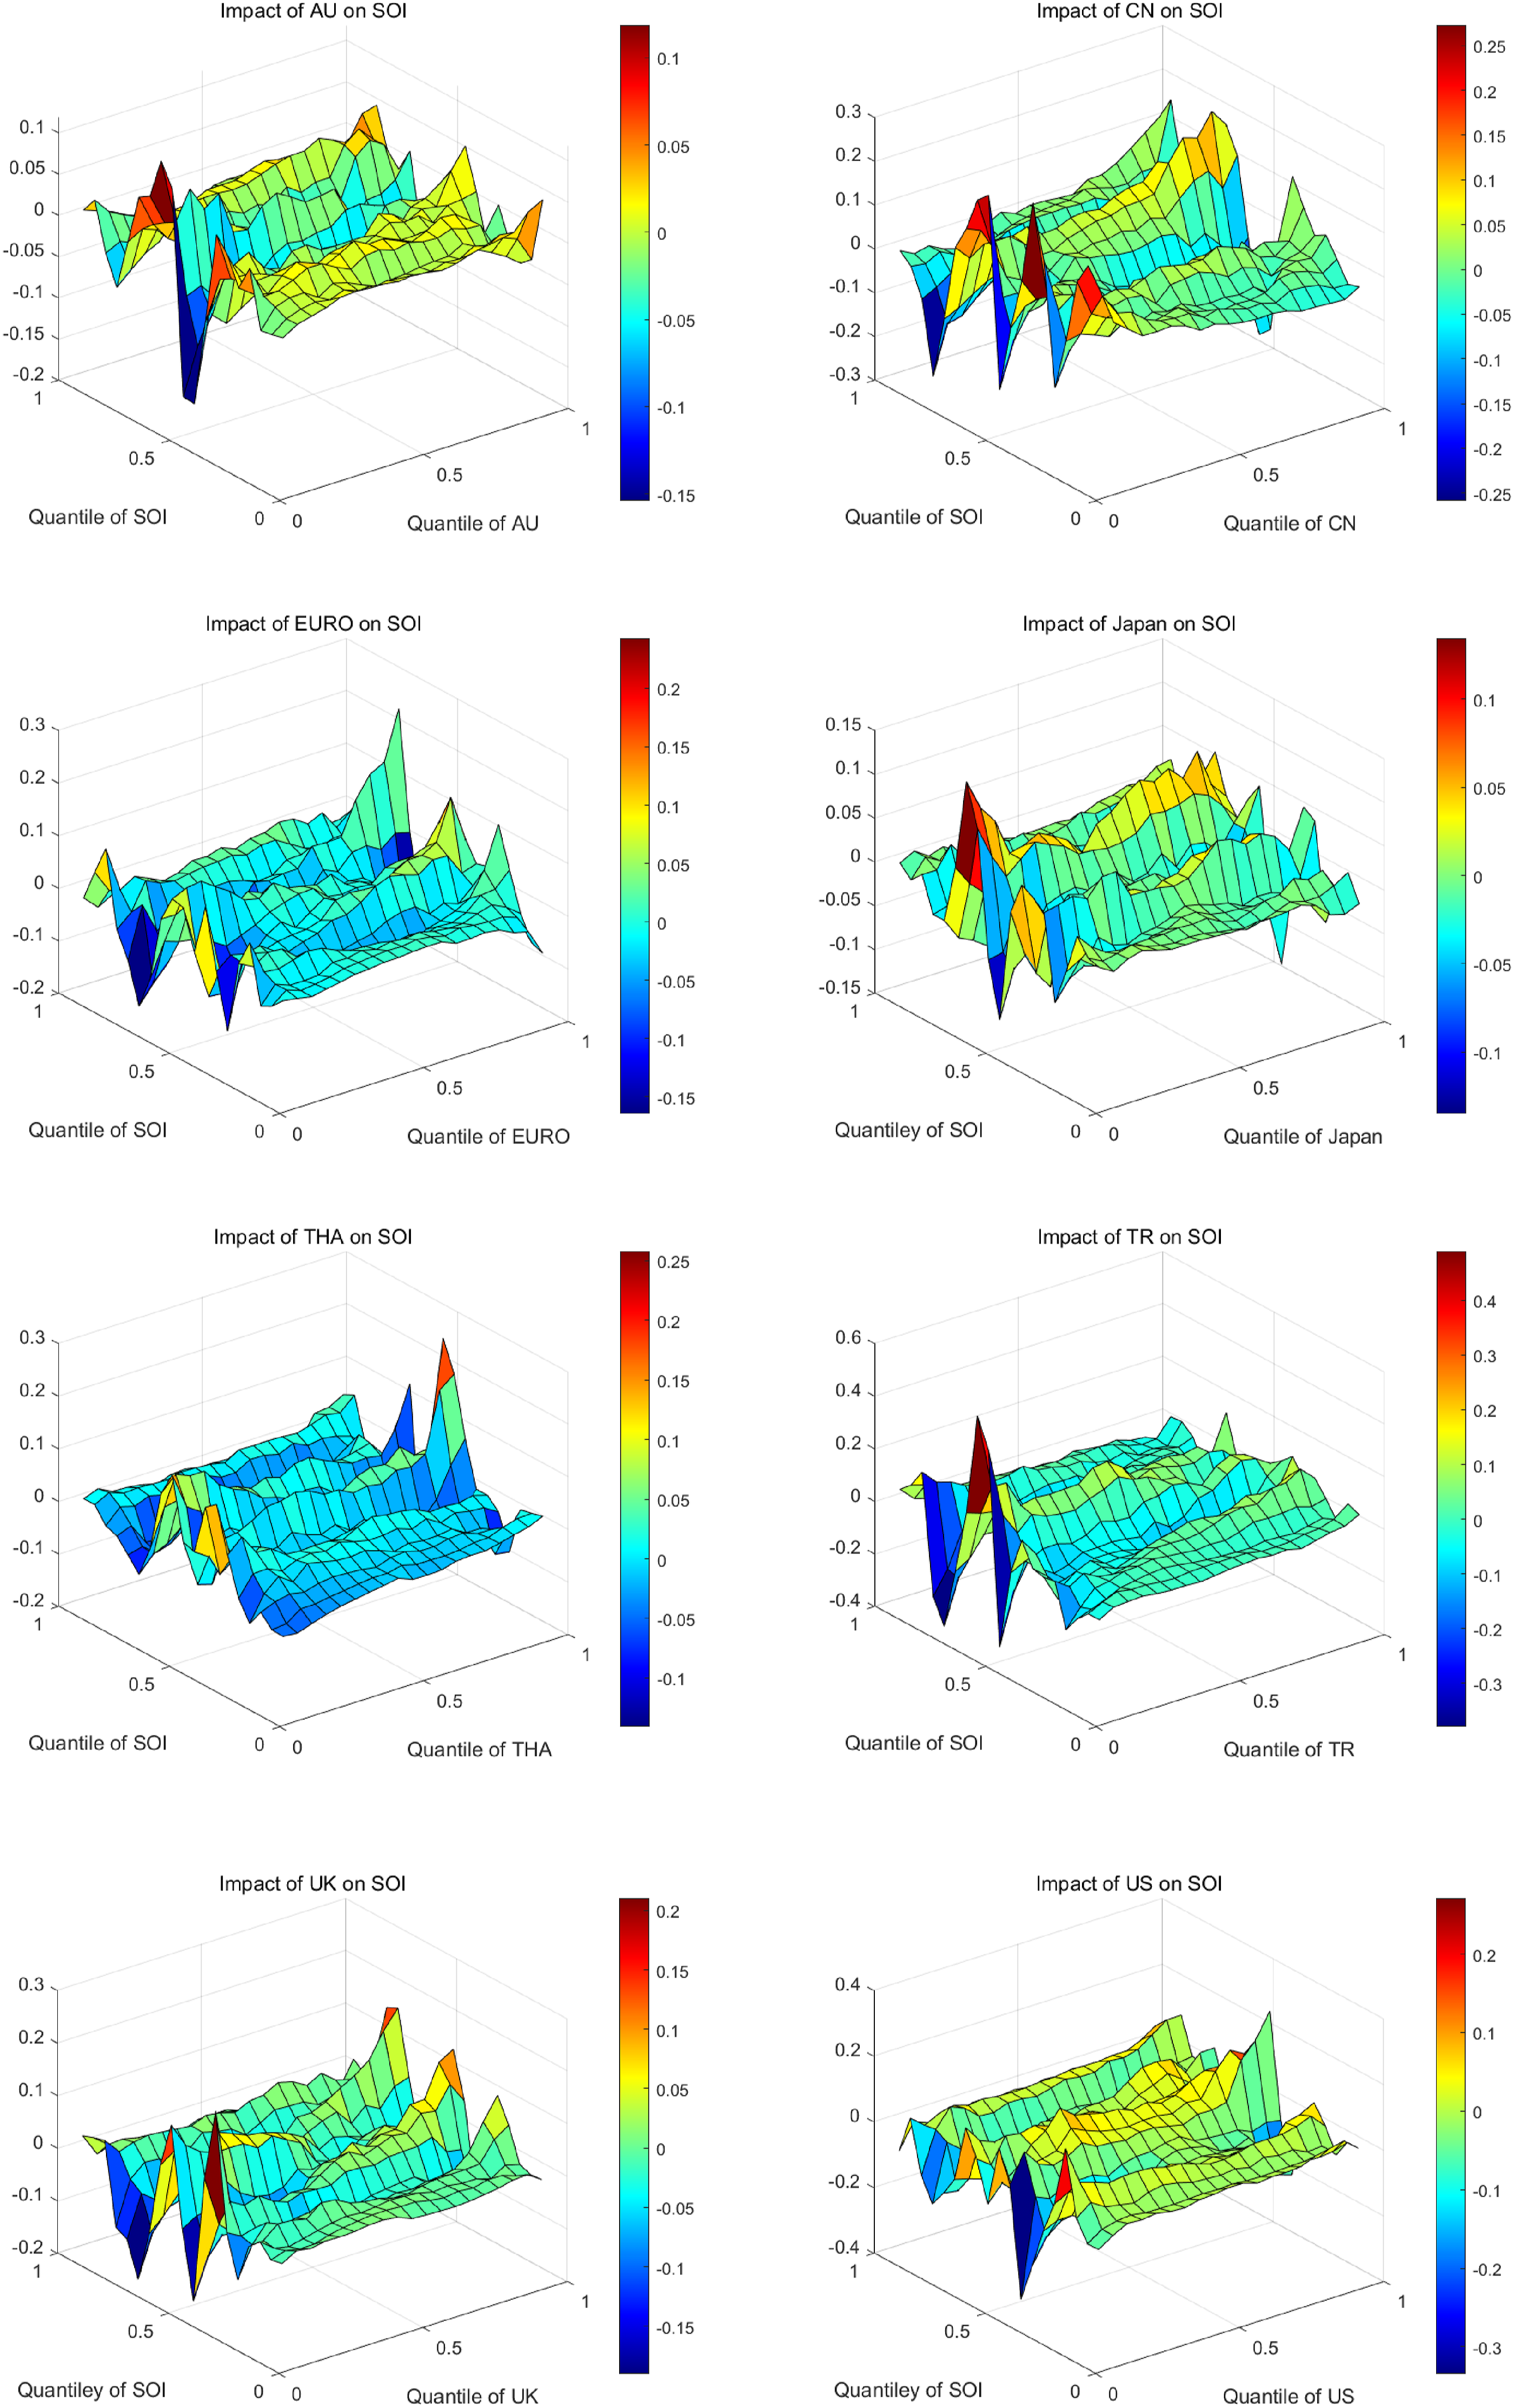
The SOI-CN relationship exhibited the most significant fluctuation characteristics, with the largest impact range among all studied markets, spanning from −0.25 to 0.25. These substantial fluctuations were particularly pronounced in extreme SOI value intervals, indicating that the Chinese tourism market was especially sensitive to extreme climate variations. Specifically, when SOI was in lower quantiles (approximately below 0.2), several significant fluctuation peaks emerged, possibly related to China’s vast territory and diverse climate types. For instance, during El Niño events, the southeastern coastal regions of China might have experienced more frequent typhoons and heavy rainfall, while northern regions might have faced drought conditions. This complex climate impact pattern interacted with the regional diversity of China’s tourism market, resulting in the observed high volatility (Bosone and Nocca, 2022). Notably, when the CN index was in higher quantiles (above 0.7), the market exhibited better stability, potentially reflecting enhanced risk management capabilities in mature market segments.
The SOI-EURO relationship presented relatively smooth terrain characteristics, with impact intensities mostly ranging between −0.1 and 0.1. This stability likely stemmed from multiple factors: firstly, the European tourism market’s high diversification, encompassing both Mediterranean coastal beaches and Alpine ski resorts, which helped distribute climate change risks. Secondly, Europe’s sophisticated infrastructure and indoor attractions (such as museums and historical sites) provided all-weather tourism options (Cavan, 2009). It was particularly noteworthy that when SOI was within the 0.4–0.6 quantile range, the European market demonstrated the strongest stability, indicating excellent operational efficiency and adaptability under normal climate conditions.
The SOI-Japan relationship displayed a unique “wave” pattern, with relatively moderate fluctuations primarily ranging between −0.1 and 0.1. This pattern reflected several characteristics of Japan’s tourism industry: firstly, the diversity of tourism resources, from hot springs to ski resorts, from ancient temples to modern cities, provided year-round tourism options. Secondly, Japan’s sophisticated indoor facilities and public transport system reduced weather dependency. The Japanese market showed optimal stability particularly when SOI was at moderate levels (0.4–0.6 quantiles). However, notable negative impacts were still observed at extreme SOI values (especially in lower quantiles), possibly related to typhoon seasons or abnormal weather conditions.
In contrast, the SOI-THA exhibited a “step-like” impact pattern, with relatively moderate fluctuations in most cases but sudden jumps under specific conditions. Specifically, when both SOI and THA indices were in lower quantiles (approximately below 0.2), the most significant negative impacts emerged, possibly related to Thailand’s tourism industry’s high dependence on climatic conditions. Thailand’s primary tourism resources, such as beach resorts, tropical rainforests, and outdoor cultural heritage sites, were vulnerable to extreme weather conditions. Particularly during the monsoon season, abnormal climate patterns could lead to floods or heavy rainfall, directly affecting tourists' travel decisions (Cohen, 2008).
Furthermore, the SOI-TR demonstrated significant fluctuation characteristics, with impact ranges between −0.4 and 0.4, representing one of the largest volatility amplitudes among analysed markets. The most significant extreme values occurred when SOI was at moderate levels (0.4–0.6 quantiles), forming distinct “peak-valley” structures. This intense volatility might have been closely related to Turkey’s geographical location and climatic characteristics. As a country spanning Europe and Asia, Turkey was simultaneously influenced by Mediterranean and continental climates. When SOI was in lower quantiles (approximately below 0.2), the market showed significant negative reactions, possibly related to precipitation pattern changes caused by El Niño phenomena. Turkey’s main tourism resources, including Mediterranean coastal resorts, Cappadocia’s outdoor landscapes, and Istanbul’s historical sites, were susceptible to extreme weather conditions. Particularly during peak tourism seasons, abnormal climate patterns could directly affect tourist numbers, leading to significant fluctuations in tourism revenue (Burak et al., 2004).
The SOI-UK demonstrated relatively moderate fluctuation characteristics, with impacts primarily ranging between −0.15 and 0.2. Notably, when SOI was at moderate levels, the UK exhibited strong stability, reflecting the mature characteristics of its tourism industry. The UK’s tourism resources primarily consisted of urban sightseeing, cultural heritage, and indoor attractions, making them less susceptible to direct climate change impacts (Gössling, 2002). The graph showed that in regions where the UK index was high (0.7–0.9 quantiles), the impact remained relatively moderate even during SOI fluctuations, indicating strong adaptability in the UK tourism industry. This stability likely originated from several factors: firstly, the UK tourism industry’s diversification strategy, including business and educational tourism segments that were less weather-dependent (Hall, 2010); and finally, the UK’s developed transport infrastructure and emergency management systems effectively reduced negative impacts from extreme weather conditions.
Lastly, the SOI-US also exhibited a unique “stepped” fluctuation pattern, with impact ranges between −0.4 and 0.4, showing considerable volatility. The most significant negative impacts occurred when SOI was in lower quantiles, reaching a peak of −0.4. This pattern reflected several important characteristics of the US tourism market: firstly, the vast territory and diverse climate types, from Alaska’s polar climate to Hawaii’s tropical climate, resulted in significantly different sensitivities to climate change across regions. Secondly, major US tourist destinations were widely distributed, including natural parks, beach resorts, and theme parks, with varying degrees of climate dependency (Zhang et al., 2020). Figure 2 showed that when the US index was in higher quantiles (above 0.8), the tourism sector’s sensitivity to SOI was relatively low, possibly reflecting risk diversification capabilities during bull market conditions. Particularly noteworthy was that when SOI was at moderate levels (0.4–0.6 quantiles), the US market demonstrated good stability, indicating strong operational efficiency under normal climate conditions.
Tests for Granger-causality in quantiles among the SOI and the tourism market of major economics.
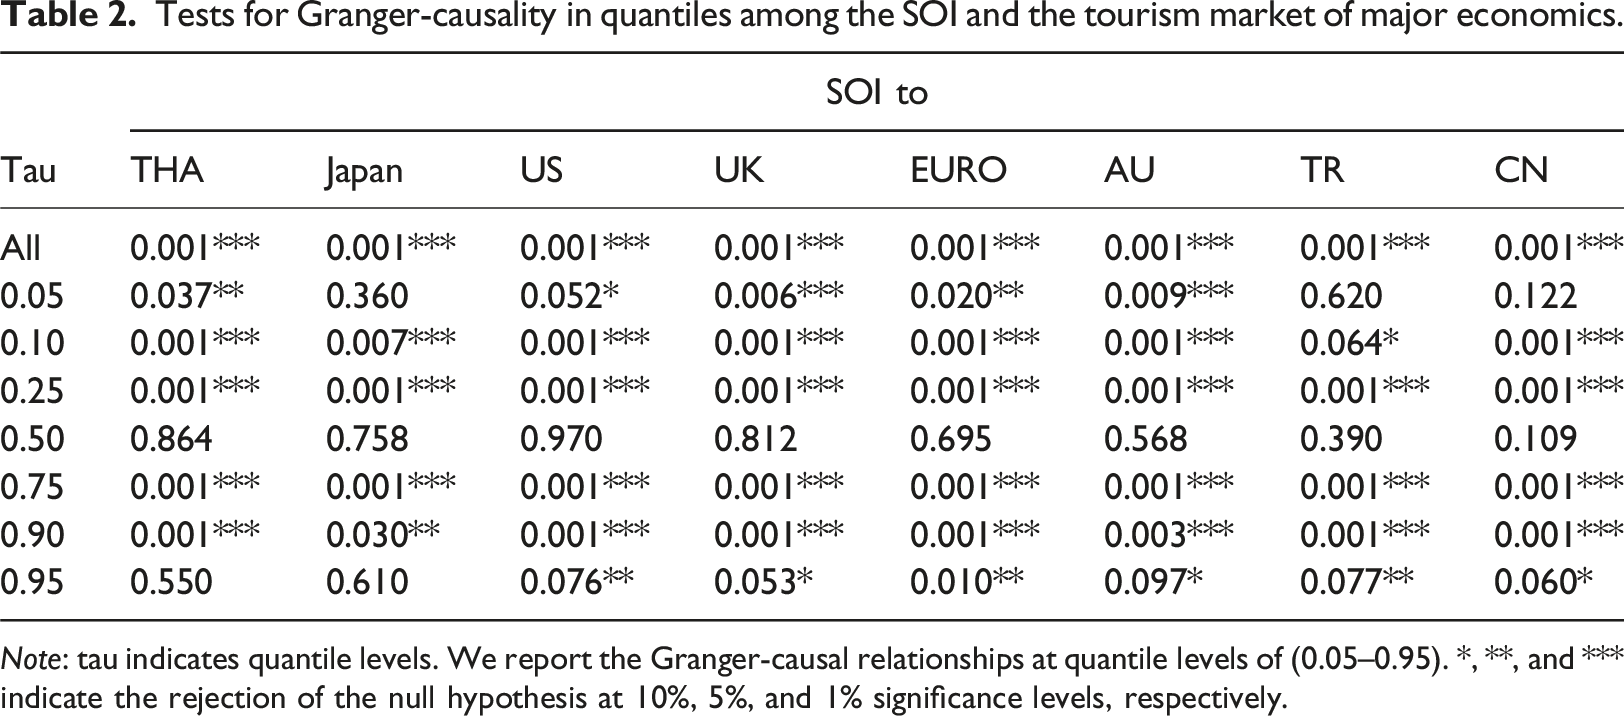
Note: tau indicates quantile levels. We report the Granger-causal relationships at quantile levels of (0.05–0.95). *, **, and *** indicate the rejection of the null hypothesis at 10%, 5%, and 1% significance levels, respectively.
In the median (tau = 0.5) range, where markets were relatively stable, no significant Granger causality relationship was observed between tourism sectors and SOI across all countries and regions, with p-values exceeding 0.1, indicating limited SOI impact on leisure tourism markets under normal market conditions. However, during extreme lower quantile (tau = 0.05) periods, tourism sectors in all countries and regions except Japan, Turkey, and China showed significant Granger causality relationships with SOI, suggesting significant SOI influence on most countries’ leisure tourism markets during extreme downward market conditions.
Particularly noteworthy was that in the 0.25 and 0.75 quantile ranges, tourism sectors across all countries and regions demonstrated strong Granger causality relationships with SOI, with p-values of .001 and significance at the 1% level. This indicated SOI’s universal influence on global leisure tourism markets during periods of slight market fluctuation. However, when markets were in extreme upward conditions (tau = 0.95), the Granger causality relationships between tourism sectors and SOI were relatively weak for China, Australia, and Turkey, significant only at the 10% level, while other countries and regions maintained significance at the 5% level, reflecting varying sensitivities to SOI across different economics’ tourism markets during extreme upward market conditions.
We then explore the lead-lag relationship between the SOI and the tourism sectors of specific countries across different time and frequency domains. This analysis helps us understand the heterogeneous impact of the SOI on the tourism sectors of particular countries over different time periods and investment horizons (frequencies). Through Wavelet Coherence analysis, we examine the spatiotemporal correlations between the SOI and the climates of China, Turkey, Thailand, Japan, Europe, the United Kingdom, the United States, and Australia. Wavelet Coherence analysis can reveal the localized correlation between two time series across different times and frequencies, providing profound insights into the multi-scale impact of the SOI on the climates of these regions.
In Figure 3, our initial analysis of the wavelet coherence between the US tourism sector and SOI revealed complex time-frequency characteristics during 2016–2024. Between 2018 and 2020, significant coherence was observed in high-frequency regions (4–16 day periods), potentially reflecting the direct impact of short-term weather variations on tourism demand. Notably, mid-2020 exhibited a significant high-coherence region in the medium-frequency range (32–64 day periods), possibly associated with the series of extreme weather events experienced in the United States (Abedin et al., 2024), including the significant impacts of hurricanes and abnormal precipitation on tourism activities. Post-2022, whilst high-frequency coherence diminished, the medium-frequency region maintained relatively stable correlation. Time-frequency correlation analysis of the SOI and the climate of various regions. Notes: The figure displays the wavelet coherence results between the SOI and the tourism sectors of major economies' stock markets. The horizontal axis represents the time domain (covering the entire sampling period), while the vertical axis represents the frequency domain (ranging from 4 to 256 days). The level of co-movement is indicated by the colours on the right side of the figure; warmer colours (with red being the warmest) signify stronger absolute correlations, while cooler colours (with blue being the coldest) suggest weaker correlations. The intensity of the warm colours or the presence of small red islands indicates a stronger consistency between the indicators. Arrows are used to depict the phase relationships between the pairs of indicators, with zero phase difference suggesting synchronous movement at a given scale. In cases of in-phase (or anti-phase) alignment, the arrows point to the right (or left). Arrows pointing to the upper right or lower left suggest that the first indicator leads (or the second indicator lags), while arrows pointing to the lower right or upper left indicate that the second indicator leads (or the first indicator lags). The results in this table show the presence of grey dashed lines, indicating that the correlation between regions reaches statistical significance at the 5% level.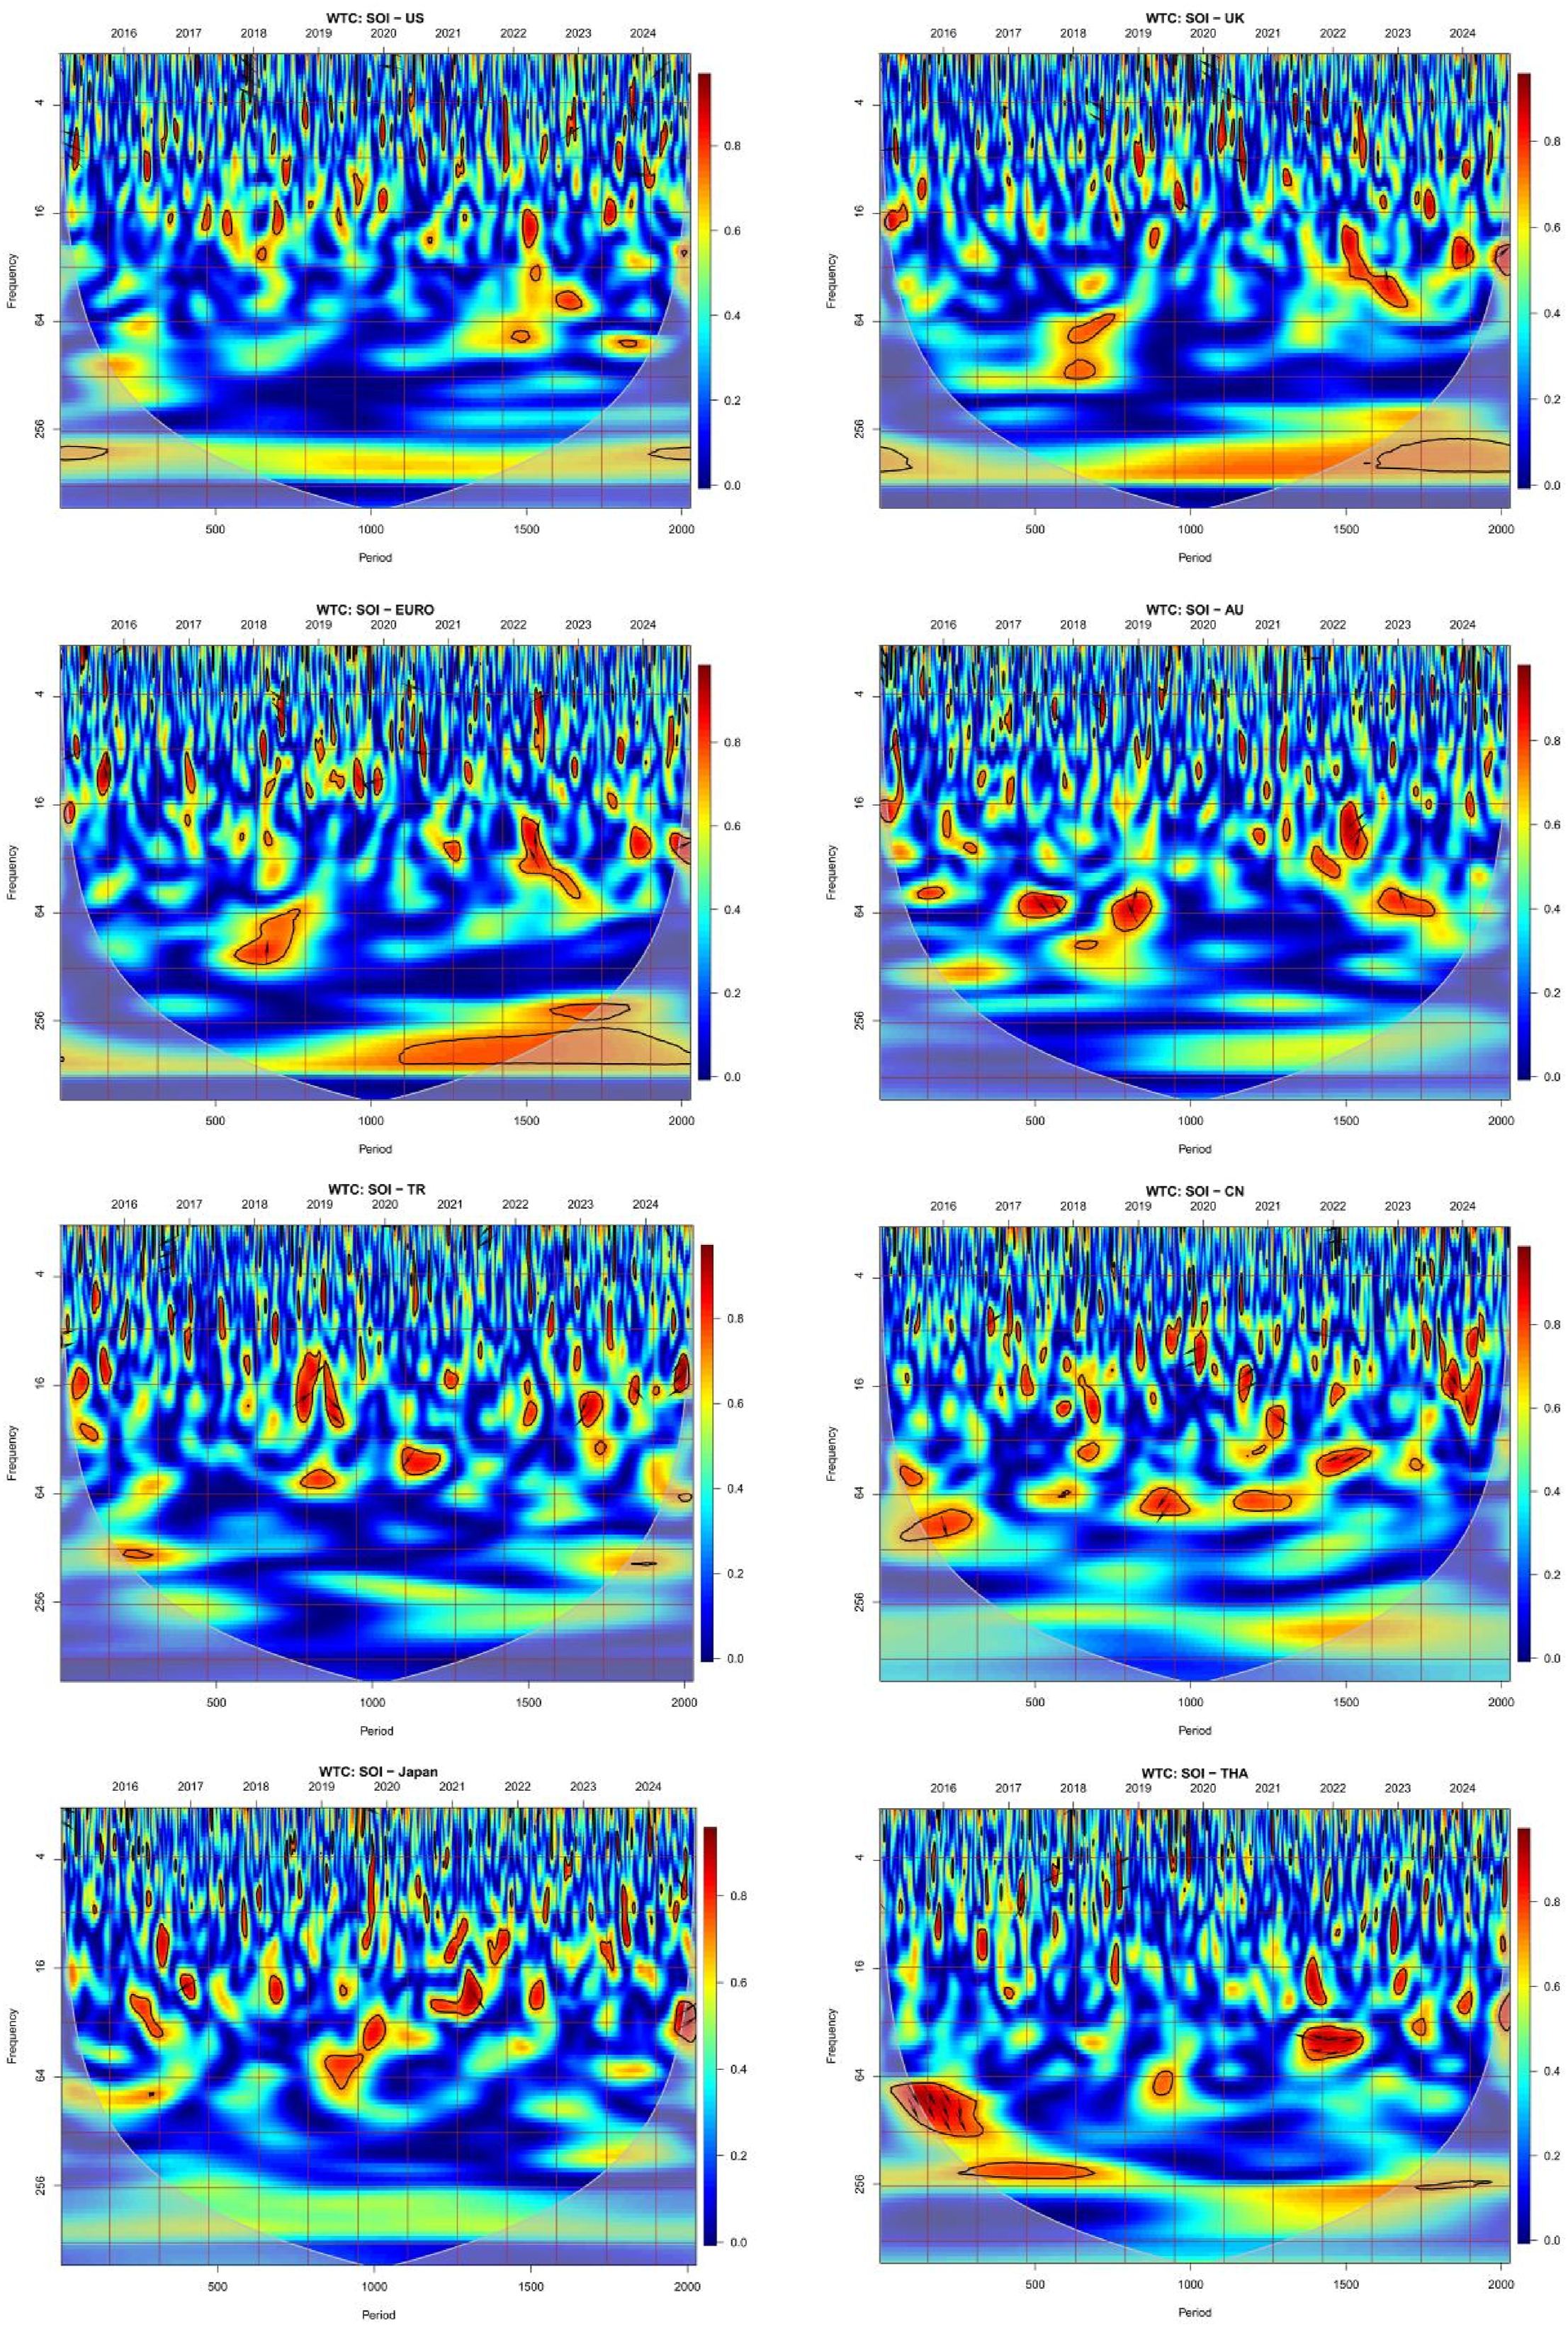
The coherence analysis between the UK tourism sector and SOI demonstrated significant correlation in high-frequency regions during 2019–2021, alongside strong coherence in low-frequency regions (64–128 day periods) post-2022. This cross-scale correlation pattern suggested that SOI potentially influenced UK tourism through linkages with the North Atlantic climate system. Particularly in 2023, enhanced coherence was observed in both high and medium-frequency regions, potentially reflecting increased sensitivity of the UK tourism industry to extreme climate variations.
The EU region’s tourism sector exhibited unique time-frequency characteristics in its relationship with SOI. During 2018–2020, a significant high-coherence region formed in the medium-frequency range, potentially correlating with pre-COVID-19 European tourism seasonal patterns. Notably, post-2022 demonstrated sustained high coherence in low-frequency regions, suggesting SOI’s continuous influence on tourism development through its impact on Europe’s long-term climate patterns. Simultaneously, high-frequency coherence displayed intermittent strengthening throughout the observation period, indicating periodic impacts of short-term weather variations on the European tourism market.
The Australian tourism sector demonstrated particularly significant coherence with SOI in medium-frequency regions during 2017–2019. This strong correlation likely stemmed from the high sensitivity of Australian tourism to regional climatic conditions, especially concerning natural landscape tourism resources such as the Great Barrier Reef (Waitt, 1999). Post-2021, enhanced coherence was observed in medium-high frequency regions (8–32 day periods), potentially reflecting increased climate sensitivity within the Australian tourism industry.
Wavelet coherence analysis of the Turkish tourism sector and SOI revealed distinct spatiotemporal patterns. Significant coherence appeared in both high and medium-frequency regions during 2018–2020, indicating Turkish tourism’s sensitivity to both short and medium-term climate variations. Notably, medium-frequency coherence strengthened significantly post-2023, possibly related to Mediterranean climate change impacts on tourism seasonality. The relatively weak coherence in low-frequency regions suggested that SOI’s long-term impact on Turkish tourism might have been less significant than in other regions.
Analysis of the Chinese tourism sector’s wavelet coherence with SOI revealed rich time-frequency characteristics during 2016–2024. Significant coherence emerged in medium-frequency regions (32–64 day periods) during 2016–2018, possibly related to monsoon climate’s cyclical impact on Chinese tourism sector. Notably, post-2022 demonstrated strong coherence in both high-frequency (4–16 day periods) and medium-frequency regions, indicating increased sensitivity to short and medium-term climate variations, potentially associated with the recent increase in extreme weather events (Zhang et al., 2025).
Interestingly, Japan’s tourism sector exhibited unique coherence patterns with SOI. Specifically, during 2019–2021, significant high-coherence regions formed in medium-frequency areas, possibly related to the climate sensitivity of Japan’s unique seasonal tourism patterns (such as cherry blossom season). Post-2022 showed notably enhanced high-frequency coherence, potentially reflecting increased responsiveness to short-term weather variations, particularly against the backdrop of recent frequent natural disasters.
Thailand’s tourism sector demonstrated distinct time-frequency dependent characteristics in its relationship with SOI. Early 2016 showed strong coherence in low-frequency regions (128–256 day periods), potentially related to monsoon climate influences on long-term tourism planning (Chaudhary et al., 2022). Notably, significant high coherence emerged in medium-frequency regions post-2021, indicating increased sensitivity to seasonal climate variations.
Summarising the analysis of SOI’s impact on tourism sectors across eight countries and regions, several key findings emerged: firstly, SOI’s influence demonstrated clear regional variations, closely related to local climatic characteristics and tourism resource endowments. Pacific Rim countries (such as Australia and Japan) exhibited more significant correlations, possibly due to their geographical proximity to SOI measurement points. Secondly, temporal scale impacts varied notably: Western countries (US, UK, EU) primarily demonstrated high and medium-frequency correlations, whilst Asian countries (China, Japan, Thailand) showed significant linkages across various frequency regions. Finally, post-2022, most countries’ tourism sectors showed enhanced coherence with SOI, particularly in medium-frequency regions, potentially reflecting generally increased climate sensitivity in the tourism industry against the backdrop of global climate change. These findings not only enhanced understanding of climate change’s impact mechanisms on global tourism but also provided crucial references for investors' decision-making in tourism sector investments.
Robustness test
Quantile Regression (QR) is a regression method used to estimate the conditional distribution of a response variable at a given quantile. By modeling different quantiles of the data, QR provides a more detailed description than mean regression, especially in handling data heterogeneity and non-normal distribution (Koenker and Hallock, 2001). QQR extends the concept of QR by quantifying the interdependence between two variables at different quantile levels, capturing more complex dependency structures between variables. QQR not only considers the distribution characteristics of a single variable but also accounts for the joint distribution of multiple variables at different quantiles (Chernozhukov and Hansen, 2006). While the QR model estimates the conditional distribution at different quantiles by modeling the behavior of a single variable at specific quantiles, it may overlook the complex relationships between that variable and others at extreme values. In contrast, QQR, by capturing the interdependence between quantiles, better reflects the extreme phenomena in the data. This also explains why the results of the QQR model may differ significantly from those of the QR model at extreme quantiles (e.g., 0.1 or 0.9).
To further validate the robustness of the QQR method, we conducted a comparative analysis with the QR method. Figure 4 presents the regression results under different conditions for both QR and QQR methods, where the green line represents the QR results, and the red line represents the QQR results. This visual comparison allows us to more intuitively observe the differences and consistencies between the two methods in capturing data characteristics, thereby providing a more comprehensive evaluation of the robustness and superiority of the QQR method in different scenarios. This comparison not only helps to understand the performance of both methods in handling data heterogeneity but also provides a basis for further optimization of regression models. Comparison between QR and QQR models.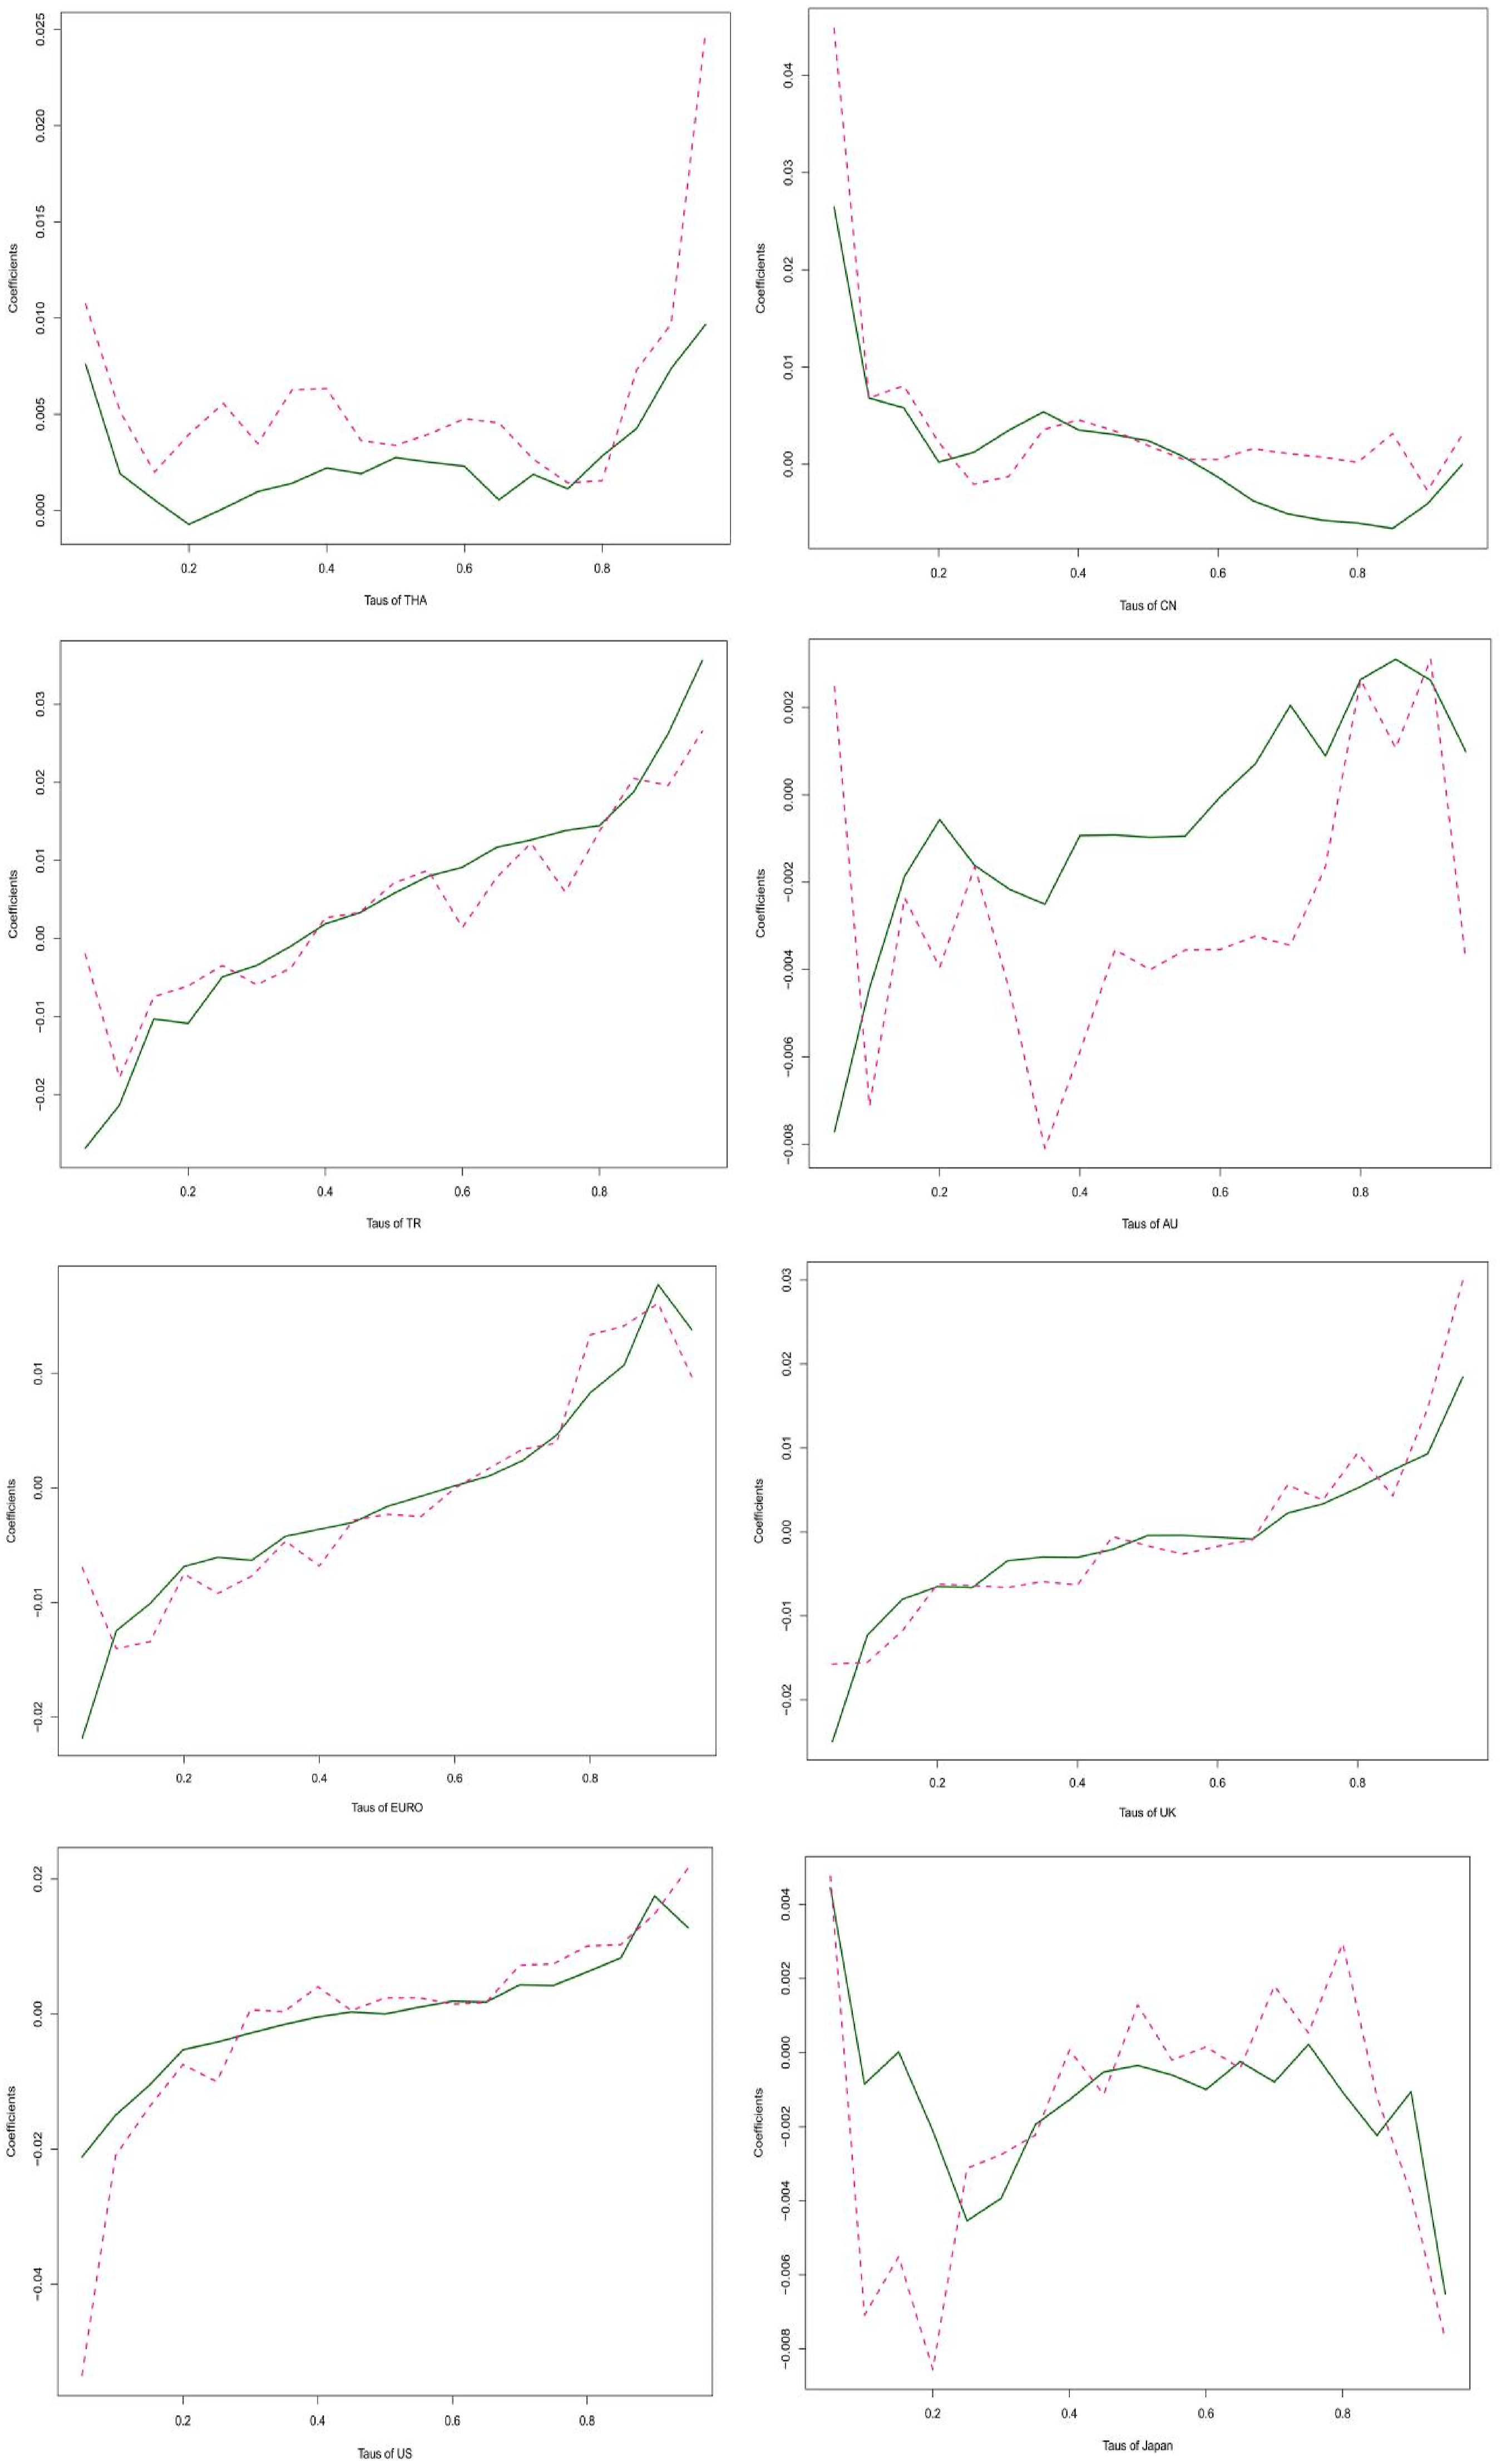
Upon examining Figure 4, the US and UK markets exhibited notably similar characteristics, with QR and QQR methods demonstrating high consistency across low to medium quantiles. In the US market particularly, the two methods almost completely converged in the region where Taus<0.6, reflecting the stability of mature markets in response to climatic factors (Wu et al., 2024). In higher quantiles, the QQR method indicated slightly higher coefficients, potentially suggesting enhanced SOI sensitivity within the US tourism sector during periods of market prosperity. The UK tourism sector demonstrated stronger consistency across medium to high quantiles, reflecting its relatively robust risk management systems.
Within Asian markets, China and Japan displayed distinctive characteristics. The Chinese market exhibited notable divergence between QR and QQR methods in extreme quantile regions (Taus<0.2 and Taus>0.8), suggesting potentially more complex non-linear relationships within China’s tourism sector under extreme climatic conditions. The Japanese market demonstrated relatively stable trends, although the QQR method captured more significant fluctuations in higher quantiles, possibly related to the Japanese tourism industry’s particular sensitivity to climate change. Thailand’s market, representing Southeast Asian tourism, exhibited substantial volatility across different quantiles, particularly in extreme regions, reflecting its tourism industry’s high sensitivity to climatic factors (Zeng et al., 2023).
The Australian market presented a unique pattern, with coefficients from both QR and QQR methods showing considerable volatility across multiple quantiles. These characteristics likely stemmed from Australia’s distinctive geographical location and tourism resource characteristics, rendering its tourism sector particularly sensitive to climate change (Lu and Zeng, 2023). The greater volatility demonstrated by the QQR method across certain quantiles potentially provided a more accurate reflection of extreme weather events’ actual impact on Australian tourism.
Turkey, as a Near Eastern tourism market, exhibited characteristics distinct from other markets. Specifically, QR and QQR methods showed substantial variations across different quantiles, particularly in lower quantile regions, potentially reflecting its tourism industry’s vulnerability to external shocks and market imperfections. The EU market, conversely, demonstrated a more stable pattern, with high consistency between both methods across most quantiles, likely benefiting from the EU’s sophisticated market mechanisms and risk diversification effects through regional integration.
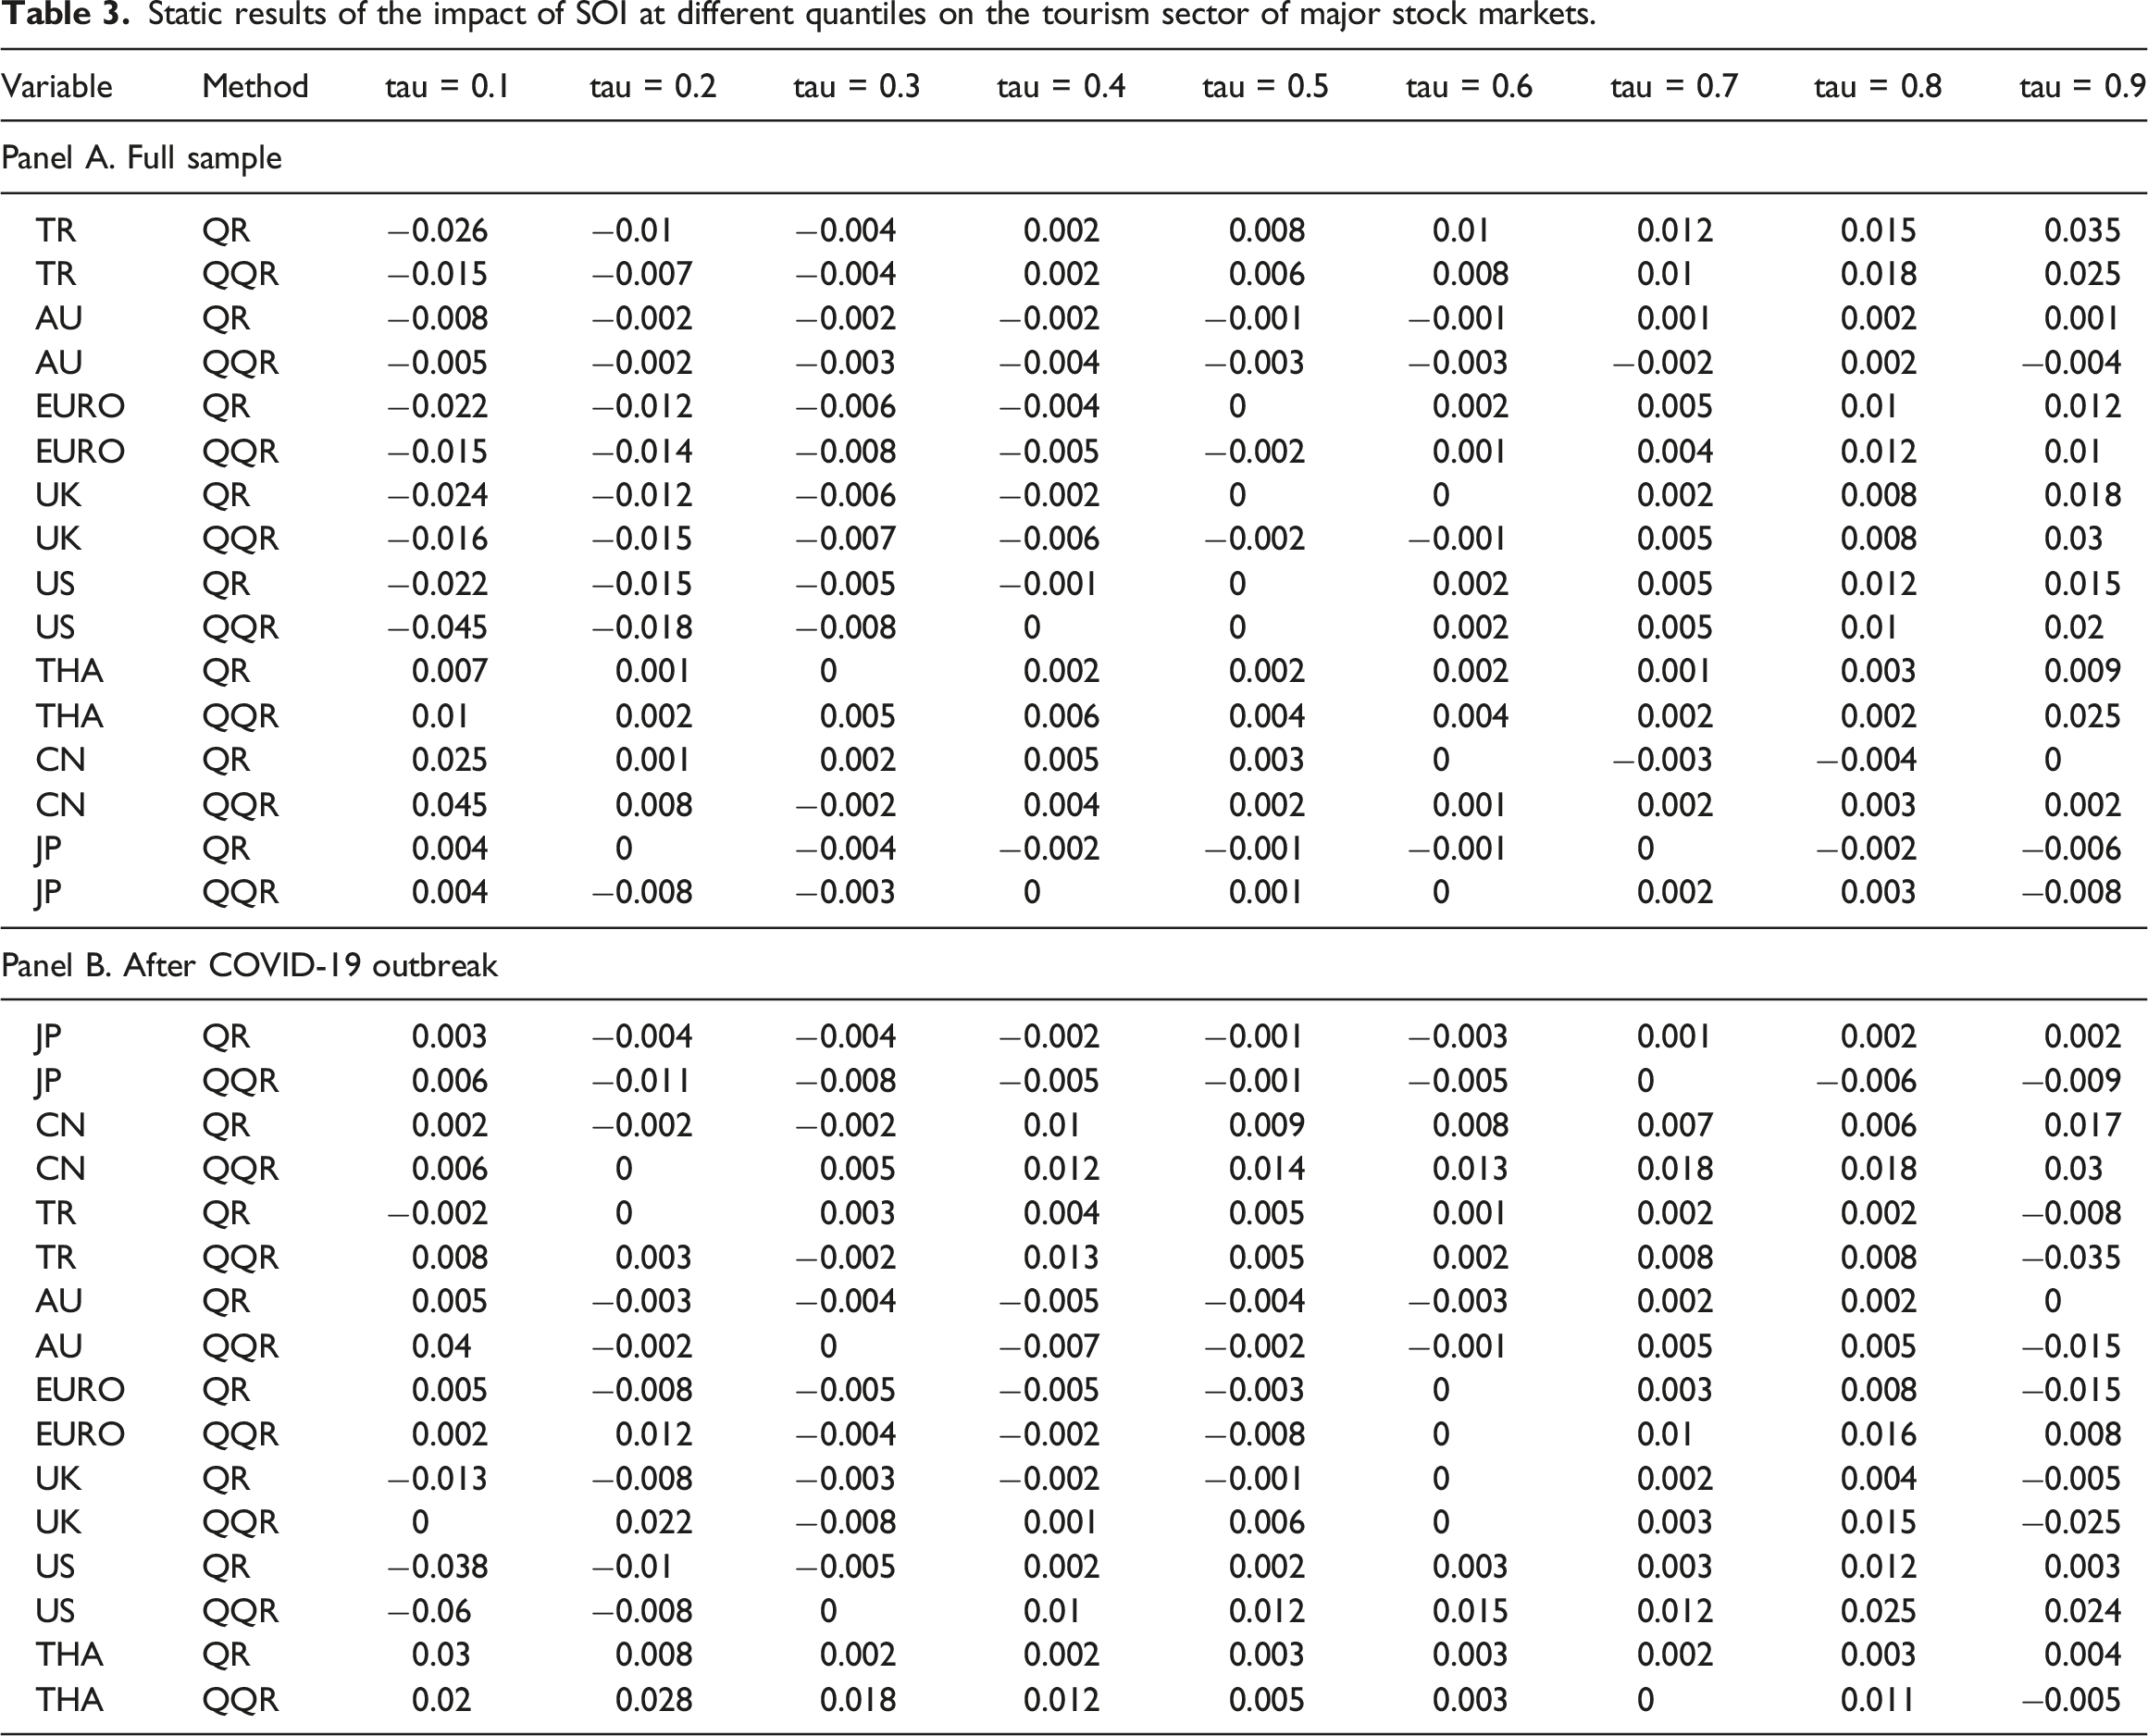
Further analysis comparing the estimation results of QR and QQR models across different sample divisions, as shown in Figure 4 (total sample period), Figure 5 (post-COVID-19 outbreak), and Table 3 (static results of Figures 4 and 5), revealed significant robustness characteristics across both the total sample period and the COVID-19 period. Despite the exceptional market crisis period during COVID-19, most markets maintained similar trend patterns across both QR and QQR methods, strengthening the reliability of our primary research conclusions. Comparison between QR and QQR models (after COVID-19 outbreak). Static results of the impact of SOI at different quantiles on the tourism sector of major stock markets.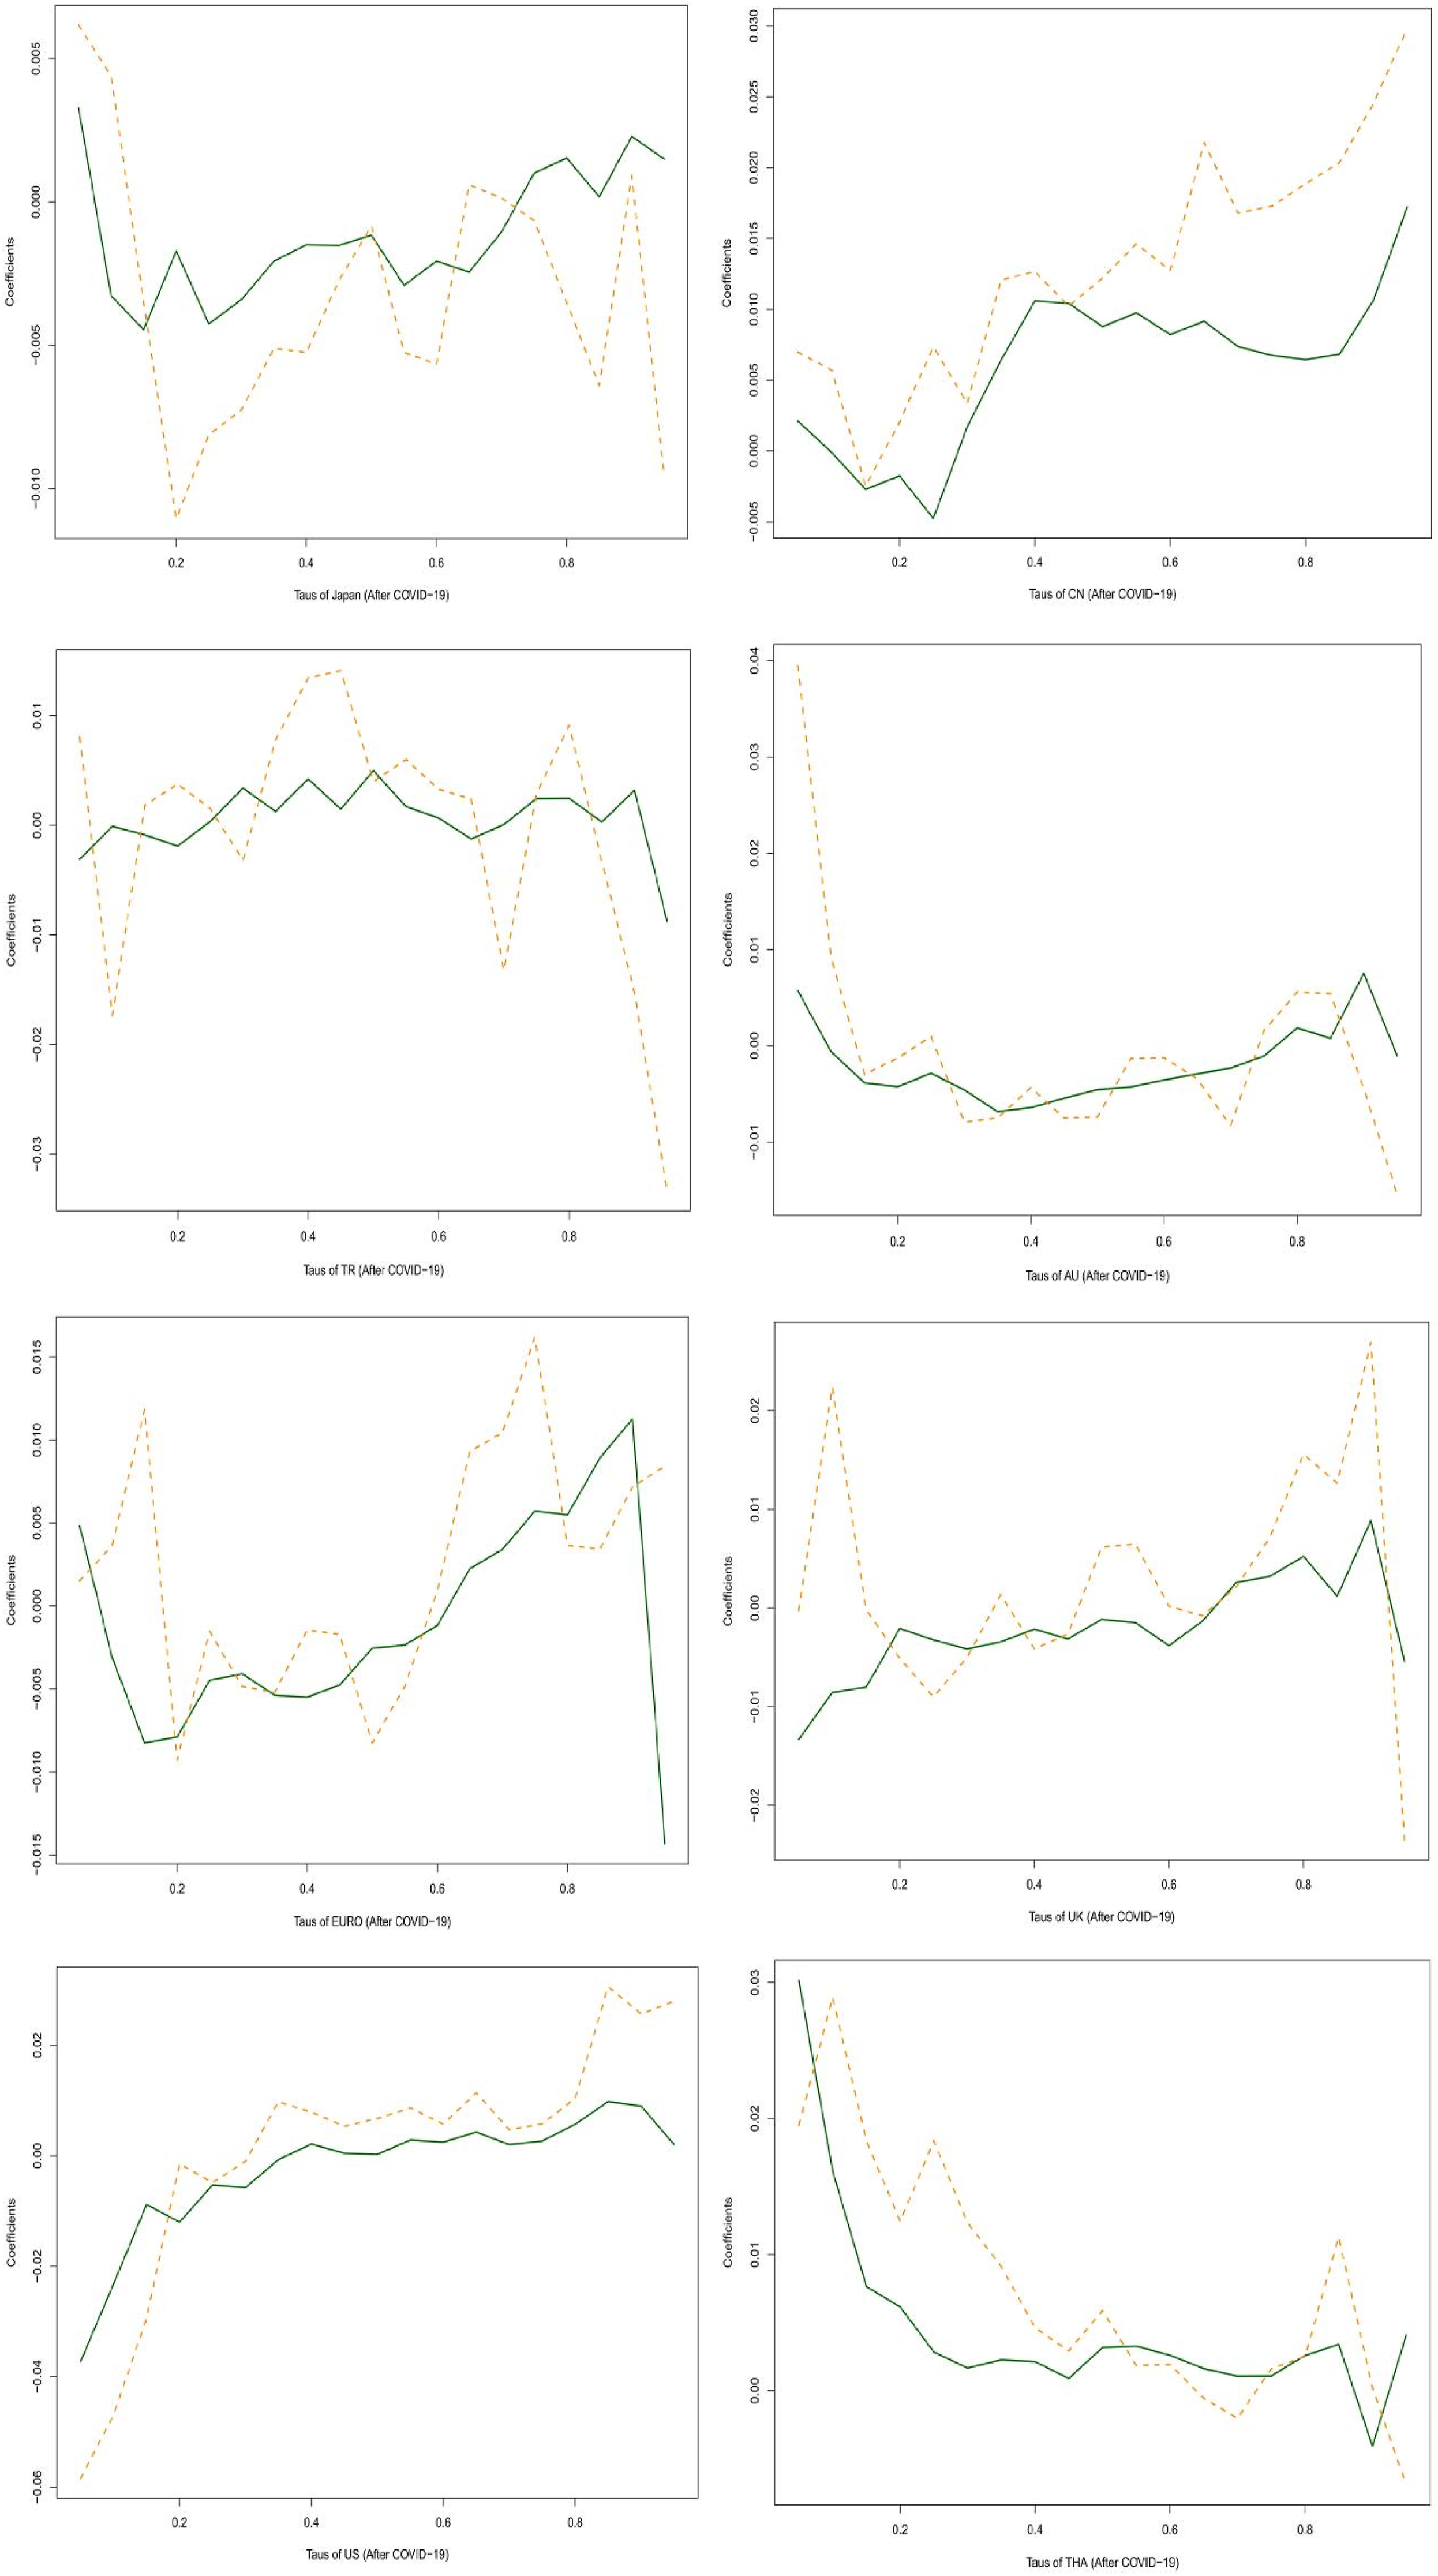
As previously noted, the empirical results for mature developed markets, particularly the United States and United Kingdom, warranted special attention. Their QR and QQR coefficients maintained similar variation trends across most quantile intervals during both sample periods, demonstrating especially high consistency near the median region. These robust results indicated that SOI maintained persistent explanatory power over tourism sectors in both the US and UK markets.
Similarly, comparison of Figures 4 and 5 demonstrated result robustness in the EU market. The QR and QQR coefficient trends during the COVID-19 period maintained fundamental consistency with the total sample period, particularly displaying closer alignment in medium to high quantile regions. This stability reflected the EU market’s sustained response characteristics to extreme climatic factor influences.
Asian markets also exhibited strong robustness in their results. The Chinese market displayed similar non-linear characteristics across both periods, with the QQR method consistently demonstrating greater sensitivity than QR at extreme quantiles, strengthening the credibility of our research findings. While the Japanese market showed some variation across different periods, it maintained relatively stable overall trends.
The Australian market analysis results similarly maintained strong consistency across both periods. The relative relationship between QR and QQR methods remained stable across most quantiles, further supporting the robustness of our primary research conclusions.
Finally, Thai and Turkish results also demonstrated similar robustness characteristics. Although dynamic results showed increased volatility during the exceptional COVID-19 period, the fundamental relationship patterns captured by both QR and QQR methods remained consistent with the total sample period (Lu et al., 2023).
In summary, the comparative analysis between the total sample period and post-COVID-19 outbreak demonstrated that whilst most markets exhibited relatively stable characteristics near the median, significant variations were observed at extreme quantiles (particularly at tau = 0.1 and tau = 0.9). This pattern of change suggested that whilst COVID-19 might have altered the response mechanisms of studied markets to extreme events to some extent, it did not fundamentally disrupt the basic relationship between SOI and tourism sector returns across major economies. The stability near the median provided reliable support for research conclusions, whilst differences at extreme quantiles revealed the dynamic evolution of market risk characteristics.
Conclusions and policy implications
This study thoroughly analyses the relationship between the SOI and the stock indices of major global tourism markets, revealing the differentiated impacts of climate change on the tourism sectors of major economies, including the United States, the United Kingdom, China, Australia, Japan, Thailand, Turkey, and the European Union. The research employs QQR and the quantile Granger-causality test, alongside wavelet coherence analysis, to systematically investigate the sensitivity and adaptability of the tourism sectors in these eight major economies to climate change.
The QQR results indicate significant regional and temporal heterogeneity in how markets respond to climate change. Regionally, Pacific Rim countries (such as Australia and Japan) exhibit stronger sensitivity to the SOI, which is closely linked to their geographic proximity to SOI measurement points. Specifically, the Australian market shows a notable negative impact when the SOI is at extremely low quantiles, with an impact of −0.15, reflecting the region’s vulnerability to the El Niño phenomenon. In contrast, European markets demonstrate greater stability, with fluctuations generally ranging between −0.1 and 0.1, a stability attributed to their diversified tourism resources and well-developed infrastructure.
The quantile Granger-causality test delves into the causal relationships between the SOI and the global tourism markets, revealing significant nonlinearity and heterogeneity. Overall, all tourism indices of the studied markets show a significant Granger causal relationship with the SOI. However, this relationship varies significantly under different market conditions. At the relatively stable median (tau = 0.5) quantile, no significant Granger causality was observed between the SOI and the tourism indices of all countries and regions. Yet, at the slightly fluctuating quantiles (tau = 0.25 and 0.75), a strong Granger causal relationship was evident across all markets.
Time-based analysis uncovers the complex dynamic characteristics of climate impacts. Wavelet coherence analysis shows that after 2022, the coherence between the tourism sectors and the SOI generally increased for most countries, particularly in the mid-frequency region (32–64 days cycle), reflecting an overall increase in tourism sector sensitivity to climate factors under the global climate change context. Western countries predominantly exhibit high-frequency and mid-frequency correlations, while Asian countries show significant linkage across various frequency ranges. This discrepancy may stem from differences in regional tourism resource structures and climate characteristics.
The study also reveals that market maturity plays a crucial role in influencing climate sensitivity. Developed markets, such as the United States, the United Kingdom, and the European Union, demonstrate higher stability and predictability, as evidenced by the consistency between QR and QQR methods across most quantiles. Conversely, emerging markets, such as China, Thailand, and Turkey, exhibit more complex nonlinear characteristics, especially in extreme quantiles, where significant divergence in estimates between the two methods was observed, indicating higher sensitivity to external shocks in these markets.
Notably, the COVID-19 pandemic did not fundamentally alter the basic relationship between the SOI and tourism sector returns. A comparison of pre- and post-pandemic samples shows that most markets maintained stable characteristics near the median, although some changes were observed at extreme quantiles, the overall relationship pattern remained relatively consistent.
These findings carry significant implications for global tourism industry investment decisions and policy formulation. From an investor’s perspective, the study provides crucial insights for investment strategies. The identified market differences suggest the importance of geographic diversification in portfolios. Specifically, developed markets (such as the UK, Europe, and Japan) exhibit stability, making them ideal for defensive investments, especially in the context of increasing climate uncertainty. Tourism-related assets in these markets can serve as “safe harbours” in investment portfolios. In contrast, emerging markets (such as China and Turkey) tend to be more volatile but often offer higher return potential under normal climate conditions, making them suitable for investors with higher risk tolerance. Furthermore, the study underscores the importance of conducting thorough due diligence, emphasising that investors should pay special attention to the infrastructure, climate adaptation capabilities, and risk management systems of target markets. For instance, when assessing resort investments, it is vital not only to consider current profitability but also to evaluate preparedness and adaptability to extreme weather events.
Additionally, the seasonal impact patterns identified in the study offer valuable guidance for timing investment decisions. Investors can adjust their entry and exit points based on the climate sensitivity of different markets. The study also suggests that investors focus on companies with innovative climate adaptation strategies, such as those developing all-weather tourism products or employing advanced technologies for climate risk management, as these companies may gain a competitive advantage in the face of future climate change.
For policymakers, the study provides important grounds for formulating differentiated policies. Firstly, in terms of infrastructure development, policymakers need to focus on enhancing the climate resilience of tourism facilities, including improving disaster resistance of transportation infrastructure, upgrading drainage systems, and raising building standards. This should be prioritised in emerging markets, which are more climate-sensitive. Secondly, in market regulation, policymakers should establish more comprehensive risk assessment and early warning mechanisms, such as developing tourism climate risk indices and requiring key tourism businesses to disclose regular climate risk assessments. These measures can help market participants better understand and manage risks. Furthermore, policies should encourage the diversification of tourism products, with tools like tax incentives and subsidies to support the development of all-weather tourism products, reducing reliance on climate conditions. Policymakers should also support the adoption of new technologies, such as virtual reality, to offer alternative tourism experiences under extreme weather conditions. In terms of international cooperation, policymakers need to enhance cross-border cooperation mechanisms. Given the global nature of climate change, the establishment of an international tourism climate risk-sharing platform, to promote information exchange and experience sharing, is becoming increasingly crucial. This is especially true for regions that share similar climate risks, where joint response mechanisms could improve overall adaptability. Additionally, policymakers should consider establishing a dedicated tourism climate adaptation fund to support regions severely impacted by climate change.
While this study provides valuable insights into the relationship between climate change and global tourism markets, several limitations should be acknowledged. First, although the Southern Oscillation Index (SOI) serves as a significant indicator of climate variability, a single metric may not fully capture the complexity of climate change. Other climate indicators, such as the North Atlantic Oscillation (NAO) and Indian Ocean Dipole (IOD), may also exert substantial influences on tourism markets. Second, our reliance on tourism sector stock indices as proxies for tourism industry performance may present certain limitations, as many tourism enterprises remain unlisted, and stock markets are subject to various non-climate factors.
Footnotes
Declaration of conflicting interests
The author(s) declared no potential conflicts of interest with respect to the research, authorship, and/or publication of this article.
Funding
The author(s) disclosed receipt of the following financial support for the research, authorship, and/or publication of this article: Hongjun Zeng appreciates being awarded the RMIT Research Stipend Scholarships (RRSS-SC).