
Abstract
This paper examines in detail the spillover impacts of tourism on regional poverty, income inequality and inter-regional disparities within an integrated framework. Our novel approach integrates regional TSA and household micro-data within a regional computable general equilibrium model. The findings reveal that while the impacts of tourism expansion are positive at the national level, poverty in some regions can be exacerbated due to the spillover impacts from real exchange rate appreciation and resource reallocation. Another important finding is that although tourism’s impact on within-region income inequality is mostly unfavourable, it can reduce inter-regional disparity by stimulating more growth in the less developed regions. Lastly, the poverty-lowering and regional disparity-reducing effects are stronger for international tourism compared to domestic tourism. These results suggest that tourism development strategies should be integrated with the general economic development strategy, both nationally and regionally, otherwise, there is the risk of negative effects.
Keywords
Introduction
Tourism literature has placed significant emphasis on tourism impact on growth (Brida et al., 2016; Song and Wu, 2022). Central to this discussion is the tourism-led economic growth theory, which postulates that international tourism can lead to long-term economic growth by various ways such as generating foreign exchange earnings, stimulating investment, creating employment, and transferring technology across countries (Balaguer and Cantavella-Jordá, 2002; Schubert et al., 2011). However, it is important to recognize that economic growth does not always bring a better livelihood for people (Bartolini and Sarracino, 2014). While growth is one necessary means of development it’s not always sufficient (International Monetary Fund, 2017). Focussing tourism analysis on the aggregate impact, such as economic growth, provides limited insight on the path of socio-economic outcomes (Kronenberg and Fuchs, 2022; Lee, 2009). Therefore, there is a growing need to incorporate distributional aspects in tourism impact analysis.
Copeland (1991) elaborates the theoretical mechanism whereby tourism can affect welfare. In a scenario where a country is experiencing full employment and there is no taxation, tourism can only influence welfare through real exchange rate appreciation that enhance the purchasing power of the destination country. The appreciation of the real exchange rate can, however, hurt manufacturing particularly if the sector is highly tradable. This phenomenon is referred as the Tourism-Dutch Disease effect (Corden, 2012; Holzner, 2011). In the context of sub-national analysis, exchange rate appreciation in a country can benefit tourism-oriented regions by improving their purchasing power but it will negatively impact purchasing power of non-tourism regions. In this case, tourism in one region can create spillover effects for households living in neighbouring regions and this effect might not always be positive. This will eventually affect regional poverty and inequality in a heterogeneous way and also alter regional disparity. This issue remains largely unexplored in current literature. This work addresses this gap.
This study examines in detail tourism’s spillover impact on poverty and income inequality at the regional level and also its impact on inter-regional disparity, using Indonesia as a case study. By doing so, this study contributes to the existing literature in the following ways. First, this study builds on the theoretical mechanisms developed by Copeland (1991) regarding tourism’s welfare and distributional effects by extending the analysis to a an applied muti-regional setting. Although empirical investigation of the poverty and inequality impacts of tourism is growing (Croes and Rivera, 2016; Nguyen et al., 2021; Scheyvens, 2008), findings remain inconclusive (Mahadevan and Suardi, 2017; Zhang, 2023), with analyses rarely being done along a spatial dimension. More importantly, as tourism growth can simultaneously affect regional poverty, income inequality and regional disparity, it is imperative to explore if there exist trade-offs among them. The focus on distributional aspects is also in line with the third objective of sustainable tourism development goals promoted by the World Tourism Organization (UNWTO), which recommends that economic benefits are fairly distributed among stakeholders and contribute to poverty alleviation (UNWTO, 2020).
The second contribution of this study is to develop a regional tourism database of Indonesia that explicitly considers tourism as an independent economic activity. Most tourism-CGE studies such as Amin and Taghizadeh-Hesary (2023); Mahadevan et al. (2016); and Pham et al. (2021) use standard input-output (IO) tables and social accounting matrices (SAM) as their database. These conventional IO and SAM did not present tourism data as explicitly; domestic tourism demand is embedded within household consumption, while inbound tourism demand is embedded within export demand. As tourism and non-tourism demands are mixed, analysis using conventional CGE databases cannot accurately capture the interaction between tourism and the rest of the economy. By incorporating information from the regional TSA and fully integrating the data into a regional CGE database, the model used in this study treats tourism as an independent industry, hence is able to capture the interaction between tourism and other industries at a higher level of accuracy (Dwyer et al., 2016; Pham et al., 2015). This approach represents a significant improvement over most computable general equilibrium (CGE) analysis of tourism, which rely on conventional IO and SAM databases, yet it is still rarely found in the literature.
Third, this study is the first to develop a tourism-CGE model that is both multi-regional and multi-household. With the exception of Li et al. (2019), Pratt and Blake (2009), Pham et al. (2021), and Pham et al. (2015), existing tourism-CGE studies rely on single-region models. Hence, these studies cannot account for inter-regional feedback effects. Ignoring such feedback effects will lead to a homogeneous pattern of effects for all sub-national regions. Whereas, in reality, increased tourism activity in one region may create adverse effects on other regions depending on the importance of tourism in each region. Further, by adding multi-household features to a multi-regional model, this study also captures the impact of tourism on regional poverty, income inequality, and inter-regional income disparities under an integrated framework. Consequently, this study is able to assess the issue comprehensively and serves as a robust platform for understanding how policy responses could be adopted to promote tourism as a development tool for economic growth to alleviate poverty, income inequality and income disparities across regions.
In this study, we have chosen Indonesia as our focus of analysis. Our investigations hold particular significance within the context of Indonesia, a nation characterized by highly varying levels of regional development and great potential for tourism. As the impacts of tourism growth on income disparity and poverty among regions are not fully understood, the development of tourism in one region could potentially come at the expense of others. Indonesia’s extensive geography as the world’s largest archipelago brings significant socio-economic challenges, particularly evident in the high inequality of regional development indicators. For example, the per capita income of the richest province, Jakarta, is nearly 12 times higher than in the poorest region, Nusa Tenggara, with poverty rates ranging from 4.6% in Jakarta to 25.2% in Papua (Statistics Indonesia, 2024). Despite these challenges, Indonesia possesses immense tourism potential, comprising over 17,500 islands surrounded by the natural beauty of seas and majestic mountains, encompassing many regions.
Following the introduction, we discuss literature related to tourism’s impacts on poverty, income inequality, and regional disparity. The next section describes the model and database used in this study. Following that, we present the empirical results of this study. Finally, last section concludes.
Tourism, poverty, income inequality, and disparity across regions
Broadly speaking, tourism growth can have a positive effect on income. However, this effect is not distributed equally among households at different income levels. For instance, it may depend on which industries are the main employers of the low-income household group (Blake, 2008); if they work and earn the majority of their income from tourism activities, then tourism growth will result in improved income distribution. However, if they are mainly involved in non-tourism industries, tourism growth may actually worsen income inequality, particularly if the Tourism-Dutch disease effects are significant. In addition, the poor might be excluded from tourism activity due to the lack of suitable employment skills (e.g., language) or having little understanding of tourism businesses (Blake et al., 2008; Spenceley and Meyer, 2012). Previous studies have found that the effect of tourism on income inequality varies across countries. Empirical evidence of the negative impact (inequality increasing) of tourism on household income inequality is found in Brazil (Blake et al., 2008), China (Zhang, 2023), Indonesia (Mahadevan et al., 2016), Kenya, Tanzania and Uganda (Blake, 2008), and Manaslu-a remote periphery of Nepal (Bennike and Nielsen, 2023). In contrast, a positive (inequality decreasing) impact of tourism expansion on household income inequality is found in Malaysia (Shahbaz et al., 2019), Ecuador (Croes and Rivera, 2016). Further, Nguyen et al. (2021) note that tourism can affect inequality through three mechanisms: income from tourism expenditures; tourism tax revenue as well as how the government spends it; and price effects created by tourism demand.
Other literature also puts more attention on tourism’s impact on low-income households, that is, whether tourism can lower poverty incidence. This is important since poverty (particularly during childhood) is linked with many subsequent negative impacts in life (Beauregard et al., 2018; Siddiqui et al., 2020). In general, empirical results conclude that tourism has a positive impact on poverty reduction. This is because economic growth induced by tourism expansion is distributed across various groups of the population and will eventually trickle-down to poor households and ease poverty in a country (Folarin and Adeniyi, 2019; Mahadevan and Suardi, 2017; Zhao and Xia, 2019). Besides the effects on income, tourism can also affect poverty through other channels including consumer prices, taxes and dynamic channels (Blake et al., 2008; Njoya and Seetaram, 2018).
The empirical evidence of poverty reduction effects of tourism is found in China (Zhao, 2020), Colombia (Camacho-Murillo et al., 2024), Costa Rica and Nicaragua (Croes, 2014), and a wide range of countries investigated by Folarin and Adeniyi (2019) and Lagos and Wang (2023). But in other cases, for example 13 tourism-intensive economies investigated by Mahadevan and Suardi (2017) and 15 Latin American countries studied by Deller (2010), there is little or no evidence to suggest any positive effects of tourism development on poverty alleviation. Furthermore, according to Kim et al. (2016), tourism will benefit poverty reduction for only the least developed countries with an income per capita below US$3400.
With regard to the regional income disparity impact of tourism, there is a very limited literature investigating this issue. A region’s tourism performance is heavily influenced by the characteristics of each region (Yang and Fik, 2014). Harb and Bassil (2022) build on this by revealing the diverse impacts of tourism to regional income, highlighting the potential to either mitigate or exacerbate existing regional imbalances. Williams and Shaw (1991) argue that tourism tends to distribute development towards underdeveloped regions (e.g., those regions with a high tourist attraction), which helps these regions catch up with the other regions through tourism development and effectively narrow regional disparity. Empirical evidence of the regional disparity lowering effect of tourism is found in countries like Brazil (De Santana Ribeiro et al., 2023; Haddad et al., 2013) and Portugal (Andraz et al., 2015). However, there are studies arguing that tourism can potentially accentuate regional income inequality, particularly when developed regions attract tourism investment relatively more than less developed regions (Atherinos, 2003; Liargovas et al., 2007; Seckelmann, 2002).
The mixed findings of tourism’s impacts on poverty reduction, income inequality, and regional disparity indicate that the distributional impact of tourism is a far-from-settled issue. The literature also shows that tourism growth can affect poverty and income inequality through various channels and creates inter-regional spillover effects at the same time. Therefore, the full impact can only be captured under a general equilibrium framework that includes a multi-household feature and a regional dimension.
The TRIP-TERM model and database
This study develops a tourism CGE model for Indonesia called TRIP-TERM (Tourism, Regional Inequality and Poverty model based on the TERM (The Enormous Regional Model) framework). TERM (Horridge et al., 2005) is a bottom-up regional CGE modelling in which each region of a country is modelled as an independent economy but linked to other regions through inter-regional trade flows and capital and labour markets. The framework has been applied in many countries, including Australia-TERM (Horridge et al., 2005), Brazil-TERM BR (Bento De Souza Ferreira Filho et al., 2015), China-Sino TERM (Ni et al., 2022), Indonesia-INDOTERM (Yusuf et al., 2018), and US-USAGE-R51 (Dixon et al., 2012).
The model used in this study was extended significantly from the existing INDOTERM model (Yusuf et al., 2018), a multi-regional model for Indonesia. The main development is to specify tourism as an explicit industry and introduce multiple households in each region.
1
Hence, TRIP-TERM has the following features: (i) explicitly representing tourism as separate industries to capture the interaction between tourism and the rest of the economy more accurately, as well as allow for targeted analysis of the tourism industry; (ii) representing regional economies in a bottom-up setting, which provides spatial heterogeneity and enables detailed analysis of regional tourism spillover impacts (see Figure 1 for the list of regions in Indonesia and their corresponding groupings in the model); and (iii) adding multiple households to facilitate poverty and income distribution analysis. The grouping of Indonesia’s regions within the model’s regional classification. Note. each colour represents a single region in the TRIP-TERM model. Source: Authors’ own illustration.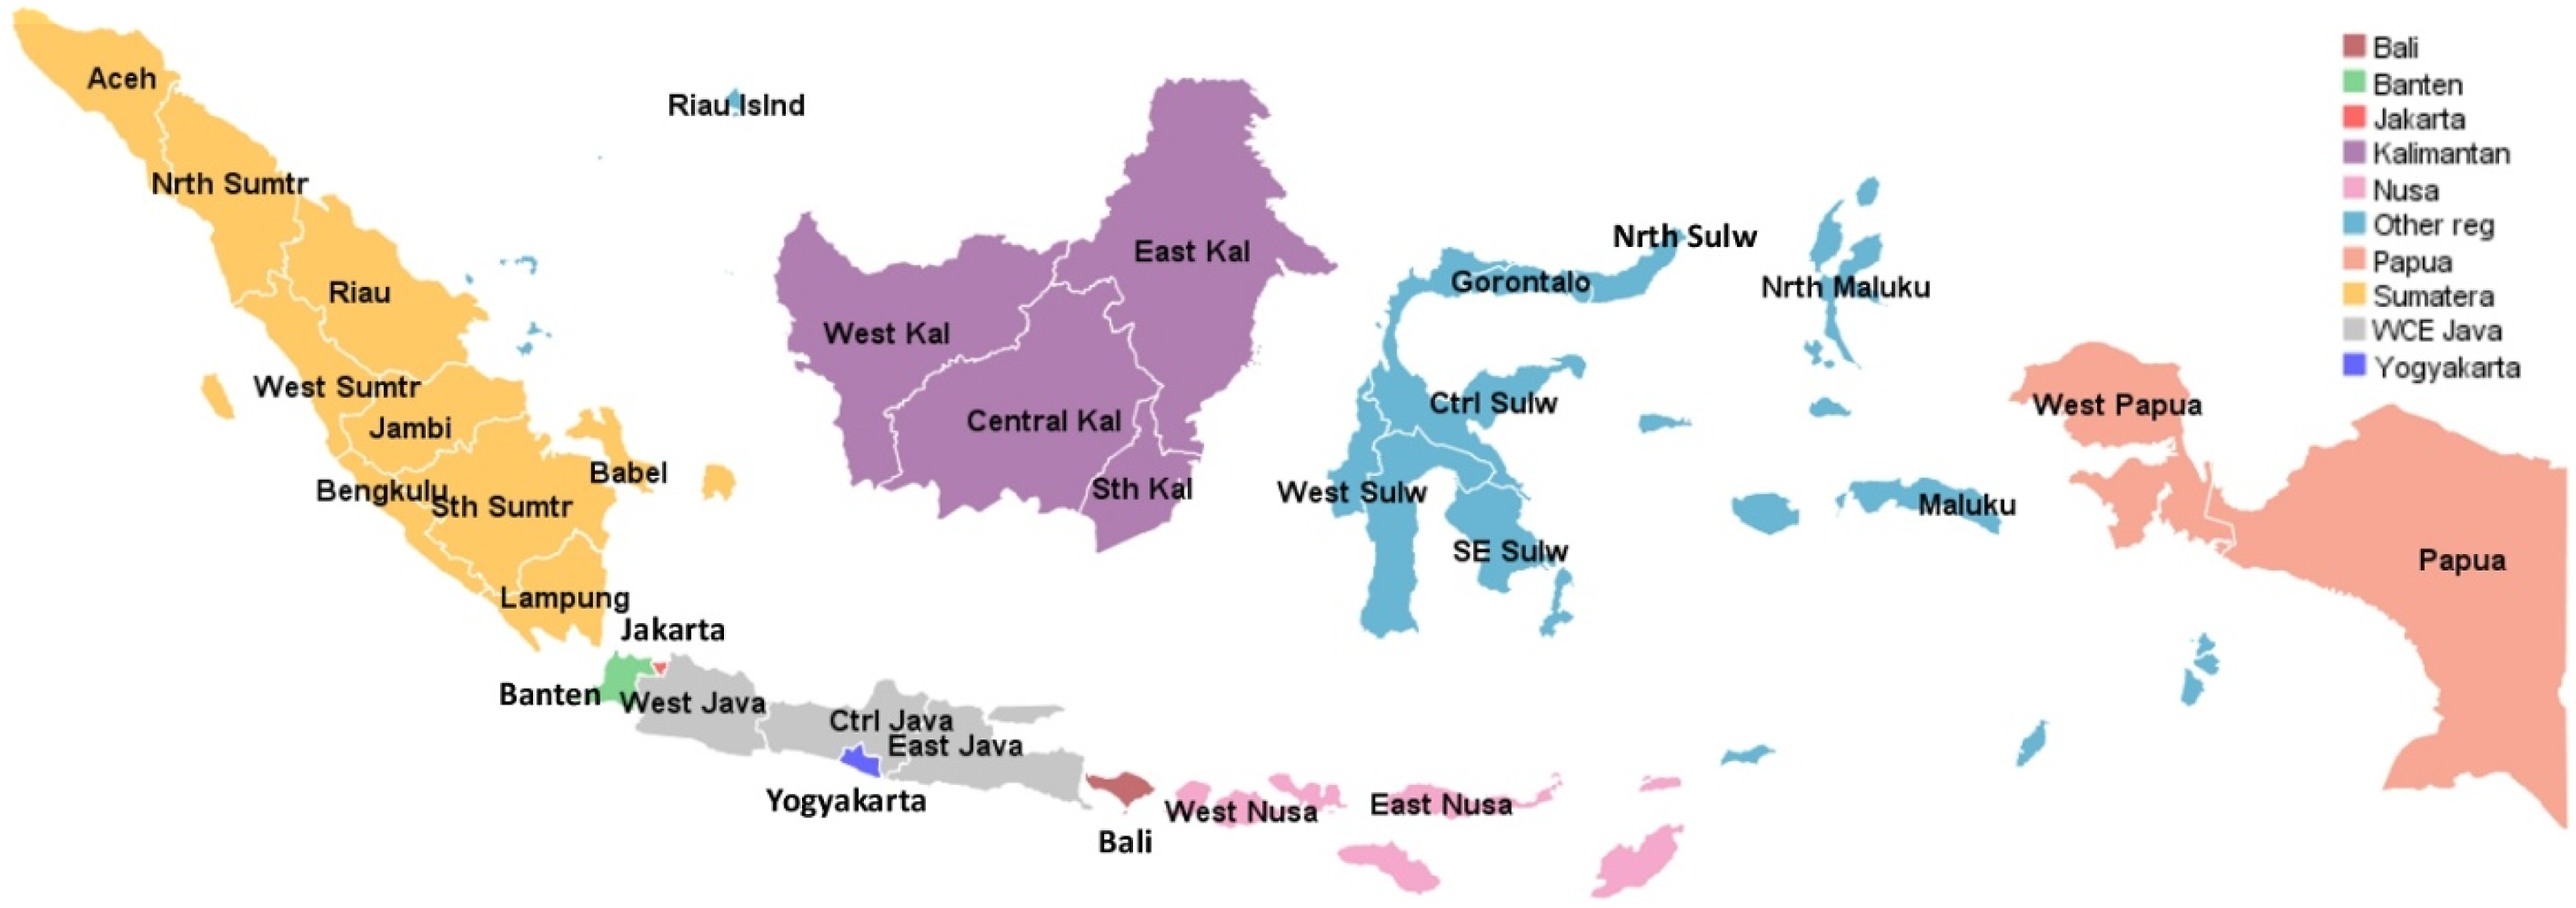
Data development
A novel and key feature of TRIP-TERM is the database. This is illustrated in Figure 2. While most CGE models are based on a standard IO table or SAM they do not recognise tourism as an explicit industry. Instead, domestic and international tourism demands are embedded in household consumption and export demand, respectively. Thus, the standard data approach can not capture the interaction between the tourism and non-tourism sectors of the economy in an accurate manner. Following Pham et al. (2015) this study expands the standard CGE model database to include explicit tourism industries. TRIP-TERM specifies 11 market-based tourism items, including two domestic markets (inter-regional and intra-regional tourism) and nine international markets (ASEAN, Australia, China, EU, India, Japan and Korea, Middle East countries, US and Canada, and other countries). Under this classification, tourism consumption by residents within the region is referred to as intra-tourism demand, and tourism consumption by domestic visitors from other regions is defined as inter-regional tourism demand. In Figure 2 the domestic tourism industries (commodities) are represented by the DomTou column (row), while the inbound tourism industries (commodities) are represented by the InbTou column (row). The development of TRIP-TERM database. Note. adapted from Pham et al. (2021); C1,…, n is commodities; J1,…, n is industries; DomTou is domestic tourism industry; InbTou is inbound tourism industry, HH1,…,100 is household representatives, INV, GOV, and EXP is investment, government, and export, respectively.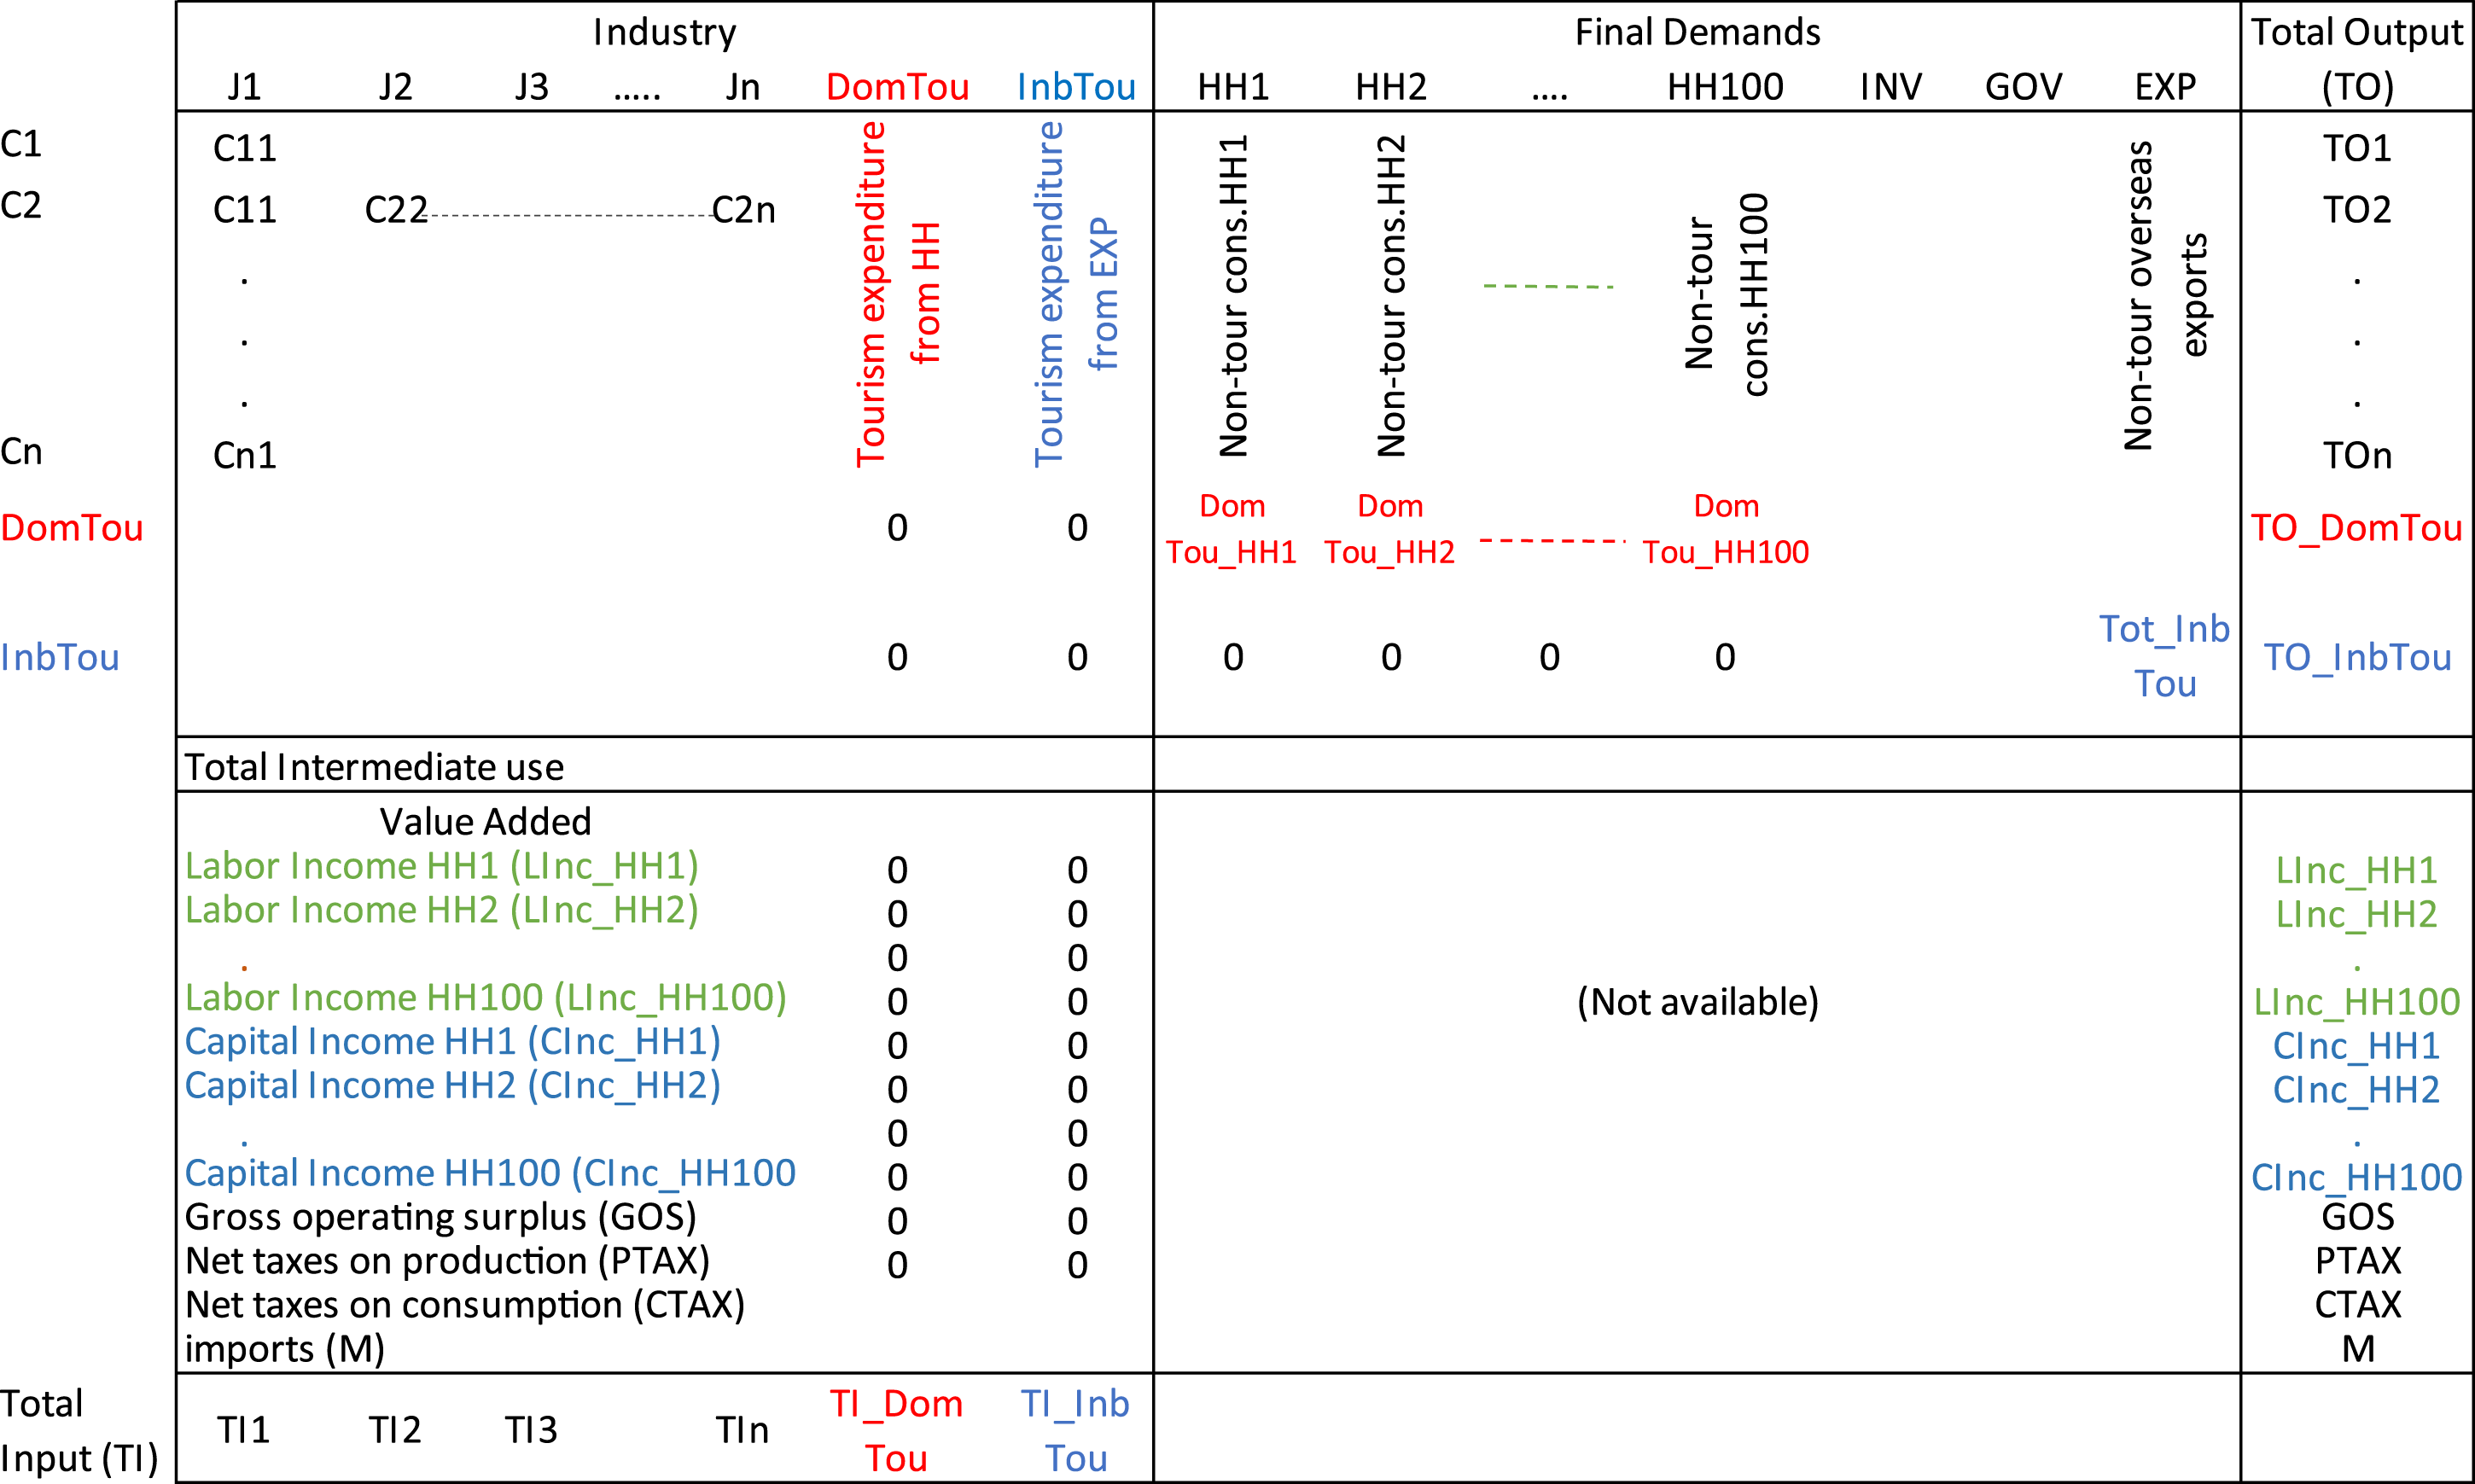
In order to create a tourism-specific sector in the database, each good and service consumed by households (i.e., hotels, restaurants, and transport) is disaggregated into tourism and non-tourism parts. The tourism part is then moved to the intermediate quadrant of domestic tourism industries. Similar steps are also performed to extract international tourism demand from exports. The tourism industries act as intermediaries that select a bundle of goods and services to sell to tourists (Madden and Thapa, 2000). In this way, domestic and international tourism are modelled as explicit industries in the regional database. The expansion of the IO table is performed at the regional level using information extracted from the regional TSA. In addition to the above steps, to distribute total tourism demand by origin and destination region, this study develops a domestic tourist visitor matrix (illustrated in Figure 3). This information is extracted from the household survey SUSENAS.
2
Domestic tourist visitor matrix (billion US $). Source: Authors’ own illustration.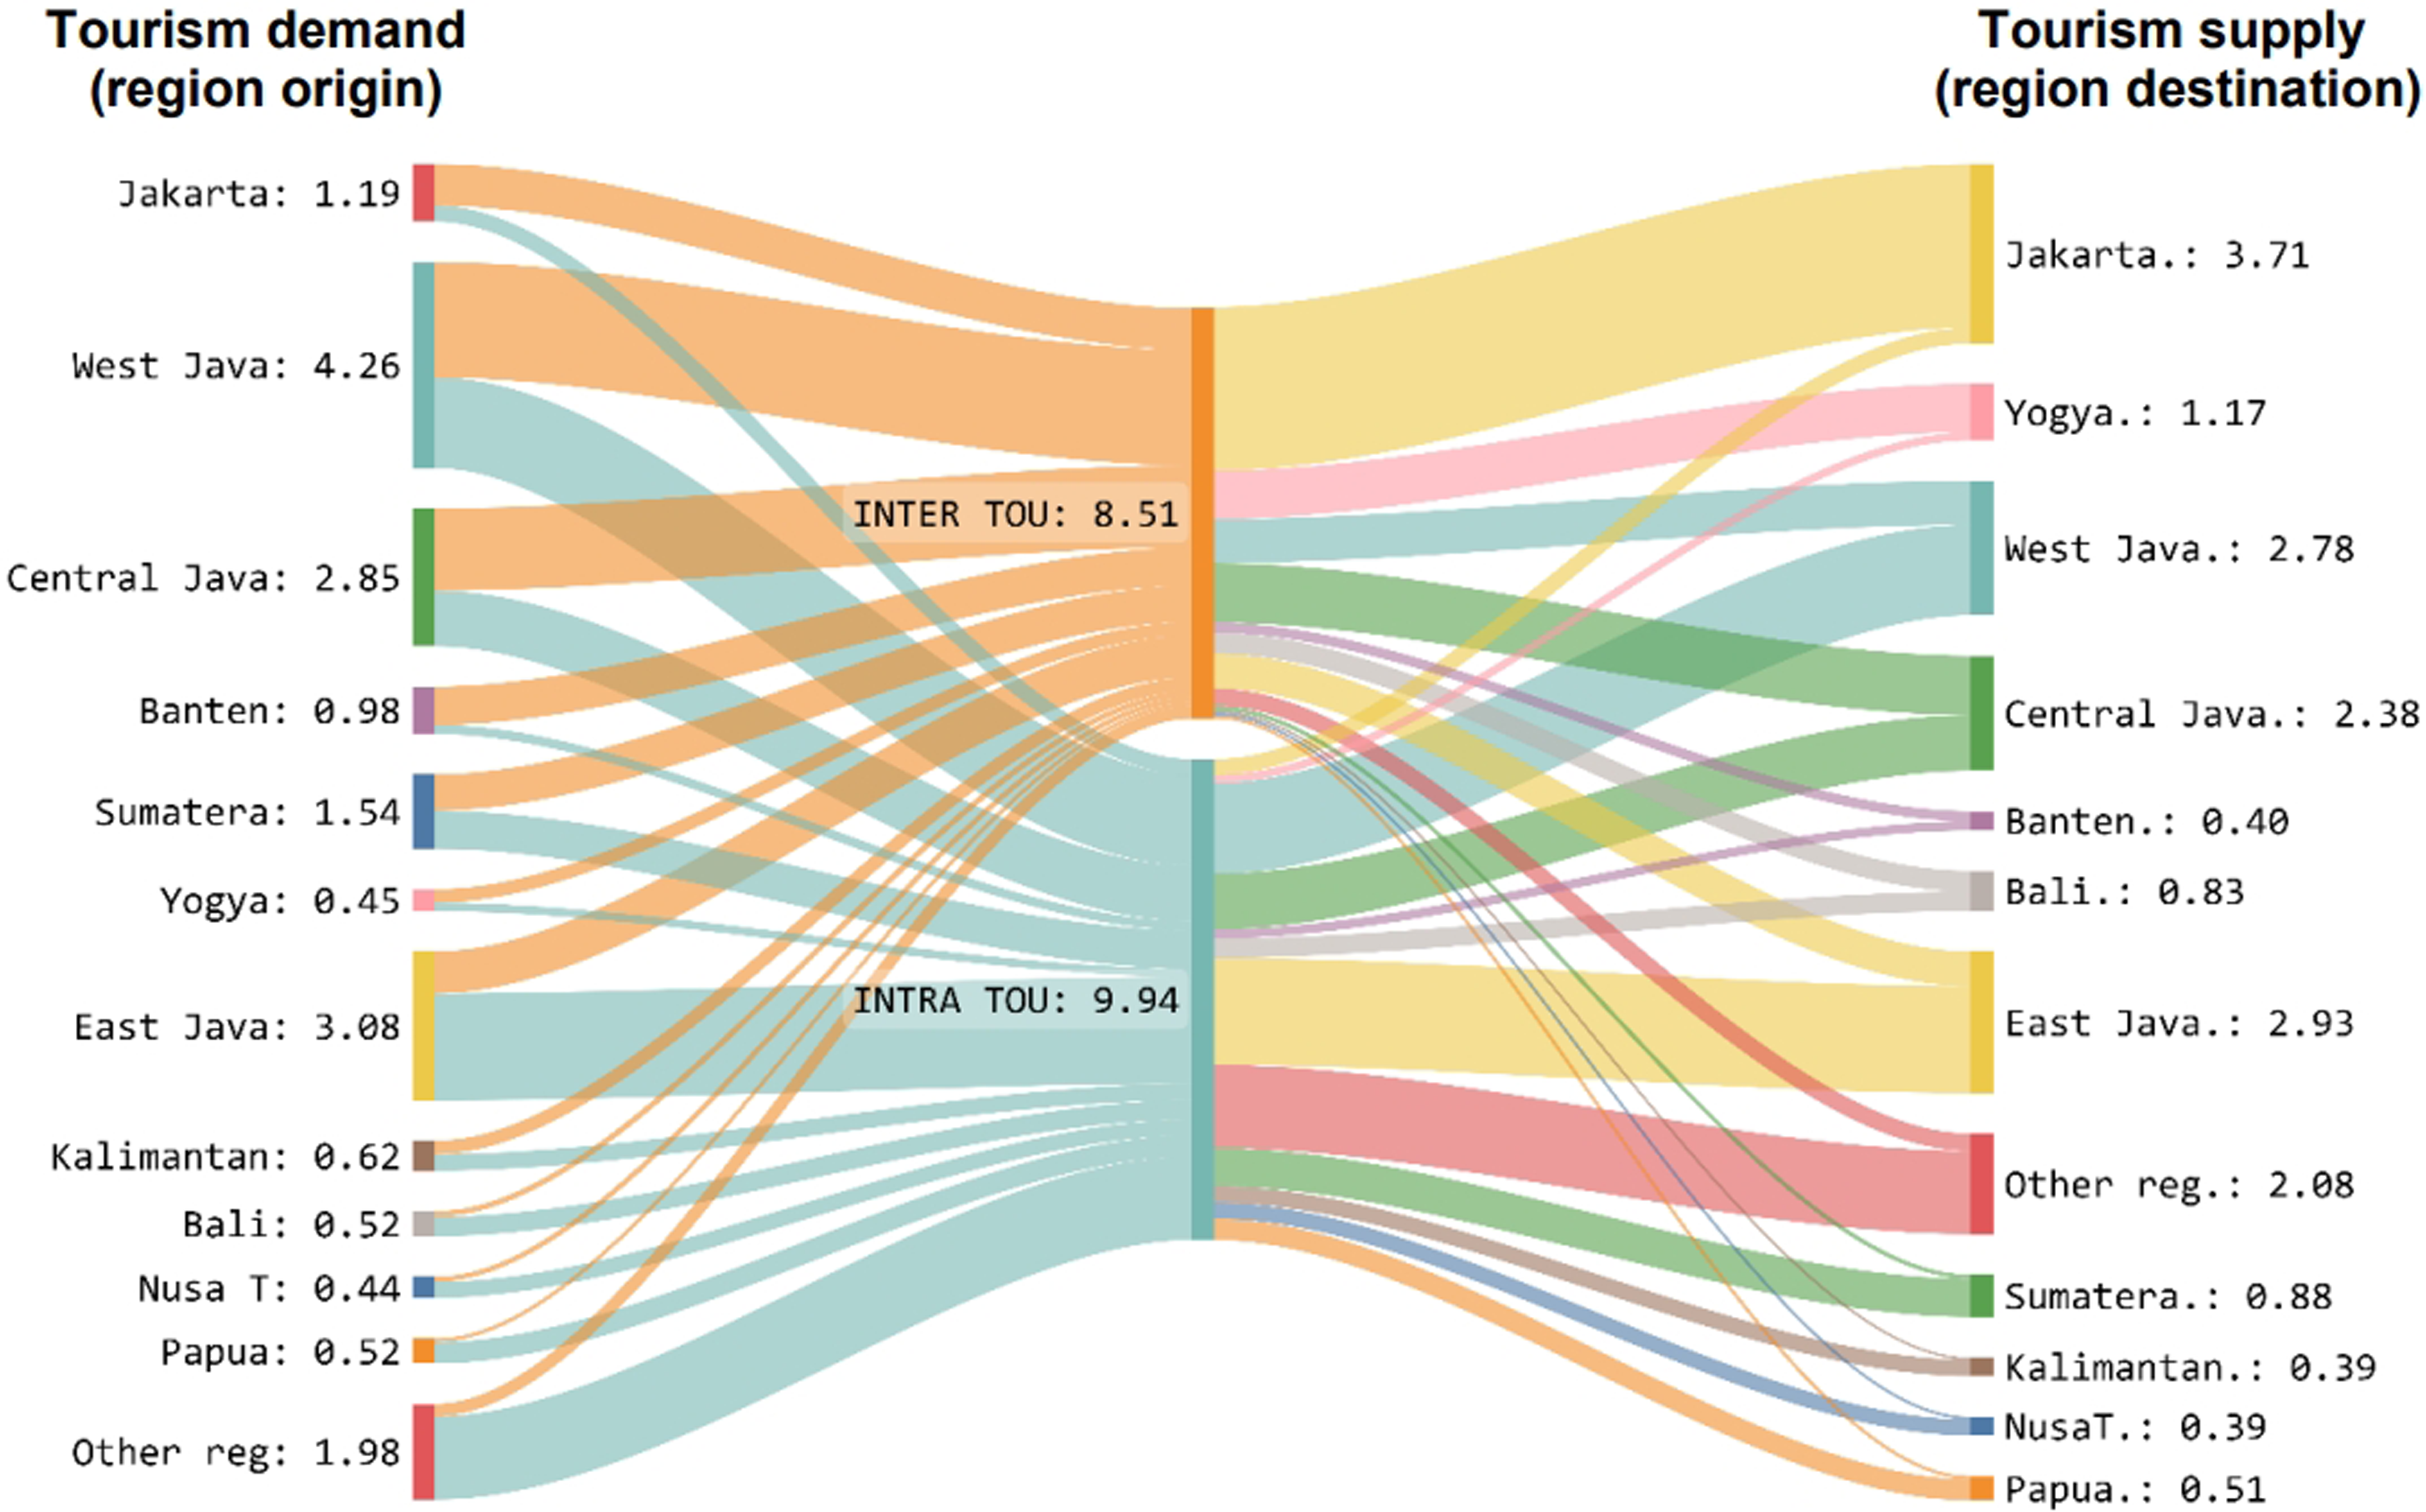
A further improvement to the model is the representation of heterogeneous households. To allow for poverty and income distribution analysis, the single representative household in the standard model database is divided into 100 groups based on income levels. The disaggregation is performed for the consumption and the income side of the household budget. On the consumption side, the expenditure pattern for each household group is derived from the SUSENAS microdata. On the income side, all components of disposable income are disaggregated across household groups as follows: (i) the labour income distribution for each industry and each household group is obtained from the SAKERNAS survey, 3 (ii) household percentile capital income and percentile income tax are calculated from the government’s tax receipt data, and (iii) government benefits received by each household group are calculated from the SUSENAS survey.
The integration of percentile expenditure and income data into the core CGE database is performed under the data bridging reconciliation rule proposed by Cockburn et al. (2010). That is, mutually inclusive variables (variables that appear in both the model database and the survey data), are reconciled using the value from the model database but the share for each household group is obtained from the survey data. Figure 2 illustrates the final structure of the database where the distribution of households are represented by HH1 (the poorest household group) to HH100 (the richest household group).
Simulation settings
It is the interest of this study to improve the understanding of tourism expansion impacts in the medium term (five to ten years) in which transitional effects (including changes in poverty and in income distribution) are likely to arise. Hence, a medium-run closure is adopted for this study. Under the medium-run closure, primary factors are fully or partially mobile. At the national level, employment is allowed to adjust (endogenous) in response to a change in labour demand, while the real wage is fixed (exogenous). This setting implies that anybody looking for a job will find one if they are willing to accept the prevailing wage rates. Labour is also allowed to imperfectly move between industries and across regions. In contrast, the capital stock is fixed at the national level but allowed to move between industries and across regions. This setting implies that the adjustment period is long enough for existing capital to be reallocated to eliminate variations in the rate of return between regions and industries. However, it is not long enough for new investment to become productive capital. On the demand side, the average propensity to consume is exogenous, hence, household consumption is driven by disposable income. Regional government consumption is fixed (exogenous) in order to isolate the impact of the particular simulations from government spending policy.
Using the above settings, this study analyses the effects of an expansion in inbound (Scenario 1) and domestic tourism (Scenario 2). The magnitude of each expansion is arbitrarily set equal to 1% of GDP to represent a significant increase in tourism demand. This also ensures that the results from the simulations are comparable, as the first-order effect on aggregate expenditure will be equal. 4 Both simulations are independent of each other, as detailed below:
Scenario 1
The first scenario simulates the expansion of inbound tourism facilitated by increasing demand for inbound tourism. The simulation is straightforward since inbound tourism demand is exogenous to the model.
Scenario 2
Scenario 2 simulates the expansion of domestic tourism. This simulation is, however, not straightforward as domestic tourism demand is endogenously linked to household disposable income and the price system. Thus, to facilitate the simulation we increase the household propensity to consume equal to 1% of GDP and concurrently we apply a change in household preferences towards domestic tourism and away for other commodities to ensure households will increase their spending by 1% of GDP entirely on domestic tourism consumption.
Empirical results
Macro effects
Macroeconomic impacts (% change).
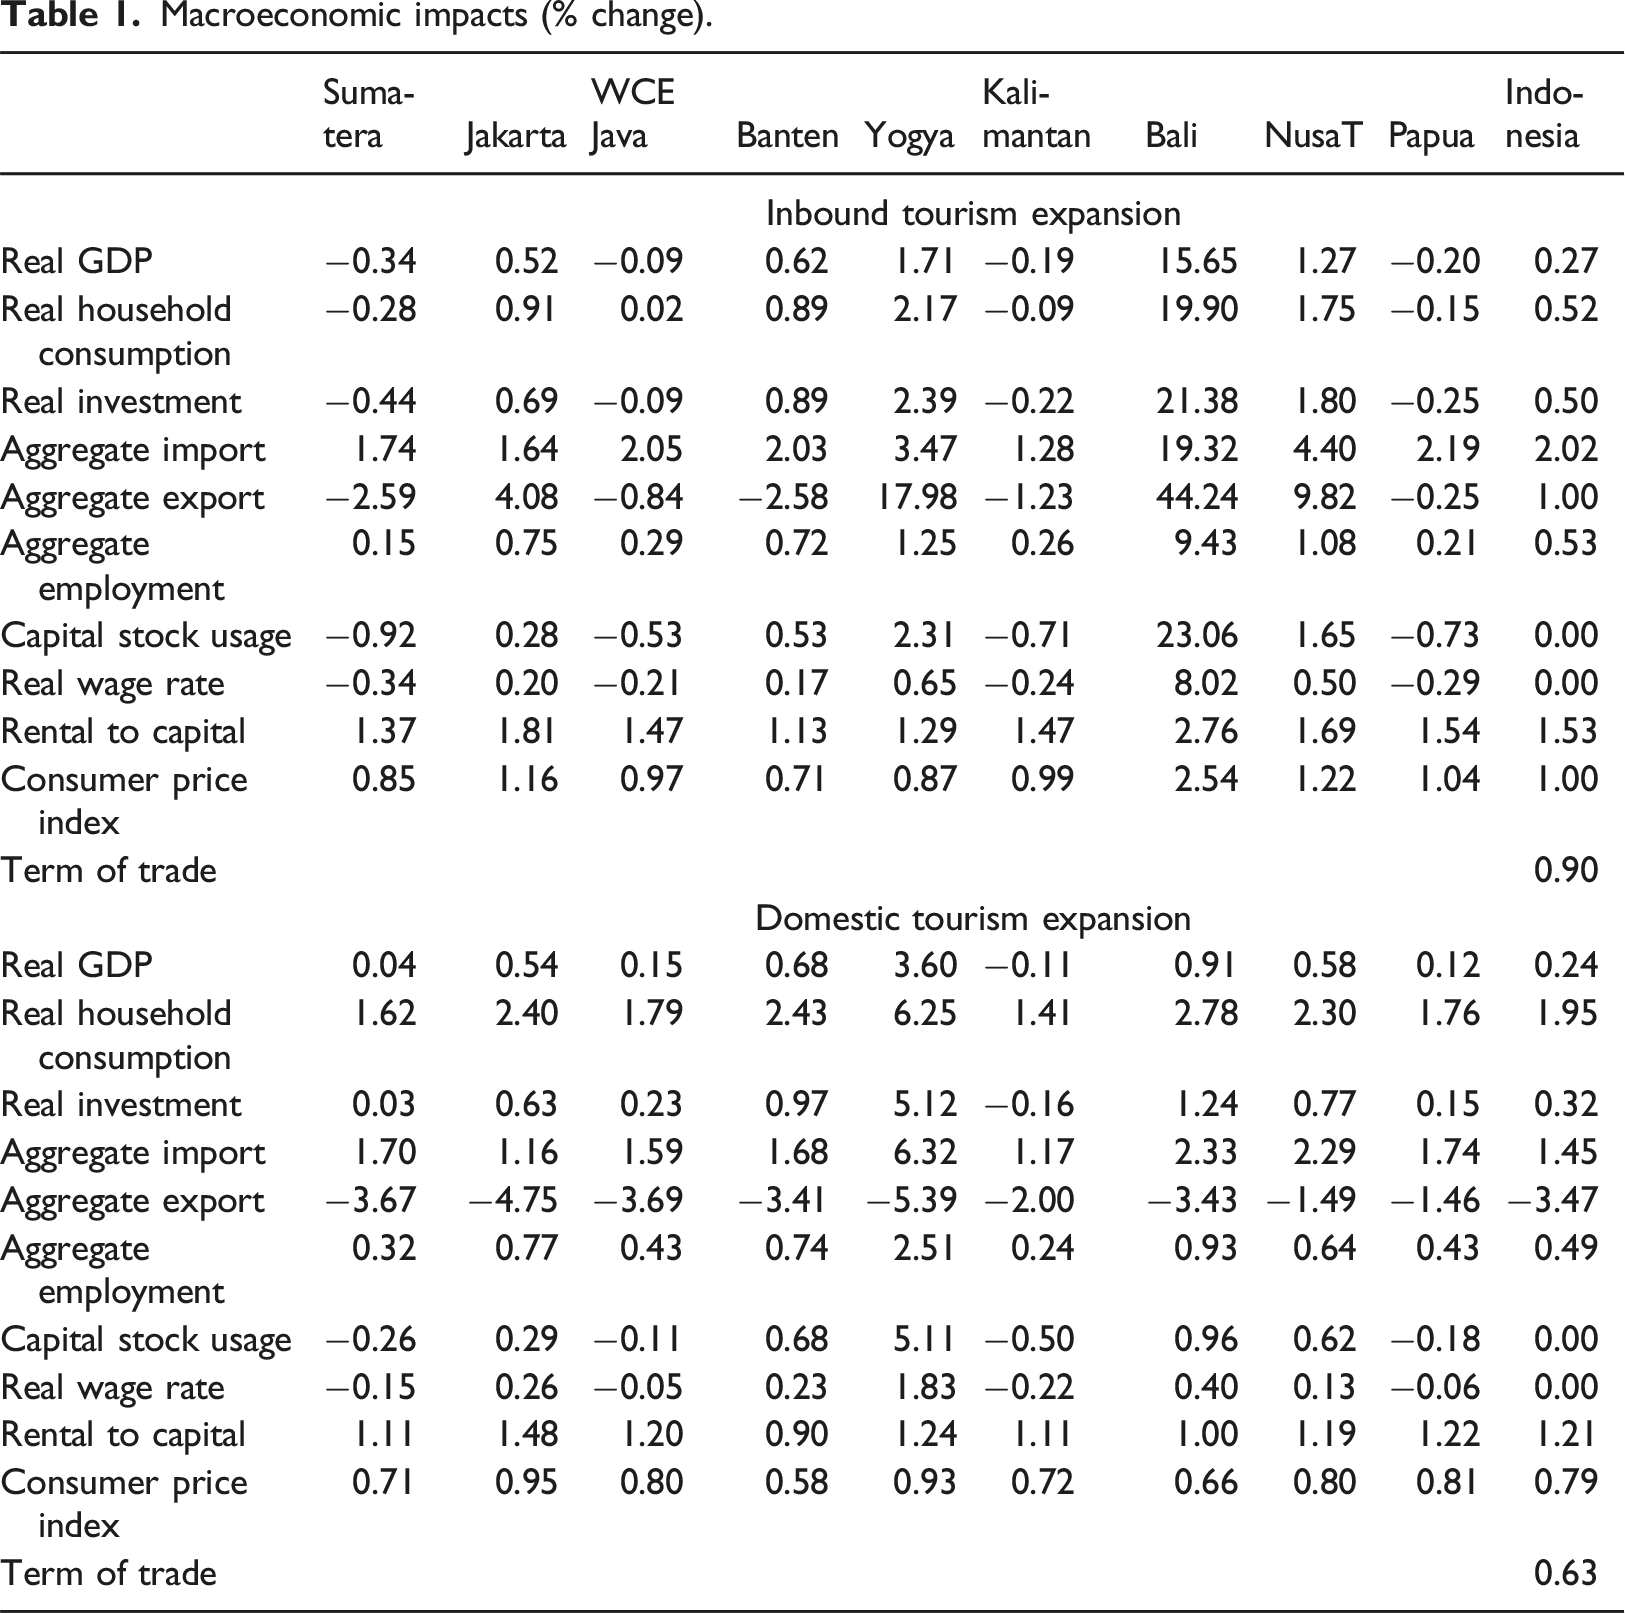
As national income rises, household consumption increases by 0.52%. Investment increases by 0.5% reflecting increased capital demand due to the expansion in inbound tourism. The increase in final demand raises GDP and thus the Consumer Price Index (CPI) increases by 1% and the real exchange rate appreciates by 1.15%. The real exchange rate appreciation means that imported goods are now relatively cheaper for domestic users and thus demand for imported goods increases by 2.02%. In contrast, the real appreciation makes exports more expensive for foreign buyers and, hence, the terms of trade improve by 0.9% and aggregate exports rises (1%) but by less than aggregate imports. This reflects a welfare improvement for Indonesia as households can now buy more imports with the same level of exports in domestic currency terms.
At the regional level, the impact of the inbound tourism expansion varies across regions. Regions with a large share of inbound tourism revenue or a large share of tourism in their economy such as Bali, Yogya, and Nusa Tenggara receive a positive gross regional product (GRP) impact. It can be seen from Figure 4 that the largest GRP increase is registered in Bali (15.65%), a region that has a big reliance on inbound tourism as reflected by a tourism to GRP ratio of 66%. This is followed by Yogya and Nusa Tenggara, which register GRP growth of 1.71% and 1.27%, respectively. GRP growth in these regions is mainly due to the strong growth in regional exports (from increased inbound tourism demand) and household consumption. Regional GDP impact. Source: Simulation results.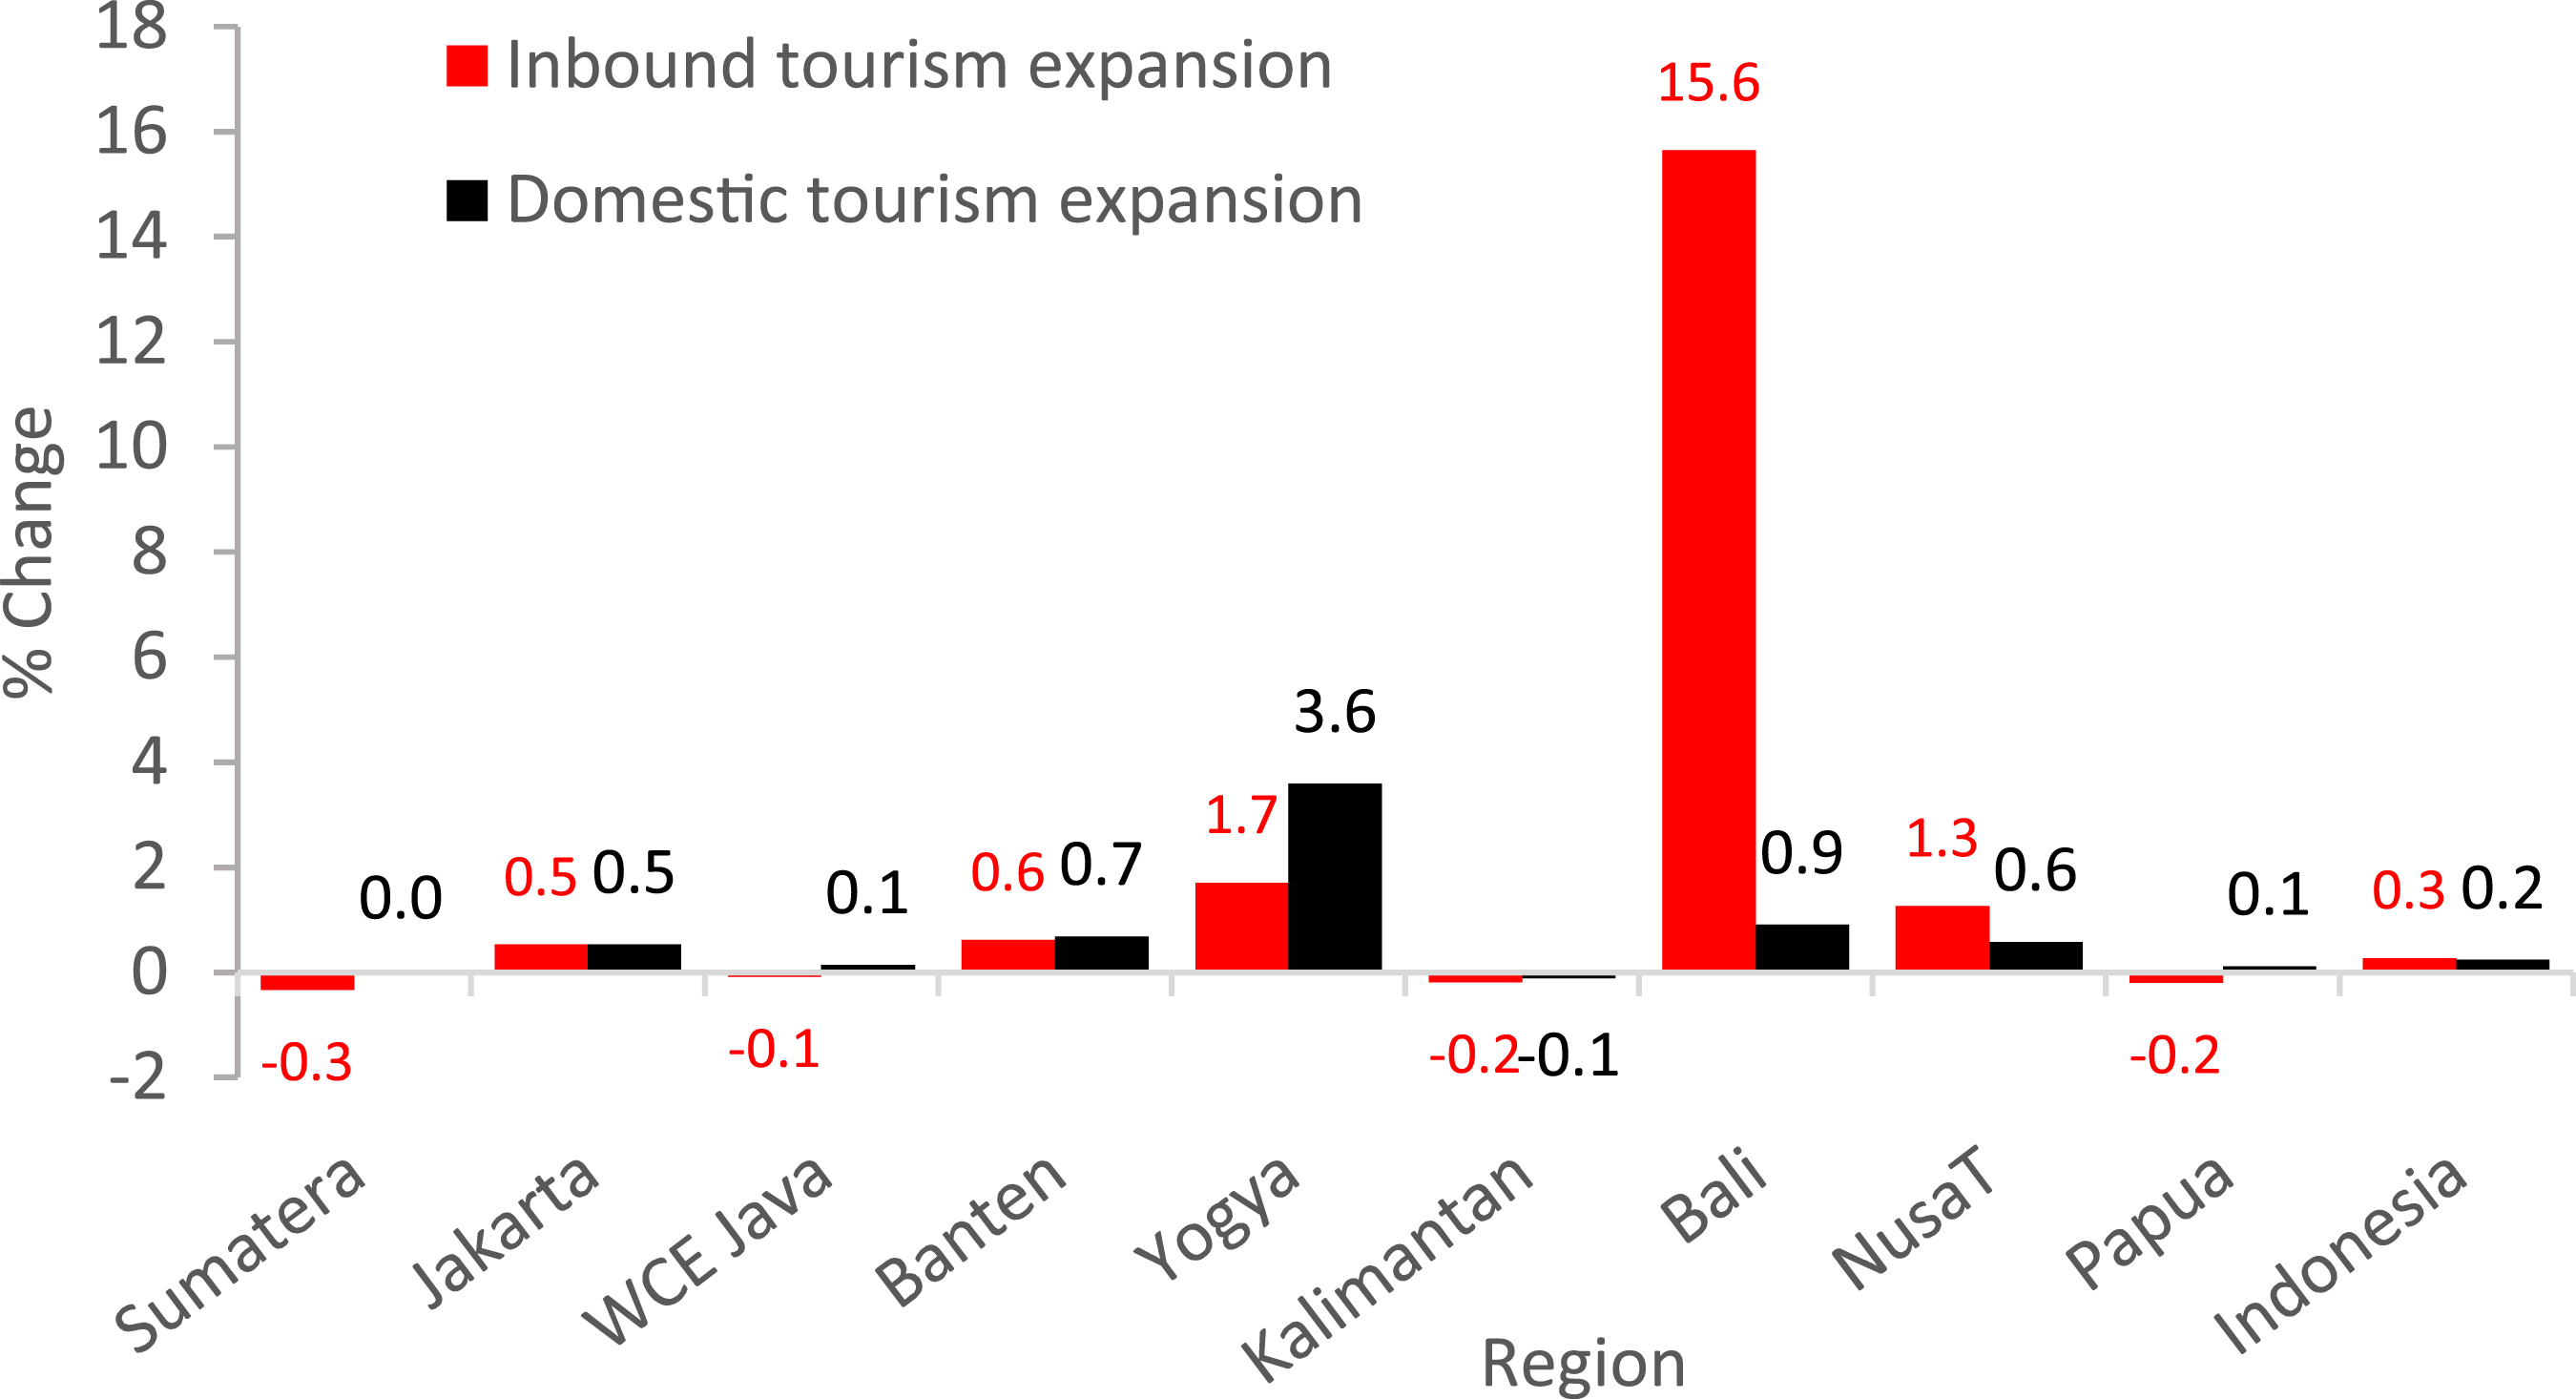
Interestingly, although not popular as an international tourism destination, Banten registers a relatively strong expansion in GRP (0.62%). The region plays an important role in Indonesia’s tourism value chain. It has a large share of the national air transportation industry and is the home of Soekarno Hatta International Airport -- the largest airport in Indonesia. This is where international flights usually transit before continuing to other regional airports in Indonesia. The region’s important role in the tourism value chain results in the growth of inter-regional exports, which increases by 1.49%, the highest among all regions.
In contrast, regions without important inbound tourist destinations and having a large volume of non-tourism exports are adversely affected as capital and labour are drawn away to other regions. This includes Sumatera, which exports crude palm oil, West, Central, and East (WCE) Java, which exports manufacturing products, and Kalimantan and Papua, which export mining commodities. GRP in Sumatera, WCE Java, Kalimantan, and Papua contracts by 0.34%, 0.09%, 0.19%, and 0.2%, respectively. The main driver of the GRP contraction in these regions is weaker final demand, particularly exports, and the contraction of each region’s capital usage. These results show that the negative spillover impact of the inbound tourism expansion is due to the real exchange rate appreciation, which lowers export competitiveness, and the resources reallocation, particularly capital, toward tourism-oriented regions.
In scenario 2 where domestic tourism expands, the macroeconomic effects are similar to the inbound tourism expansion, but with smaller magnitudes (see Table 1 - lower section). On the demand side, household consumption increases by 1.95% due to increased domestic tourism demand and the subsequent income effect. Noticeably, the increase in real household consumption and real investment is stronger than GDP growth. This drives a real exchange rate appreciation of 0.89%, forcing exports to weaken by 3.47% and imports to expand by 1.45%.
At the regional level, regions uniformly register increases in household consumption due to domestic tourism demand growth and the subsequent income effect. However, regions also uniformly register export contraction at the same time due to the real exchange rate appreciation that degrades export competitiveness. Strong inter-regional export growth observed in most regions reflects the increased inter-regional tourist movement particularly toward popular tourism destinations. The net effect on the region’s GRP depends on which force is stronger. As illustrated in Figure 4, most regions register a positive GRP growth with a stronger effect observed in regions with a significant tourism basis such as Yogya (3.6%), Jakarta (0.54%), Bali (0.91%), and Nusa Tenggara (0.58%). The GRP effect is also relatively strong in Banten (0.68%) due to its significant role in domestic tourism value chains. Only Kalimantan registers a negative GRP impact as the contraction in regional exports is larger than the expansion in regional household consumption.
Sectoral effects
Impacts on outputs (% change).
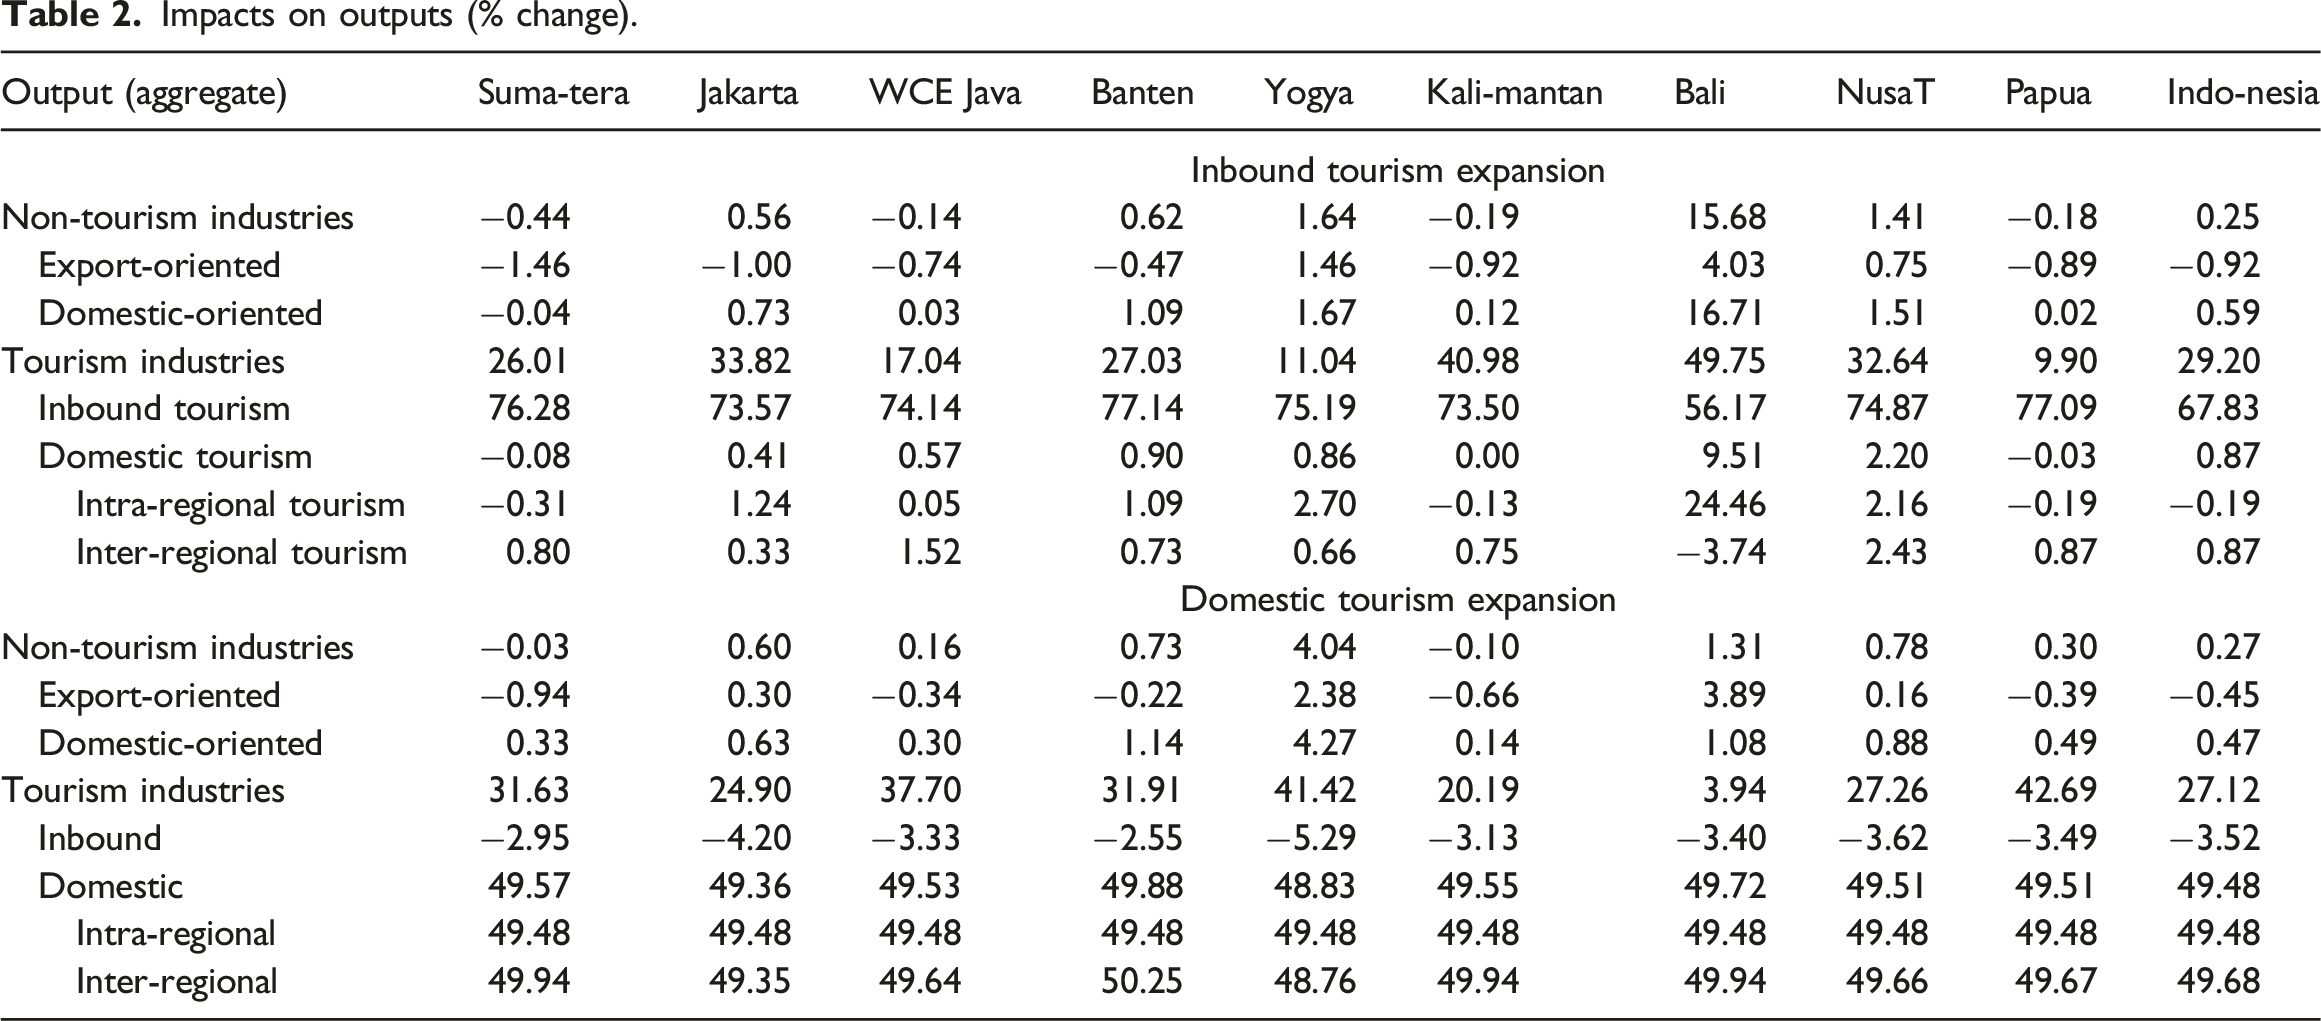
Within the domestic tourism industry category, the performance of the intra-regional tourism industry mostly depends on the income effect in a region: when a region experiences a positive income effect (see Table 1), intra-regional tourism will grow, and vice versa. On the other hand, the performance of the inter-regional tourism depends on the price level (CPI) in the destination region (see Table 1). It is worth noting that the international tourism expansion generally does not lead to crowding-out effects on domestic tourism due to the strong income effect.
The output effects of the expansion in domestic tourism are reported in the lower section of Table 2. The output effects are very similar to those from the inbound tourism expansion where export-oriented non-tourism industries mostly experience output losses due to the real exchange rate appreciation, whereas non-tourism industries that focus on the domestic markets mostly experience output growth due to the income effect and indirect demand from the domestic tourism industries. In contrast to the inbound tourism expansion where both inbound and domestic tourism grow, here only domestic tourism registers growth, while inbound tourism contracts due to the real exchange rate appreciation. This result indicates that a domestic tourism expansion has a crowding-out effect on inbound tourism.
Distributional effects
Distributional impacts (% change).
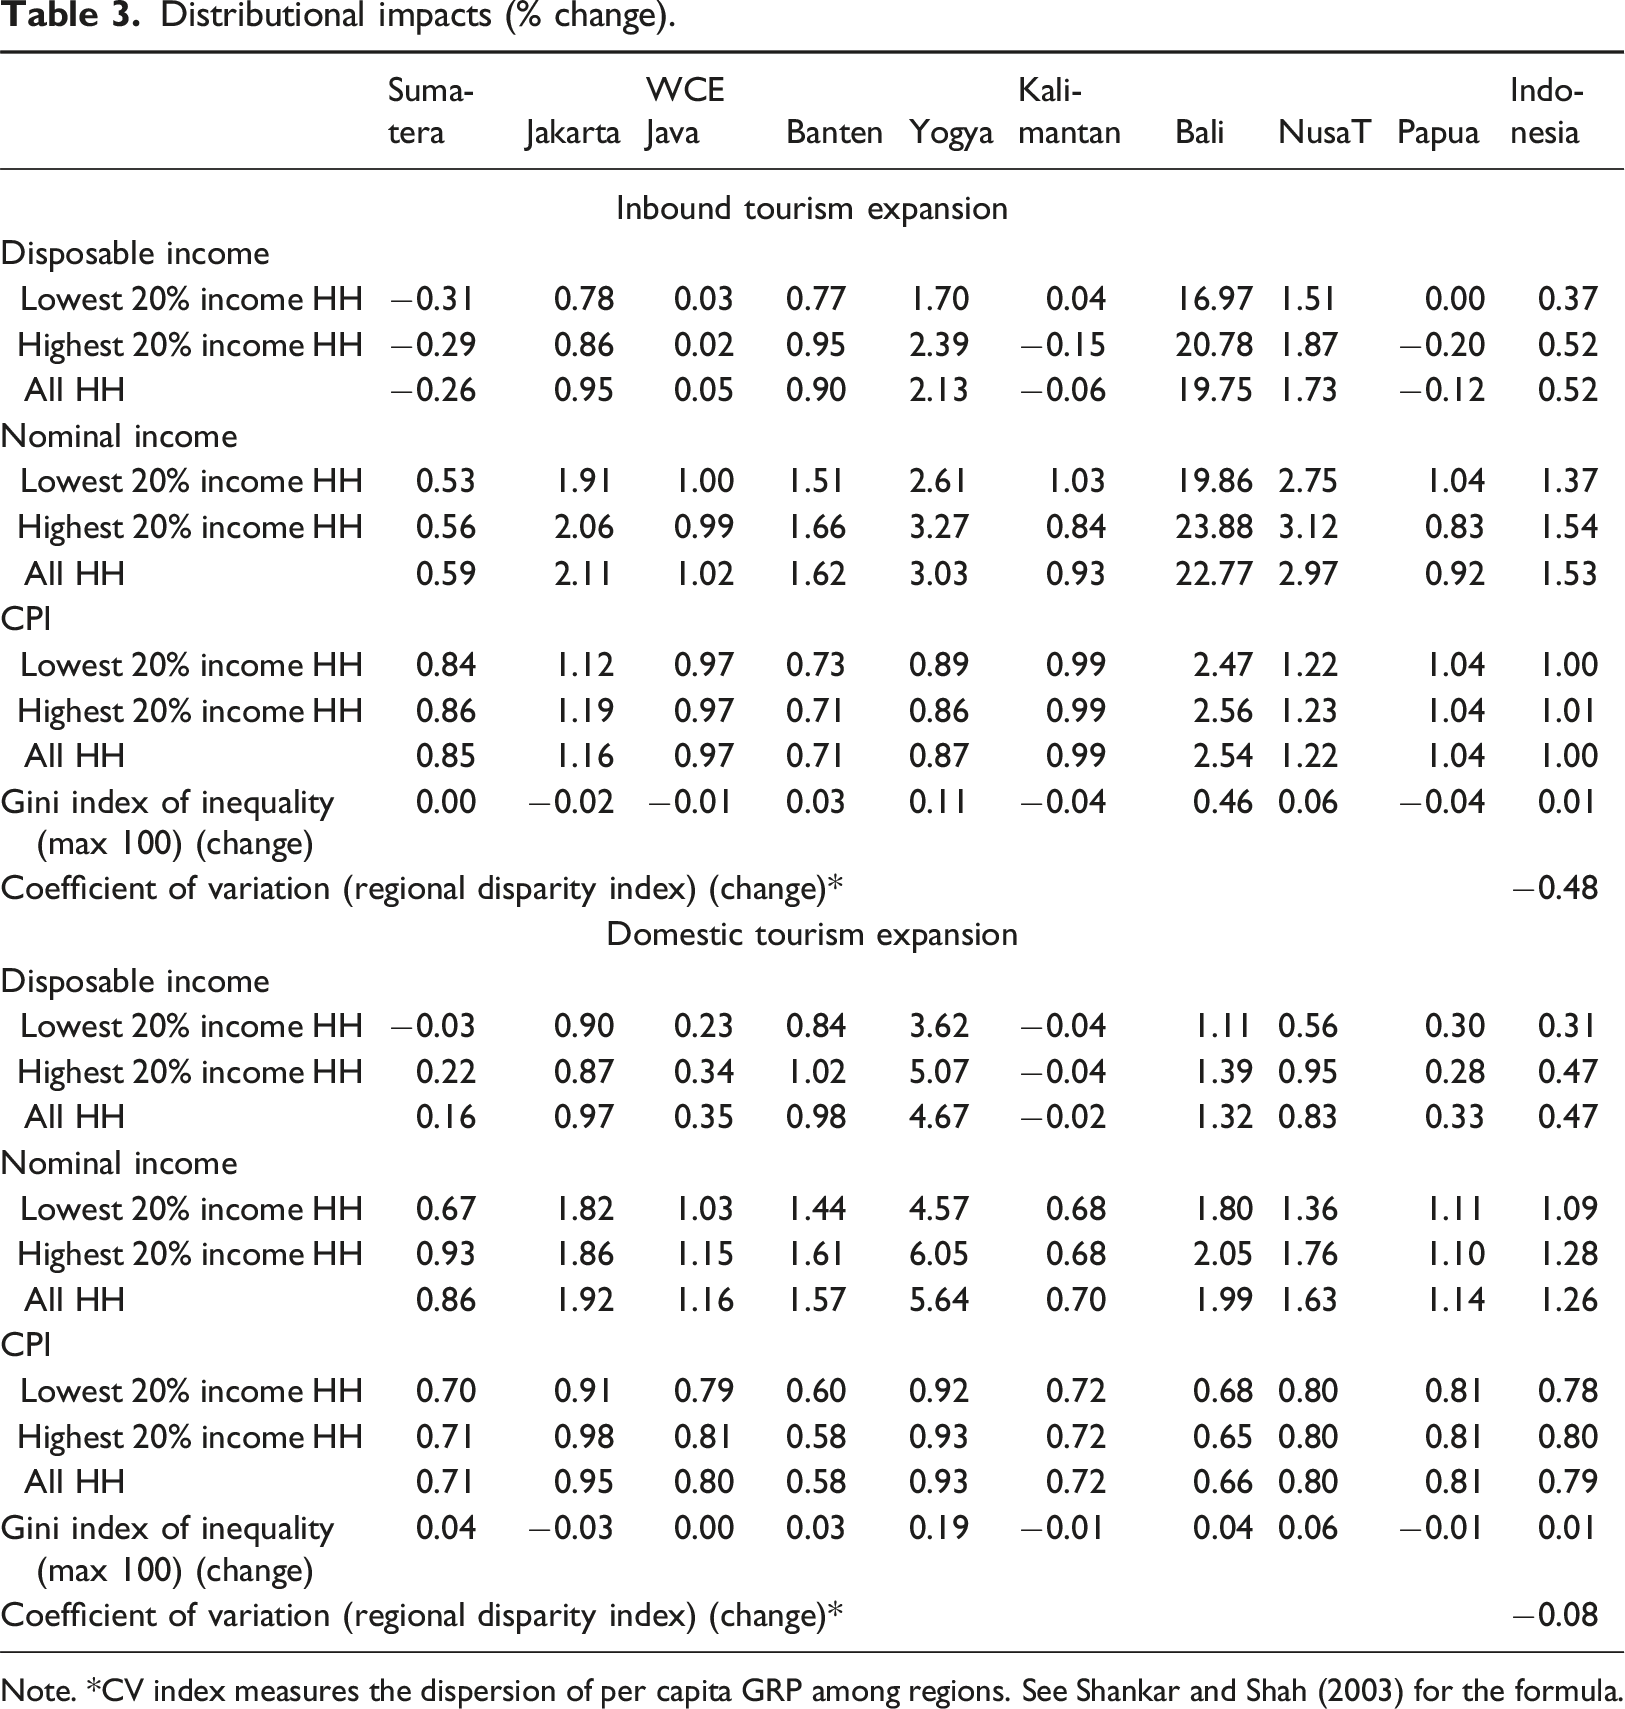
Note. *CV index measures the dispersion of per capita GRP among regions. See Shankar and Shah (2003) for the formula.
Among Indonesia’s regions, the most favourable nominal income distribution effect is observed in the mining export regions of Kalimantan and Papua. This is caused by a mixed impact from the growth in the regional inbound tourism industry and the contraction in the regional mining industry. While the inbound tourism expansion drives higher income growth in middle- and upper-income groups, the downturn in the mining industry has the reverse effect. This is due to the nature of income distribution in the mining industry, which is very unequal. 5 The final result is a favourable income distribution in the two mining regions, where lower-income households experience higher nominal income growth than upper-income groups.
With regard to the price effects, low-and high-income households generally experience almost equal effects. For lower-income households, the increased CPI is mainly caused by the consumption of agriculture and food products as these products occupy a large share (37.7%) of lower-income household consumption and their prices rise by more than other commodities. Upper-income groups face a higher CPI due to the increase in the price of tourism-related commodities such as hotels, restaurants, air transportation, and entertainment, as demand for these commodities increases substantially.
Figure 5 further plots the regional income distribution impact against regional poverty impact: the larger the increase in disposable income, the larger the poverty reduction in the region. Significant poverty reduction is observed in the tourism-oriented regions of Bali (3%), Nusa Tenggara, and Yogya, followed by other regions except Sumatera. Within this region, the upward price effect is stronger than the nominal income effect causing a reduction in real disposable income and a rise in regional poverty. The weak nominal income effect in this region is due to the strong contraction in the palm oil industry, which the region heavily relies on. Regional poverty and disposable income impacts. Note. *This study uses a Foster–Greer–Thorbecke (FGT) class of the headcount index (P0) (Foster et al., 2013) which measures the proportion of population that lives under the poverty line in each region.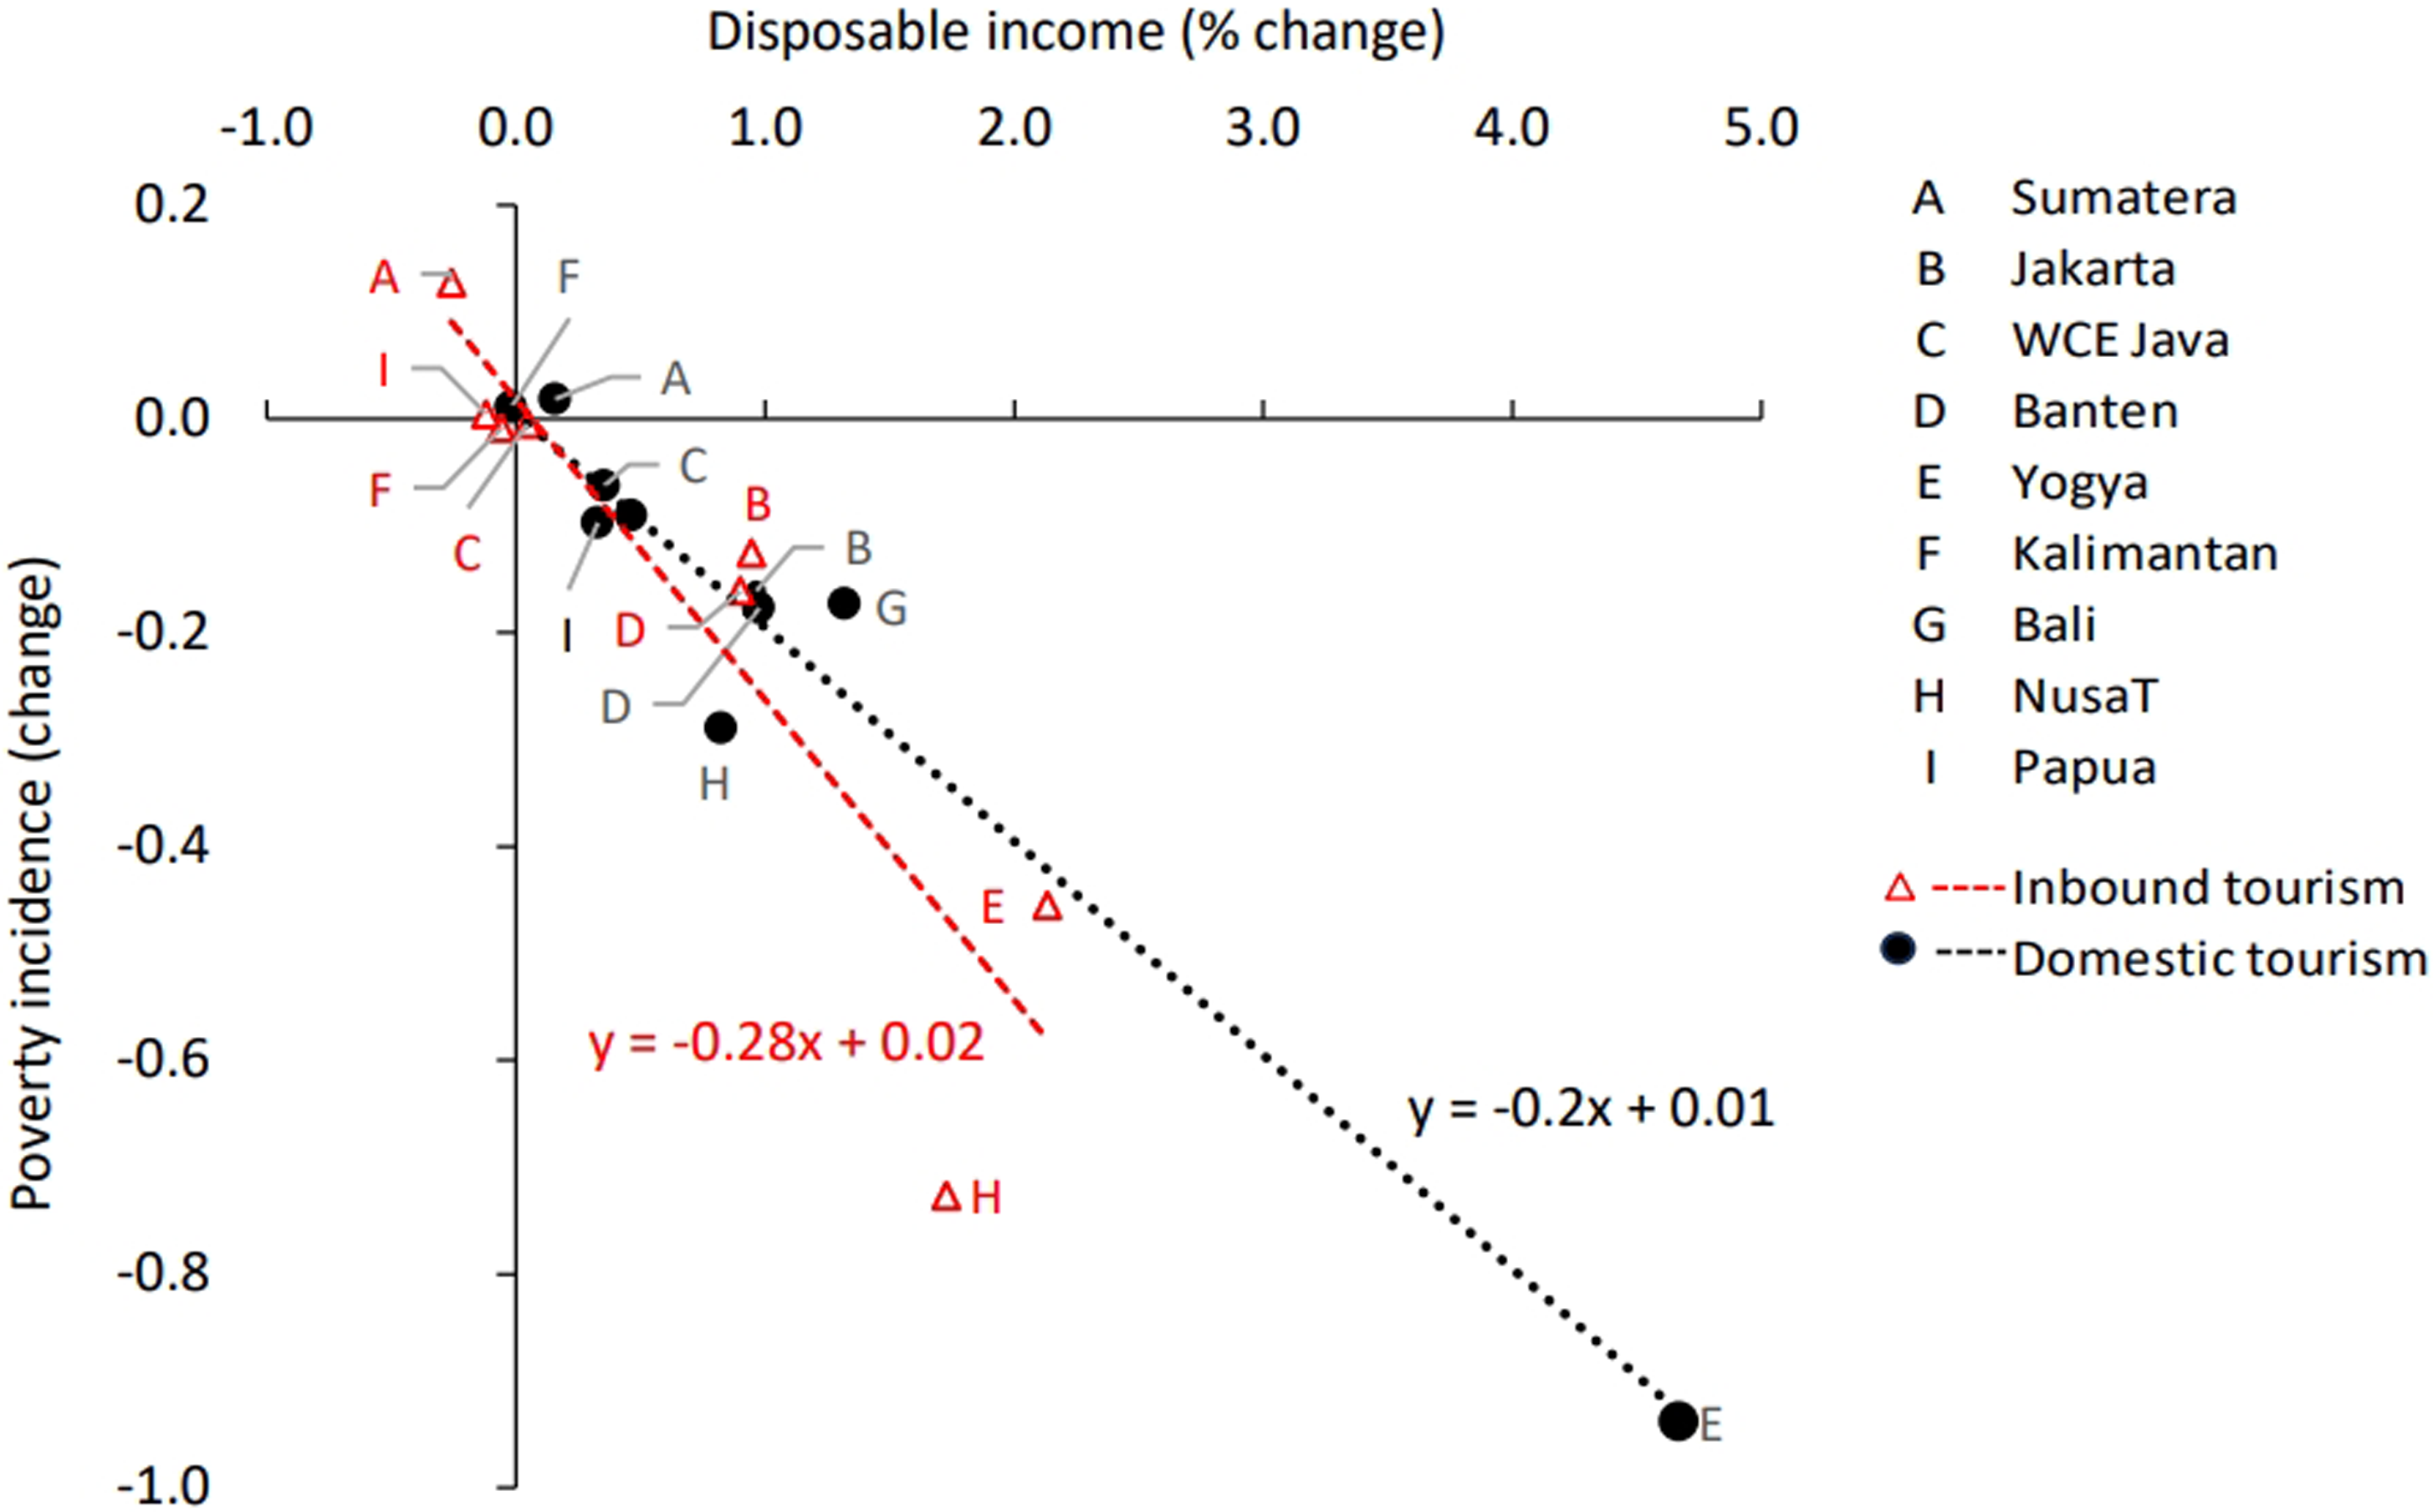
Besides within-region income inequality and poverty, another distributional aspect investigated in this study is regional income disparity. Figure 4 indicates that the inbound tourism expansion will lower inter-regional income disparity by causing larger GRP growth in poorer regions rather than richer regions, such as Jakarta, the region in which Indonesia’s capital city is located and the mining-based region of Kalimantan. The clear empirical evidence can be seen from the reduction in the Coefficient of Variation (CV) index of inter-regional disparity. CV is one of the most widely used indices of regional disparity (Shankar and Shah, 2003), as it measures the dispersion of per capita GRP among regions. From the upper section of Table 3 we can see that the index is lowered by 0.48 points, from the base value of 69.1 to 68.62.
Almost similar distributional effects are found for the case of domestic tourism expansion (Table 3 – lower section). Household income inequality increases at the national level and within tourism-oriented regions (Yogya, Bali, and Nusa Tenggara) but falls slightly within mining exporting regions (Kalimantan and Papua). The expansion of domestic tourism also leads to poverty reduction at the national level and in most regions in Indonesia (Figure 5). The most significant poverty reduction is observed in Yogya, which is the most popular domestic tourist destination. Regional poverty increases in Sumatera and Kalimantan as the upward price effect (as indicated by the CPI in Table 3) is stronger than the nominal income effect, particularly for lower-income households in both regions. Domestic tourism expansion also improves inter-regional disparity, but the effect is very weak.
There are some notable differences in the effects of inbound and domestic tourism expansion on regional poverty and inter-regional disparities. It can be seen from Figure 5 that inbound tourism is more effective in lowering regional poverty due to its higher poverty reduction elasticity. A 1% increase in disposable income resulting from inbound tourism expansion leads to a 0.28% reduction in poverty incidence, whereas the same increase in disposable income resulting from domestic tourism expansion results in a 0.2% reduction in poverty incidence. Additionally, the inter-regional disparity reduction from inbound tourism expansion is also much stronger (−0.48%) than that arising from domestic tourism expansion (−0.08%). This is because the structure of domestic tourism demand is dominated by intra-regional visits, making it concentrated in the highly populated regions. These highly populated regions are relatively more developed compared to other regions.
To conclude, our empirical findings carry significant implications, revealing that tourism is a complex driver of socio-economic outcomes that goes beyond the scope of the industry. Therefore, tourism development strategies should be integrated with the general economic development strategy, both nationally and regionally, to mitigate the risk of negative spillover effects. In this context, we fully support the viewpoint of Calero and Turner (2020) who recommend regional economic development and tourism as an important future direction for tourism research.
Conclusion
This study fills a gap in the literature by examining the distributional consequences of tourism at the regional level. The analysis is comprehensive by applying an integrated framework within a regional CGE model. The model developed in this study considers tourism as explicit industries hence capturing two-way interactions between tourism and the rest of the economy more accurately. Moreover, the multi-region and multi-household features of the model allow this study to capture not only poverty and income distribution impacts within each individual region, but also inter-regional income disparities while accounting for regional heterogeneity and inter-regional feedback effects.
The results from this study show that the expansion of inbound and domestic tourism brings benefits to the Indonesian economy as a whole. However, the benefit is not distributed equally at the regional level. Regions with a large share of tourism in their economy or heavily involved in the tourism value chain will benefit from positive economic impacts. In contrast, regions that do not have a strong tourism basis and, in particularly, have a large value of non-tourism exports might be adversely affected. This is caused by the negative spillover impact of a real exchange rate appreciation that lowers export competitiveness and reallocates resources toward tourism-oriented regions. This inter-regional Tourism-Dutch disease effect emerges from both inbound and domestic tourism expansions simulated in this study.
Empirical results obtained from this study also suggest that tourism’s impact on regional income distribution is heterogeneous depending on household-specific income and price effects, as well as a region’s economic structure. While tourism causes a positive nominal income effect on all households, lower income groups tend to register lower growth in nominal income. This is due to the nature of the tourism industry in Indonesia, which mostly employs formal workers who are located in the middle-to-higher income groups. In contrast, tourism expansion causes a negative spillover impact on mining industries hence leading to lower nominal income for upper-income households in mining-oriented regions, whereas the price effects are even for low- and high-income households. Considering the nominal income and the CPI effects together, the net impact on regional income distribution is mostly unfavourable, except for mining-oriented regions.
Tourism expansion also reduces poverty at the national level and in most regions. However, poverty incidence can increase in some regions, particularly when the upward price effect is stronger than the nominal income effect for lower-income households. A weak income effect occurs when the Tourism-Dutch disease effect is strong within a region. Lastly, tourism expansion may narrow regional disparity by increasing GRP growth in developing regions relative to developed regions. This is consistent with earlier studies performed by Li et al. (2016) for China and Proença and Soukiazis (2008) for four Southern European countries. The present study also shows that regional disparity reduction is much stronger for an inbound tourism expansion compared to a domestic tourism expansion. This is because the demand structure of domestic tourism is less inclusive in developing regions; it is more concentrated in the highly populated regions that are usually better developed.
The above findings have important policy implications as they show that inter-regional disparity reduction and poverty reduction in most regions can be achieved by promoting tourism development. Policymakers, however, need to be aware of the negative spillover impacts of tourism expansion on within-region inequality and poverty in some regions. Hence, several policy measures are worth considering, both at the national and regional levels. At the national level, policy can be aimed at addressing the Tourism-Dutch disease effect. As suggested by Corden (2012), this could include piecemeal protection to specific industries or exchange rate intervention. At the regional level, policy can be focussed on mitigating the negative impacts on income inequality and poverty in the affected regions. More specifically, policies that target lower-income households such as conditional cash transfers or providing better job opportunities for low-skilled workers can be adopted. Last but not least, strong coordination between national and regional authorities is essential to maximize tourism benefits while mitigating the regional negative spillover impacts.
Footnotes
Acknowledgements
We acknowledge the scholarship support for Anda Nugroho from the Endowment Fund for Education (LPDP), Indonesian Ministry of Finance. Findings rest with the authors and do not necessarily reflect the perspective of the funding agency.
Declaration of conflicting interests
The author(s) declared no potential conflicts of interest with respect to the research, authorship, and/or publication of this article.
Funding
The author(s) received no financial support for the research, authorship, and/or publication of this article.