
Abstract
Using a time-varying parameter vector autoregressive (TVP-VAR) model, this study analyzes how inbound tourist arrivals (TOUR) respond to EPU in Australia. Empirical results show that EPU can Granger cause TOUR in most cases before COVID-19, whereas little evidence supports this finding after the pandemic. At the national level, it is found that EPU was the net risk transmitter before COVID-19 but became the net risk receiver after COVID-19, while TOUR was the net risk receiver over March 2007-March 2020 but became the net risk transmitter in the remaining months. The impulse response functions reflect that a 2.81% decline in the total TOUR was observed due to a 1% increase in EPU, which gradually decayed within 9 months for the sub-sample before COVID-19. Similar findings hold at the state/territory level. These findings provide profound evidence for the national and state/territory governments to allocate tourism resources and formulate supportive tourism policies.
Keywords
Introduction
With the gradual reopening of borders and the easing of travel restrictions in the post-pandemic era, there is a renewed global emphasis on the significance of inbound tourism for economic recovery. This emphasis stems from its crucial role in generating foreign exchange earnings, creating job opportunities, and fostering cultural exchange (Lim and Giouvris, 2020; Shi and Li, 2017). Taking Australia as an example, its tourism gross domestic product (GDP) reached $35.1 billion in chain volume terms with international tourism consumption of $6.4 billion, provided 501,400 employment opportunities, and accounted for 1.6% of Australia’s economy GDP in 2021-22 financial year (ABS, 2022). Consequently, many countries are dedicating substantial efforts to implementing economic policies to promote inbound tourism. However, it is essential to recognize that the response of inbound tourism to economic policies can vary significantly across different regions due to their unique resource endowments. For instance, Australia, often referred to as an ‘island continent’, boasts a diverse array of natural, geographical, and cultural landscapes and climates. As a result, it possesses distinctive resource endowments that can be leveraged to develop the tourism industry across its various states/territories 1 .
To provide a comprehensive assessment of the destination country’s policy-related economic stability, the economic policy uncertainty (EPU) index has been developed, which potentially impacts inbound tourism through two primary mechanisms (Baker et al., 2016): The first mechanism involves exchange rates. It is widely acknowledged that a high EPU index in the destination country can influence market participants’ expectations about its economic outlook. This, in turn, can affect the demand and supply of its currency, leading to exchange rate fluctuations and subsequently affecting inbound tourism (Abid, 2020). Second, a high EPU index in the destination country typically signifies an unstable economic environment with high market volatilities, which decreases investor confidence and causes shrinking tourism investments. This, in turn, may lead to inadequate provision of tourism products, services, infrastructure, and facilities in the destination country, ultimately bringing damaging effects on destination image and inbound tourist arrivals (Al-Thaqeb and Algharabali, 2019; Bernanke, 1983).
Unfortunately, existing studies have predominantly focused on the aggregate impact of EPU on inbound tourism, with limited attention given to the interactions between exchange rates and EPU. Addressing this deficiency, this study utilizes evidence from Australia and employs a vector autoregression (VAR) framework to distinguish effects of exchange rates and EPU on inbound tourism at both the national and state/territory levels. In so doing, this study represents three advances over previous studies. First, this study conducts break point tests for inbound tourism to Australia, identifying structural shifts in inbound tourist arrivals at both the national and state/territory levels. This deepens our understanding of how Australia’s national and state/territory inbound tourism responds differently to exchange rates and EPU before and after COVID-19 pandemic 2 . Second, a time-varying parameter VAR (TVP-VAR) model with a mixture innovation distribution not only captures the structural breaks resulting from pandemic shocks, but also separately characterizes the dynamic impacts of exchange rates and EPU on inbound tourism. Third, the constructed risk spillover indicators and impulse response functions enable us to explore how risks transmit between EPU and inbound tourism and identify the state/territory with the highest sensitivity of inbound demand to EPU, thereby offering insights into regional vulnerabilities.
The rest of this study is organized as follows: Literature review section reviews how EPU has been previously researched in existing literature and identifies research gaps. Methodology section introduces the dataset and methodology employed in this study. Empirical results and discussions section presents the empirical results, accompanied by detailed discussions. The final section concludes this study by summarizing the main findings, highlighting their implications, and suggesting avenues for future research.
Literature review
Since the EPU index was developed based on newspaper coverage frequencies of policy, market, and economic indicators to measure the overall stability of an economy, considerable efforts have been made to investigate its impact on tourism demand from different perspectives (Baker et al., 2016; Zhang et al., 2022). Firstly, it is widely supported that EPU negatively influences tourism demand in terms of various indicators for tourism performance. For example, Ongan and Gozgor (2018) employ the unit root and cointegration tests with consideration of unknown structural breaks and find that an increase in the EPU index for Japan significantly decreases its tourists’ departures to the United States (US). After controlling world industrial production, Hailemariam and Ivanovski (2022) use a structural VAR (SVAR) model and document that a rising global EPU significantly reduces the demand for US tourism net export expenditures. With the help of a long-run causality modelling approach with a Fourier approximation, Payne et al. (2022) detect the unidirectional causality running from EPU to international tourist arrivals to the Croatian Adriatic coast and confirm negative and significant impacts in the respective coastal counties. Similarly, EPU’s negative impacts on tourism demand also apply to other tourism performance indicators such as tourism related companies’ stock returns (Ersan et al., 2019), investment policies in hospitality companies (Akron et al., 2020), overseas air travel (Payne and Apergis, 2022), hotel room demand and operating performance (Chen et al., 2020; Madanoglu and Ozdemir, 2019), and domestic tourism spending (Gozgor and Ongan, 2017).
Secondly, profound evidence from different countries and regions also supports the adverse impacts of EPU on tourism demand. In the case of the Organization for Economic Co-operation and Development (OECD) countries, Balli et al. (2018) conduct a wavelet analysis and argue that tourist inflows to destination countries are negatively related to the local EPUs apart from the global EPU. Kuok et al. (2022) use China as a case of developing economies and conclude that China’s inbound and outbound tourism demand is negatively affected by its EPU shock based on empirical results of a global VAR approach. Evidence from African countries’ tourist arrivals from the major economies also indicates that a positive change in EPUs for Canada, Russia, Spain and the United Kingdom (UK) negatively affects their tourist departures to African countries (Gholipour et al., 2022). Similar findings can also be confirmed in other economies such as Japan (Ongan and Gozgor, 2018), Asian and Pacific Rim countries (Tsui et al., 2018), France, Greece, and the US (Ghosh, 2019), 12 countries in three regions of America, Europe, and Asia-Pacific (Akadiri et al., 2020), the US (Hailemariam and Ivanovski, 2022), Turkey (Irani et al., 2022), and Croatian and European economies (Payne et al., 2022).
Thirdly, however, there is no consensus on the above negative impact of EPU on tourism demand when considering heterogeneity issues in terms of influential periods, income levels, shock types, and levels of tourism demand. For example, Singh et al. (2019) argue that the relationship between EPU and tourist footfalls depends on time dimensions. Using a wavelet analysis, they find that EPU demonstrates a little immediate impact on international tourist footfalls in the US, while the impacts are persistent in the medium and long run. According to Nguyen et al. (2020), heterogenous effects of EPU on domestic and outbound tourism depends on income levels. That is, negative impacts are observed in higher-income economies, but positive impacts are observed in lower- and middle-income economies. Sharma (2021) adopts a nonlinear autoregressive distributed lag model to test how tourism demand responds differently to negative and positive changes in EPU. Based on the evidence from India over the period January 2006–April 2018, the author observes that negative effects caused by increasing EPUs are more penetrating than positive effects caused by decreasing EPUs. To differentiate between tourism peak season and off-season, Jiang et al. (2022) employ a quantile-on-quantile method and focus on the upper and lower quantiles of stock returns of Chinese tourism-listed companies. They observe both negative and positive impacts of the Chinese categorical EPU on stock returns at different distribution levels, and further confirm that during tourism off-season the asymmetry is more obvious at lower and upper quantiles. Inconsistent results regarding how EPU affects tourism demand are also found in Wu and Wu (2019) by reporting a unidirectional causality from European EPU to international tourism receipts in the short run and a bidirectional causality between them in the long run, Chen et al. (2020) by distinguishing between the trough and peak periods in tourists’ hotel room demands, Akadiri et al. (2020) by detecting different types of causality among 12 countries in a heterogeneous panel, and so on.
Lastly, despite the above fruitful achievements on the relationship between EPU and tourism demand, few studies except for Payne et al. (2022) and Zhang et al. (2022) have explicitly been conducted from the disaggregated and dynamic perspectives. More specifically, Payne et al. (2022) conduct a disaggregated analysis to compare the differential impacts of Croatian and European EPUs on international tourist arrivals to the Croatian Adriatic coast. They confirm a significant and negative causality running from EPU to international tourist arrivals across the respective coastal counties. Using a TVP-VAR model to capture the time-varying impacts of EPU on Chinese inbound tourism, Zhang et al. (2022) examine how impacts change directions and how impacts gradually weaken as the lag period increases. To enrich the existing literature on the impact of EPU on tourism demand, this study carries out a disaggregated analysis to examine the viewpoint that inbound tourism to Australia’s states/territories may respond differently to EPU due to the state/territory disparities in tourism resource endowments and inbound tourism’s economic contributions. Further to Zhang et al. (2022), this study constructs risk spillover indicators after estimating a TVP-VAR model with a mixture innovation distribution to explore how risks transmit between EPU and inbound tourism to Australia’s states/territories. Findings of this study provide profound evidence for the national and state/territory governments to allocate tourism resources and formulate supportive tourism policies.
Methodology
Variables and data sources
This study aims to adopt a TVP-VAR model with a mixture innovation distribution to differentiate between the time-varying impacts of exchange rates and EPU on inbound tourism to Australia’s states/territories. To achieve this, a tri-variate monthly dataset consisting of inbound tourist arrivals to Australia (TOUR), the EPU index for Australia, and the real exchange rate of Australia (REER) over the period January 1998–August 2022 is used in this study, yielding 296 observations. It is noteworthy that the seasonally adjusted number of short-term visitor arrivals to Australia collected from Australian Bureau of Statistics
3
is used to represent TOUR. Moreover, the dataset includes Australia’s total inbound tourist arrivals (TOTAL) as well as its state/territory inbound tourist arrivals to NSW, VIC, QLD, WA, SA, NT, ACT and TAS, but it excludes inbound tourist arrivals to other territories due to its poor data availability and/or extremely low numbers. The monthly EPU data for Australia are sourced from the EPU website (https://www.policyuncertainty.com/index.html). The real broad effective exchange rate for Australia (index 2010 = 100) collected from Federal Reserve Economic Data
4
is used to represent the variable REER. By taking the first-order difference of the logarithmic variable
TVP-VAR model
The proposed TVP-VAR model enables us to advance our knowledge about the impact of EPU on the state/territory inbound tourism to Australia from a dynamic perspective, which demonstrates advantages in the following three aspects (Koop et al., 2009; Zhang et al., 2022): First, compared with a traditional VAR model, the estimated time-varying parameters of the TVP-VAR model can timely visualize the impulse response of inbound tourism to EPU at each time point to provide real-time evidence for tourism policymaking in Australia. This visual depiction is especially valuable for distinguishing risk transmission dynamics before and after the COVID-19 pandemic. Second, the TVP-VAR model can effectively eliminate endogeneity by treating TOUR, EPU and REER as endogenous variables and each variable has an equation showing how it evolves over time. For example, TOUR can be modelled as an equation including the lagged values of TOUR itself, EPU and REER, and an error term. This allows us to reliably isolate the time-varying impact of EPU on inbound tourism after controlling exchange rate which has been identified as the most common determinant of inbound tourism in the existing literature. Moreover, this model offers great flexibility in incorporating additional control variables, such as tourists’ income and relative prices. Third, the TVP-VAR model uses a mixture innovation distribution, which effectively captures structural breaks caused by few large exogenous shocks (e.g. the COVID-19 pandemic).
As a result, we refer to Koop et al. (2009) and consider the following tri-variate TVP-VAR model with a mixture innovation distribution in this study.


The time-varying parameters


Let
Further analysis based on the TVP-VAR model
After estimating the TVP-VAR model, further analysis can be conducted from the following four perspectives. First, following Dogru et al. (2019), this study detects whether TOUR responds differently to positive (
Second, the Granger causality test is performed to check whether EPU Granger causes TOUR, which requires to check the zero restrictions in
Third, referring to Gabauer and Gupta (2018), the risk spillover indicators can be calculated as the net directional connectedness. To this end, the VAR model should be first transformed to its vector moving average (VMA) representation to obtain the results of the generalized impulse response function and the forecast error variance decomposition. Then, for each variable (i.e. EPU, REER and TOUR), the above results can be used to construct the total directional connectedness (TC) from others and to others and standardize them by 100. As a result, the risk spillover indicator is the difference between the TC to others and the TC from others. More importantly, a variable with a positive risk spillover indicator is identified as a risk transmitter which is driving the network, whereas a negative indicator implies that the variable is a risk receiver which is driven by the network.
In addition, the impulse response functions can be obtained to reflect how EPU affects TOUR at each time point. In particular, the impulse responses are evaluated at
Empirical results and discussions
Preliminary tests and analysis
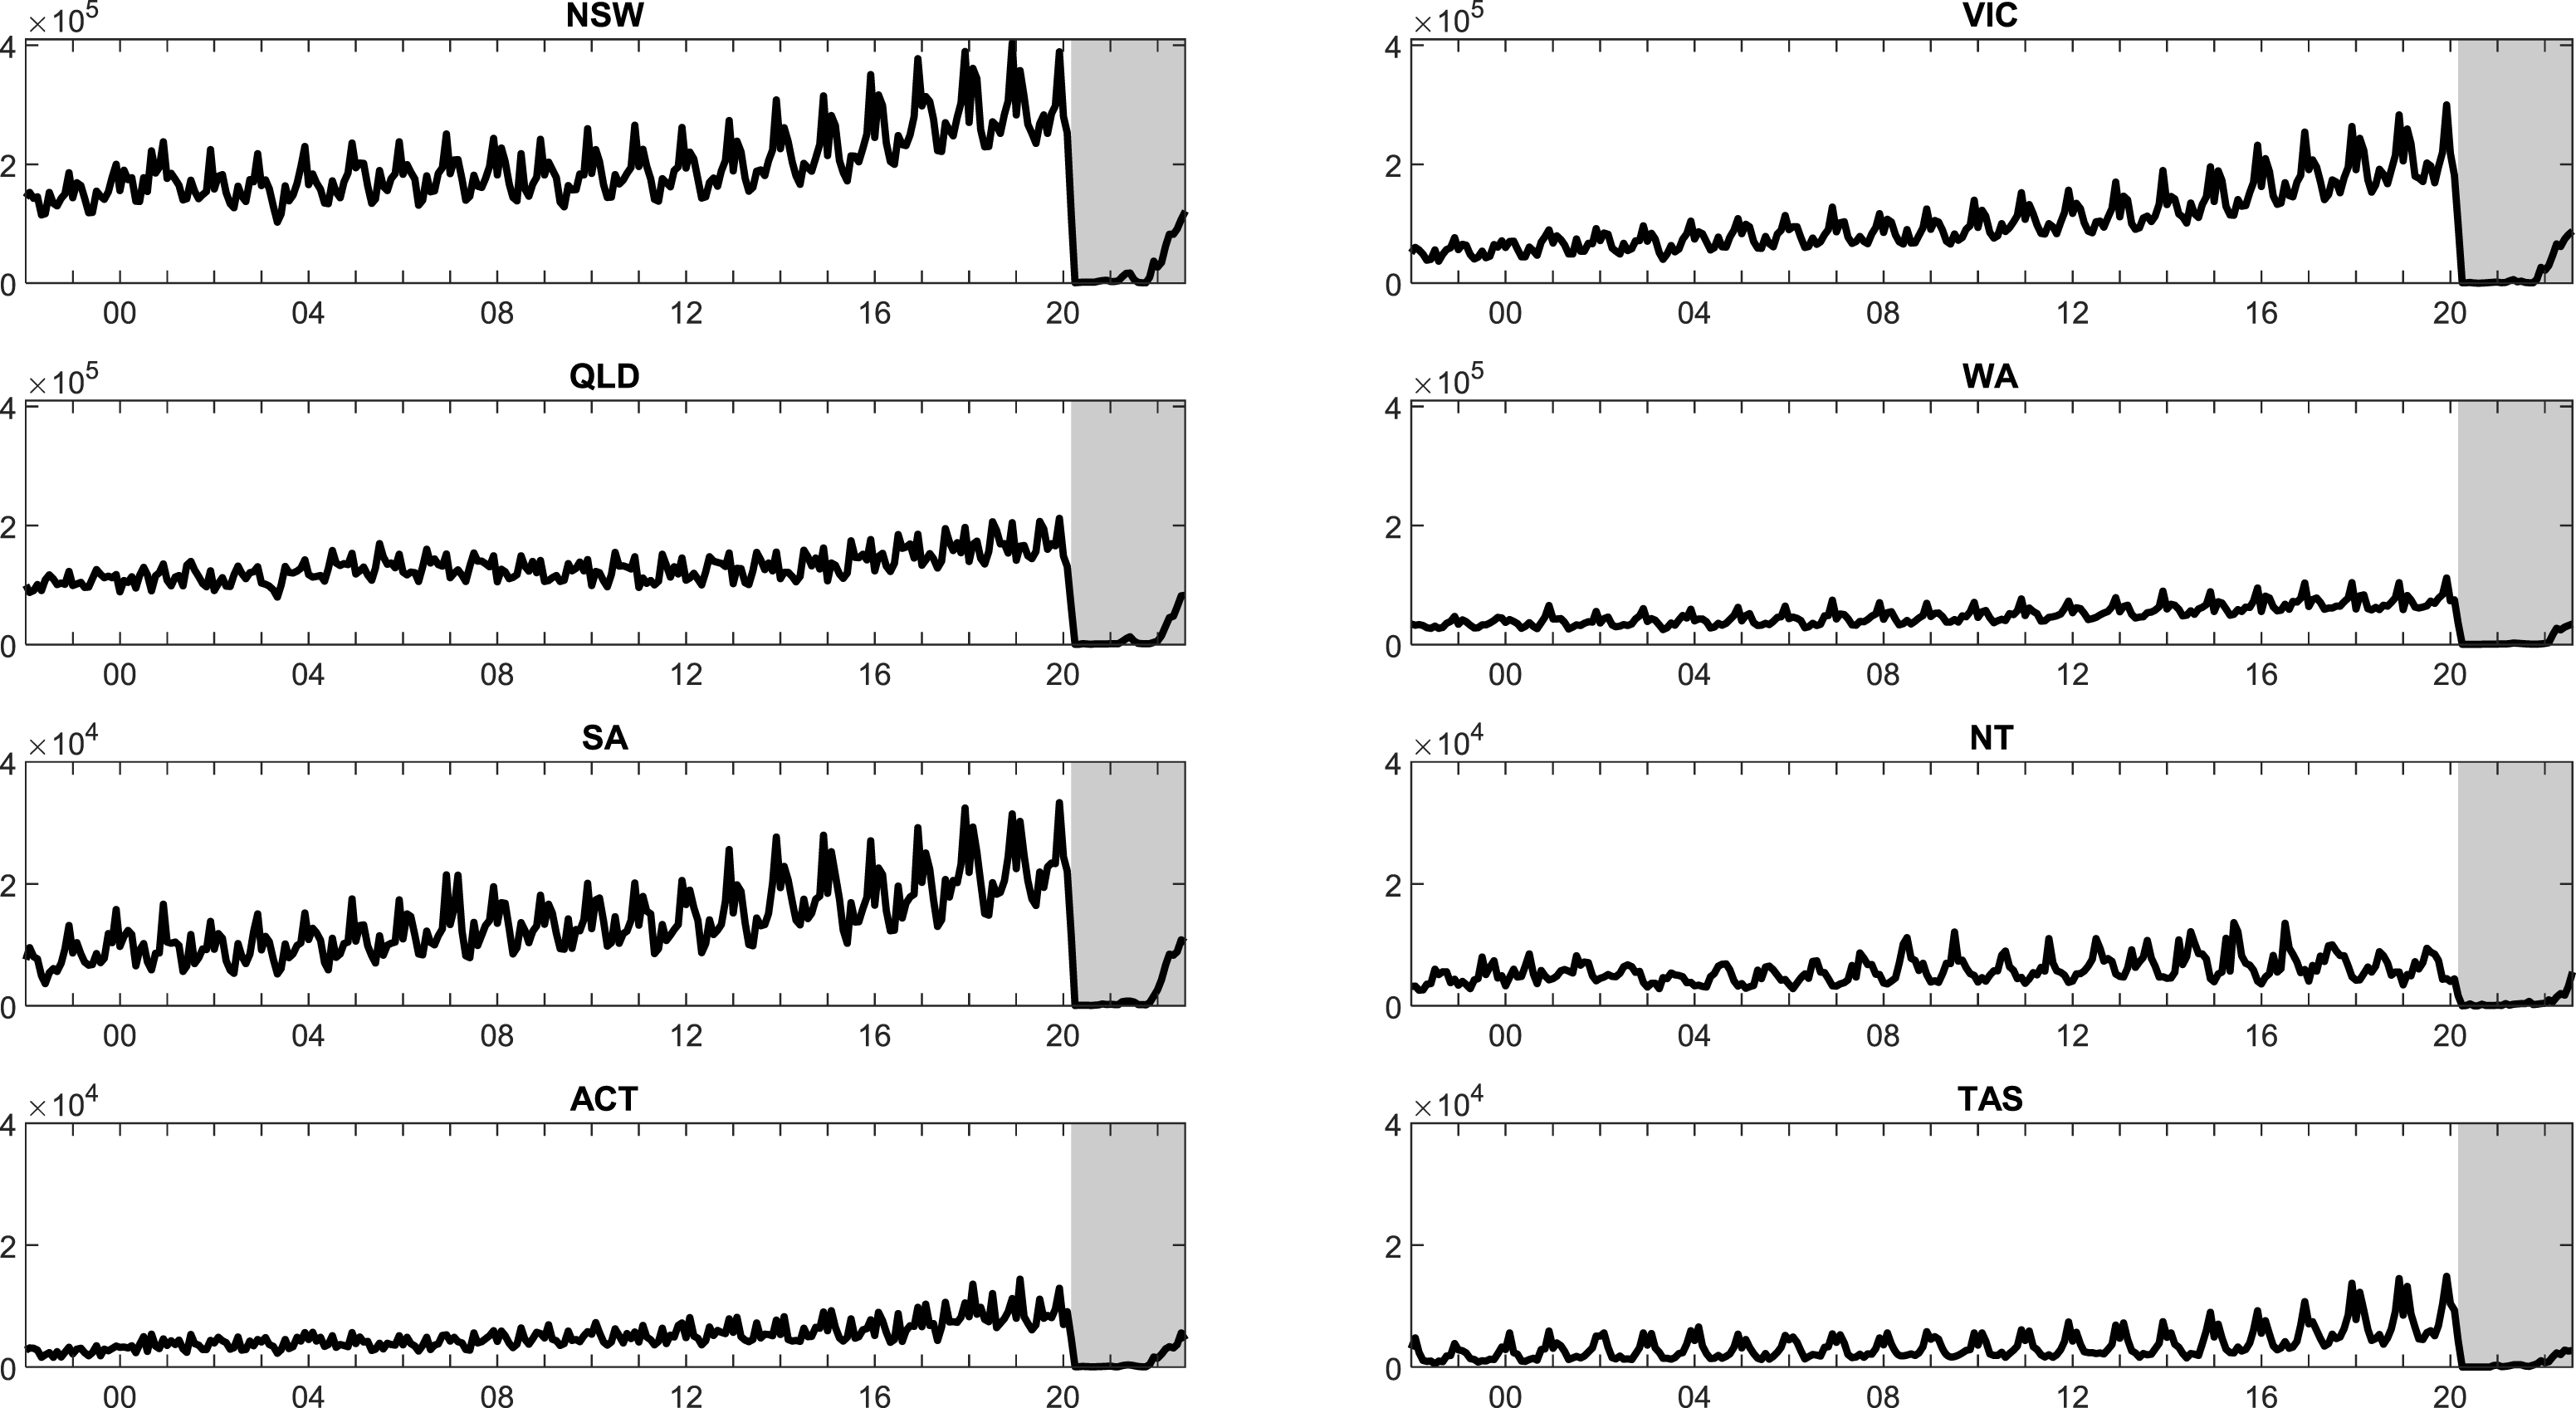
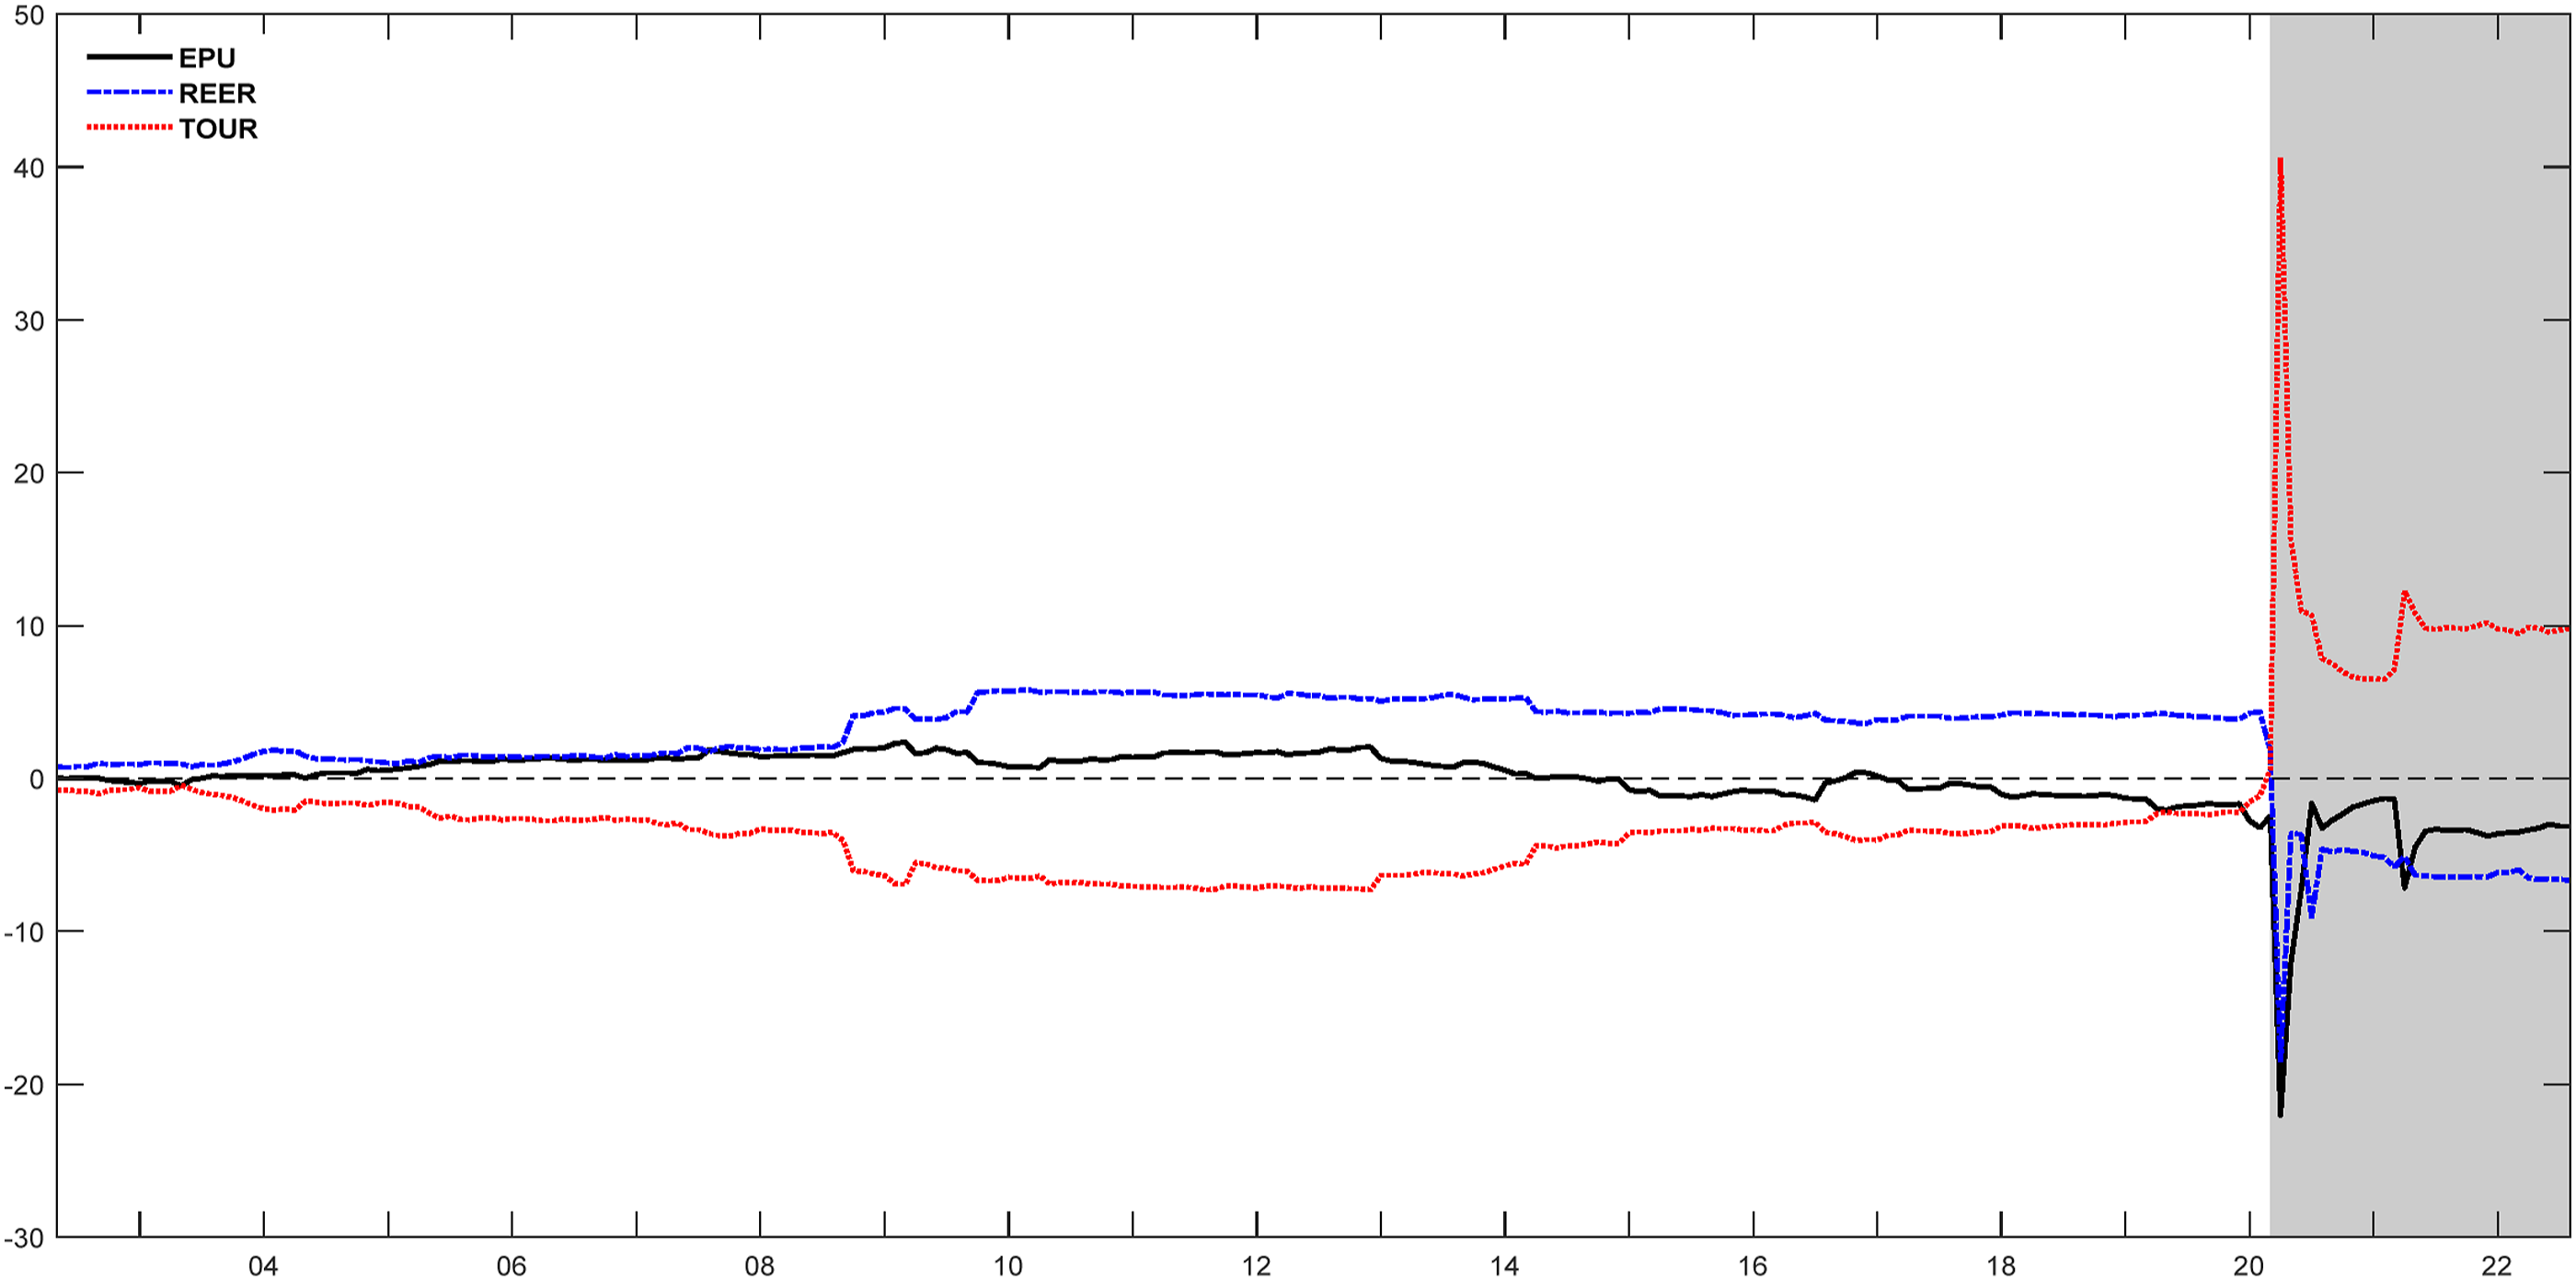
To get an overall picture of the potential co-movements among EPU, exchange rates and inbound tourism, Figure 1 visualizes the evolutions of original EPU, REER and TOUR over the period January 1998–August 2022. As observed, EPU in Panel (a) fluctuated frequently over time with obvious peaks and troughs. For comparison, nominal exchange rates (FXITWI) based on Australian dollar trade-weighted index were represented by the dashed red line in Panel (b), displaying a similar evolutionary pattern to REER over time. Notably, no clear structural breaks were observed either in EPU or exchange rates. As seen in Panel (c), the total inbound tourist arrivals to Australia demonstrated clear seasonality before the pandemic outbreak in March 2020. However, the dramatically declined arrivals after the pandemic indicated the potential structural breaks in inbound tourism to Australia. Similarly, it can be seen in Figure 2 that Australia’s state/territory inbound tourist arrivals also exhibited seasonality and potential structural breaks. Economic policy uncertainty, exchange rates and original inbound tourist arrivals to Australia. Notes. The shaded area indicates the period after the COVID-19 pandemic. In Panel (c), total inbound tourist arrivals are the original data for capturing seasonality which will be adjusted in the empirical analysis. Original inbound tourist arrivals to Australia by state/territory. Notes. The shaded area indicates the period after the COVID-19 pandemic. Original arrivals are used to capture seasonality which will be adjusted in the empirical analysis.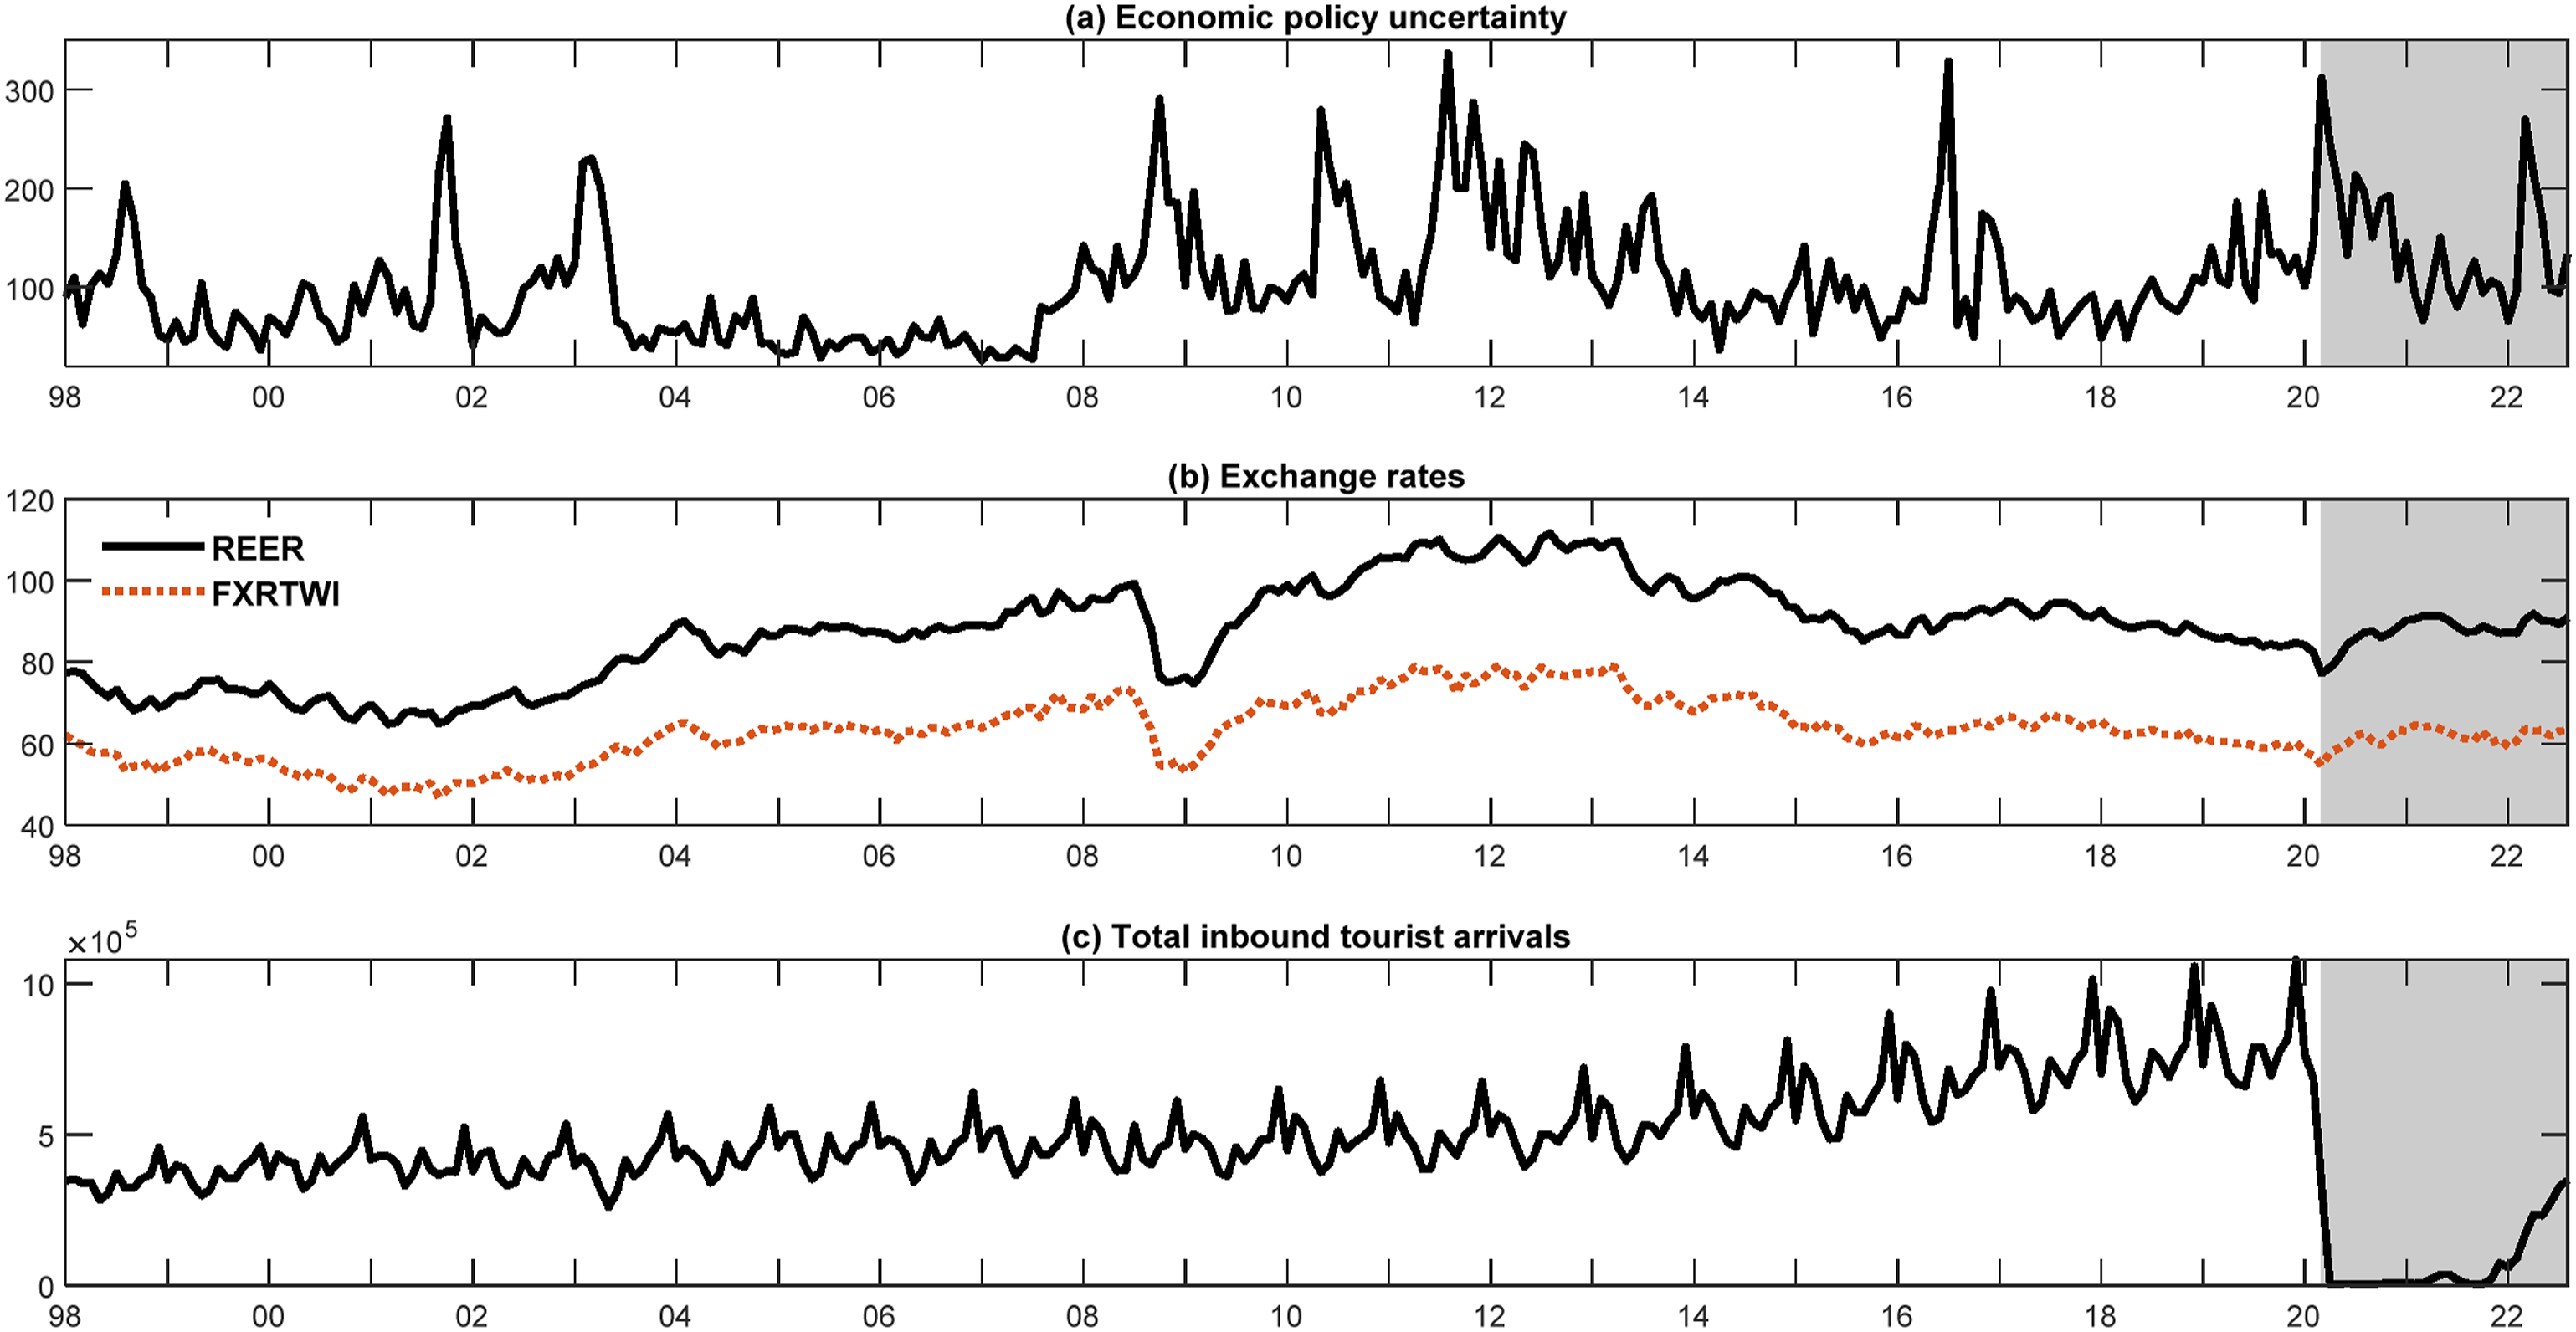
Unit root and break point test results.
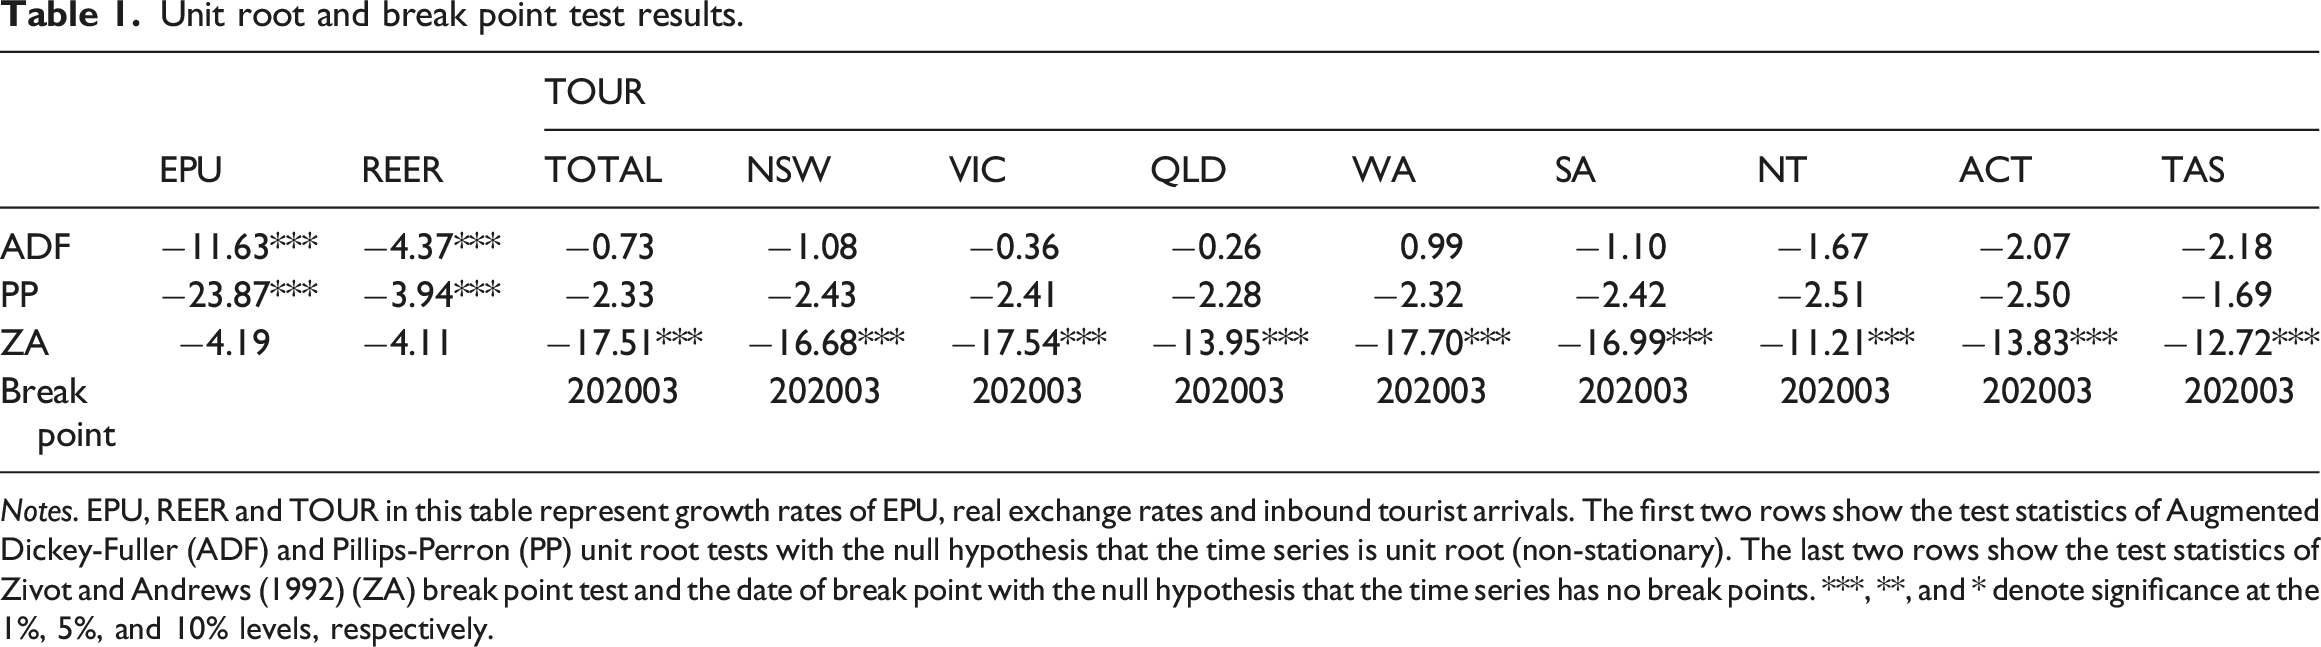
Notes. EPU, REER and TOUR in this table represent growth rates of EPU, real exchange rates and inbound tourist arrivals. The first two rows show the test statistics of Augmented Dickey-Fuller (ADF) and Pillips-Perron (PP) unit root tests with the null hypothesis that the time series is unit root (non-stationary). The last two rows show the test statistics of Zivot and Andrews (1992) (ZA) break point test and the date of break point with the null hypothesis that the time series has no break points. ***, **, and * denote significance at the 1%, 5%, and 10% levels, respectively.
Descriptive statistics of variables before and after COVID-19.
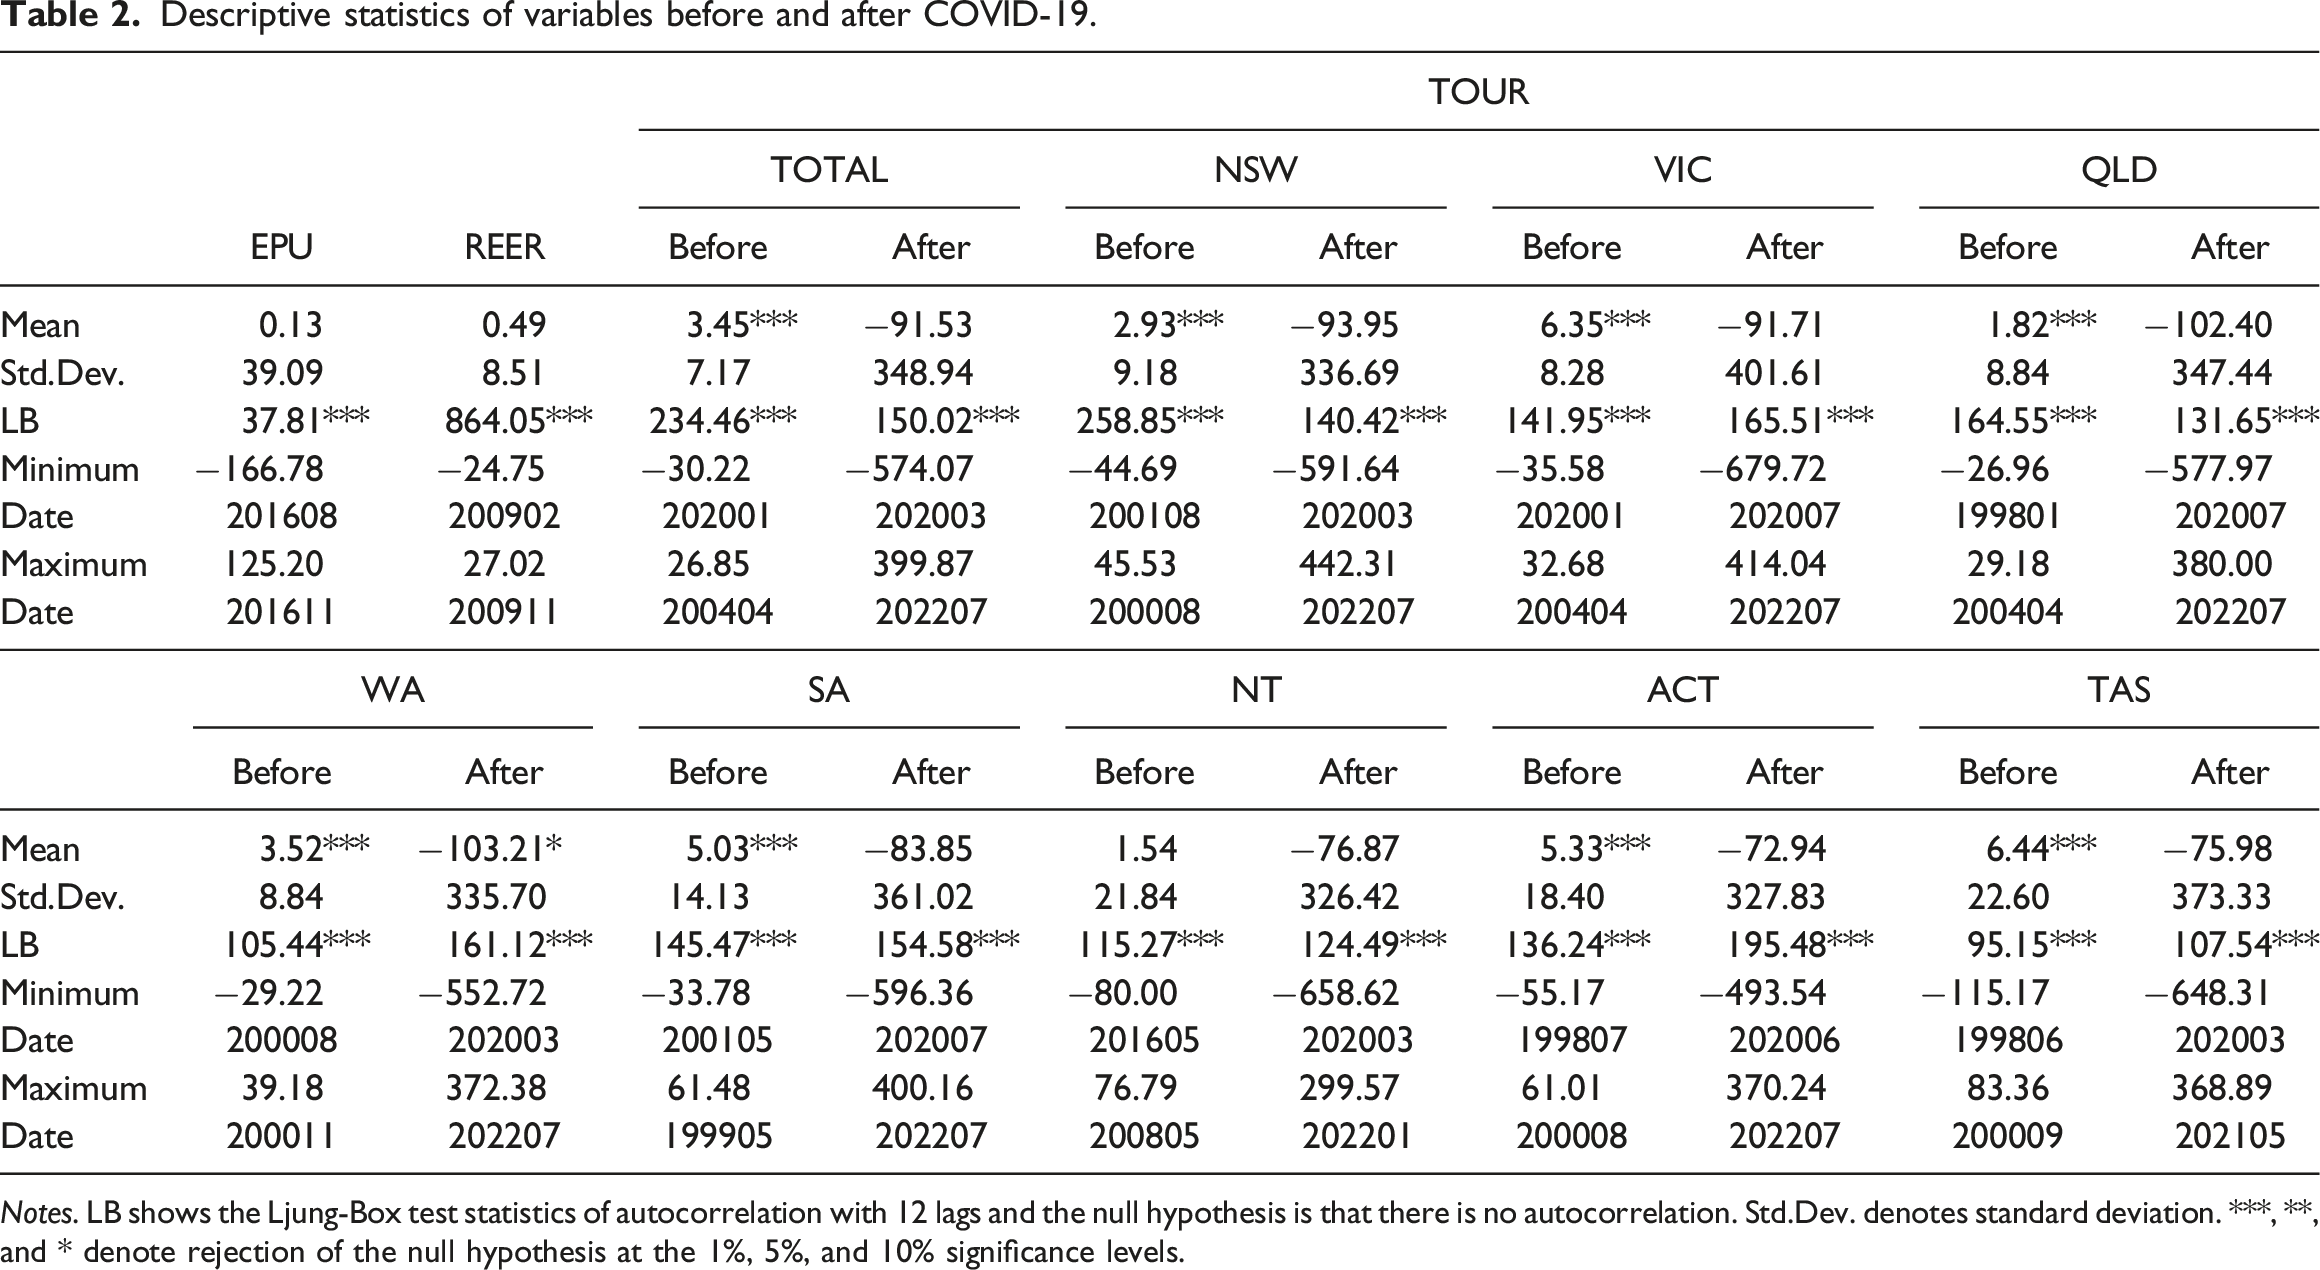
Notes. LB shows the Ljung-Box test statistics of autocorrelation with 12 lags and the null hypothesis is that there is no autocorrelation. Std.Dev. denotes standard deviation. ***, **, and * denote rejection of the null hypothesis at the 1%, 5%, and 10% significance levels.
Results and discussions of the granger causality tests
Results of the Granger causality tests EPU -> TOUR.
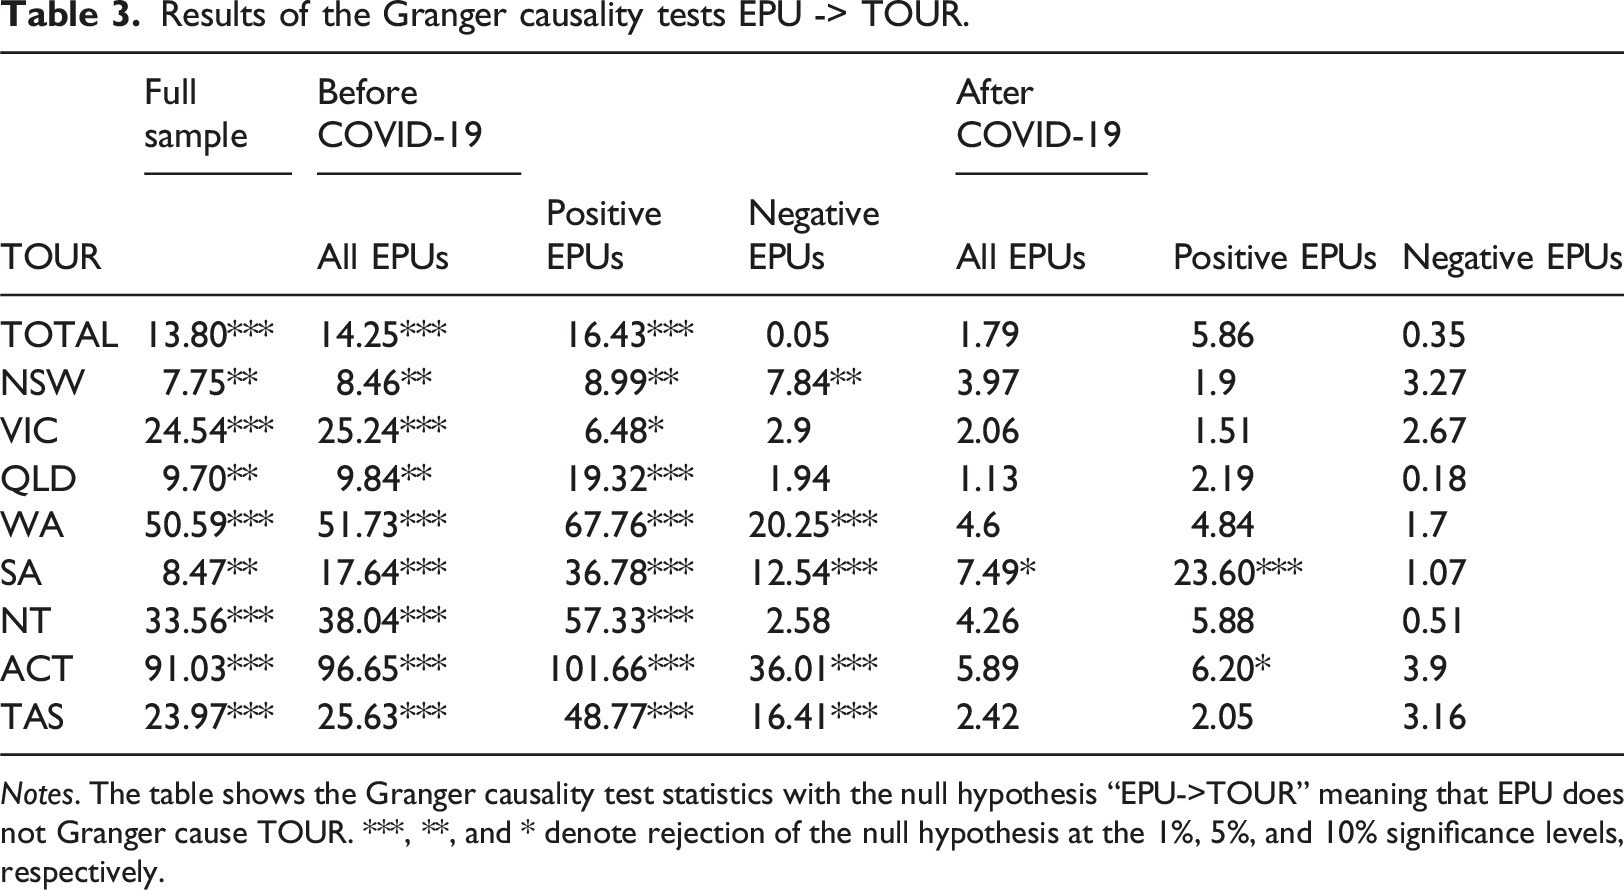
Notes. The table shows the Granger causality test statistics with the null hypothesis “EPU->TOUR” meaning that EPU does not Granger cause TOUR. ***, **, and * denote rejection of the null hypothesis at the 1%, 5%, and 10% significance levels, respectively.
Results and discussions of the risk spillover indicators
Figures 3 and 4 visualize how the risk spillover indicators of EPU, REER and TOUR evolve over time at the national and state/territory levels, respectively. At the national level, before COVID-19, positive indicators for EPU imply that EPU was a net risk transmitter which was the main risk source driving the tri-variate TVP-VAR network. REER changed from a net risk receiver driven by the network to a net risk transmitter driving the network in the year 2008–2009. The national TOUR became negative after the year 2007–2008, implying that it changed from a net risk transmitter driving the network to a net risk receiver driven by the network. Interestingly, the risk spillover indicators for TOUR became positive with high volatility after COVID-19. The indicators experienced a sharp increase at the beginning of the pandemic, followed by a dramatic decrease in 2021 and then a gradual increase in 2022. Nevertheless, both EPU and REER displayed an opposite pattern over the period March 2020–August 2022, indicating that they became the net risk receivers driven by the network. Risk spillover indicators for EPU, REER and TOUR at the national level. Risk spillover indicators for EPU, REER and TOUR at the state/territory level.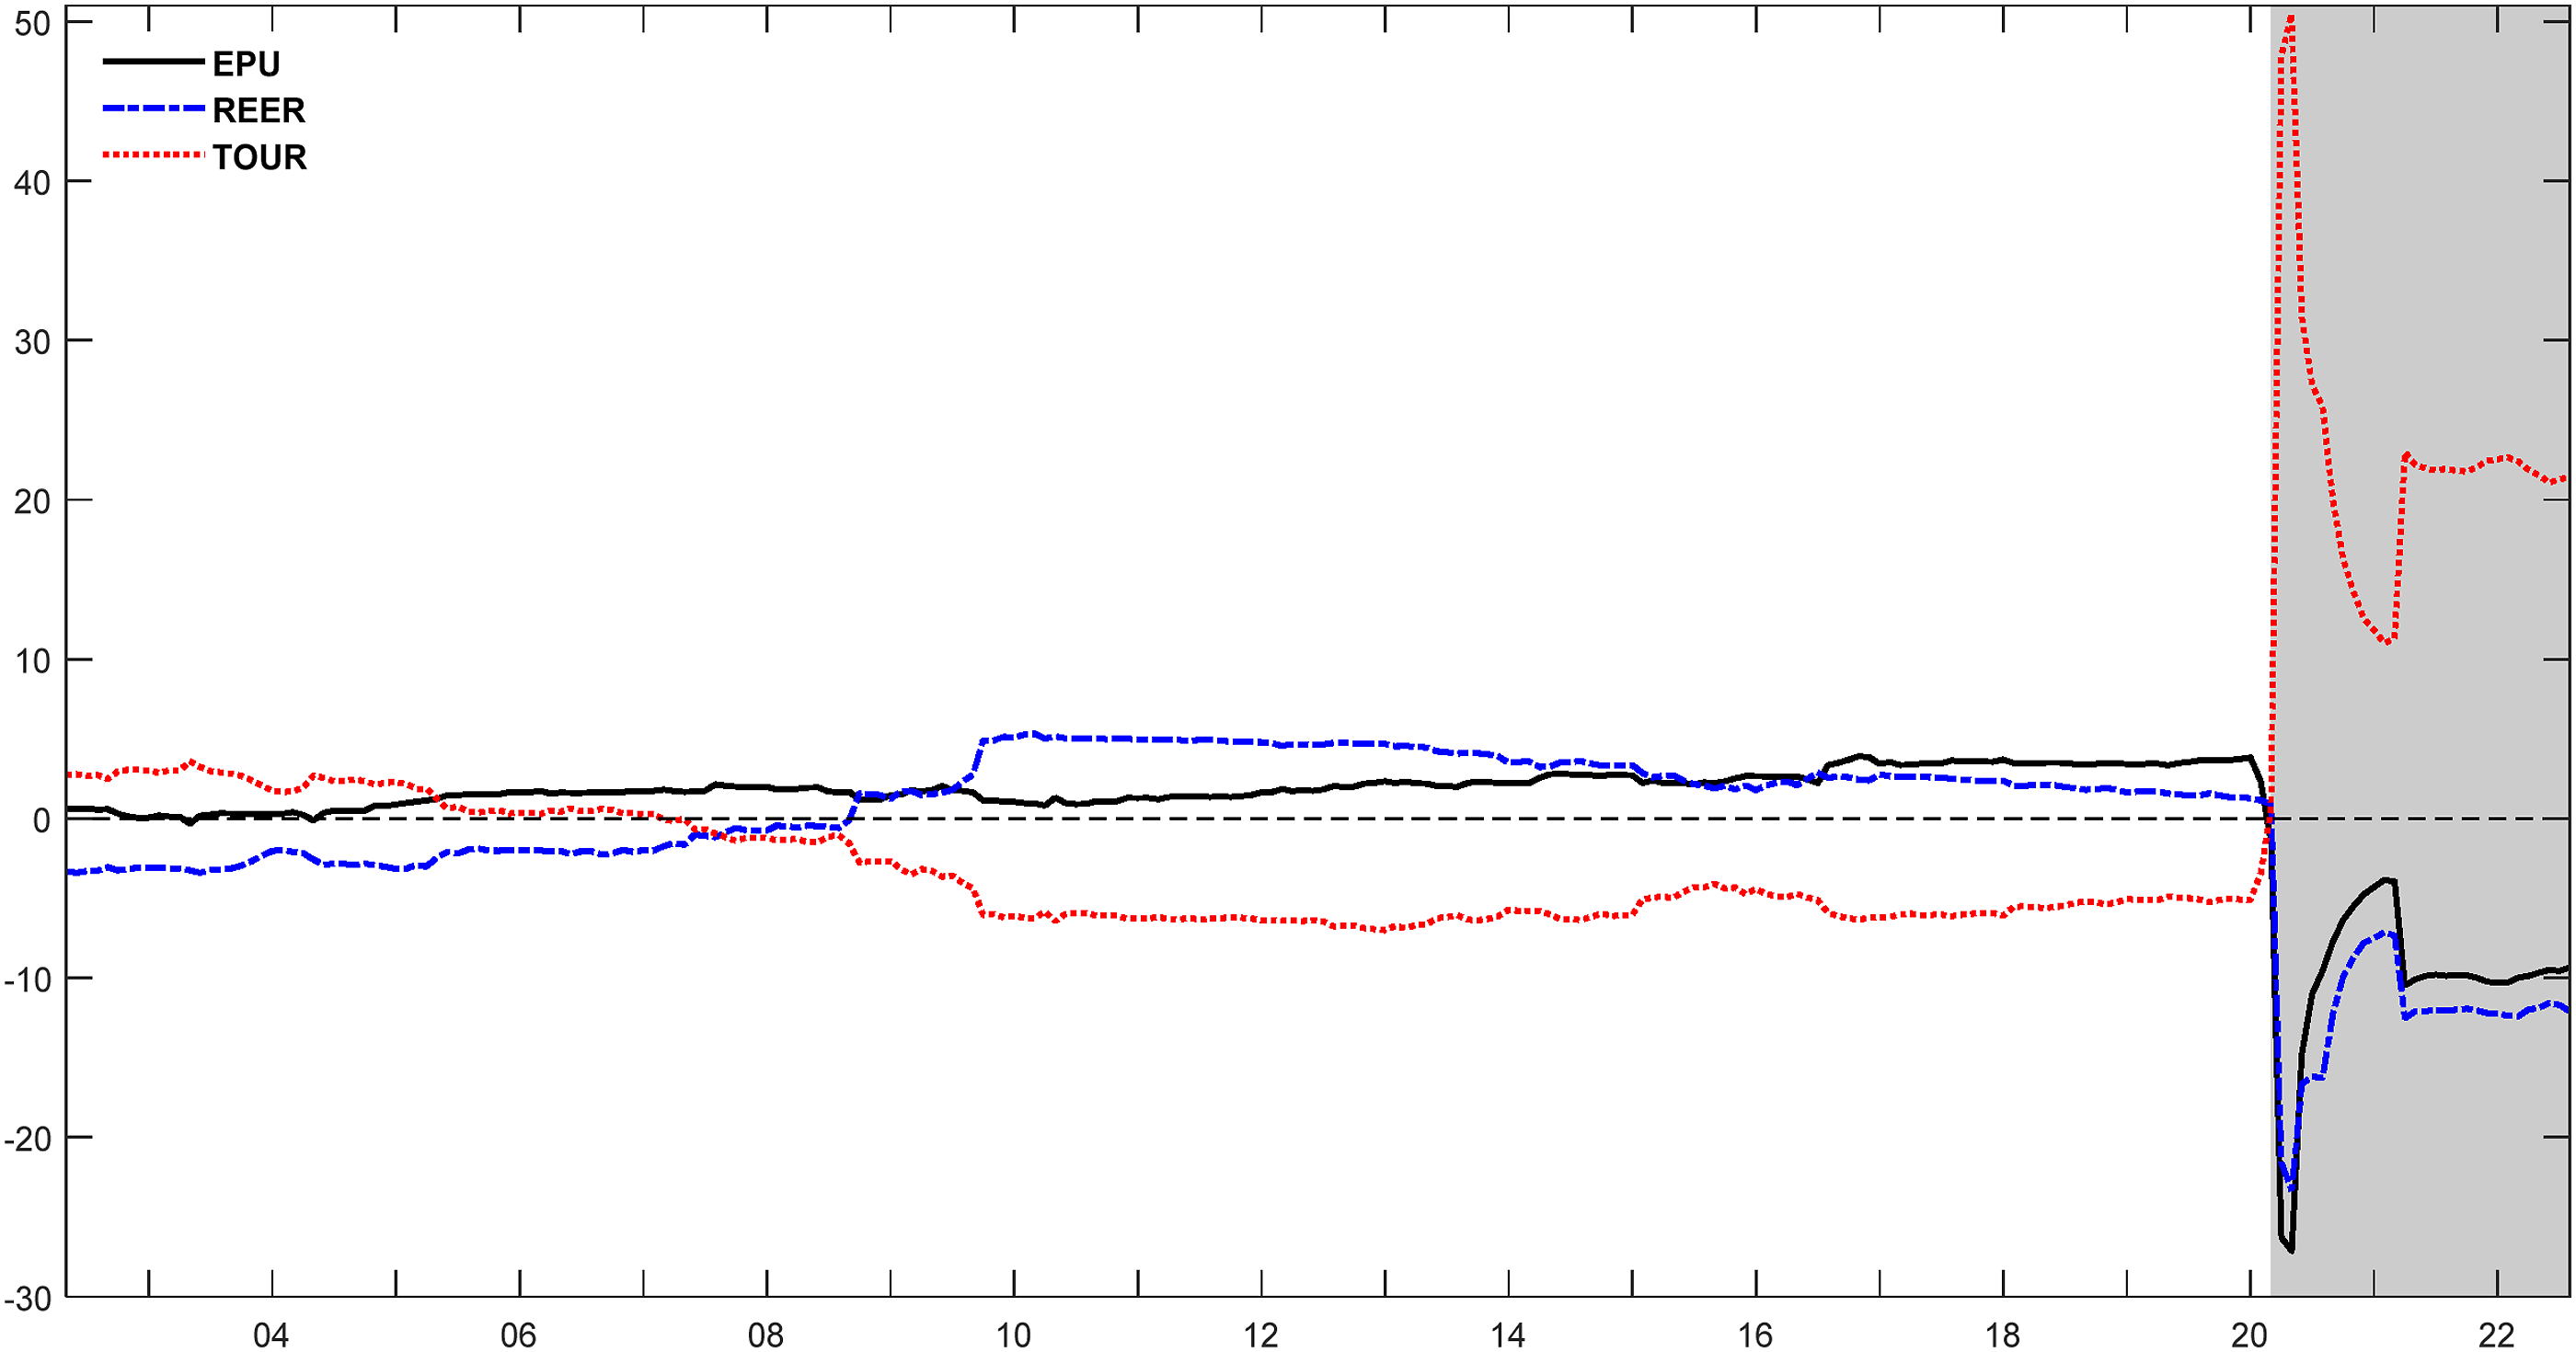
The above findings not only advance our knowledge regarding how risk transmits among EPU, REER and the national TOUR in the tri-variate TVP-VAR network, but also point out the direction of policymaking efforts. As for the time-varying impacts of EPU on TOUR, it can be argued that risk mainly transmitted from EPU to TOUR before COVID-19, suggesting that more efforts should be made to stabilize EPU. This would provide tourism investors and inbound tourists with a stable economic environment and optimistic expectation about Australia’s future economy, and then boost inbound tourism to Australia. On the contrary, risk transmitted mainly from TOUR to EPU and REER after COVID-19, indicating that policies and measures for boosting inbound tourism would also help to stabilize Australia’s economic environment.
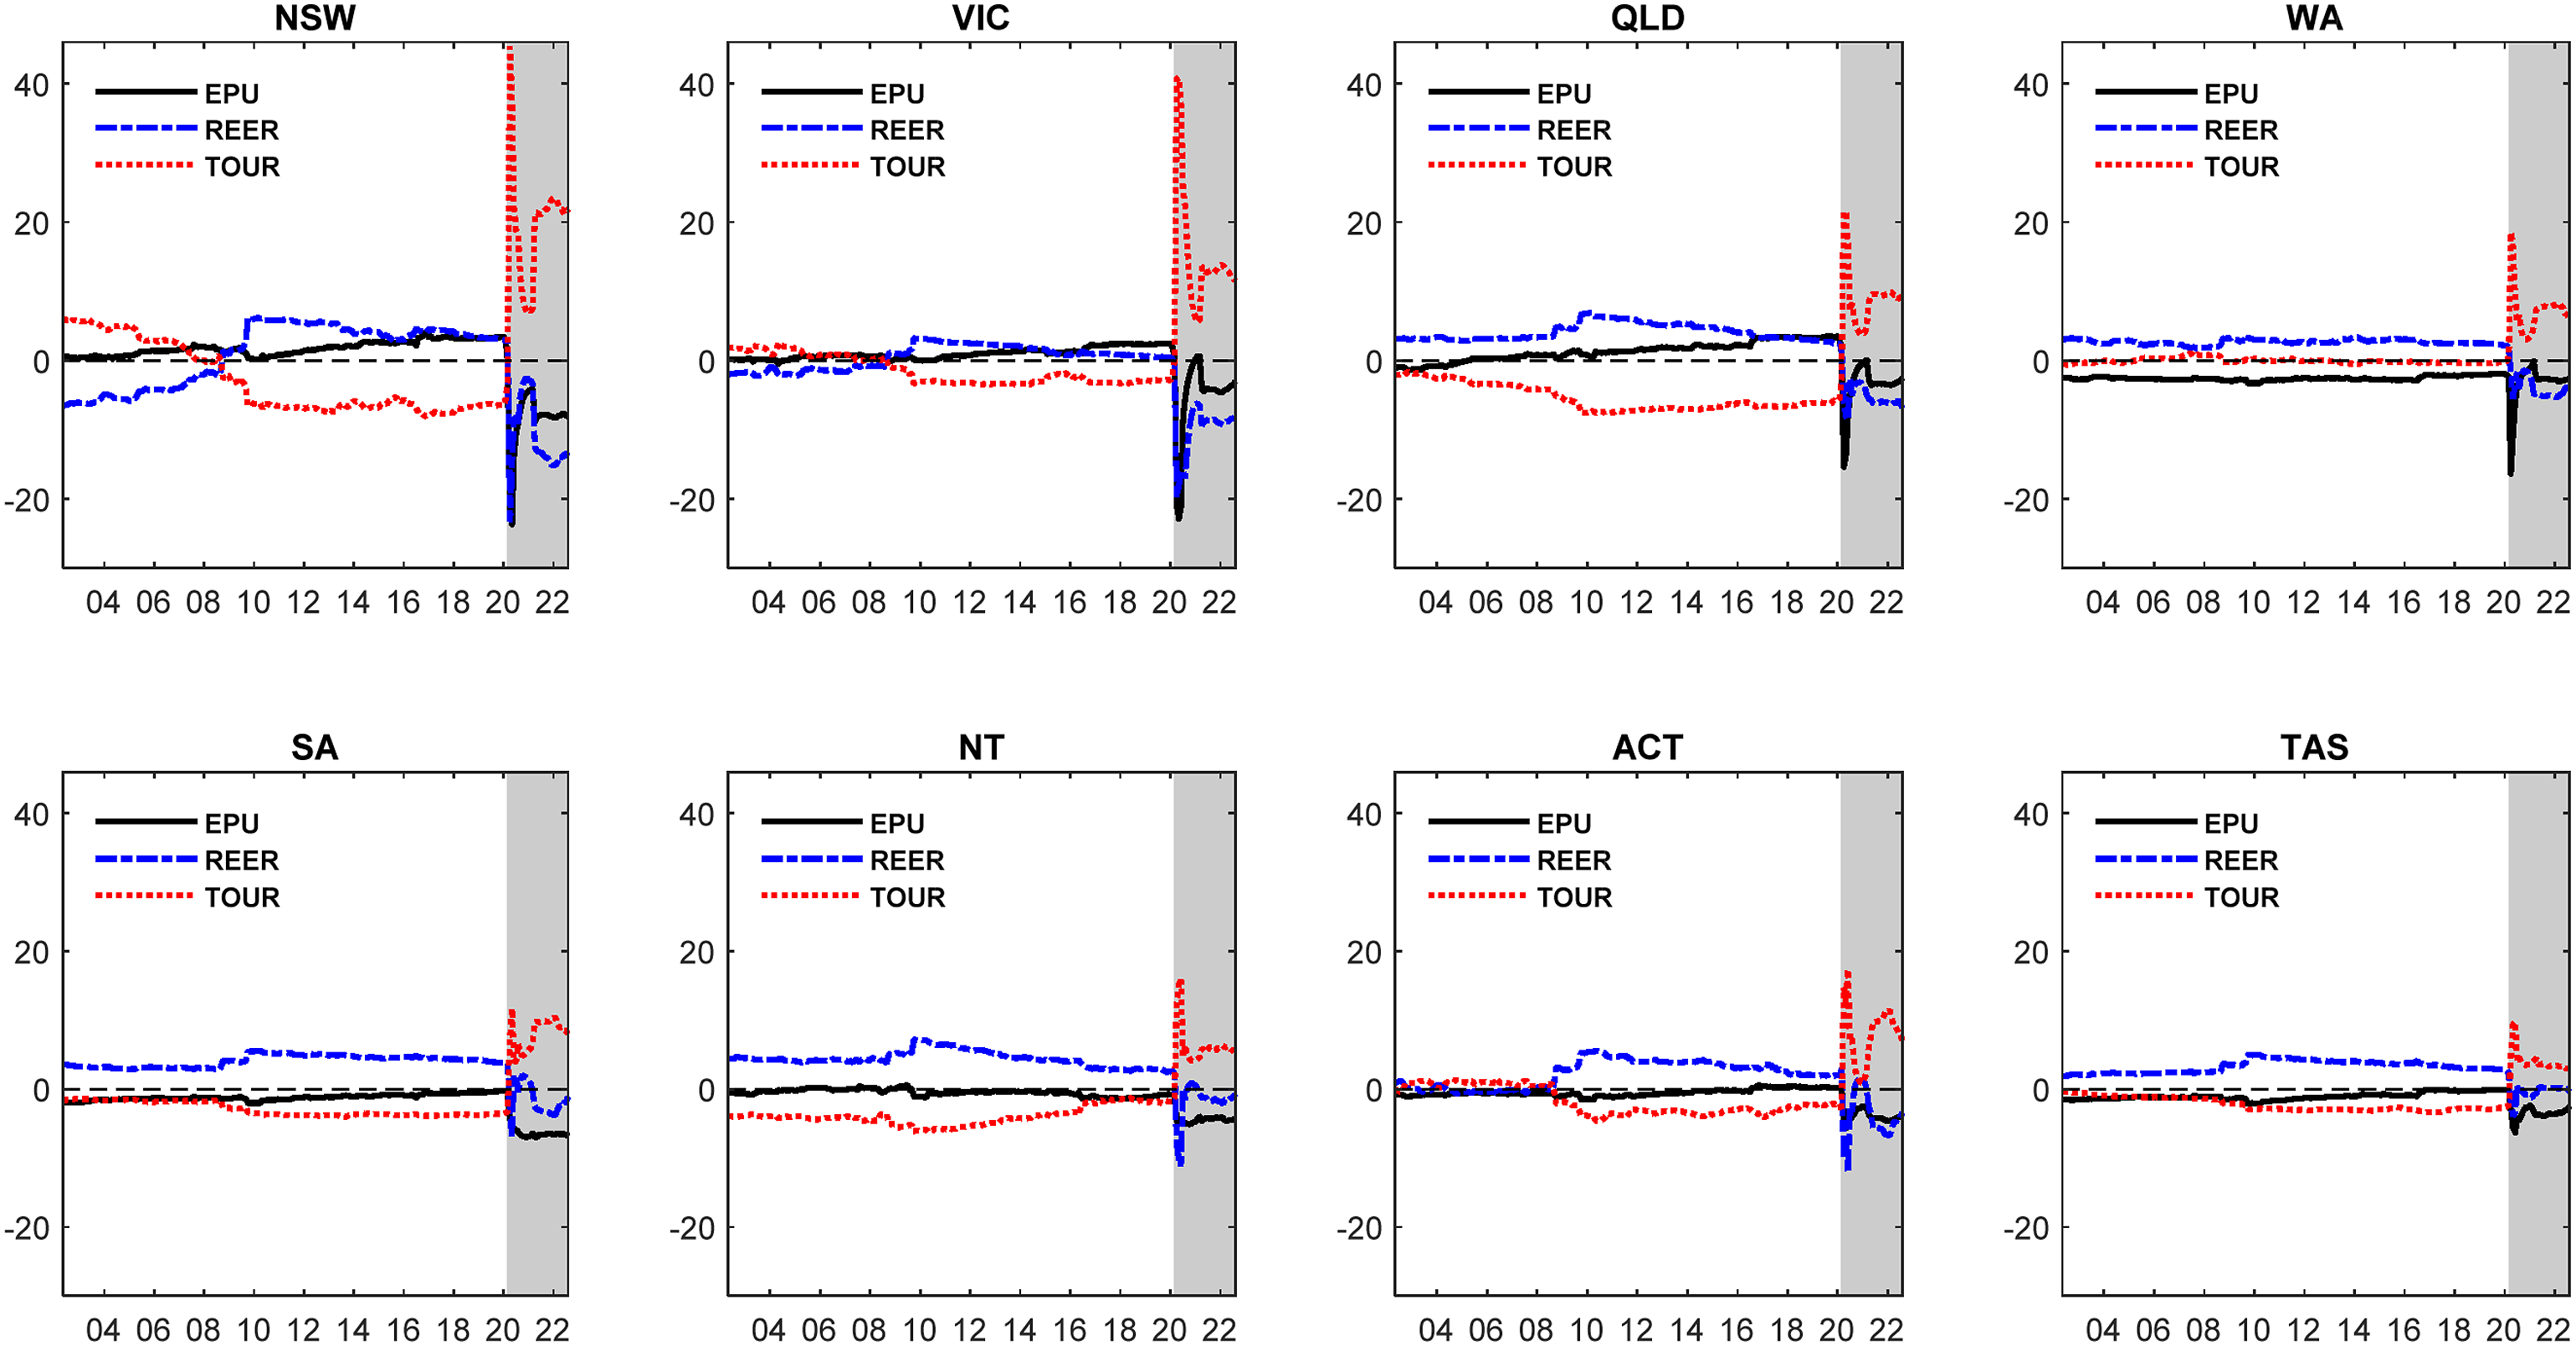
At the state/territory level, the pattern of risk transmission in the tri-variate TVP-VAR network exhibits clear disparities and structural breaks. Broadly speaking, before COVID-19, positive risk spillover indicators of EPU were frequently observed in NSW, VIC and QLD, negative indicators often appeared in WA, SA and TAS, and indicators in NT and ACT were close to zero. This reflects that EPU was frequently identified as a net risk transmitter driving the network in NSW, VIC and QLD before the pandemic, whereas it became a net risk receiver driven by the network in SA, WA and TAS. No clear evidence differentiated between its role as a net risk transmitter and a net risk receiver in NT and ACT. As for TOUR before COVID-19, its risk spillover indicators became negative after the year 2007–2008 in NSW, VIC and ACT, implying that TOUR changed from a net risk transmitter driving the network to a net risk receiver driven by the network. Negative indicators of TOUR before the pandemic in QLD, SA, NT and TAS supported its role as a net risk receiver, whereas they were quite close to zero in WA. Interestingly, after COVID-19, positive risk spillover indicators of TOUR and negative risk spillover indicators of EPU were observed in all states/territories, reflecting that risk mainly transmitted from TOUR to EPU and REER. To focus on the time-varying impact of EPU on TOUR, a detailed analysis of the risk spillover indicators of REER is not provided here but it can be found in Figure 4.
These findings confirm the presence of state/territory disparities in risk transmission patterns among EPU, REER and TOUR in the tri-variate TVP-VAR network. As observed, NSW and VIC experienced highest increases in their risk transmission indicators after the pandemic outbreak, followed by QLD, WA, NT, ACT and then SA and TAS. That is, inbound tourism in NSW and VIC displayed higher sensitivities to risks after the pandemic outbreak, requiring more attention from national tourism policymaking. For each state/territory, it is suggested that endeavor should be made to boost inbound tourism by allocating more economic resources to the tourism sector and formulating more supportive tourism policies, which helps to stabilize EPU and REER.
Results and discussions of the impulse responses
Apart from the aforementioned net risk transmission among variables, Figure 5
5
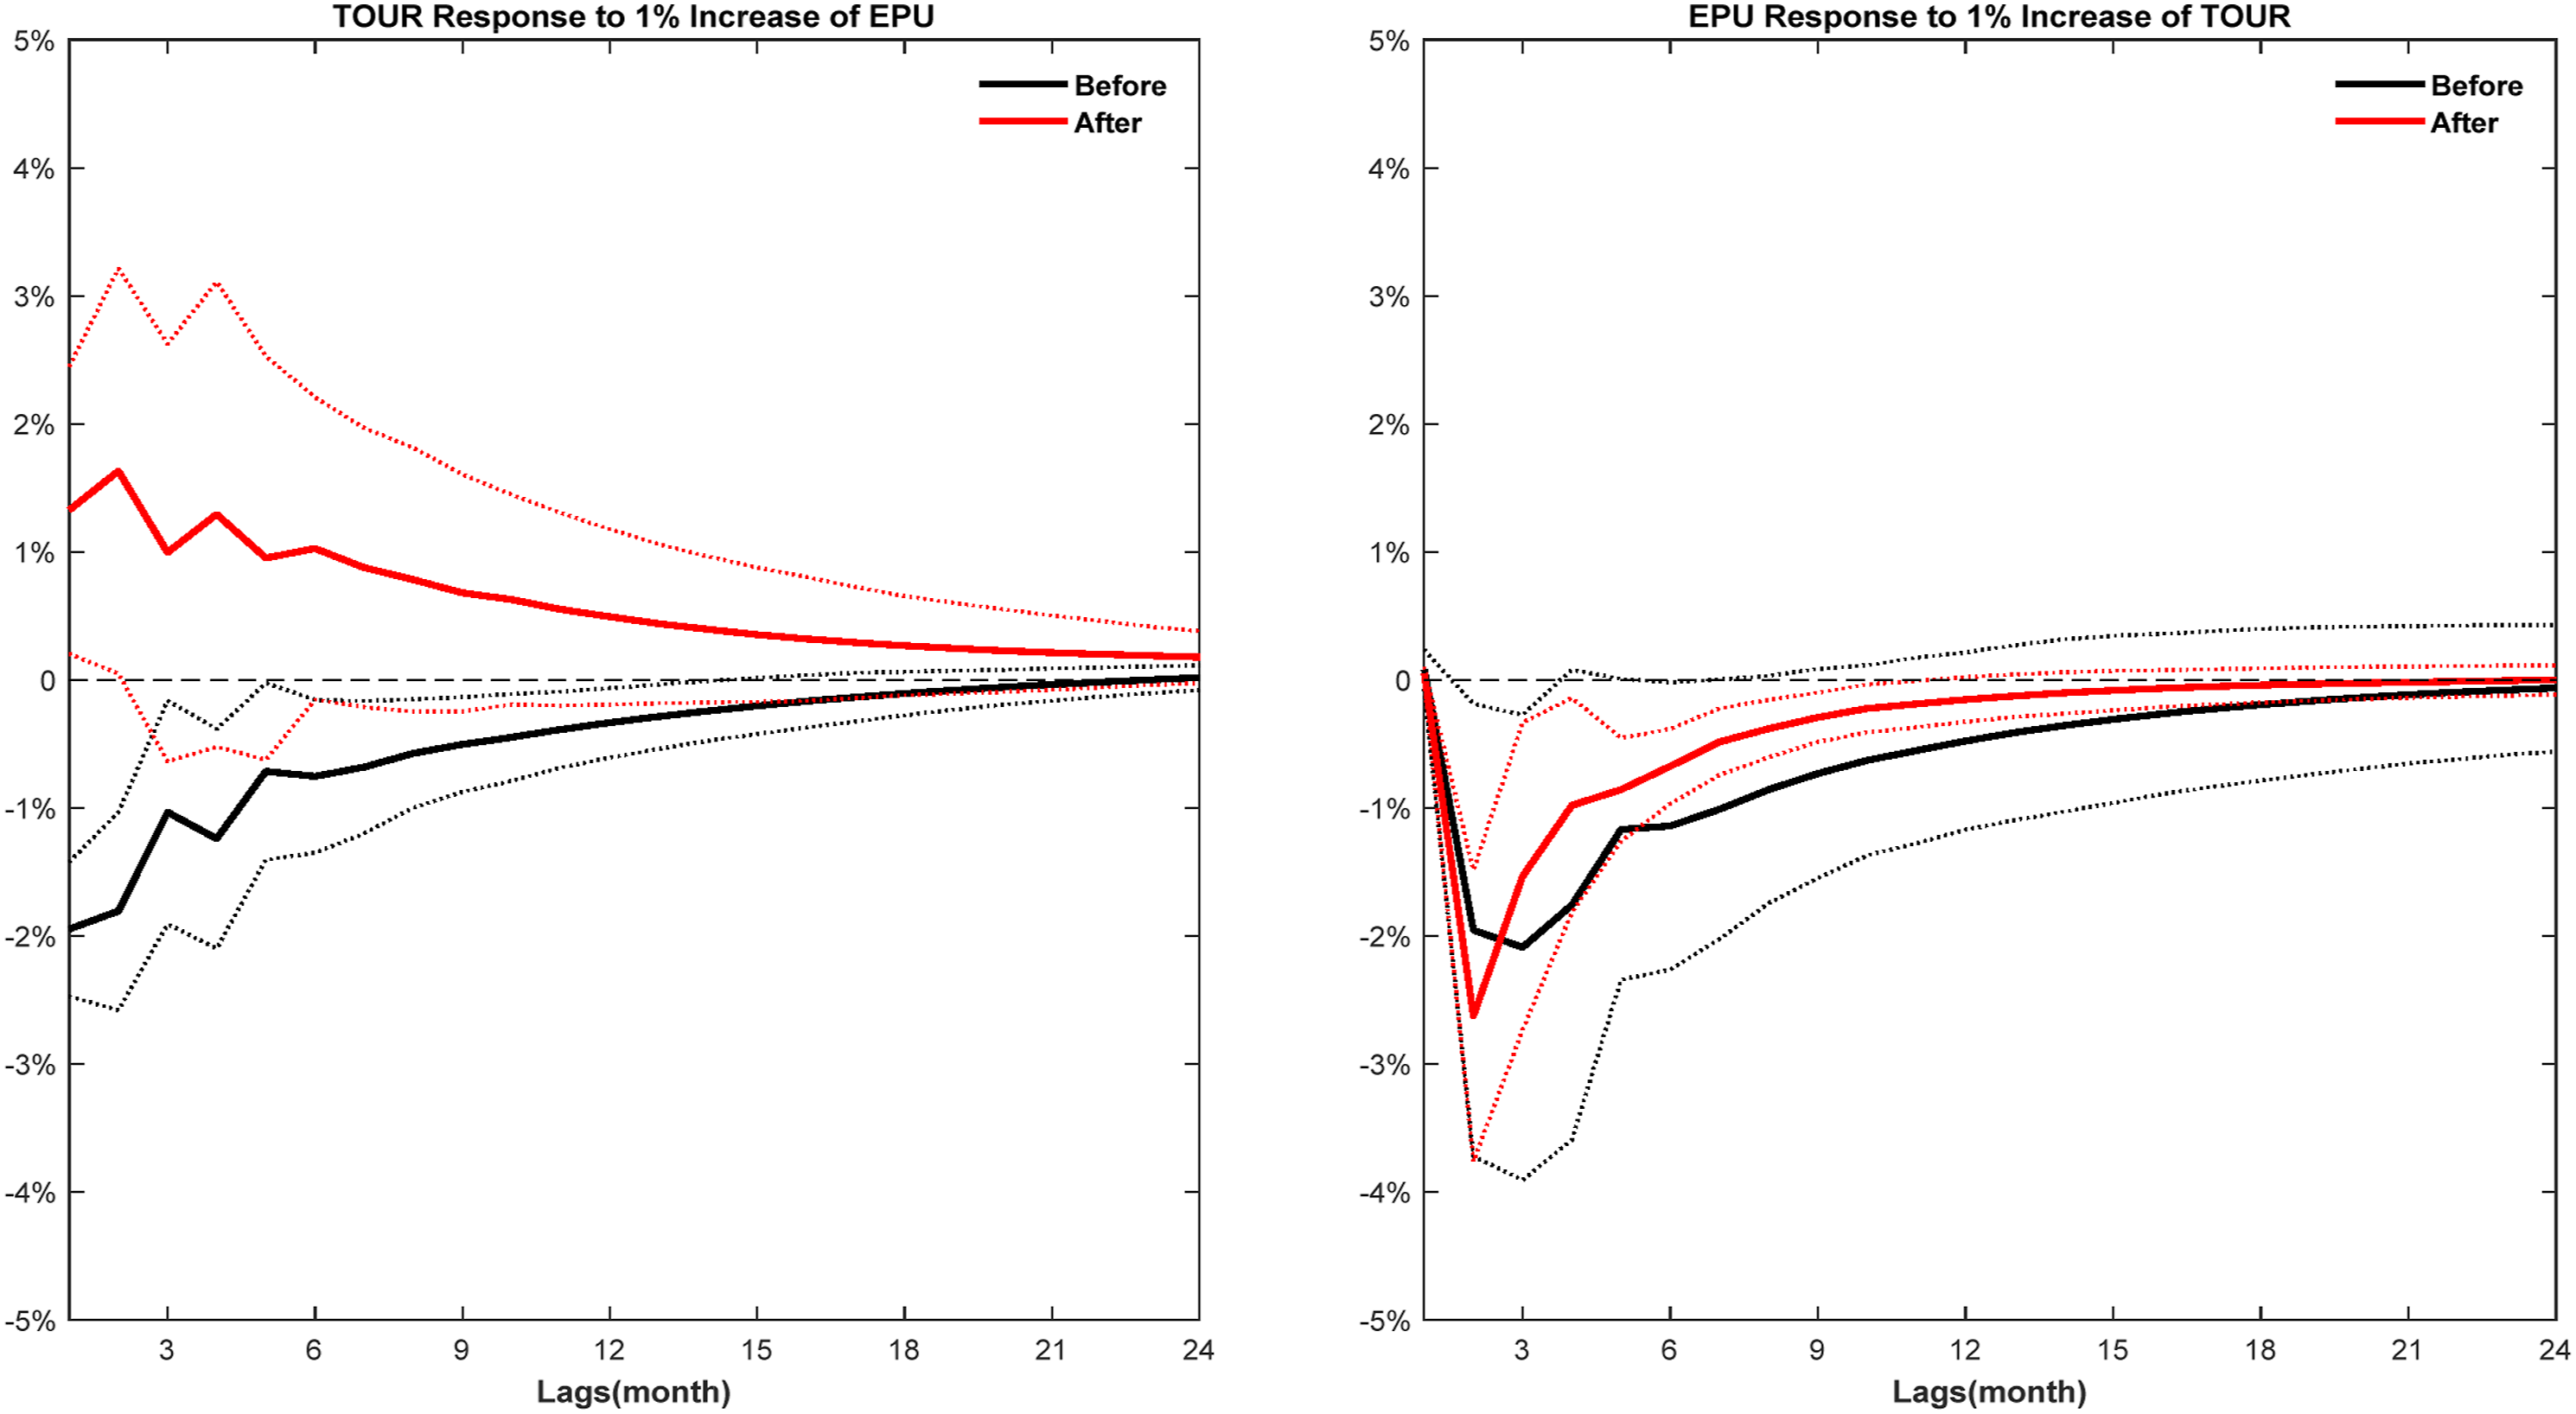
presents the impulse response of national TOUR (EPU) to a change in EPU (national TOUR) within 24-month lagged periods. To illustrate the time-varying interactions between EPU and national TOUR, January 2003 and March 2020 are used to represent the periods of before and after COVID-19, respectively. As shown in Figure 5, before COVID-19, a 1% increase in EPU caused an immediate 2.81% decrease in TOUR in the following month, and the impact gradually weakened within 9 months. However, TOUR had no significant response to a change in EPU after COVID-19. Regarding EPU’s response to a shock to TOUR before COVID-19, it is observed that a 1% increase in TOUR resulted in a 2-month lagged decrease of 1.92% in EPU, and the impact is persistently significant during the following 3–4 months. After COVID-19, a 2-month lagged decrease of 3.32% in EPU was caused by a 1% increase in TOUR, which became insignificant after 6–7 months. Impulse response functions of EPU and TOUR at the national level. Notes. The figure shows the impulse response functions between EPU and national TOUR with lags from 1 to 24 months. The black and red solid lines represent the impulse response before and after the COVID-19 pandemic, respectively. The dotted lines are the corresponding 95% confidence levels by bootstrapping.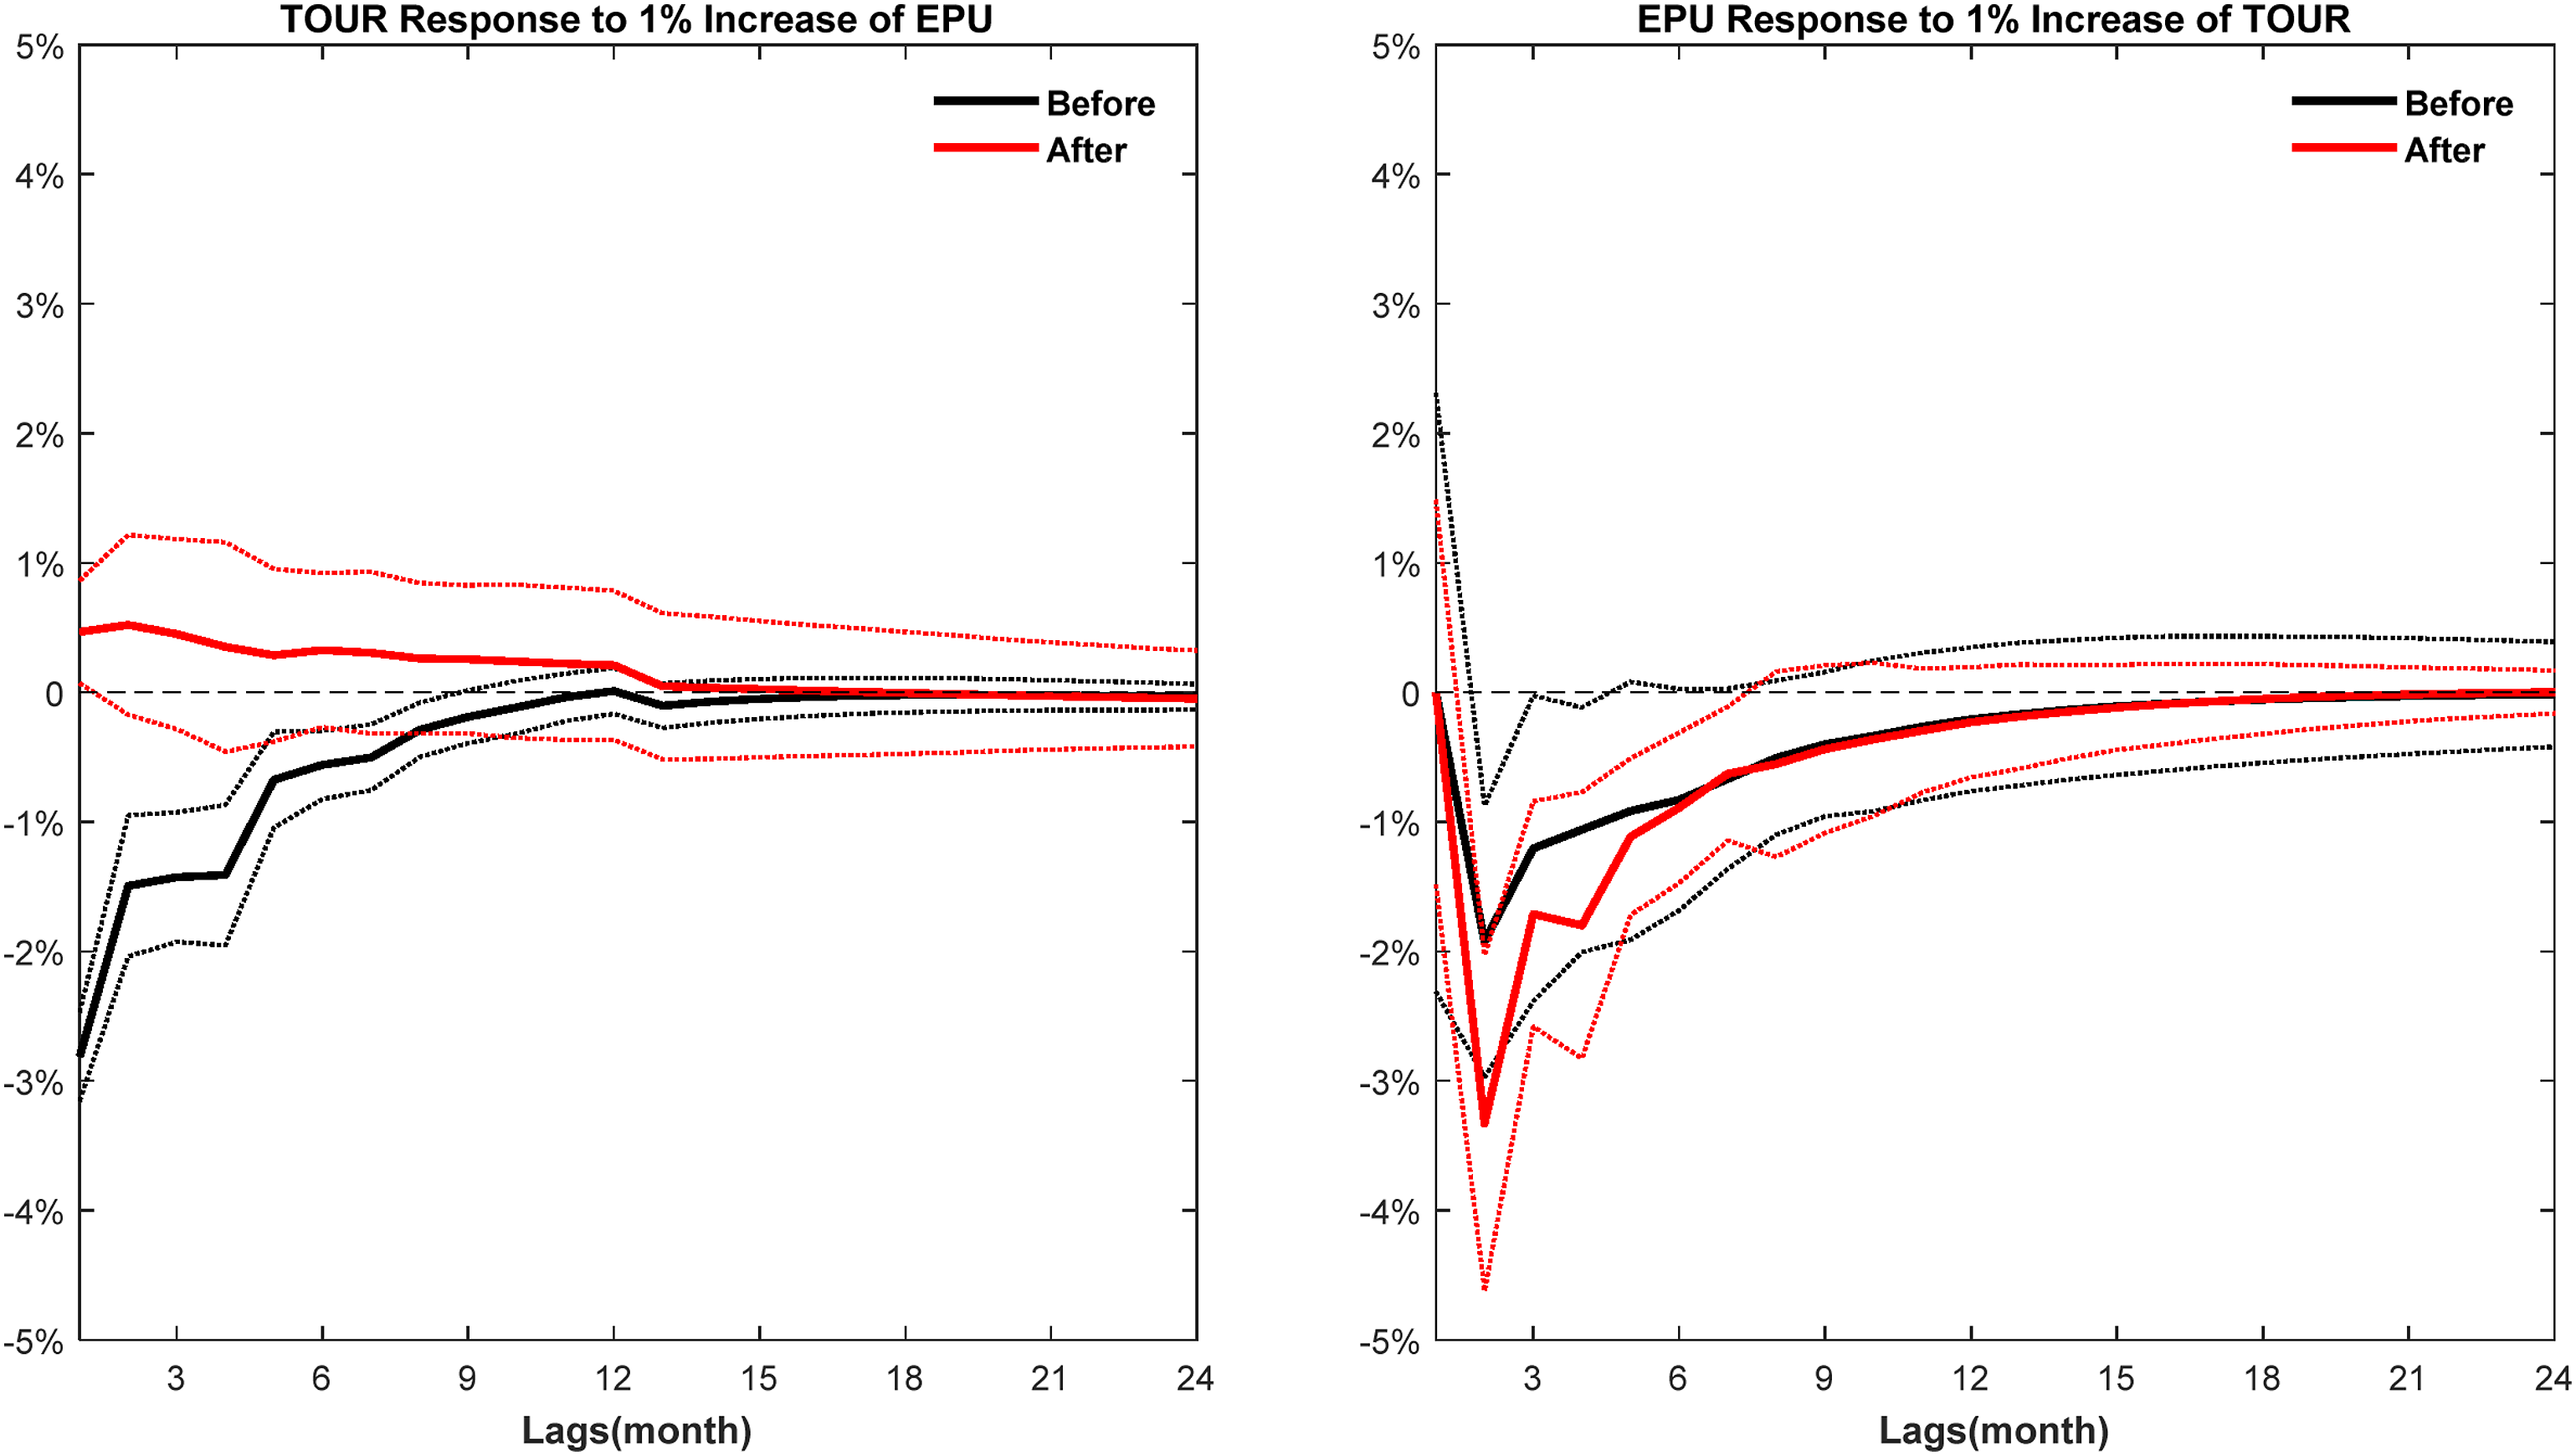
The above results indicate that national inbound tourism before COVID-19 was negatively affected by a positive EPU shock after controlling for exchange rates, but it became insensitive to an increase in EPU after COVID-19. On the other hand, EPU negatively responded to a positive shock to TOUR with a 2-month lagged impact in both periods. A stronger response with a long decaying period was observed after COVID-19.
At the state/territory level, it can be clearly seen from Figure 6 that TOUR responses differently to an increase in EPU in different states/territories. Before COVID-19, all states/territories experienced an immediate decline in TOUR in response to a 1% increase in EPU, and the impact gradually decayed. Moreover, the decline in NSW, VIC, QLD and WA was larger and longer than that in SA, ACT and TAS. After COVID-19, TOUR in all states/territories demonstrated an insignificant response to a change in EPU. On the other hand, state/territory disparities in responsiveness of EPU to TOUR also existed before COVID-19. As observed, a 1% increase in TOUR caused a significant and 2-month lagged decline in EPU in NSW, VIC, QLD and WA, whereas the impacts in SA, NT, ACT and TAS were insignificant. After COVID-19, the negative 2-month lagged responses of EPU to TOUR were stronger and longer in NSW, VIC, QLD and WA than that in SA, NT, ACT and TAS, demonstrating clear state/territory disparities. Overall, all states/territories witnessed a larger decline in EPU after COVID-19. A similar analysis can be conducted to examine how TOUR and REER interact before and after the pandemic, and the results are available on request. Impulse response functions of EPU and TOUR at the state/territory level. Notes. The figure shows the impulse response functions between EPU and state/territory TOUR with lags from 1 to 24 months. The black and red solid lines represent the impulse response before and after the COVID-19 pandemic, respectively. The dotted lines are the corresponding 95% confidence levels by bootstrapping.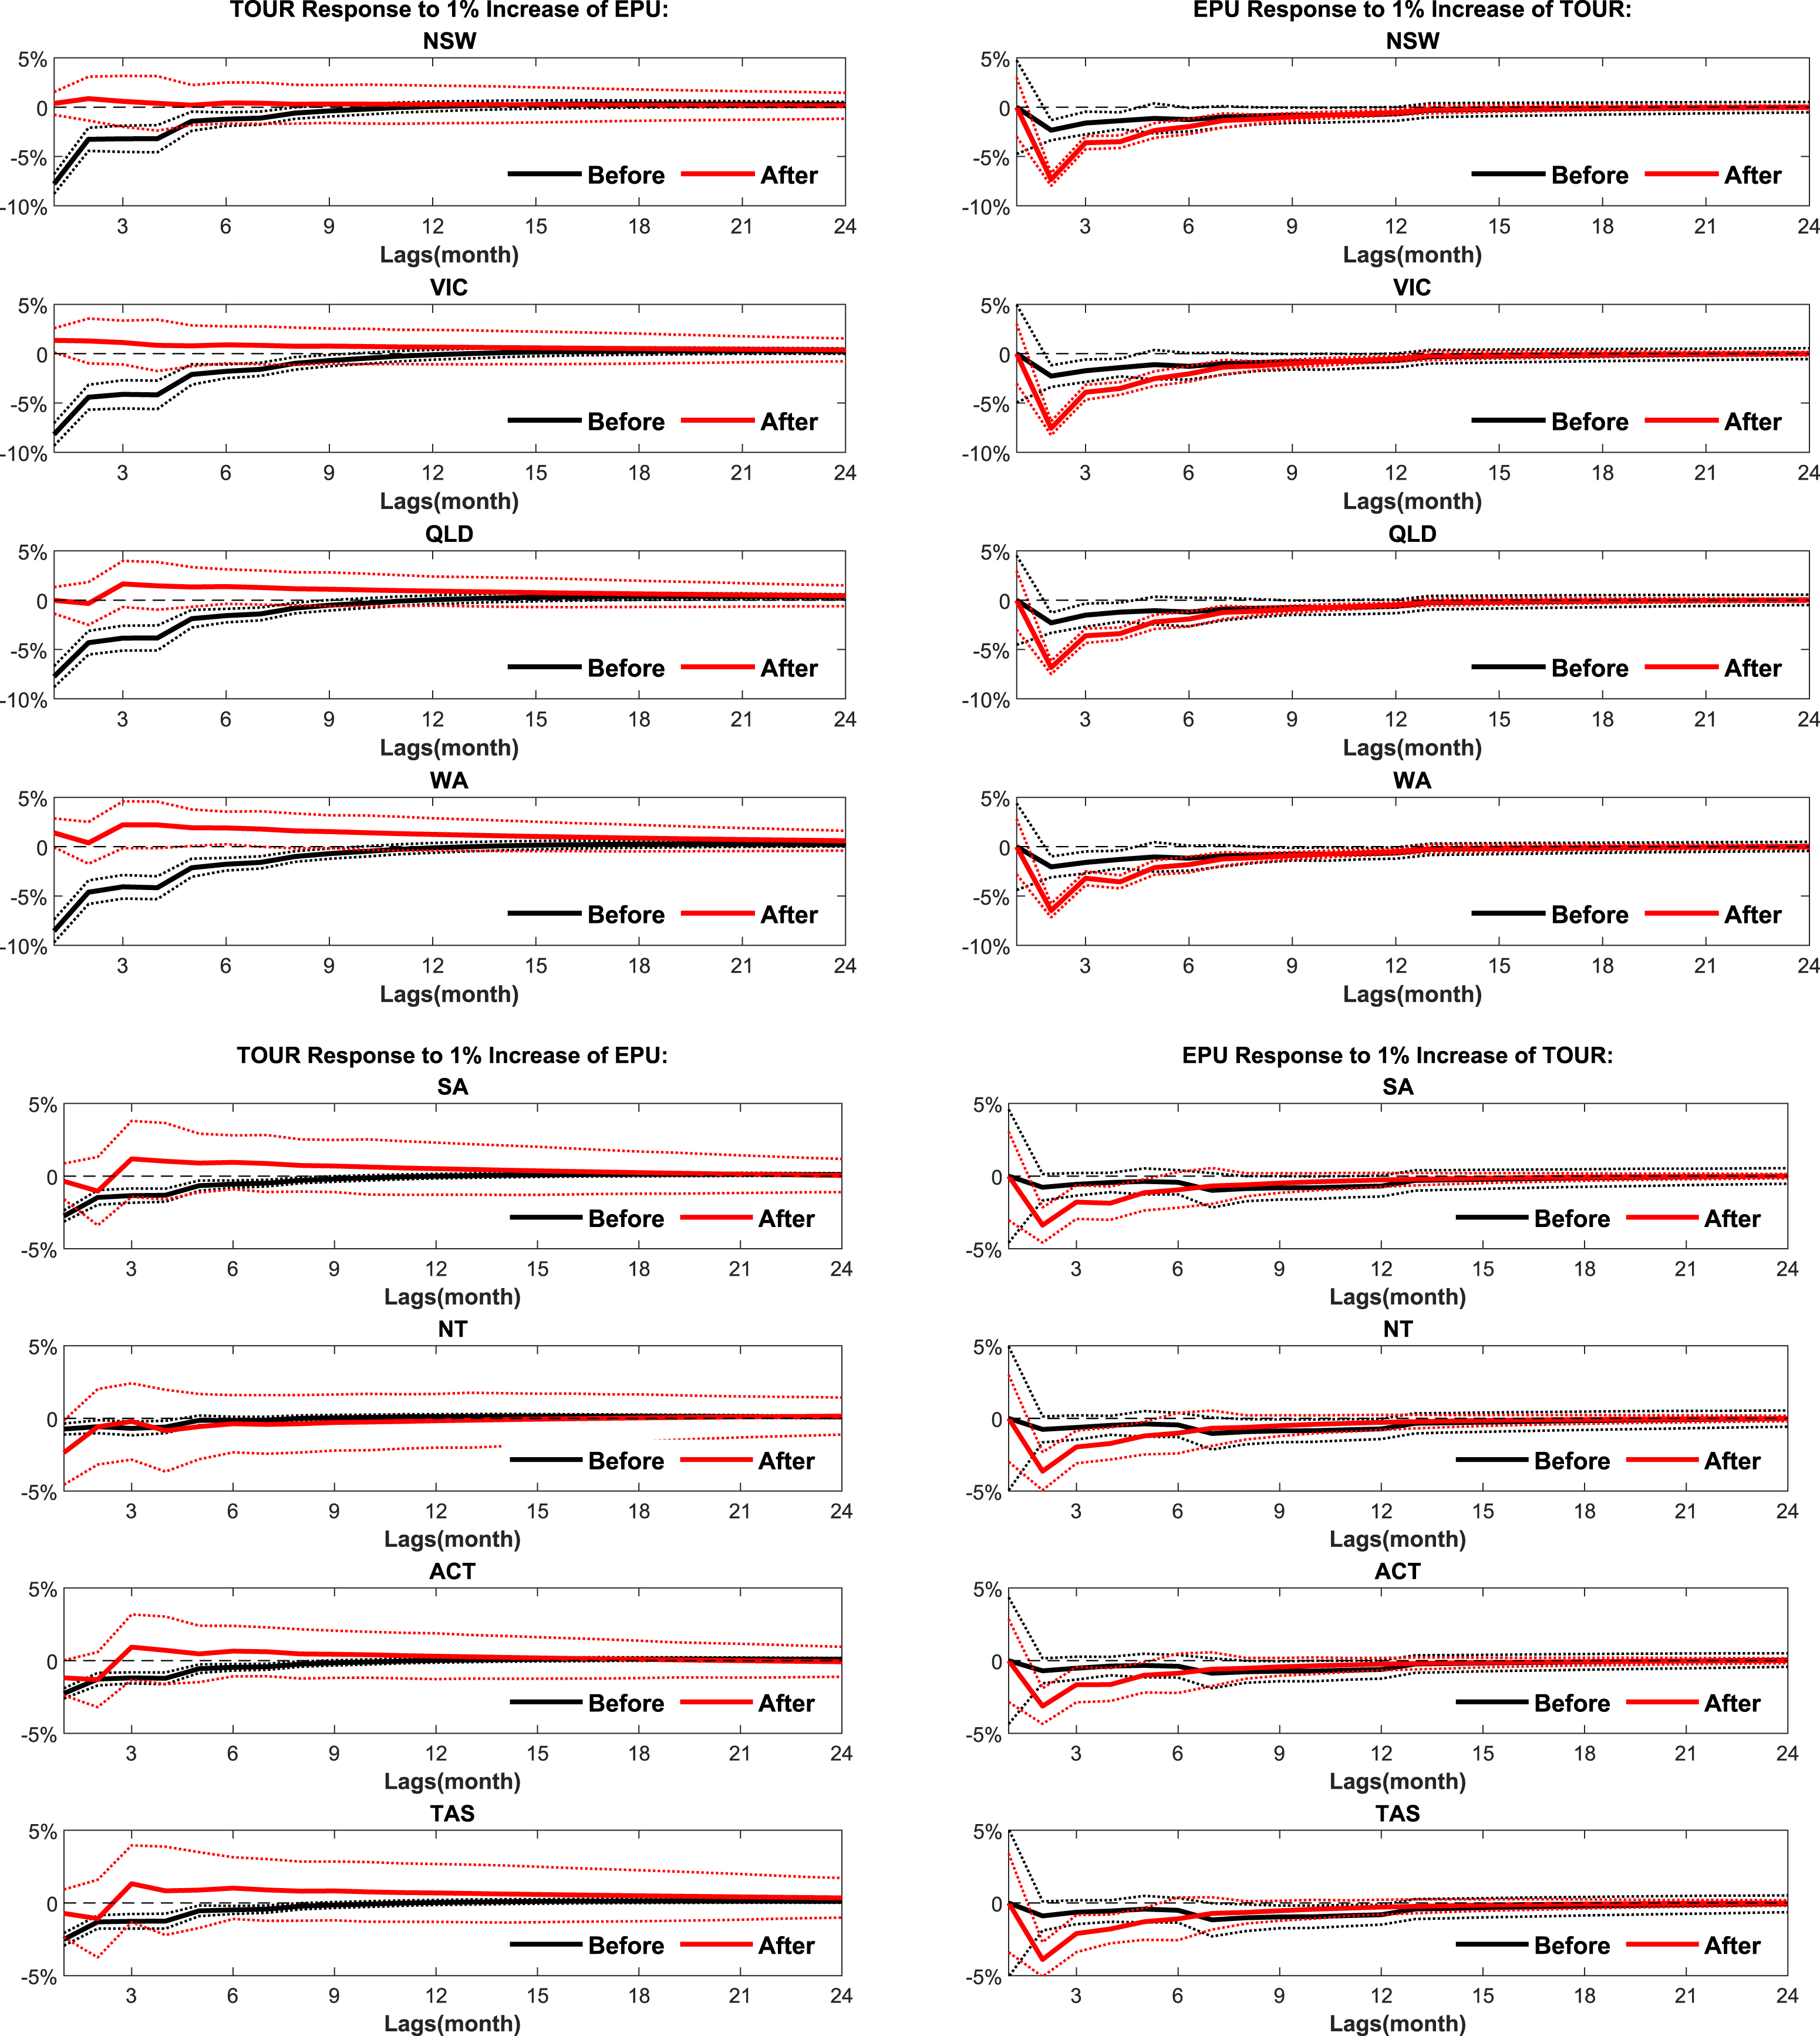
These findings provide us with the following implications: First, state/territory disparities in interactions between inbound tourism and EPU are confirmed in both periods of before and after COVID-19. Second, the observed declines in TOUR caused by an increase in EPU are stronger and longer in NSW, VIC, QLD and WA, indicating that inbound tourism in these states is more sensitive to EPU. This observation can be attributed to the substantial shares of these states’ tourism industries in Australia’s total tourism industry (STSA, 2022). In the year 2021-2022, the direct tourism output shares were 25.7% in NSW, 20.5% in VIC, 28.4% in QLD, and 11.4% in WA, while their tourism consumption shares were 26%, 21.1%, 27.6% and 11.6%, respectively. In comparison, the direct tourism output shares were 6.2% in SA, 3.5% in TAS, 2.4% in NT, and 1.9% in ACT, with corresponding tourism consumption shares of 6.4% in SA, 3.5% in TAS, 2.2% in NT, and 1.8% in ACT. Accordingly, an unstable economic environment could cause more severe disruptions in tourism-related industries (e.g., hospitality, accommodation, entertainment, and transportation) in NSW, VIC, QLD and WA, thereby bringing greater damage to the overall tourism industry. Moreover, an increase in EPU could significantly reduce investment in tourism infrastructure and services in NSW, VIC, QLD and WA, leading to negative perceptions among inbound tourists and further damaging the tourism industry as a whole. It is suggested that more tourism resources and supportive tourism policies should be directed to these states, especially when the economic environment is unstable. Third, the responsiveness of EPU to TOUR in NSW, VIC, QLD and WA implies that inbound tourism in these states plays a more important role in stabilizing economic environment. Efforts for promoting inbound tourism in these states can also help create a more stable environment for developing economies especially after the pandemic.
Robustness check
To examine the robustness of the main findings concerning the interactions between EPU and exchange rates, this study incorporates inbound tourists’ income as a control variable into the proposed TVP-VAR model. This variable is widely recognized as another crucial determinant of inbound tourism demand besides exchange rates. Moreover, the GDP of other countries can influence Australia’s inbound tourism, but the reverse is typically not true. It is noteworthy that the GDP of inbound tourists’ country of origin is commonly used as a proxy for their income (Song et al., 2023). However, data availability can be a challenge as world GDP figures excluding Australia are typically released annually. To balance data availability and proxy efficiency, this study focuses on Australia’s top 8 inbound tourist source markets, including New Zealand, the USA, the UK, mainland China and Hong Kong, India, Singapore, Japan, and South Korea. These markets collectively contributed to approximately 63.91% of total inbound tourist arrivals to Australia in 2023 (ABS, 2024). Given that these markets are major economies with quarterly GDP data available, this study calculates the GDP growth rate for each quarter over the period from January 1998 to August 2022. Subsequently, this growth rate is evenly distributed across each month within the respective quarter for further analysis.
Results of the Granger causality tests EPU -> TOUR: GDP as a control variable.
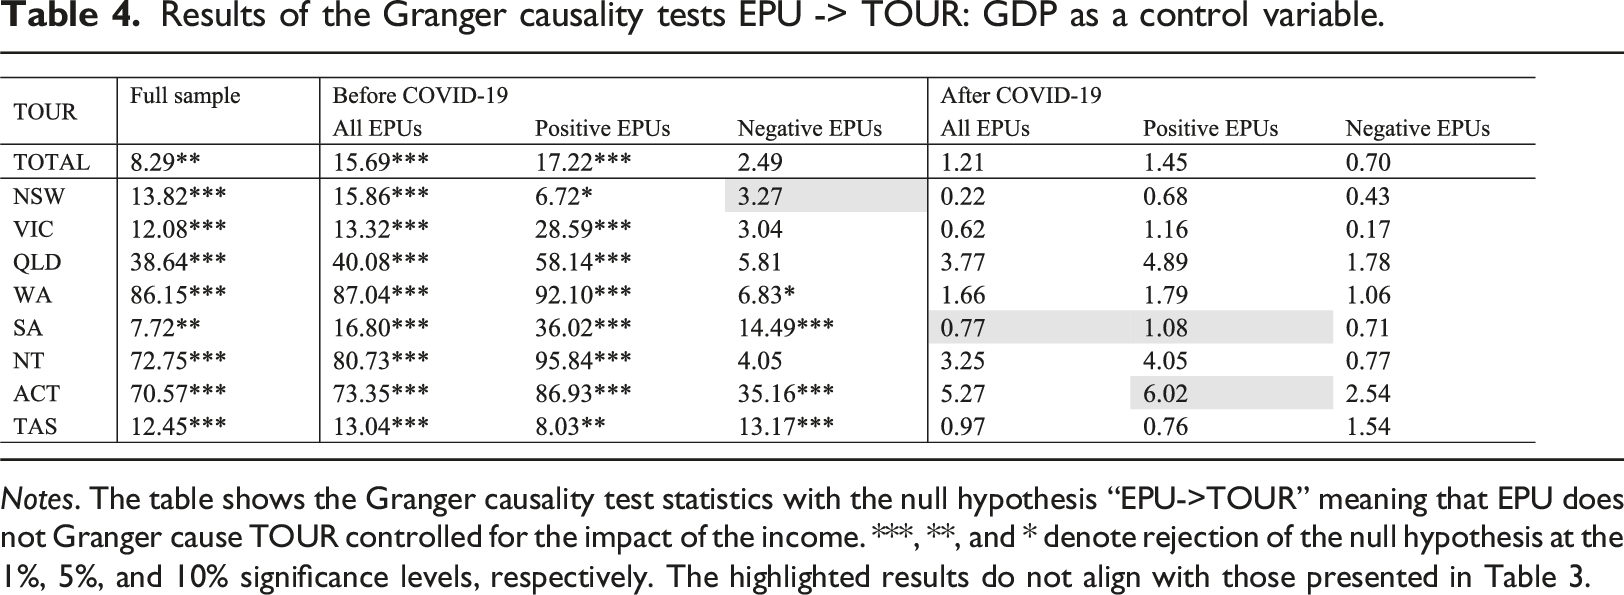
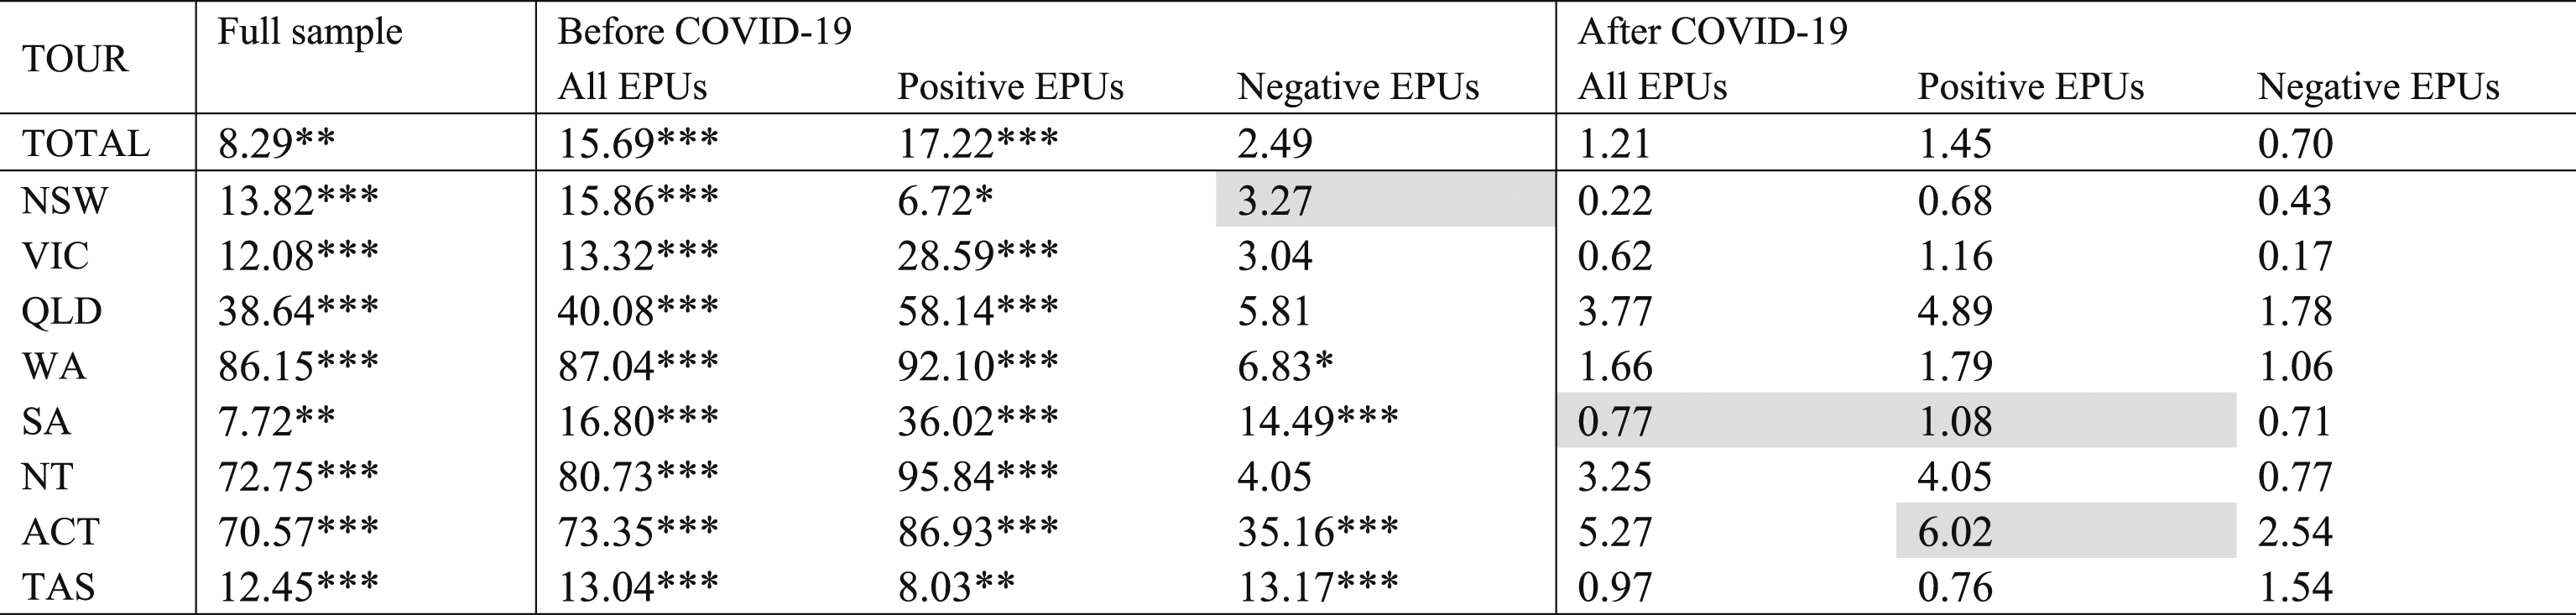
Notes. The table shows the Granger causality test statistics with the null hypothesis “EPU->TOUR” meaning that EPU does not Granger cause TOUR controlled for the impact of the income. ***, **, and * denote rejection of the null hypothesis at the 1%, 5%, and 10% significance levels, respectively. The highlighted results do not align with those presented in Table 3.
Risk spillover indicators for EPU, REER and TOUR at the national level: GDP as a control variable.
Impulse response functions of EPU and TOUR at the national level: GDP as the control variable. Notes. The figure shows the impulse response functions between EPU and national TOUR with lags from 1 to 24 months controlled for the impact of the income. The black and red solid lines represent the impulse response before and after the COVID-19 pandemic, respectively. The dotted lines are the corresponding 95% confidence levels by bootstrapping.
Conclusions
Using a TVP-VAR model, this study conducts a disaggregated analysis of how inbound tourism responds to EPU in Australia after controlling for exchange rates. The main findings are as follows: First, it is confirmed that the total inbound tourist arrivals to Australia demonstrated clear seasonality and potential structural breaks, supporting the appropriateness of a TVP-VAR model with a mixture innovation distribution. Second, it is found that the COVID-19 has caused a structural break in the causal relationship between EPU and TOUR, while asymmetry is only detected in cases of TOTAL, VIC, QLD, NT before COVID-19, and SA and ACT after COVID-19, demonstrating state/territory disparities. Third, the national TOUR changed from a net risk transmitter to a net risk receiver after the year 2007–2008, which became positive with high volatility after COVID-19. Meanwhile, it is documented that a positive EPU shock negatively affected national inbound tourism before COVID-19 after controlling for exchange rates, but it became insensitive to an increase in EPU after COVID-19. Finally, empirical evidence supports that clear state/territory disparities and structural breaks exhibit for risk transmission patterns and for responses of inbound tourism to EPU. Particularly, we find that inbound tourism in NSW, VIC, QLD and WA is more sensitive to EPU.
These findings not only advance our knowledge about the relationship between EPU and inbound tourism demand from disaggregated and dynamic perspectives, but also offer valuable empirical insights for national and state/territory tourism policymaking in Australia with consideration of significant breaks caused by the COVID-19 pandemic. Furthermore, the break point tests utilized in this study can serve as a valuable reference for other destinations to identify structural shifts in inbound tourism resulting from both the pandemic and other random shocks such as natural disasters, terrorism incidents, economic crises, transportation disruptions, and geopolitical conflicts. The proposed TVP-VAR model can be flexibly generalized to include additional control variables, such as tourists’ income and relative prices, enabling the isolation of the dynamic impacts of exchange rates and EPU on inbound tourism more comprehensively. The risk spillover indicators and impulse response functions constructed in this study can also be used as benchmark risk assessment tools for other destinations, providing a visual representation of how risks transmit between EPU and inbound tourism after controlling exchange rates over time. These insights enhance the ability of worldwide tourism policymakers and industry stakeholders to anticipate and respond effectively to the complex dynamics of inbound tourism within an ever-changing EPU landscape.
Despite these advantages, this study can still be extended in different ways. For example, if monthly data on international tourism consumption in Australia is available, it can be used as an alternative measurement of inbound tourism demand to re-examine how inbound tourism responds to EPU at the state/territory level. Another way is to assess the efficiency and effectiveness of different national and state/territory tourism policies implemented after the pandemic by quantifying their economic and employment consequences.
Supplemental Material
Supplemental material - Unveiling the mystery of the responsiveness of inbound tourism to economic policy uncertainty: New evidence from Australia
Supplemental material for Unveiling the mystery of the responsiveness of inbound tourism to economic policy uncertainty: New evidence from Australia by Yuting Gong, Chia-Hsun Chang, Paul Tae-Woo Lee, Jingbo Yin and Wenming Shi in Tourism Economics.
Footnotes
Declaration of conflicting interests
The author(s) declared no potential conflicts of interest with respect to the research, authorship, and/or publication of this article.
Funding
The author(s) disclosed receipt of the following financial support for the research, authorship, and/or publication of this article: This work was supported by the National Natural Science Foundation of China through grant number 71971133 (Yuting Gong).
Supplemental Material
Supplemental material for this article is available online.
Notes
Author biographies
References
Supplementary Material
Please find the following supplemental material available below.
For Open Access articles published under a Creative Commons License, all supplemental material carries the same license as the article it is associated with.
For non-Open Access articles published, all supplemental material carries a non-exclusive license, and permission requests for re-use of supplemental material or any part of supplemental material shall be sent directly to the copyright owner as specified in the copyright notice associated with the article.