
Abstract
This study examines the relationship between revenue and profit drivers and long-term financial performance in the hotel industry based on 17-years data (2004–2020) of six US hotel chains. The analysis creates, tests, and analyzes a cross-level model that examines the complex endogenous relationships, underlying long-term financial performance of hotels. Specifically, we examine the interaction of room price (ADR) and customer satisfaction (ACSI) within a sales-volume-driver framework that impacts financial performance through profitability, measured at both the operating and accounting levels. This study seeks to advance our understanding of these relationships, their characteristics, and their implications for long-term financial performance in the hotel industry. The findings reveal that customer satisfaction is more important than price in achieving long-term financial success in the hotel industry, whereas room nights sold is significant positive driver of all performance levels.
Keywords
Introduction
Long-term profitability in the hotel industry is complex and requires consideration and management of numerous variables. Hoteliers aim to maximize profits by covering costs, adding margins, and increasing sales volumes but face challenges due to unstable demand, high fixed costs, and product perishability. Modern pricing tools utilize complex digital decision-support systems powered by artificial intelligence. However, hoteliers must also consider customer metrics that are often difficult to observe or measure. The lack of relevant customer information in control systems further complicates decision making (Andersson and Carlbäck, 2009; Assaf and Magnini, 2012; Ittner and Larcker, 1998; McManus, 2013). Ultimately, it is uncertain whether having happier customers will truly increase profitability (McManus and Guilding, 2008; Sun and Kim, 2013), or whether providing basic accommodations and focusing on short-term performance, possibly at lower prices, may be more profitable (Croes and Semrad, 2012; Kimes and Renaghan, 2011; O’Neill and Mattila, 2006).
The relationship between customer-level behavioral outcomes and firm-level financial outcomes has been a topic of interest for many years (e.g., Shields and Shields, 2005; Mittal et al., 2023). Over time, evidence supporting the correlation between behavioral and financial outcomes has become anecdotal. Therefore, the focus has shifted towards understanding how behavioral outcomes interact with other economic variables to influence profitability from various perspectives. Without this understanding, decision-making is incomplete, leading to asymmetric outcomes and hindering the integration of insights into information systems (Ahmad et al., 2021; Assaf and Magnini, 2012; Banker and Johnston, 2007; Ingenbleek, 2014; Shields and Shields, 2005; Smith and Wright, 2004).
Revenue and profit drivers, a small but crucial research stream in managerial accounting, provides a valuable framework for analyzing how customer- and product-level variables interact to affect financial performance (Banker and Johnston, 2007; Shields and Shields, 2005). Although accounting, economics, and marketing studies have identified several drivers of interest in financial performance, many studies have focused on single-level models. 1 For example, the marketing literature primarily examines customer-level drivers, the accounting literature views production and sales volume drivers from a costing perspective, and the economics and accounting literature examines the effects of the price-marginal cost margin on profitability. Consequently, a fragmentary body of knowledge and contradictory theoretical contributions have resulted in disparate definitions of variables and insufficient data, complicating possible generalizations and further development.
The lack of systemized information complicates and hinders the integration of customer-level metrics into information systems. Traditional pricing and management control techniques often ignore important factors such as customer satisfaction and motivational aspects, leading to suboptimal decisions in pricing and resource allocation. Knowing the value of products to customers can help firms manage their price-demand process more profitably (Ingenbleek, 2014; Smith, 2021; Van der Rest and Roper, 2013). By exploring the interplay between pricing elements such as price, sales volume, and customer satisfaction, this study enhances our understanding of potential firm-level financial outcomes. There is a growing demand for cross-level models that incorporate customer value, profitability, return on investment, and shareholder value, necessitating further modelling and empirical research (e.g., Banker and Johnston, 2007; Shields and Shields, 2005).
In response to this call, this study analyzes three potential revenue and profit drivers from a long-term stock market perspective in the hotel industry. In doing so, we create, test, and analyze a cross-level model that examines complex endogenous relationships, underlying hotels’ long-term financial performance. Specifically, we examine the interaction of room price and customer satisfaction within a sales-volume-driver framework that impacts financial performance through profitability, measured at both the operating and accounting levels. This study seeks to advance our understanding of these relationships, their characteristics, and their implications for long-term financial performance in the hotel industry. The analysis is based on financial and operating data from six publicly traded US-based hotel corporations over a 17-years period between 2004 and 2020. Among other findings and implications, we report the type of relation, sign, additivity, directness, and timing of the significant effects for all performance drivers using the framework proposed by Shields and Shields (2005).
Literature review
Given the lack of empirical evidence and few contributions to the call for research on revenue and profit drivers, first raised by Shields and Shields (2005) and Banker and Johnston (2007), this study aims to examine the fundamental profitability drivers, such as sales volume, price, and customer satisfaction, in the context of long-term performance. Shields and Shields (2005) and Banker and Johnston (2007) note that all three performance drivers have been used as independent variables in quantitative research, mainly in single-level models. However, single levels of analysis, such as products, customers, organizations, and industries, can limit understanding in a variety of ways (also, Luft and Shields, 2003).
Shields and Shields (2005) called for bottom-up cross-level models to investigate the effects of customer- and product-level variables on firm-level performance. Congruently, Banker and Johnston (2007) call for accounting and economics models that incorporate variables capturing customer value as well as the complex interrelationships between revenues, costs, and asset values that determine profitability and shareholder value. They also emphasize the need to account for endogeneity and simultaneity in the models and draw more fully and tightly upon economic, strategic management, and behavioral theories.
This study explores the impact of sales volume, price, and customer satisfaction on financial performance at various levels. We analyze the relationship between room-nights sold, operating and accounting profitability, and capital market performance, drawing on insights from marketing, accounting, and economics literature. We develop, test, and analyze a cross-level bottom-down model to better understand the complex and endogenous relationships underlying hotels’ financial performance. As noted by Shields and Shields (2005) and Luft and Shields (2003), valid cross-level models require an interaction involving multiple independent variables, including moderators at the dependent variable level, to reflect the possible direct and indirect effects of drivers on performance. Cross-level effects may be partially or fully mediated by intervening variables (Shields and Shields, 2005).
This section reviews multiple cross-level relationships, based on existing practices and research, to develop the main and secondary hypotheses of this study. The hypotheses are summarized at the end of this section on the moderated mediation model.
Sales volume drivers and financial performance
According to microeconomic theories, such as Producer Theory and its profit maximization focus, classical managerial accounting defines a revenue driver as “a variable, such as volume, that causally affects revenues” (Horngren et al., 2012: 68). In marketing research, revenue is often operationalized and measured as sales volume, which is a product of unit sales price and sales quantity (Shields and Shields, 2005). To achieve profit maximization, the lodging industry widely applies revenue management, which is grounded in the Price Theory of microeconomics, postulating that market forces of supply and demand determine the logical price point for a particular good or service at any given time (e.g., Landsburg, 2013).
In practice, hotel managers have two typical levers of revenue and profit enhancement: (1) price, to manage demand, and (2) capacity utilization, expressed in occupancy rates 2 (Kimes and Renaghan, 2011). Thus, on the operating level, the number of room-nights sold and the price for each room-night can be defined as two main sales volume drivers. As hotel industry is characterized by high fixed costs and perishable inventory, an increase in sales is expected to drive profit.
The current scientific debate, mainly in the revenue and pricing management literature, is represented by two opposing views on the profitability effects of room rate discounting as a tool for demand stimulation. The first view suggests that discounting does not work in the lodging industry (e.g., Enz et al., 2016; Poldrugovac et al., 2019; Singh et al., 2014), whereas the second advocates for short-term discounting make sense under certain conditions (Croes and Semrad, 2012; Demydyuk et al., 2015; O’Neill and Mattila, 2006).
In the hypotheses formulation, we first follow the logic that lower prices drive room demand, which has more potential to cover fixed costs and contribute to profitability than higher room rates. Thus, O’Neill and Mattila (2006) found that from a 2-year sample of 1954 hotels, those with higher occupancy achieve greater efficiency, allowing them to be more profitable. The authors emphasize that occupancy is a larger profit contributor than ADR, 3 particularly under recessionary conditions, which also holds true in the restaurant sector (Demydyuk et al., 2015). Croes and Semrad (2012) provide a more rigorous statistical assessment than the use of average room rates, as the effect of discounting on financial performance may quickly dilute the data. The authors recommend moderate discounting for periods of seasonal demand shocks to correct the demand disequilibrium. Thus, we hypothesize as follows:
Higher number of room-nights sold is expected to have a direct positive effect on short-term profitability, both operating and accounting.
Higher number of room-nights sold is expected to have a direct positive effect on long-term performance. Contrary to O’Neill and Mattila (2006), Singh et al. (2014) provide empirical evidence that during the great recession of 2007-2009, room price, rather than occupancy, appears to be a stronger predictor and better measure of accounting profitability. Enz et al. (2016), based on a 10-years sample of 4000 different hotels, also show that, regardless of macroeconomic conditions, hotels with higher ADR benefited from higher relative RevPAR
4
despite lower comparative occupancies. This relationship has also been confirmed in the camping industry (Poldrugovac et al., 2019). Therefore, we formulated the second alternative hypothesis as follows:
Higher room price is expected to have a direct positive effect on profitability, both operating and accounting.
Higher room price is expected to have a direct positive effect on long-term performance. Van der Rest and Harris (2008) argue that pricing effects in hotels are influenced by individual demand patterns and cost structures, particularly the contribution margin. Thus, lowering prices necessitates greater demand elasticity to protect profitability, and the concern surrounding discounts is their potential adverse impact on a hotel’s financial performance. Both Price Theory and the concept of customer value are economic theories that suggest that the market determines the price of a service at any given time. However, customer value can also be viewed as the difference between a customer’s willingness-to-pay and the market price, which is known as consumer surplus (Banker and Johnston, 2007; Banker and Mashruwala, 2007; Gupta and Zeithaml, 2006; Smith and Wright, 2004; Syverson, 2019). Research on revenue and profit drivers is dominated by customer-associated metrics as independent variables. Examples from the hotel industry include customer satisfaction and the level of complaints versus changes in revenue and operating profit (Banker et al., 2000; Srinivasan et al., 2005); customer and employee satisfaction, and customer mix versus property financial performance (Kim et al., 2013). Therefore, we hypothesize as follows:
There is a direct positive effect of customer satisfaction on short-term profitability, both operating and accounting. The American Customer Satisfaction Index (ACSI) is widely used in academic research as a predictor of the financial and stock performance of publicly traded companies because of its availability for large companies (Aksoy et al., 2008; Fornell et al., 2006; Ittner and Larcker, 1998; Ittner et al., 2009). Previous studies have shown that firms with good ACSI outperform the market with low systematic risk, and that the market quickly responds to the release of information on large increases in satisfaction (Fornell et al., 2006; Aksoy et al., 2008; Ittner et al., 2009). However, the predictive power of ACSI for long-term returns remains uncertain (Ittner et al., 2009). To test this relationship, we hypothesized the following:
There is a direct positive effect of customer satisfaction on long-term financial performance. While customer satisfaction is considered important, the impact of the American Customer Satisfaction Index (ACSI) on performance in various industries, such as service and manufacturing, remains inconclusive (Anderson et al., 1997; Anderson et al., 2004). Owing to the nature of ACSI, most analyses using ACSI are based on big datasets across industries, with limited research on the hospitality industry. Sun and Kim (2013) find a positive relationship between ACSI and a firm’s profitability and market value-added in hospitality and tourism, but not with Tobin's q as a proxy for stock market performance. Empirical research linking ACSI to financial and stock performance in hospitality, particularly the lodging industry, is lacking. The hypotheses discussed above regarding direct relationships are summarized in Figure 1. This will be integrated into a more complex model further.
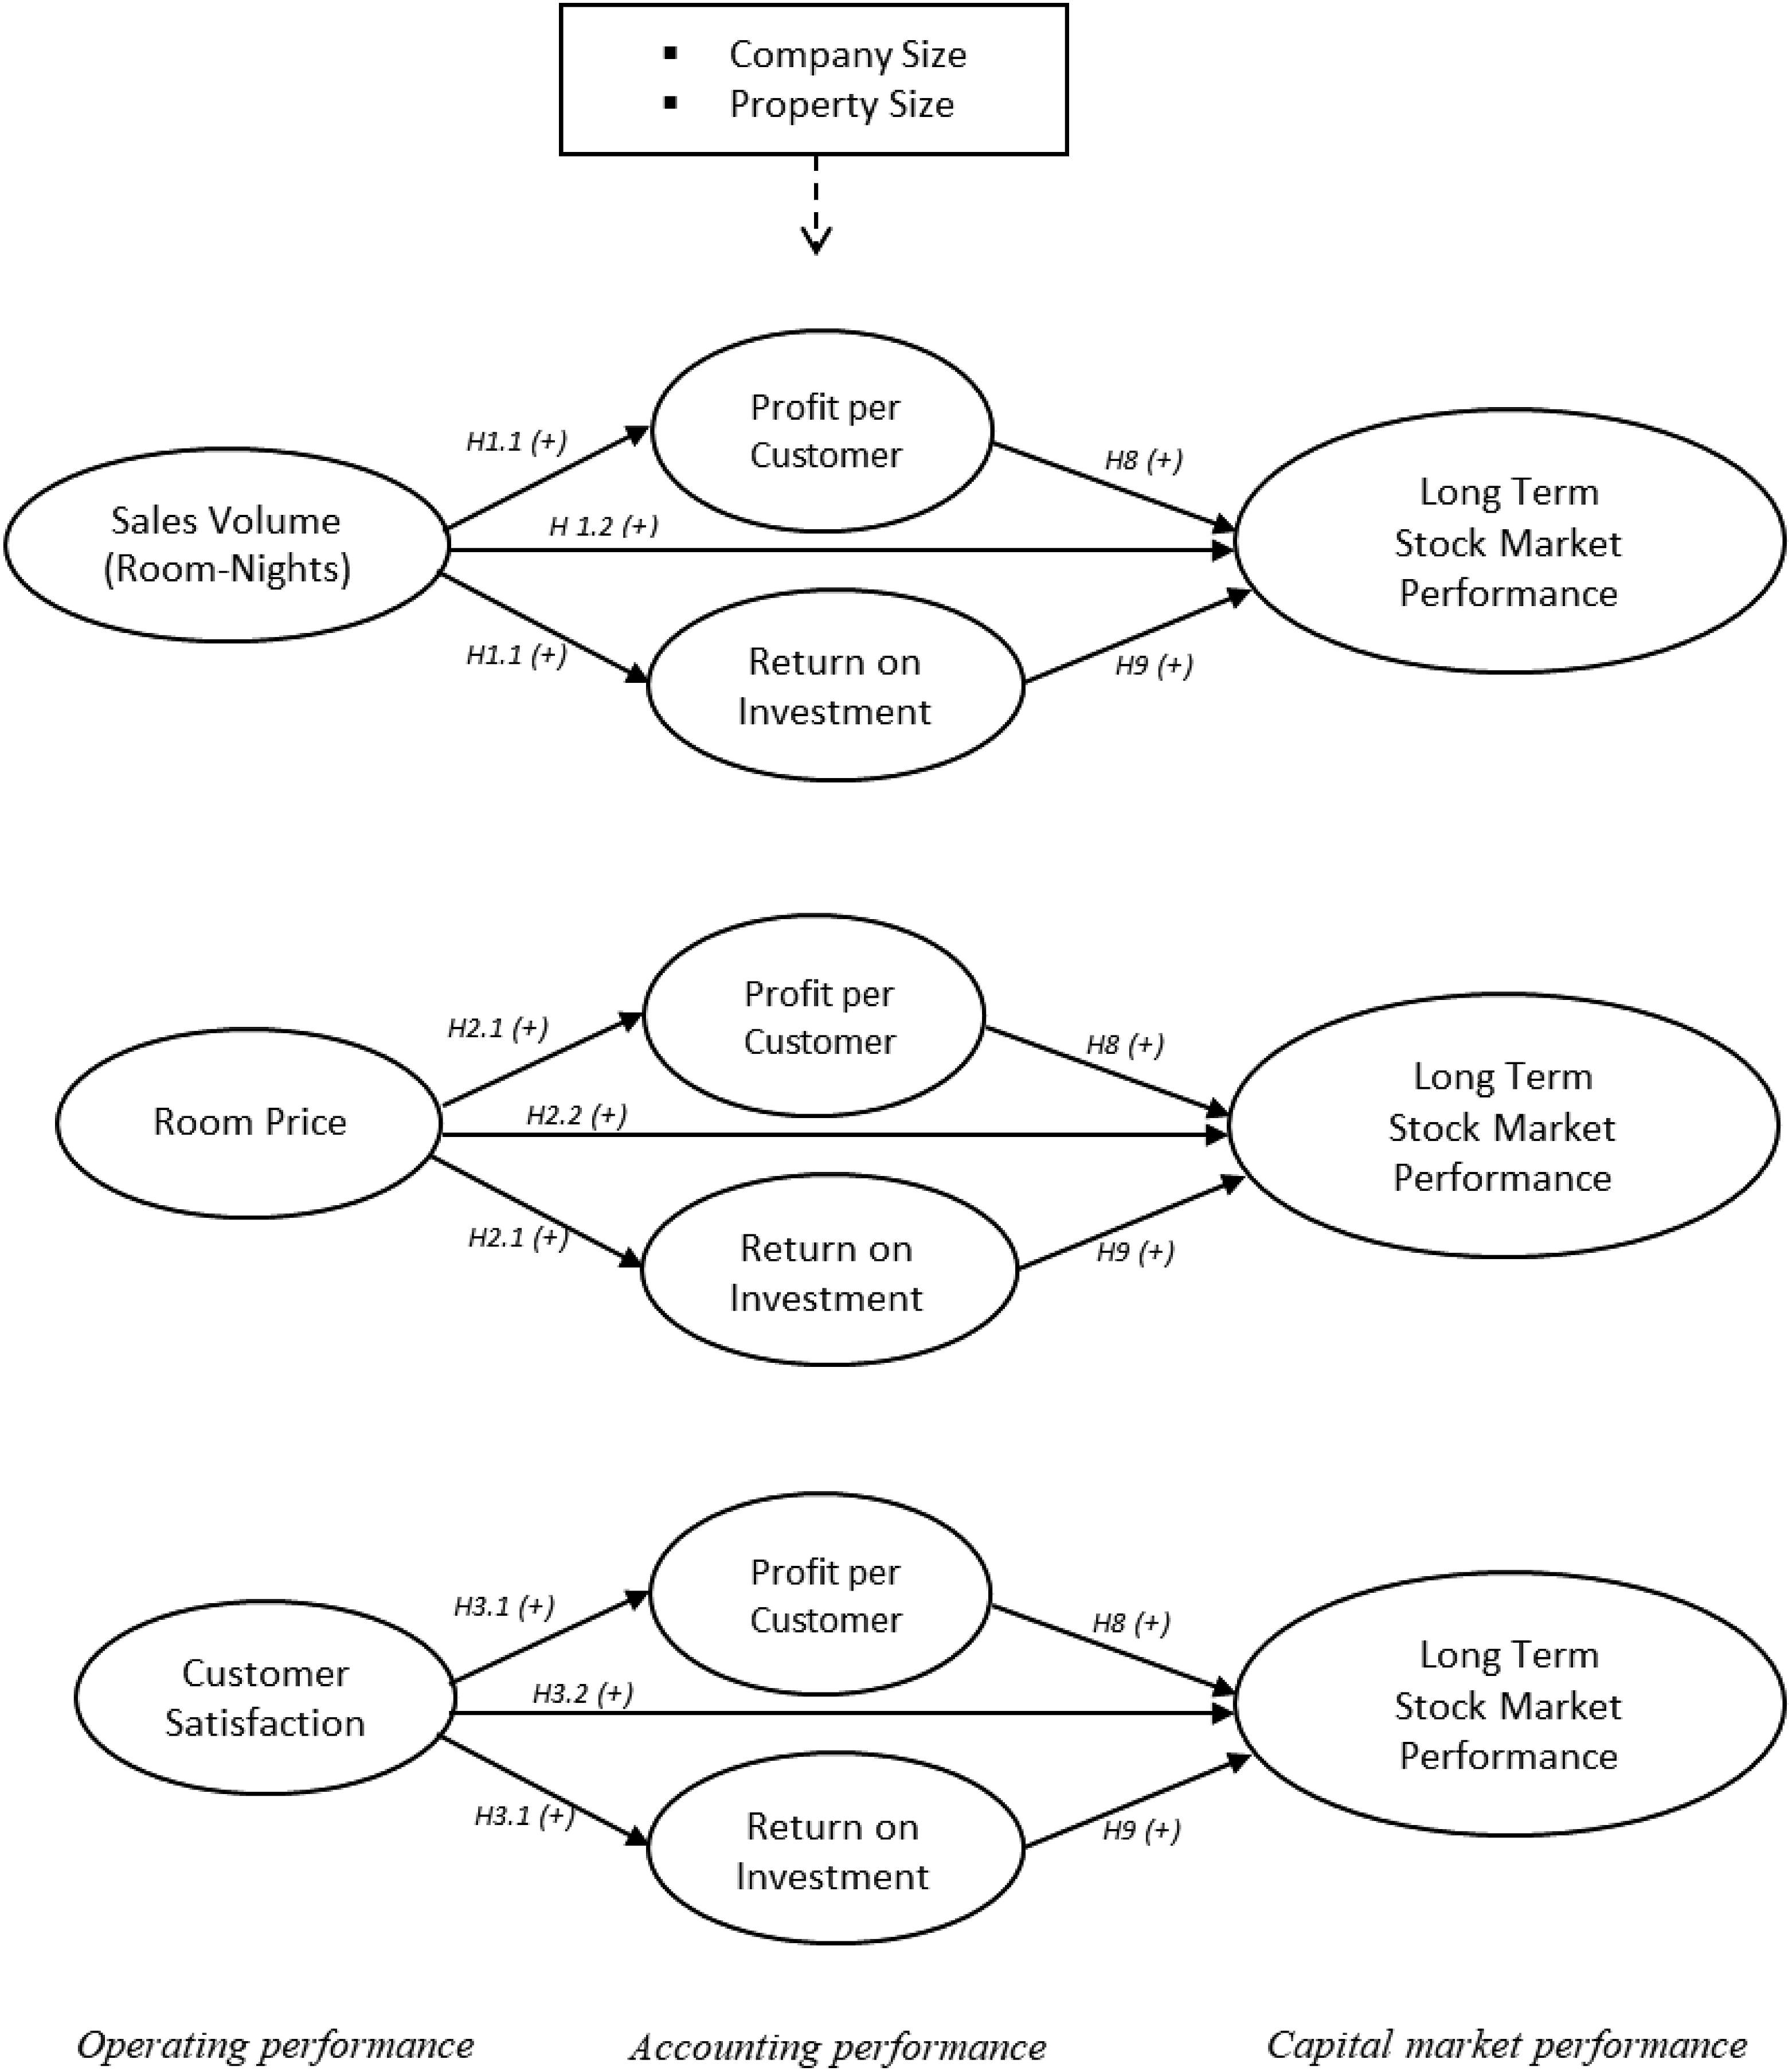
Conceptual diagram for hypotheses testing, direct relationships.
Moderating effect of price
The use of price to manage demand in hotel revenue management assumes that it operates as an interactive or moderating factor. Thus, Kimes and Renaghan (2011) and Croes and Semrad (2012) demonstrate that lower prices will stimulate demand (sales) and, consequently, more profitable capacity utilization, whereas higher prices will lead to reduced demand and, due to the perishability of unsold rooms, reduce profitability. A clear understanding of this relationship is important due to the high costs and low margins of the hotel industry. The following hypotheses are about the potential moderating effects of price on the traffic-profitability relationship:
The concept of (market) pricing power suggests that a firm's ability to charge higher prices without affecting sales volume can provide a competitive advantage and increase its market value (Syverson, 2019; Zhu et al., 2021). This is particularly relevant in the context of hotels operating at low margins because the ability to charge higher prices can help secure profitability during cost shocks. Investors often react positively to such developments, as reflected in their stock market performance (Datta et al., 2011). When market power is absent, a price increase may result in a sales drop and, consequently, lower profitability and stock market performance. There are other potential capital market effects related to product prices. Therefore, the following hypothesis was formulated:
Studies in multiple disciplines have analyzed the impact of product prices on revenue and profit. However, this relationship is worth revisiting in the complex cross-level model that we apply in the current study to test endogenous interrelations.
Moderating effect of customer satisfaction
Customer satisfaction has received central attention in the marketing literature. It was summarized by Mittal et al. (2023: 2) as “a customer’s evaluative summary judgment of consumption experiences that is associated with customer- and firm-level outcomes,” and according to the study framework, can be influenced by a number of behavioral antecedents. Customer-level outcomes mediate firm-level outcomes. In contrast to marketing, accounting views customer satisfaction as having additive effects on revenue, meaning that its effect on profitability is not influenced by the value of the other variables (Ittner and Larcker, 1998; Shields and Shields, 2005).
According to Mittal et al. (2023), who reviewed 40 years of marketing research dedicated to customer satisfaction in the context of a firm’s financial performance, the proportion of empirical results for customer satisfaction measures (including ACSI) is considerably smaller than that for customer-level outcomes. This was specifically the case for studies that used ACSI as a moderator of firm-level outcomes. Furthermore, marketing pricing literature presents an ongoing debate between economic rationality and the belief that satisfied customers are willing to pay more without reducing their consumption (Van der Rest and Roper, 2013; Ingenbleek, 2014; Enz et al., 2016). Based on the interactive effect of customer satisfaction on the traffic-profitability relationship, we formulate the following hypotheses:
There are also potential moderating effects from the perspective of long-term financial performance. Following reviews of the extant literature on both marketing and accounting (e.g., Herschung et al., 2018; Mittal et al., 2023), firm-level outcomes also include capital market performance. Although distinct reasons are sometimes tested in the finance discipline, customer satisfaction also interacts with sales volume and stock market performance. Thus, we hypothesize as follows:
Mediation effects of profitability on long-term financial performance
Our cross-level model would be incomplete without a profitability—stock market performance relationship. In addition to general knowledge in finance, prior research has found that hotels’ reported annual accounting profitability is reflected in long-term stock market performance (Mao and Gu, 2007; Hsu and Jang, 2008; Lee et al., 2019). Therefore, the final hypothesis of this study is formulated as follows:
Higher operating profitability, as reflected by per-customer profits, will have a direct positive effect on stock market performance.
Higher sales volume will result in higher per-customer profits and, as a result, better stock market performance. Customer profitability mediates the relationship between room-night sold and stock market performance.
Higher accounting profitability has a direct positive effect on stock market performance.
Higher sales volume results in higher accounting profitability and, consequently, better stock market performance. There is a mediation effect of accounting profitability in room-night sold and stock market performance relationship.
Effect of size on performance
Various studies have found that size affects different levels of financial performance, including both, company and property size (Kosová et al., 2013; Lee et al., 2019; O’Neill and Mattila, 2006). It is important to consider the potential effects of size on the model; therefore, these two indicators were included as control variables.
Conceptual framework
Figure 2 summarizes the discussion in this chapter and graphically presents the hypotheses of this study. Specifically, we present a cross-level moderated mediation model for hotels’ financial performance using a bottom-up approach (from revenue drivers to performance). The various (cross)-level variables are room price and sales volume at the product level, customer satisfaction at the customer level, and customer and accounting profitability at the firm level. Capital market performance reflects both—firm and industry levels. The variables are further operationalized in the methodology section. Conceptual diagram for hypotheses testing, moderated mediation model.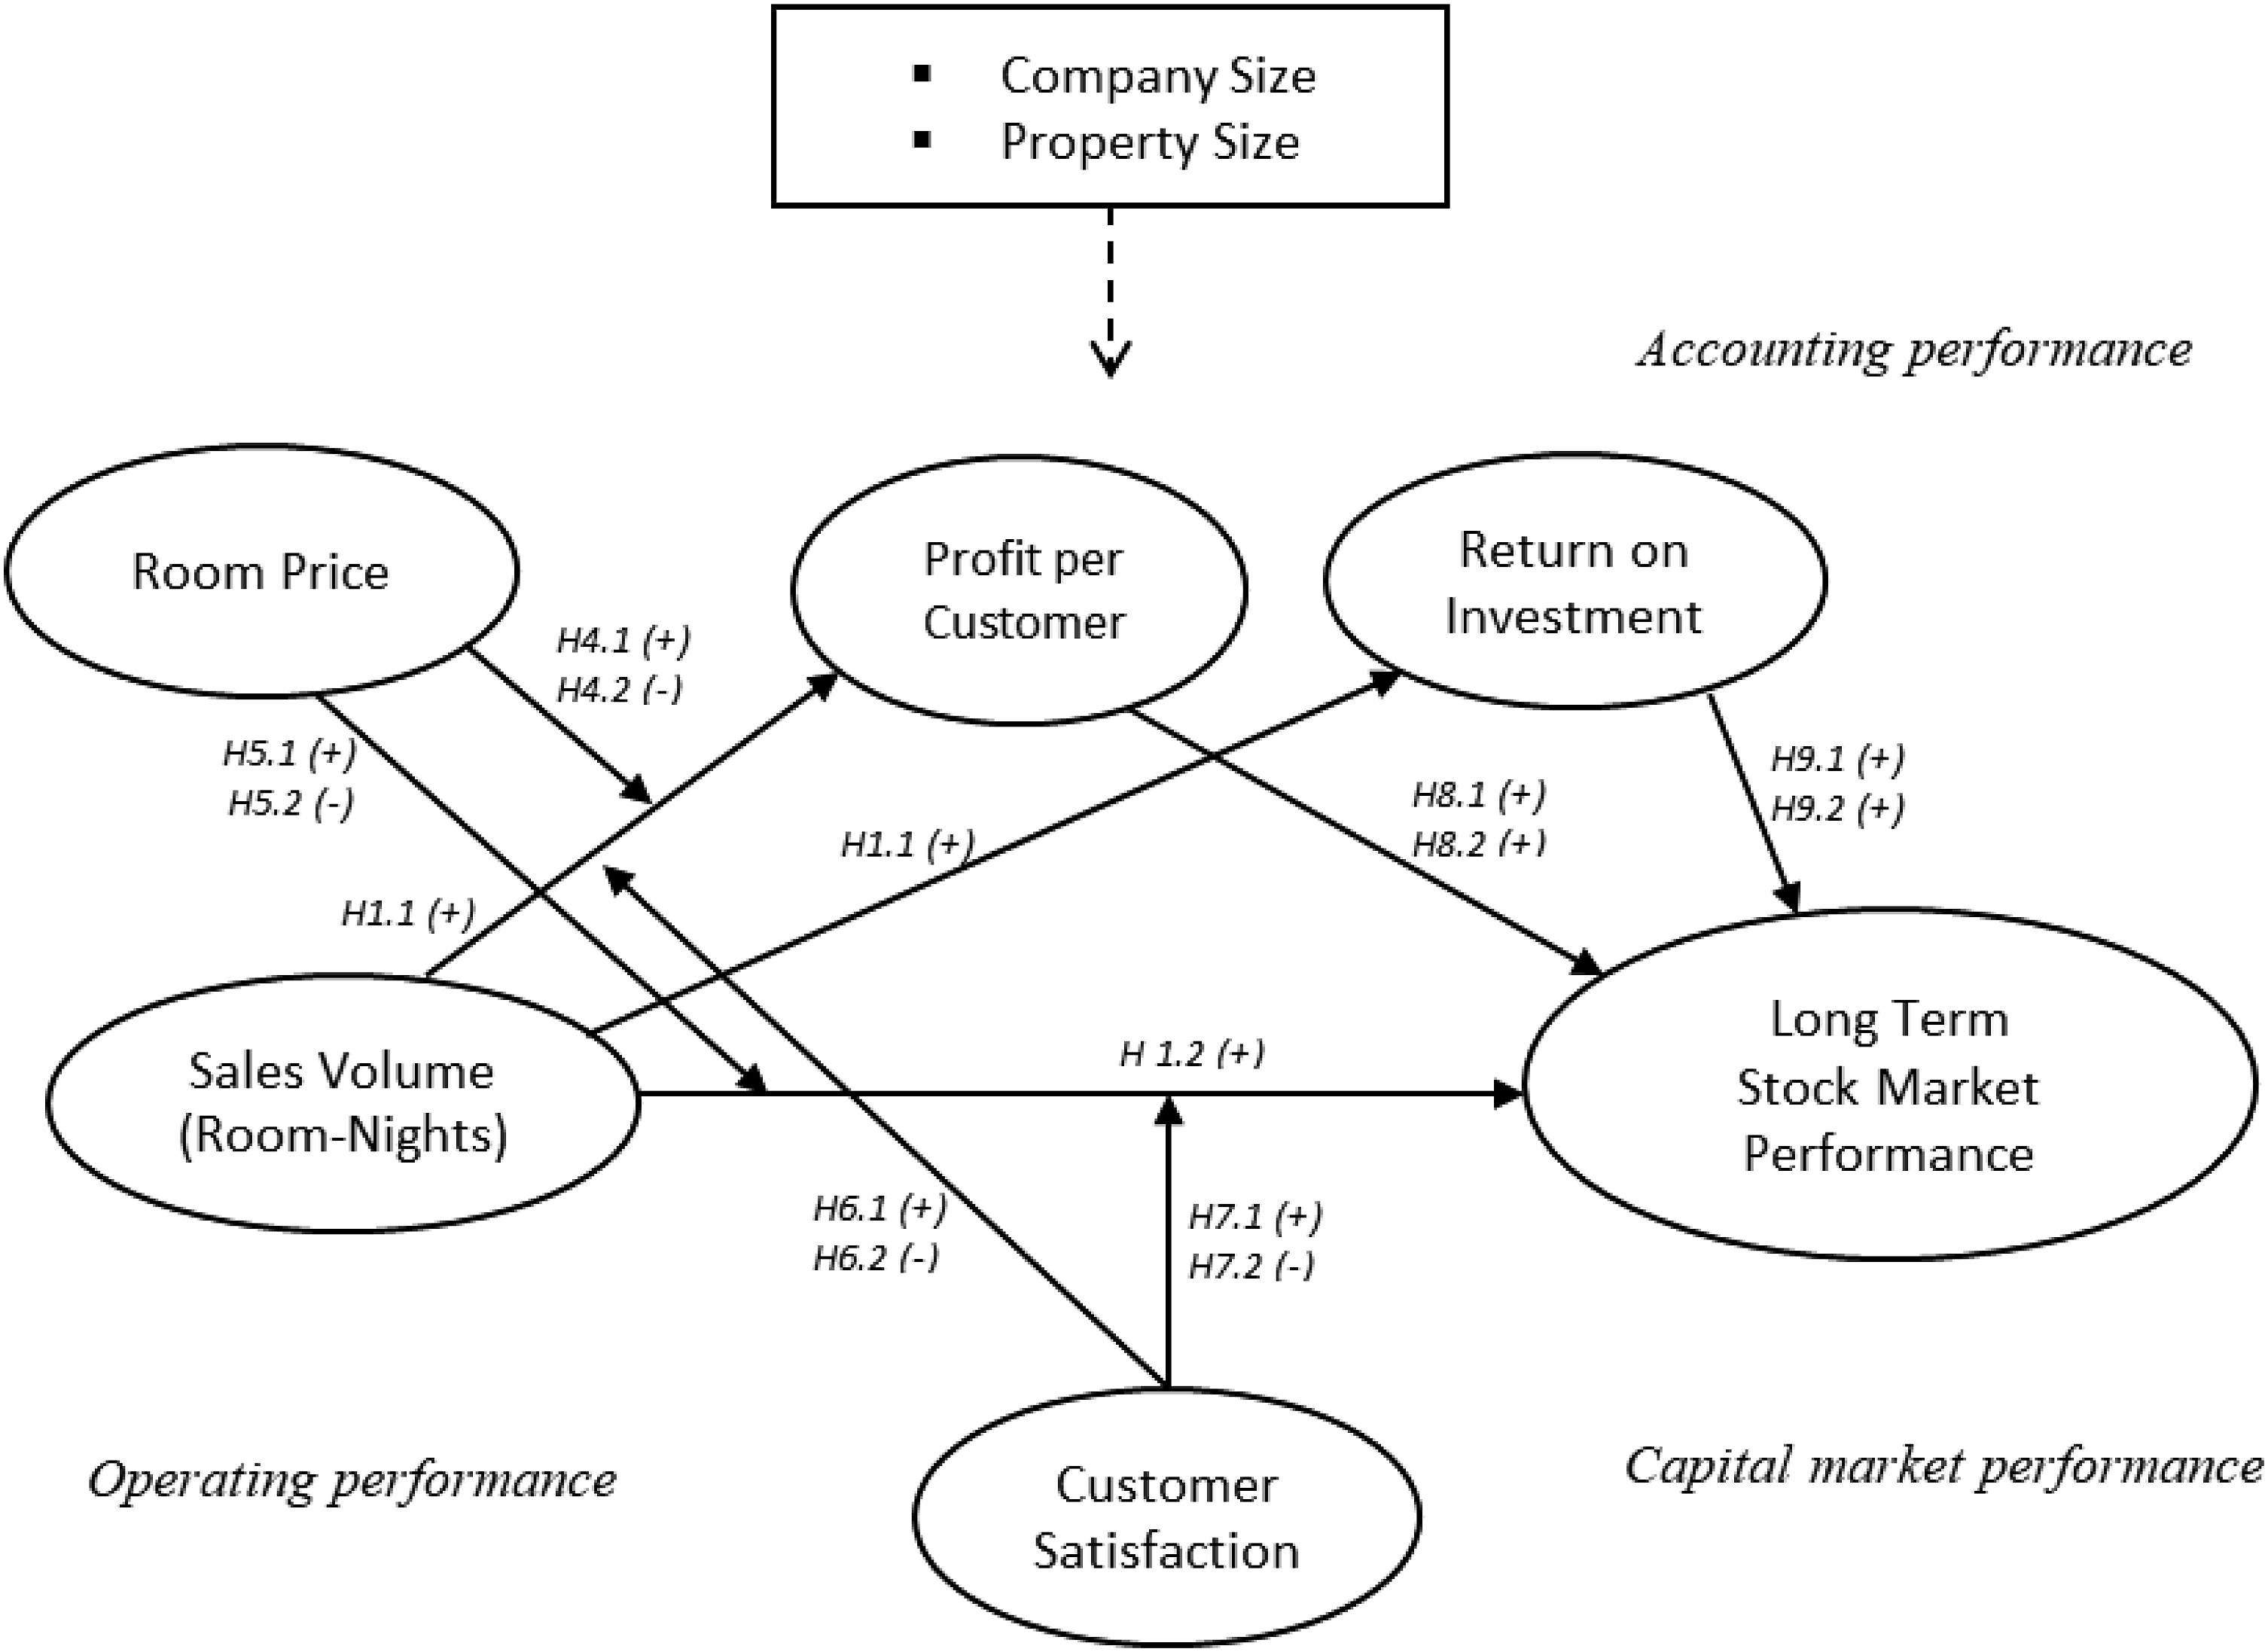
Methodology
Data collection and sample
This study uses publicly available data from US-based traded corporations specializing in hotel operations. The analysis is based on annual observations for six hotel chains for 2004–2020.
Hotel companies included into the sample.
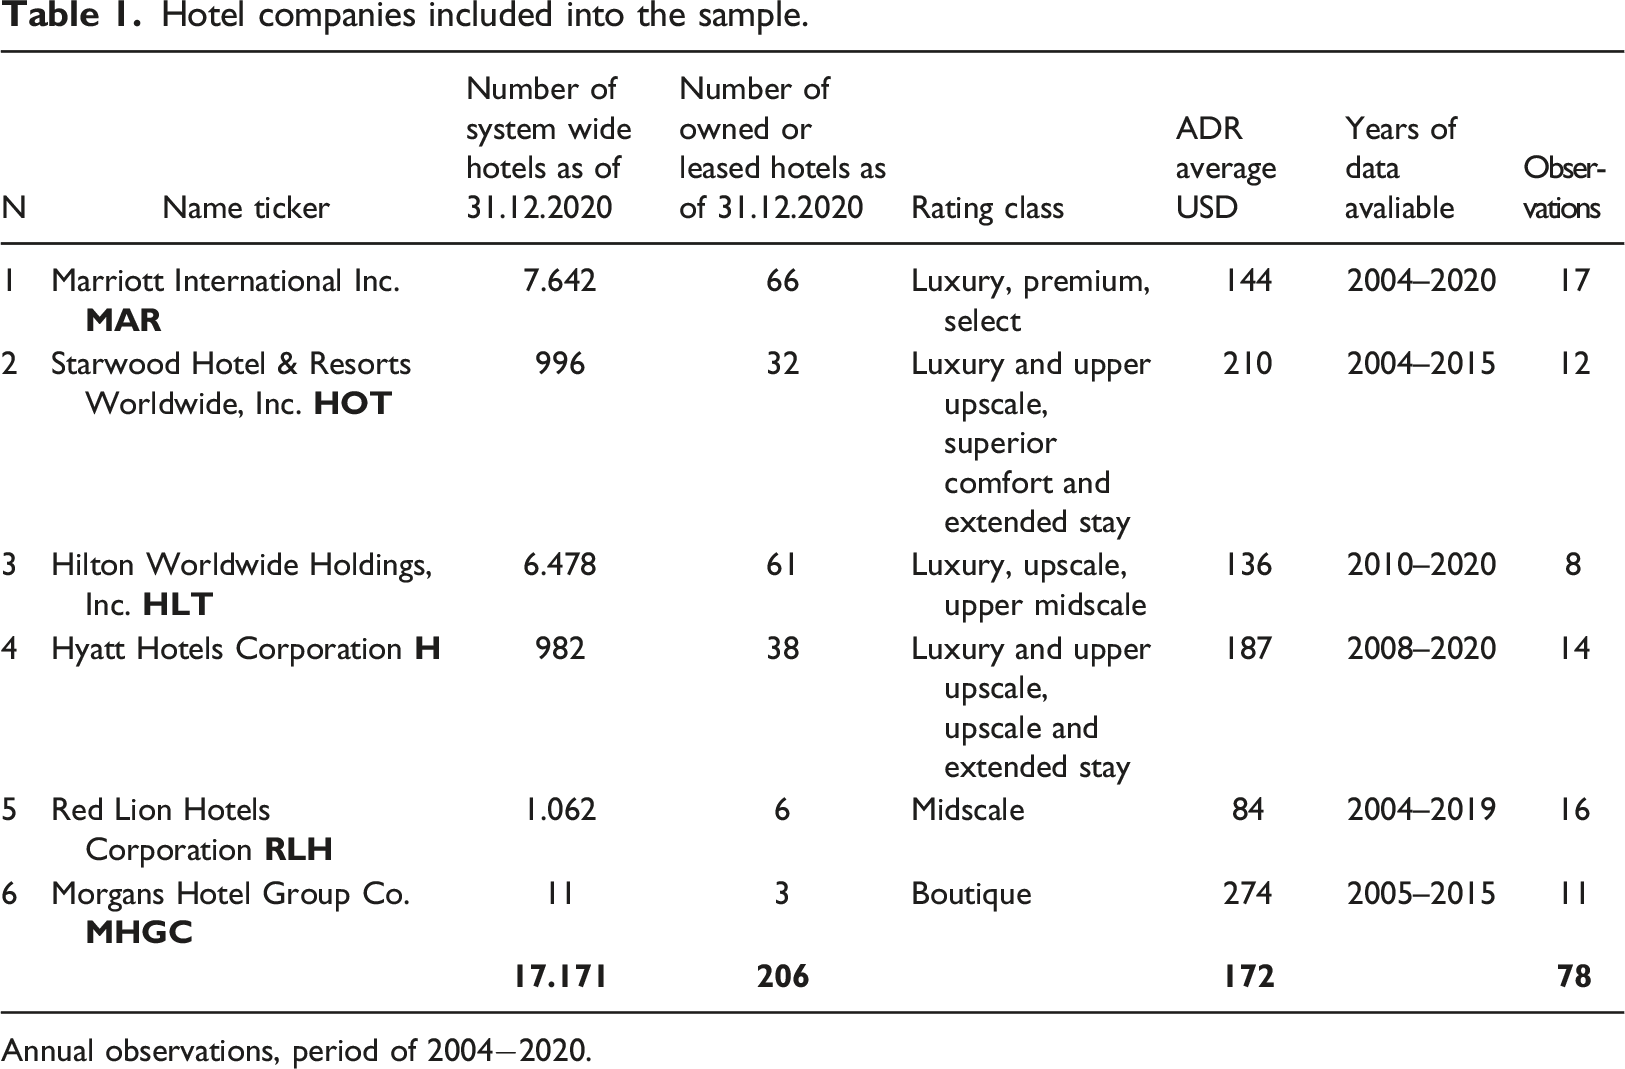
Annual observations, period of 2004−2020.
The annual filings Form 10-K from the SEC’s EDGAR online database were used to estimate the financial ratios and operating metrics. The data included room revenues and direct costs, other revenues and expenses associated with the hotel business, segment operating income, and net income obtained from Consolidated Statements of Earnings and Supplementary Data. Stockholder equity and total assets were collected from Consolidated Balance Sheets. Information about industry-specific operating variables, including quarterly and annual values, such as the number of owned and leased hotels under their own management, number of room-nights available, average daily rate (ADR), and room occupancy rate, was also collected from SEC filings, mainly the Management Discussion and Analysis (MD&A) section.
Computation of variables
Operationalization of conceptual model and computation of variables.
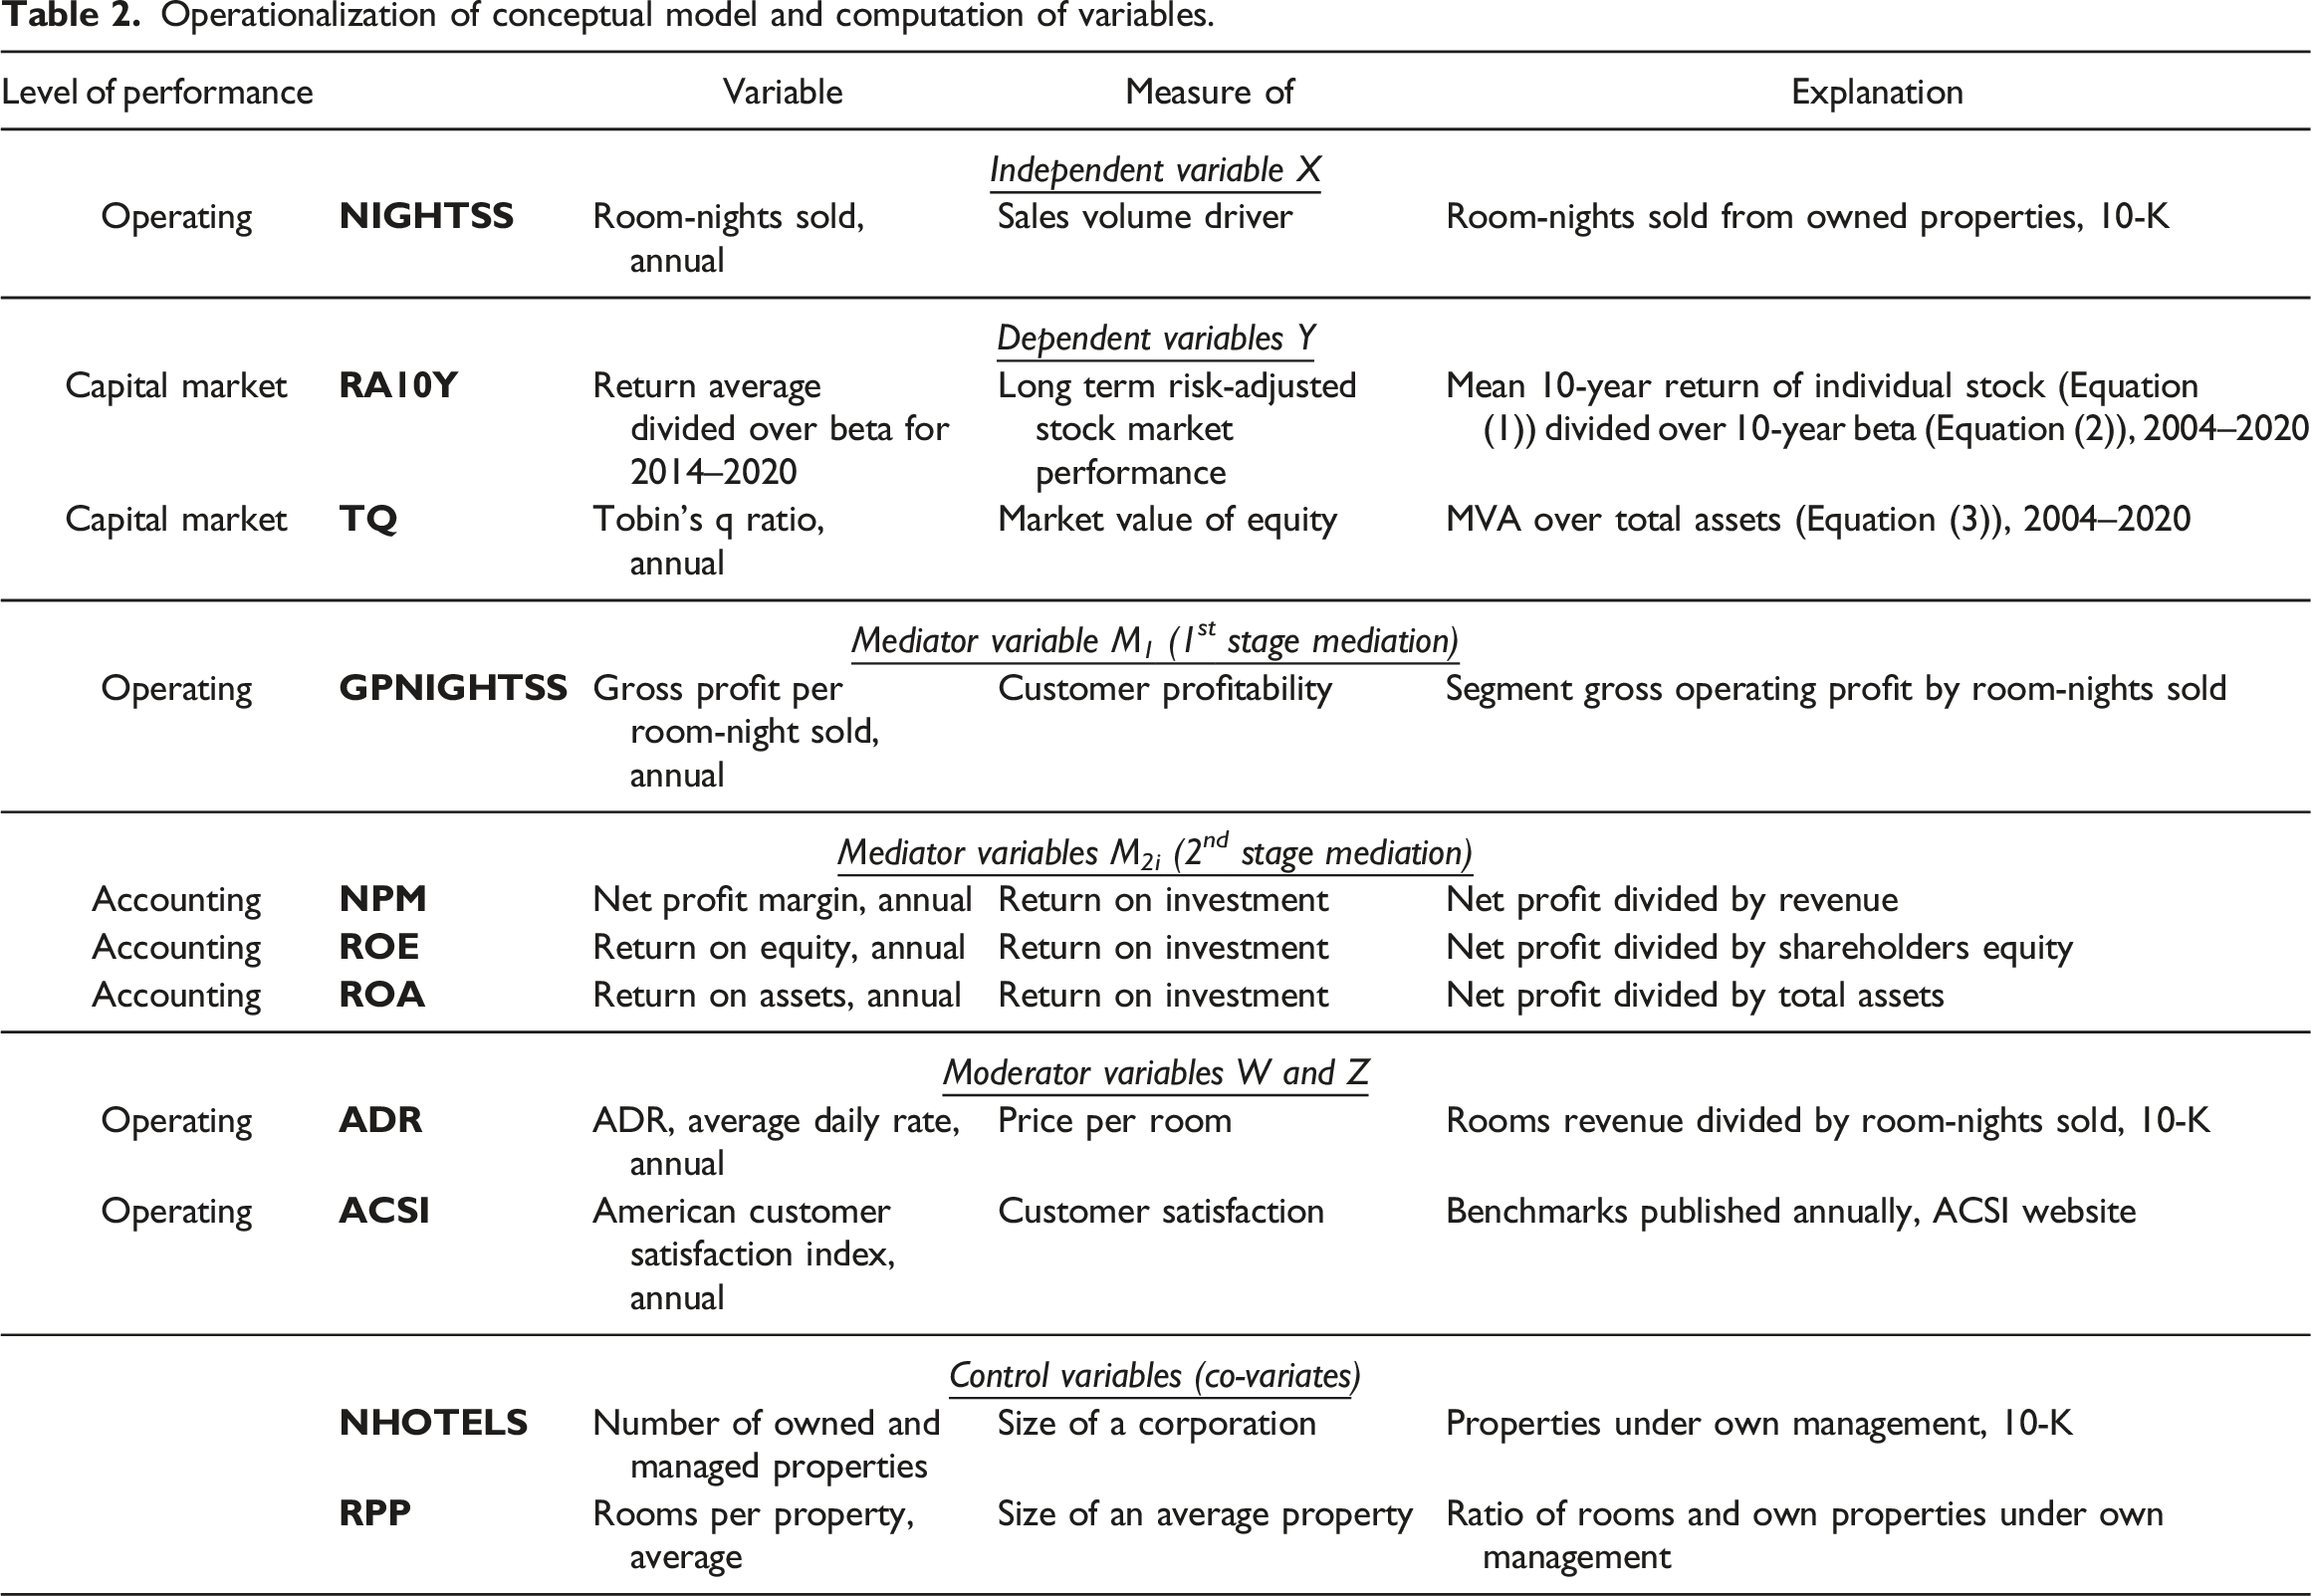
Independent variable X
The number of Room-Nights Sold (NIGHTSS) was not directly reported; therefore, we computed this variable by adjusting the number of room-nights available by occupancy rate %, which are the values available in the MD&A section of the 10-K statements.
Dependent variable Y
To estimate the relative market performance of each of the six hotel companies, two alternative metrics were used independently as dependent variables in a series of tests. Namely, we compute the risk-adjusted market performance of individual stocks over a period of 10 years (RA10) and Tobin’s q (TQ) as the ratio between a physical asset’s market value and its replacement value. In doing so, we offset the drawbacks of each metric and let them complement one another for analysis.
The computation of RA10 begins with the monthly rate of return R for equity investors in month t, which is

The second computation of the relative market performance of each of the six hotel companies was Tobin’s q (TQ). Here, we used a simplified approach for estimating the TQ suggested by Chung and Pruitt (1994), as the TQ itself was not the focus of this study, but aimed to complement the RA10 and offset its drawbacks, such as dependence on stock market conditions. TQ is intrinsic to firm performance, forward-looking, comparable across firms, and based on economic theory (Anderson et al., 2004). Therefore, the following equation was used
Mediator variables
For the first-stage mediation, we computed a metric for customer profitability. Unfortunately, the number of unique customers is not available in annual reports, nor is it available from other public sources or from third parties. Thus, we were unable to estimate the gross operating profit per unique customer, which would incorporate the length of stay and auxiliary revenues per customer. To address this limitation, we assume that each paying customer stayed one night and occupied one room, thus equaling the number of customers to the number of room-nights sold. Such a practice is commonly used by cruise lines, where, alongside lower berth capacity, occupancy rate, and number of unique passengers, they report the number of passenger cruise days separately and as a denominator for various economic values.
Thus, we estimated the Gross Operating Profit per room-night sold (GPNIGHTSS) by dividing the gross operating profit from profit and loss statements by NIGHTSS in the respective periods (M1). The Gross Operating Profit is the difference between the Total Revenue from hotel operations and direct hotel segment costs, as specified in the 10-K statement.
For the second-stage moderation (M2i), the calculation of accounting profitability ratios is needed. Net income value obtained from Consolidated Statements of Earnings and Supplementary Data. Stockholder equity and total assets were collected from Consolidated Balance Sheets. From these variables, we calculate Gross Profit (GP), Net Profit Margin (NPM = M21), Return on Assets (ROA = M22), and Return on Equity (ROE = M23) as the most commonly used financial ratios for profitability analysis (Horngren et al., 2012).
Moderator variables
For the first moderator W, price per room-night sold (ADR) was readily available from the MD&A section of 10-K statements.
For moderator Z, the ACSI variable data were collected for hotels from the Industrial Benchmarks on the American Customer Satisfaction Index (LLC) website. ACSI reports annual individual benchmarks for eight major hotel companies and individual brands. Aggregated company benchmarks were readily available for Marriott, Starwood, Hilton, and Hyatt corporations. For the Red Lion and Morgans Hotels, no benchmarks on brand or company basis were reported, therefore the “All Others” aggregate index for smaller hoteliers was applied to both of these companies.
Control variables
To include the company size variable, the number of owned and leased hotels under their own management (NHOTELS) was readily available in the MD&A section of the 10-K statements. To reflect the average property size operated by these firms, the number of rooms per property (RPP) was estimated by dividing the total number of rooms available by NHOTELS. Larger hotels have more facilities that offer additional revenue streams, also impacting the type of travelers and, thus, the anticipated ADR.
Method
The analysis was performed using SPSS 28. For the conditional process analysis of moderated mediation, PROCESS 4.0, macro for SPSS (Hayes, 2022) was used. All variables were standardized (mean zero and standard deviation of one). This main test was preceded by correlation analysis to verify the selection of variables and exclude multicollinearity issues.
To test the hypotheses of this study, we built a moderated mediation model, as presented in the literature section in Figure 2, and operationalized it using the variables listed in Table 2. This regression-based conditional process analysis was performed using PROCESS macro for SPSS 4.0, following the Model 10 template (Hayes, 2022) as depicted in Figure 3. Model 10 is an additive moderated mediation model with two moderators and multiple parallel mediators, which measures the following effects (4) Statistical diagram of moderated mediation (Model 10, Hayes, 2022).
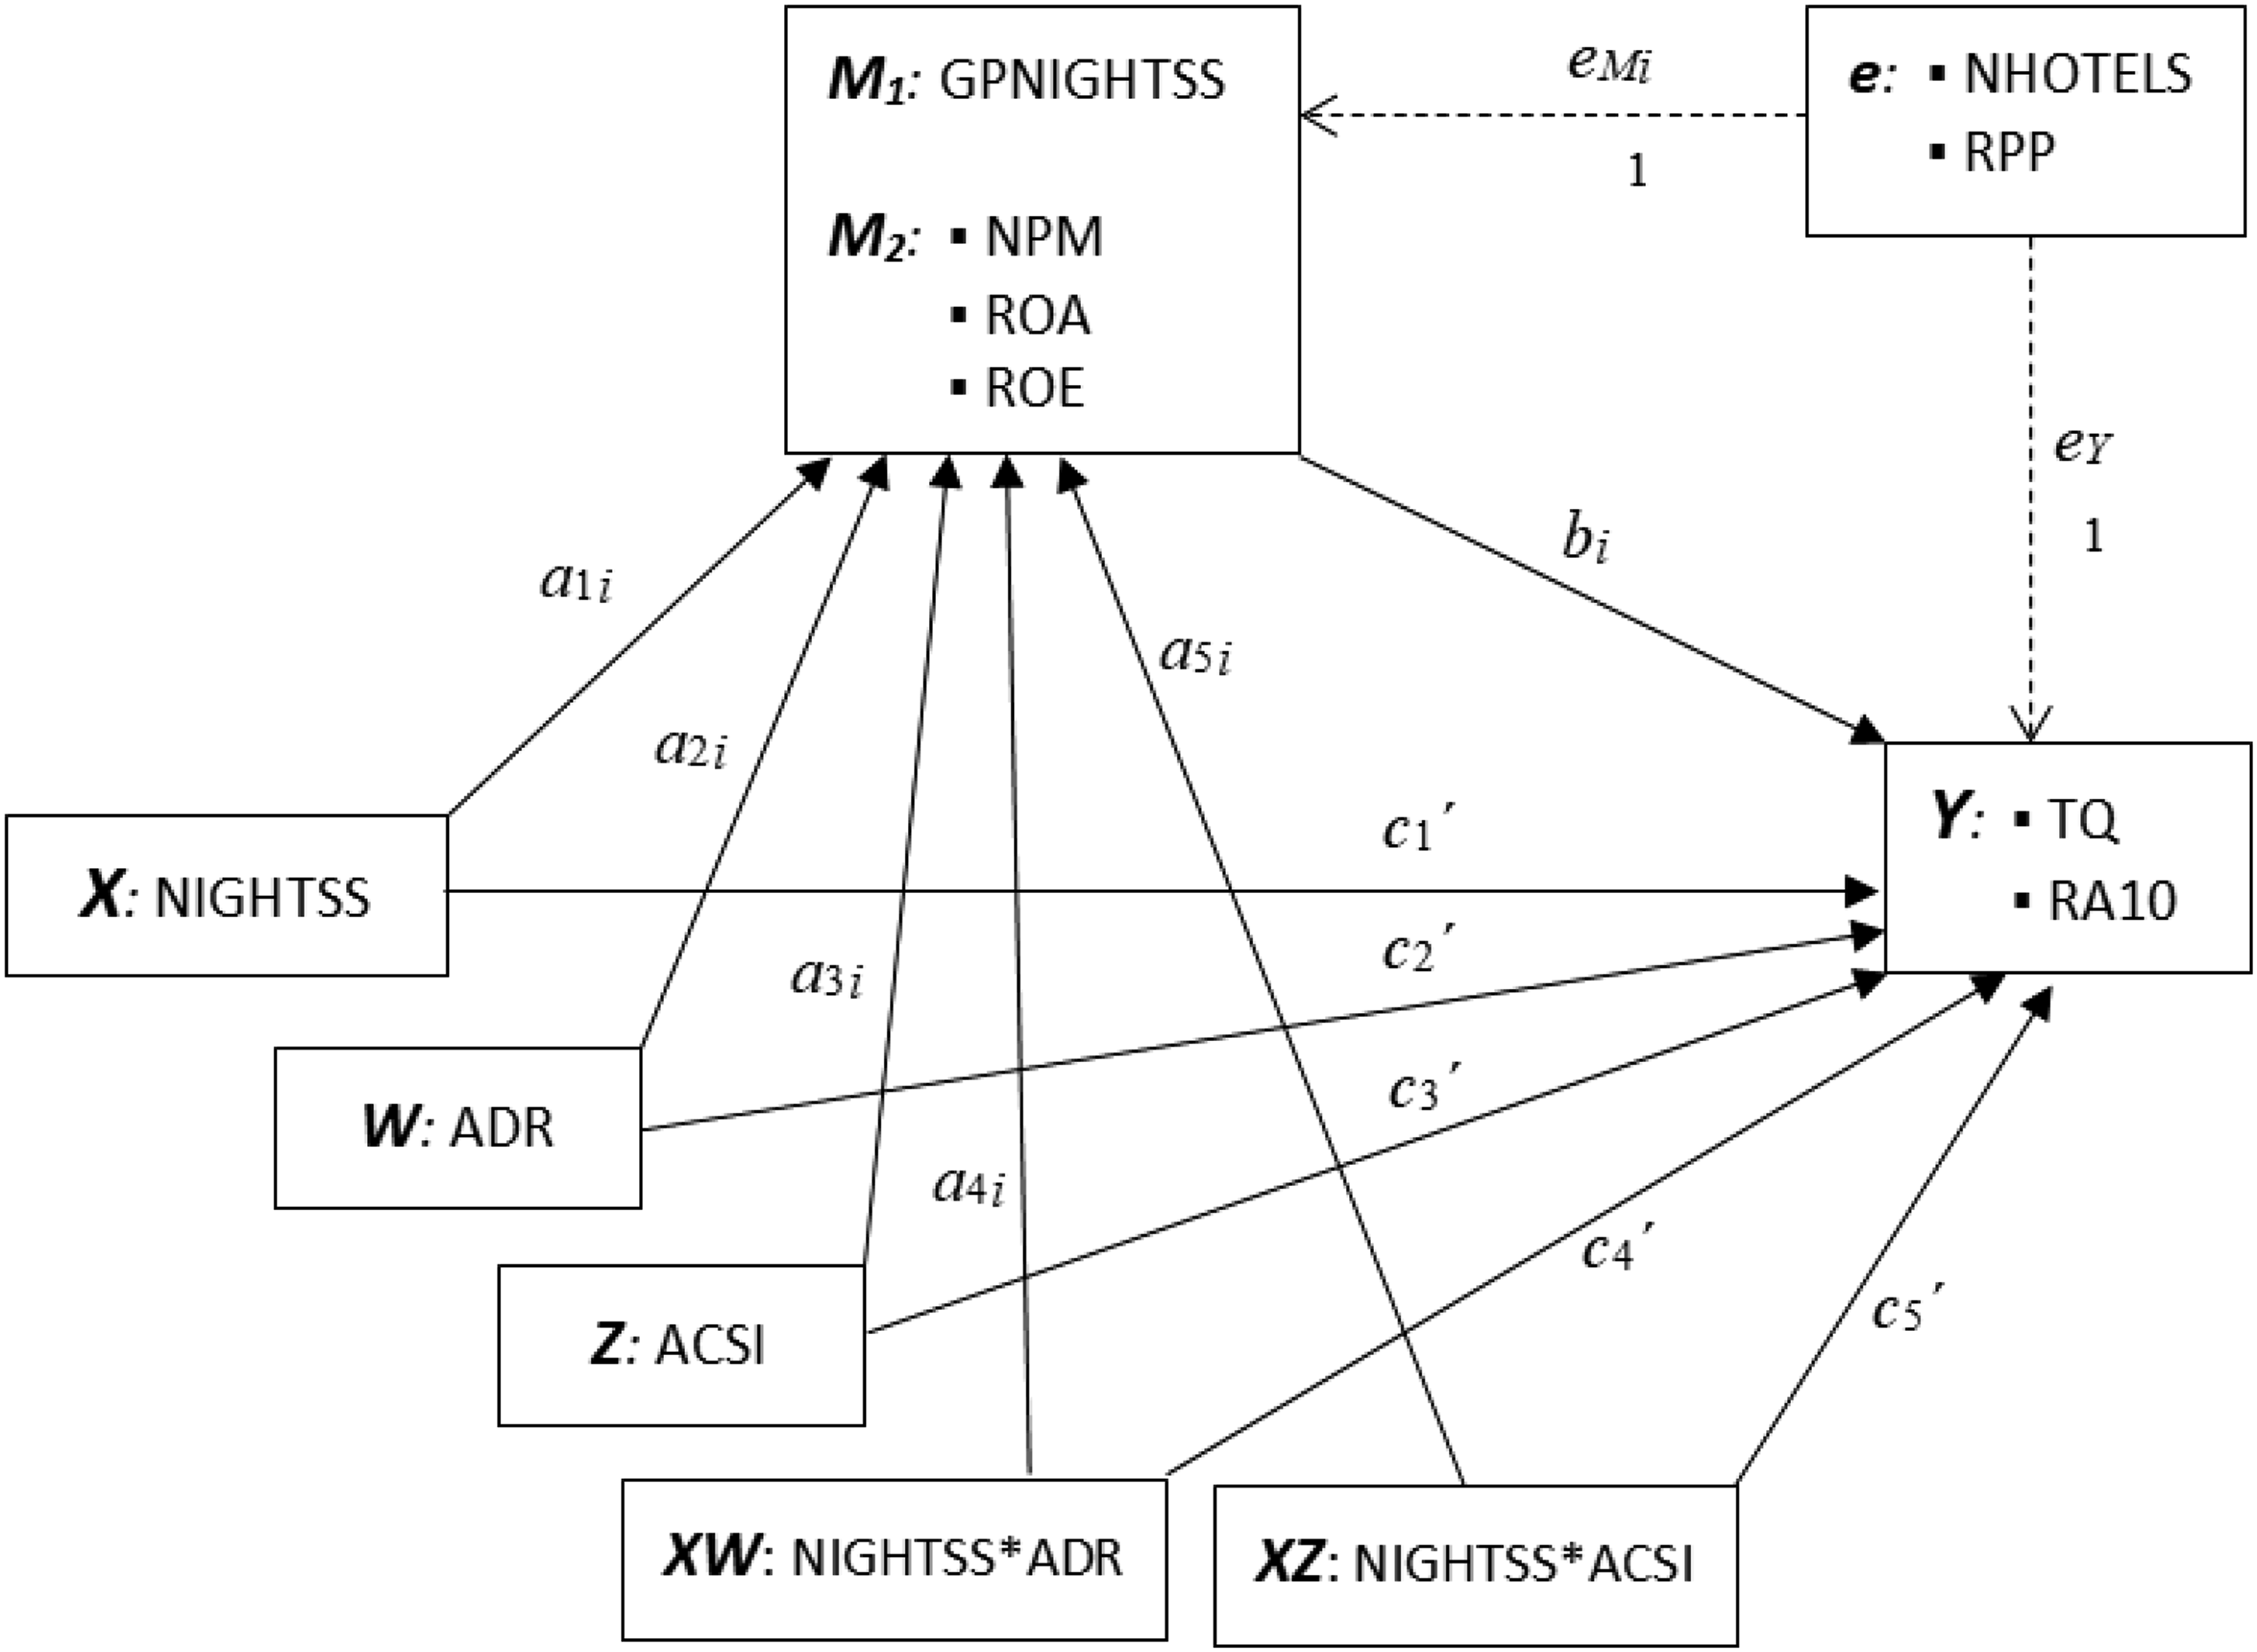
The statistical diagram depicted in Figure 3 includes the variables, relationships tested, and path names.
The model tests the direct and indirect effects of sales volume driver room-nights sold (NIGHTSS = X) on stock market performance measured by the long-term risk-adjusted return (RA10) and Tobin’s q (TQ) (dependent variable Y, path c1’), through customer profitability at the operating performance level (gross profit per room-night sold, GPNIGHTSS, mediator 1 M1), accounting profitability at the accounting level (net profit margin—NPM–mediator 2 M21, return on assets—ROA–M22, return on equity—ROE–M23). Further, we analyzed the moderating effects of room price ADR as moderator W on first-stage mediation (path a4i), namely NIGHTSS on GPNIGHTSS (path a1i), as well as on the direct effect (path c4’), which is the effect of NIGHTSS on RA10 and TQ (path c1’). The second moderator Z measures the moderating effect of customer satisfaction (ACSI) on the same paths as the first moderator W (a1i and c1’), which are expressed by the paths a5i and c5’, respectively. To control for various size effects, the two control variables, NHOTELS and RPP, were added to the model. The model measures the direct effects of size on the mediators GPNIGHTSS, NPM, ROA, and ROE (links emi), and the independent variables RA10 and TQ (links ey).
PROCESS 4.0 uses bootstrapping to assess the direct and indirect effects of variables, as well as to optimize data for the analysis. To judge the significance of the indirect effect, PROCESS 4.0 uses 95% bootstrap confidence intervals constructed using 5.000 bootstrap samples (Hayes, 2022). The indirect effect represents the impact of the mediator variable on the original relationship (i.e., the relationship between independent and outcome variables). In moderation analyses, the predictors (NIGHTSS, ADR, and ACSI) were centered and unstandardized coefficients were reported (Hayes, 2022).
Preliminary results
Descriptive statistics.
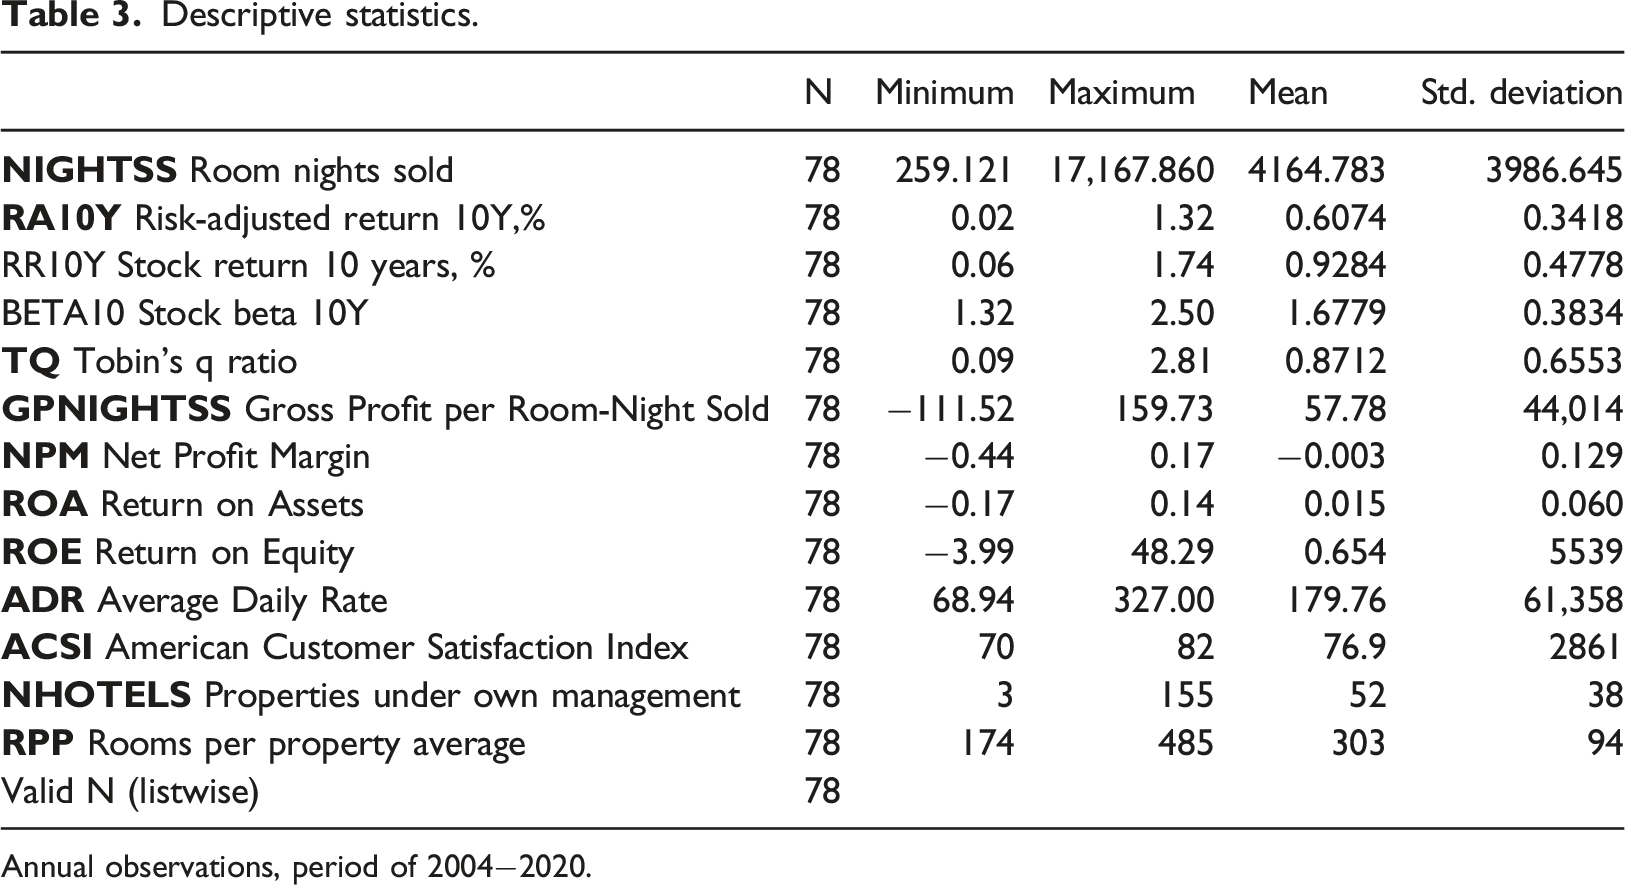
Annual observations, period of 2004−2020.
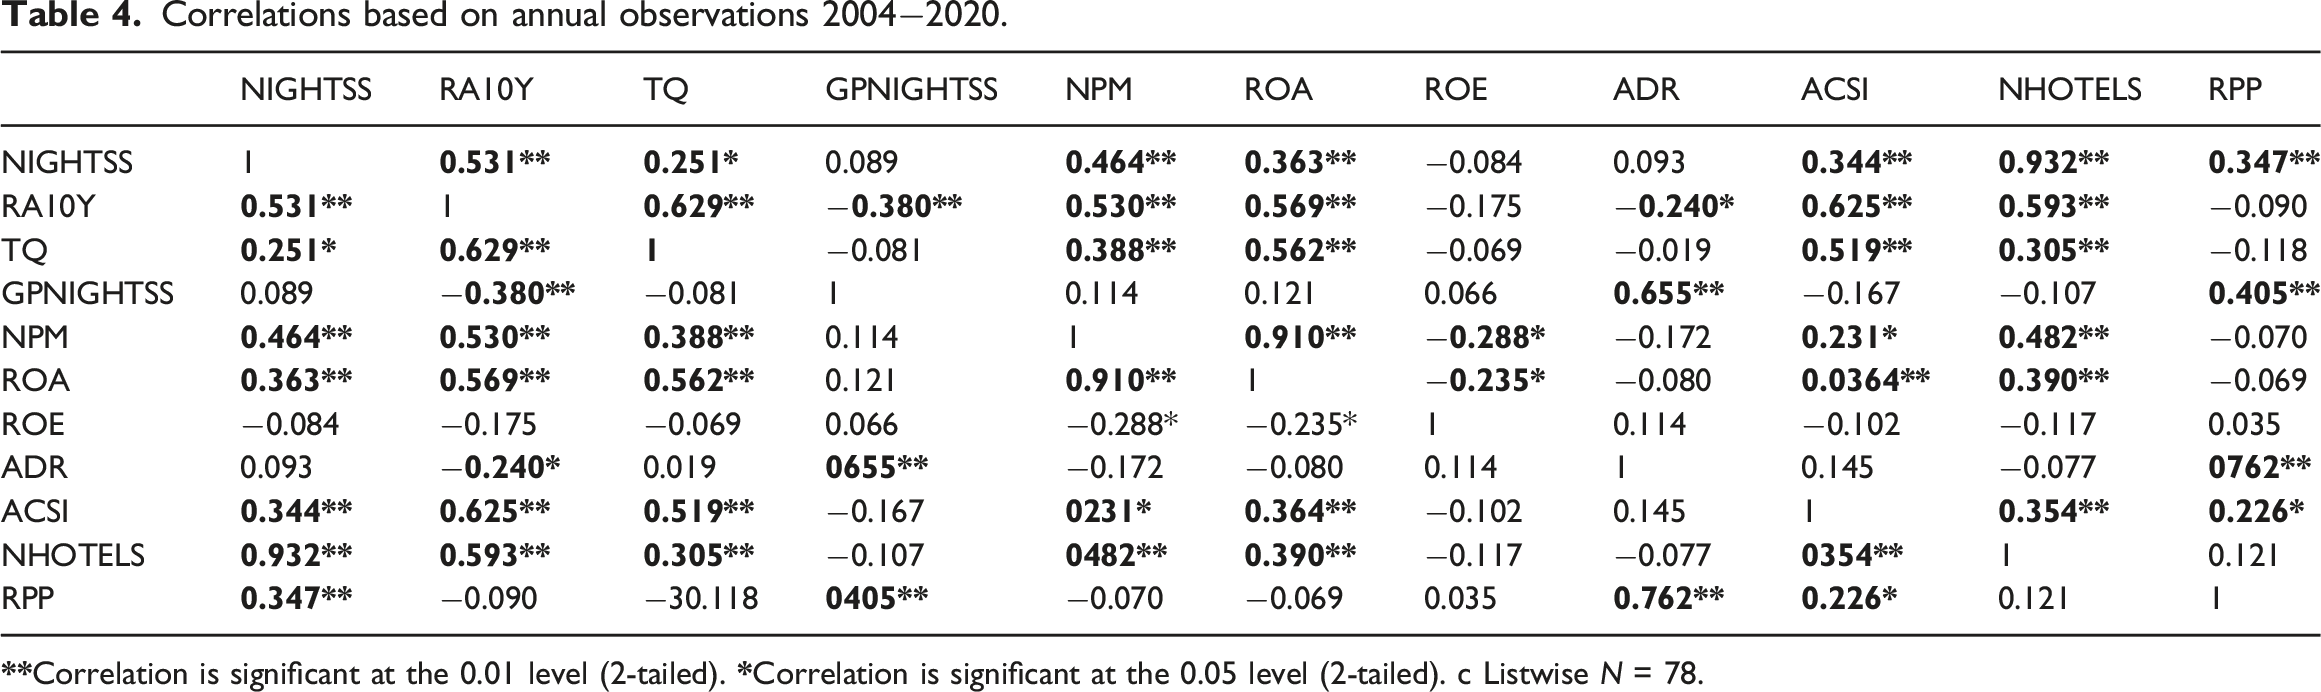
Correlations based on annual observations 2004−2020.
Findings
Main effects based on the first stage mediation analysis results (short-term performance).
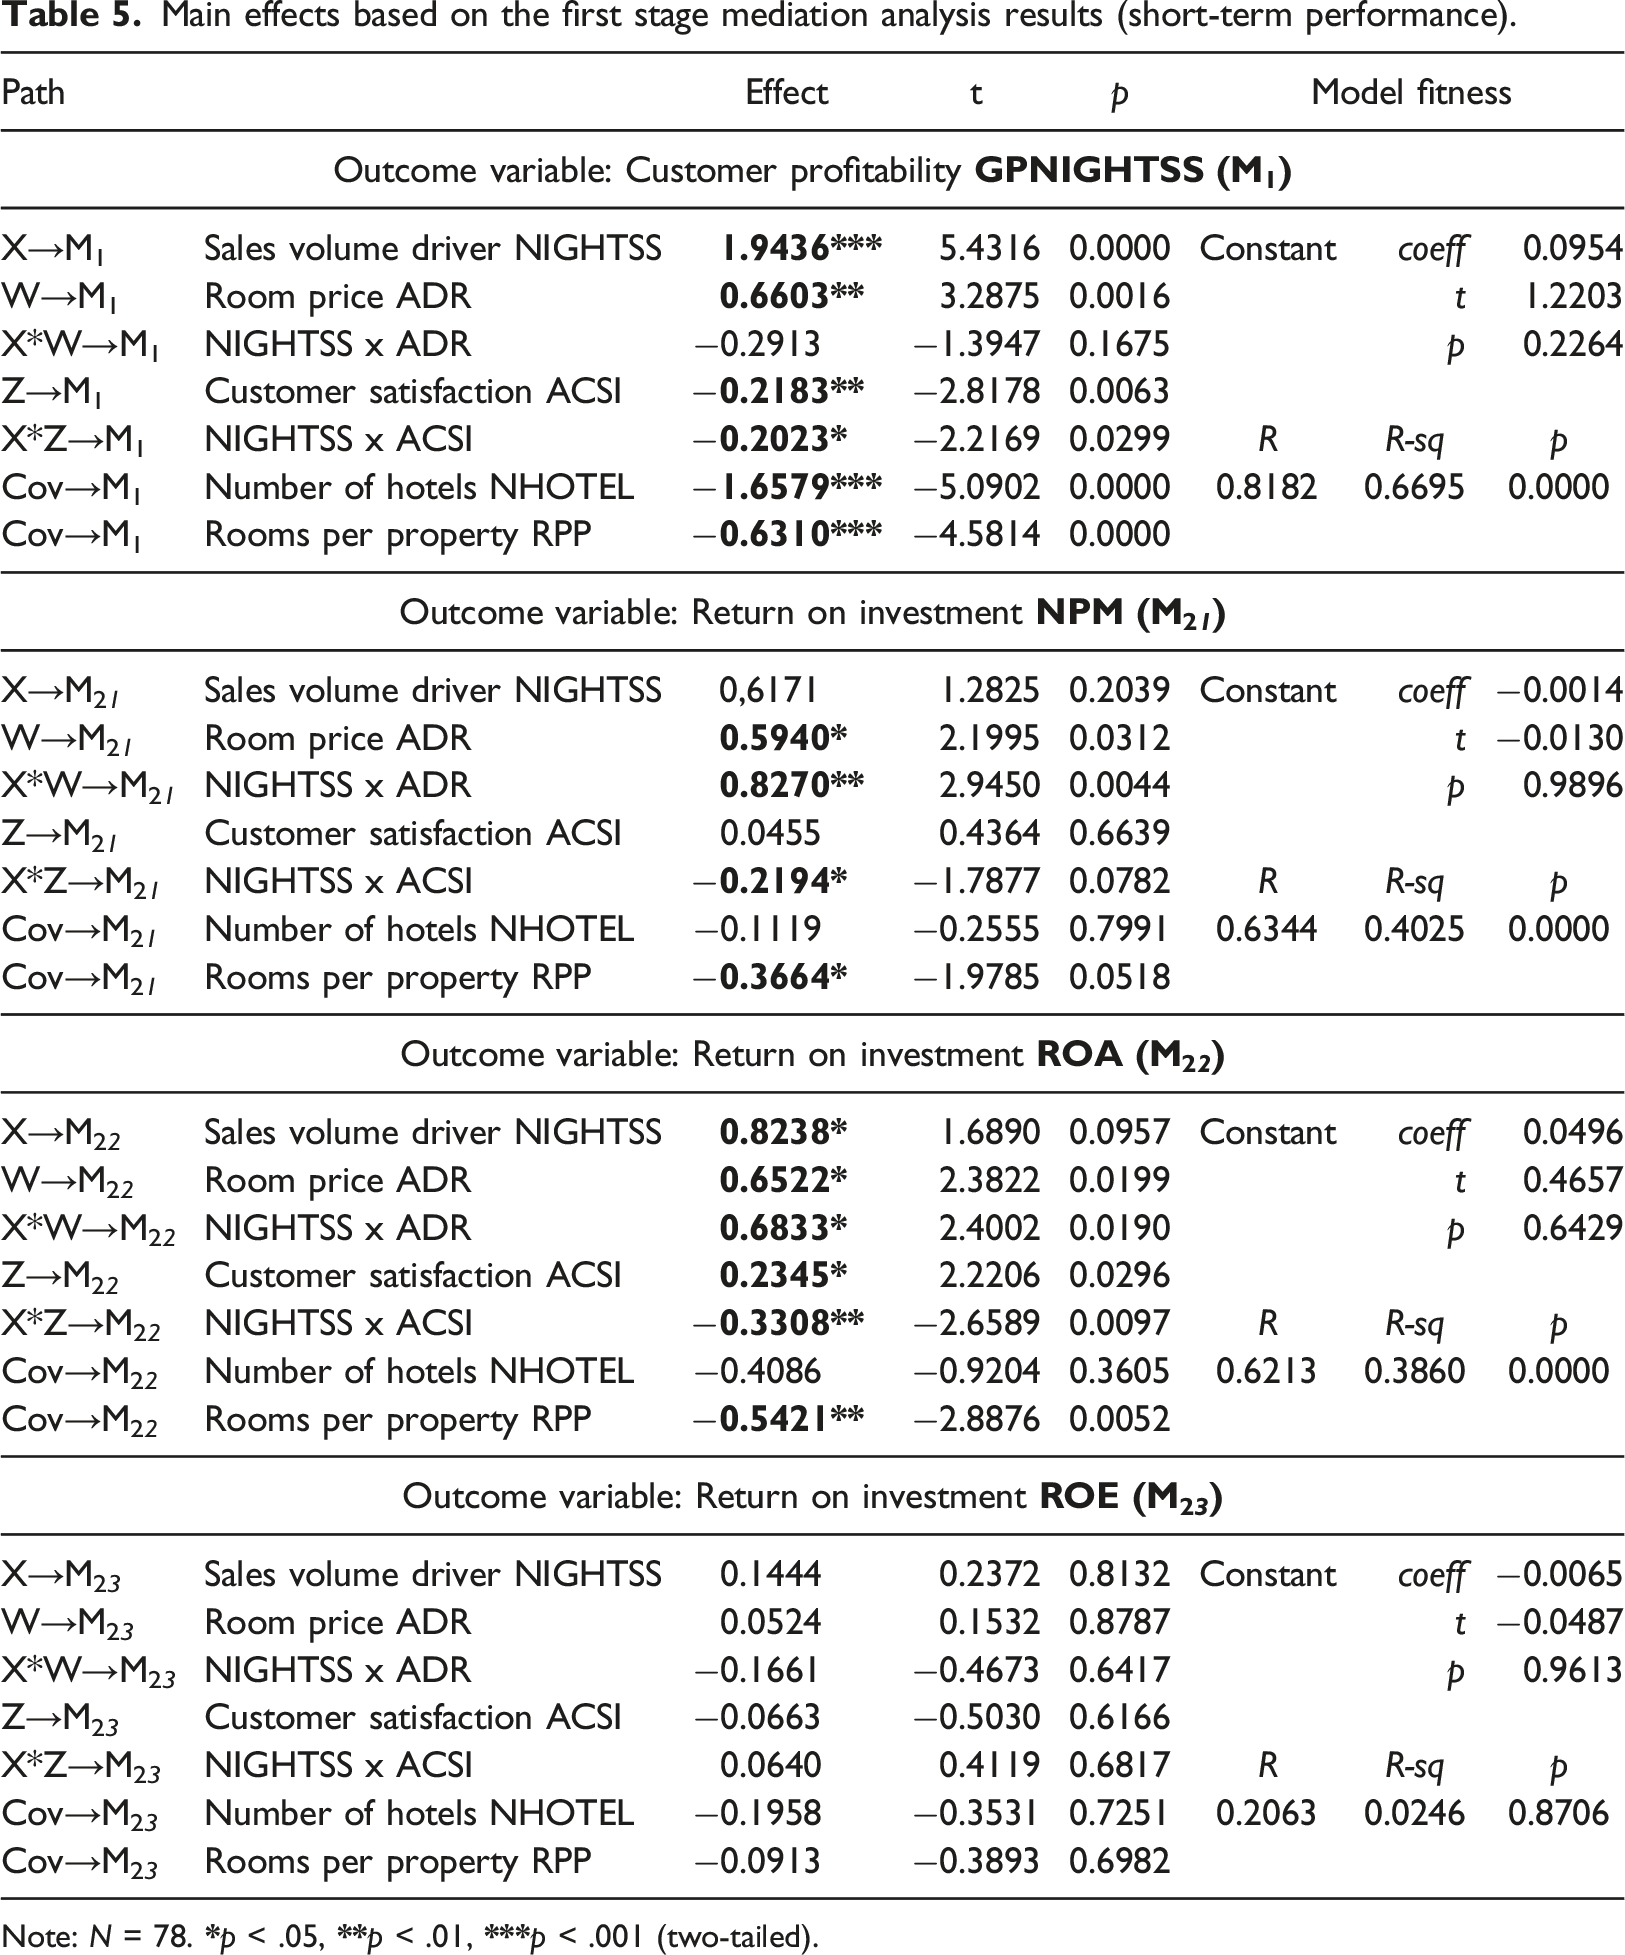
Note: N = 78.
In the short term, we observed a significant and positive impact of price (ADR) on both, customer profitability (GPNIGHTSS) and accounting profitability (NPM and ROA). Table 5 presents the results with interaction terms. When excluding the interaction term X*W from the model specification, ADR is only positively related to customer profitability (GPNIGHTSS) and not significantly related to accounting profitability. In this case, additional analyses revealed that a one standard deviation increase in ADR is related to a 0.90 standard deviation (SD) increase in GPNIGHTSS.
Customer satisfaction (ACSI), on the other hand is negatively associated with GPNIGHTSS, which can probably related to higher operating costs needed to achieve higher satisfaction. A model specification without interaction terms revealed that a one-SD increase in ASCI was associated with a 0.23 SDs decrease in GPNIGHTSS. However, in the longer term, the model without the interaction terms shows that ACSI is positively related to ROA, whereas its relationship with NPM and ROE is not significant.
As expected, the model without interaction terms shows that the sales volume driver (NIGHTSS) has a significantly positive direct effect on customer profitability, as measured by GPNIGHTSS. Table 5 reveals that the relationship between NIGHTSS and GPNIGHTSS is negatively moderated by customer satisfaction (ACSI). While the impact of NIGHTSS equals 1.94 for average customer satisfaction (which equals 0 for standardized ACSI), the impacts for values of satisfaction that are one SD below and above its mean are 1.74 and 2.14, respectively. The same negative moderation effect is observed at the accounting performance level with the dependent variables NPM and ROA, whereas the moderation effect of price (ADR) is positive. That is, in the case of ROA, the impact of NIGHTSS equals 0.82 for average ADR, while its impact is 0.14 and 1.50, respectively, for price values that are one SD below and above its mean.
Finally, based on model specifications without interaction terms, the variables NHOTELS (company size) and RPP (property size) have a significantly negative impact on customer profitability, GPNIGHTSS only.
(a) Main effects based on the second stage mediation analysis results (long-term performance). Dependent variable – RA10. (b) Main effects based on the second stage mediation analysis results (long-term performance). Dependent variable – TQ.
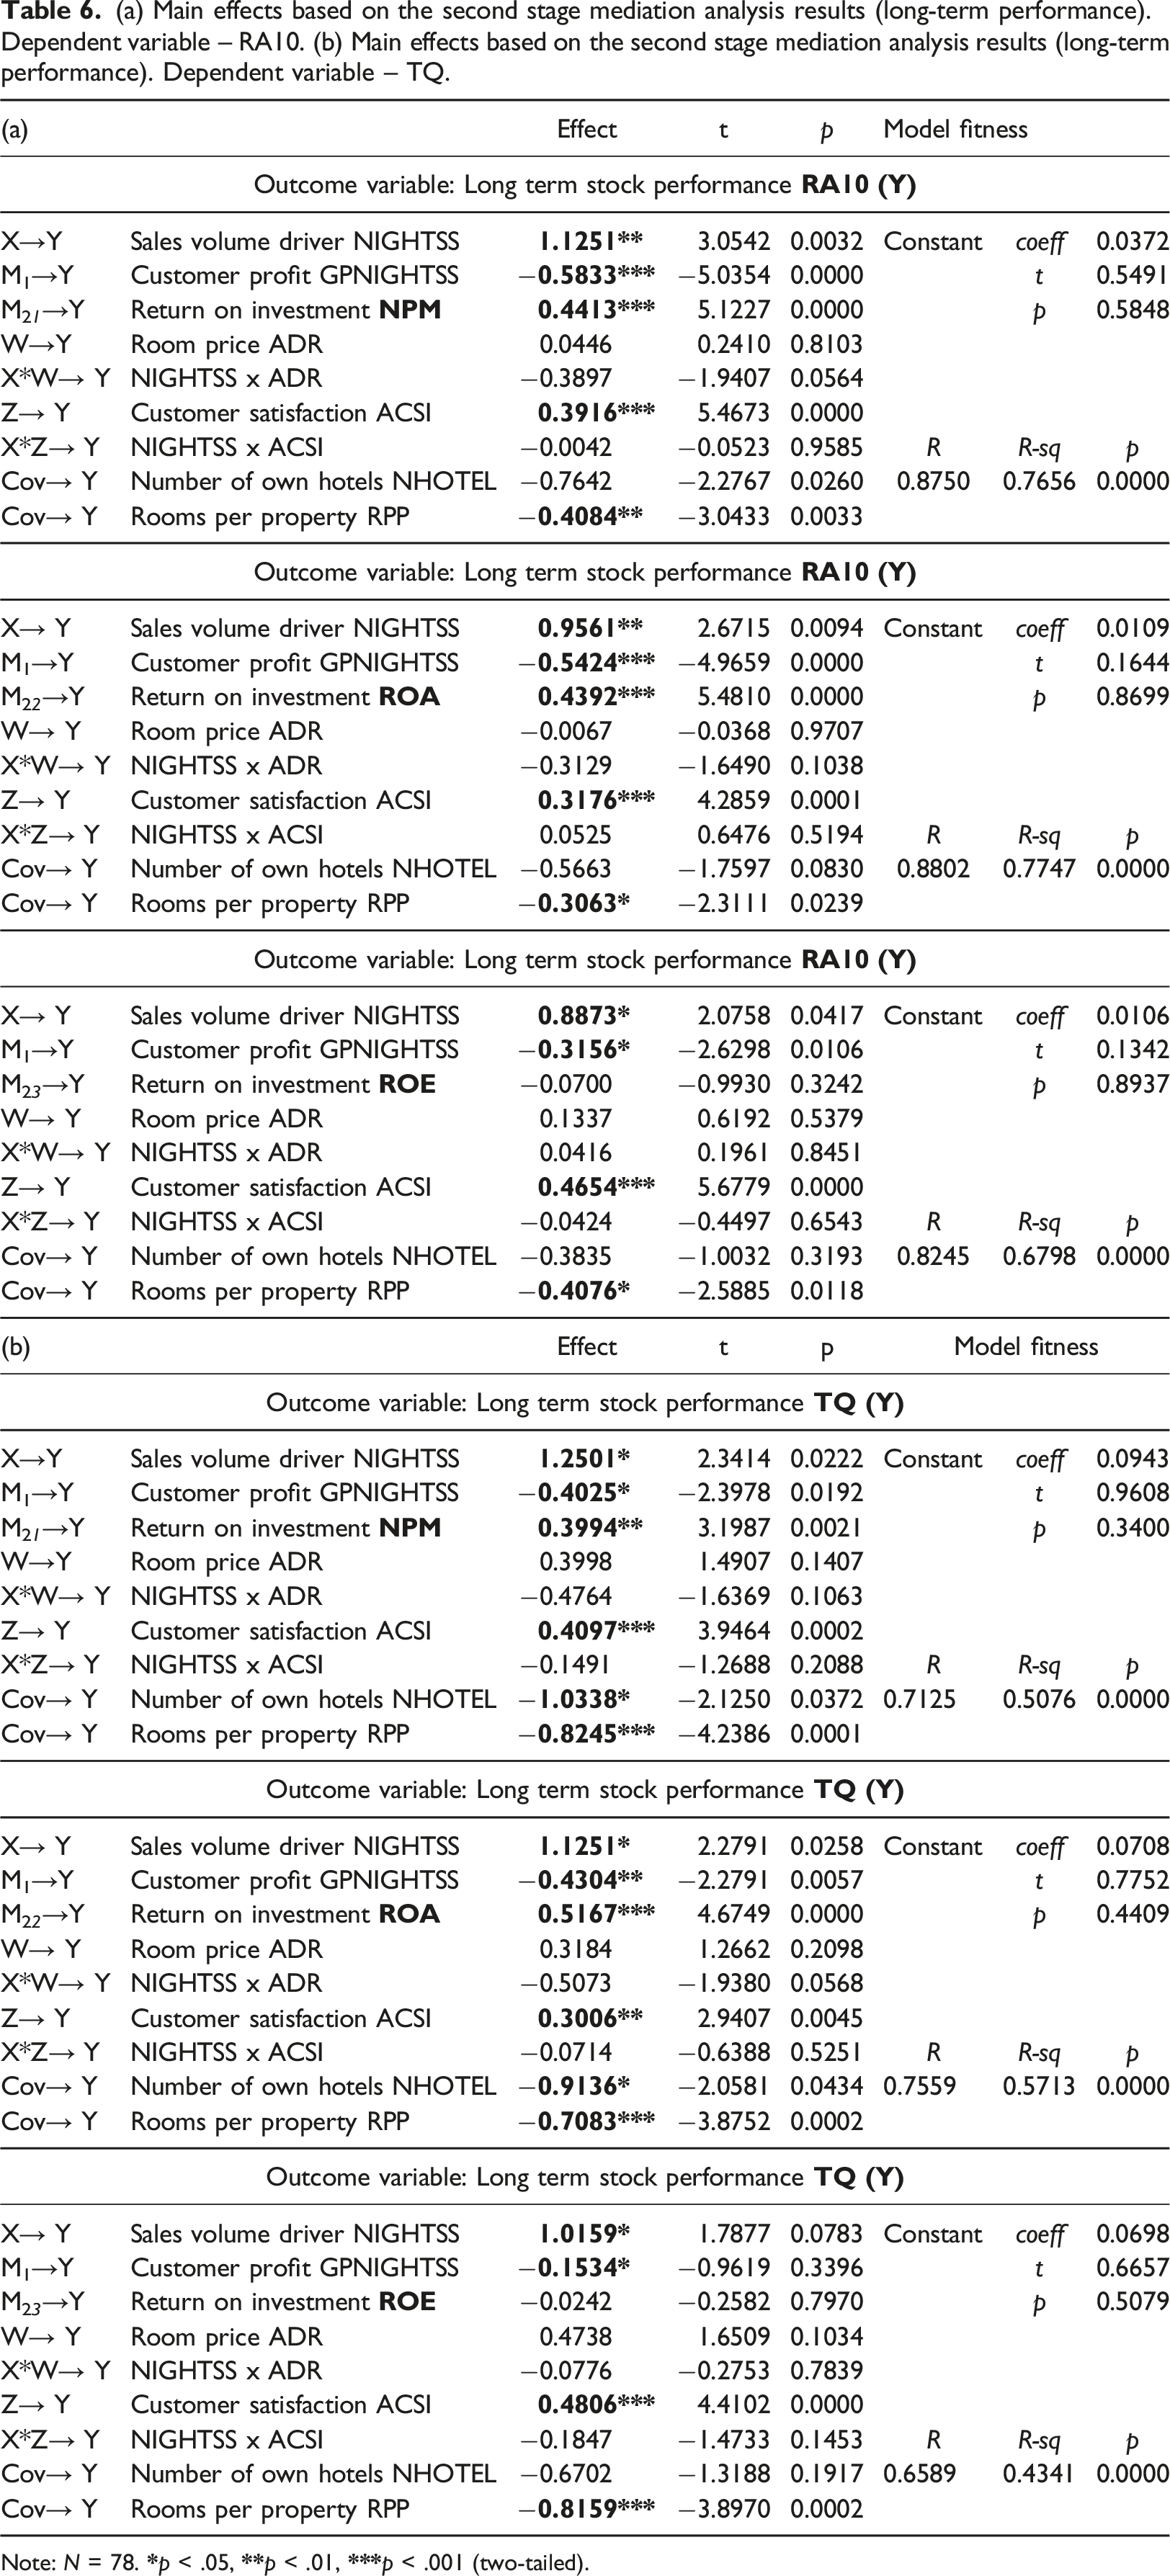
Note: N = 78.
The significant direct positive effect of the sales volume driver NIGHTSS on short-term performance (GPNIGHTSS) observed in the first-stage mediation analysis also remains for long-term performance in terms of RA10 but not for TQ. Importantly, no significant moderating effects of price (ADR) or customer satisfaction (ACSI) on these relationships are observed in the second-stage mediation analysis.
Customer profitability, as measured by GPNIGHTSS, is a significant negative predictor of long-term stock performance, primarily for RA10 (models with interaction terms). A possible explanation here is that GP reflects a higher price and might transfer a possible negative effect of ADR. Accounting profitability, as measured by NPM and ROA, has a significantly positive impact on both RA10 and TQ, whereas the impact of ROE on stock performance is generally insignificant (confirmed in models without interaction terms).
In terms of size, the negative effect on financial performance remains long term. That is, the negative effect of property size (RPP) on stock performance is significant in all the models. For example, in a model without interaction terms and including NPM, a one SD increase in RPP is related to a 0.39 SDs decrease in RA10.
Results of the moderated path analysis for hypotheses 4, 5, 6, and 7. Dependent variable Y - Risk-adjusted stock performance RA10.
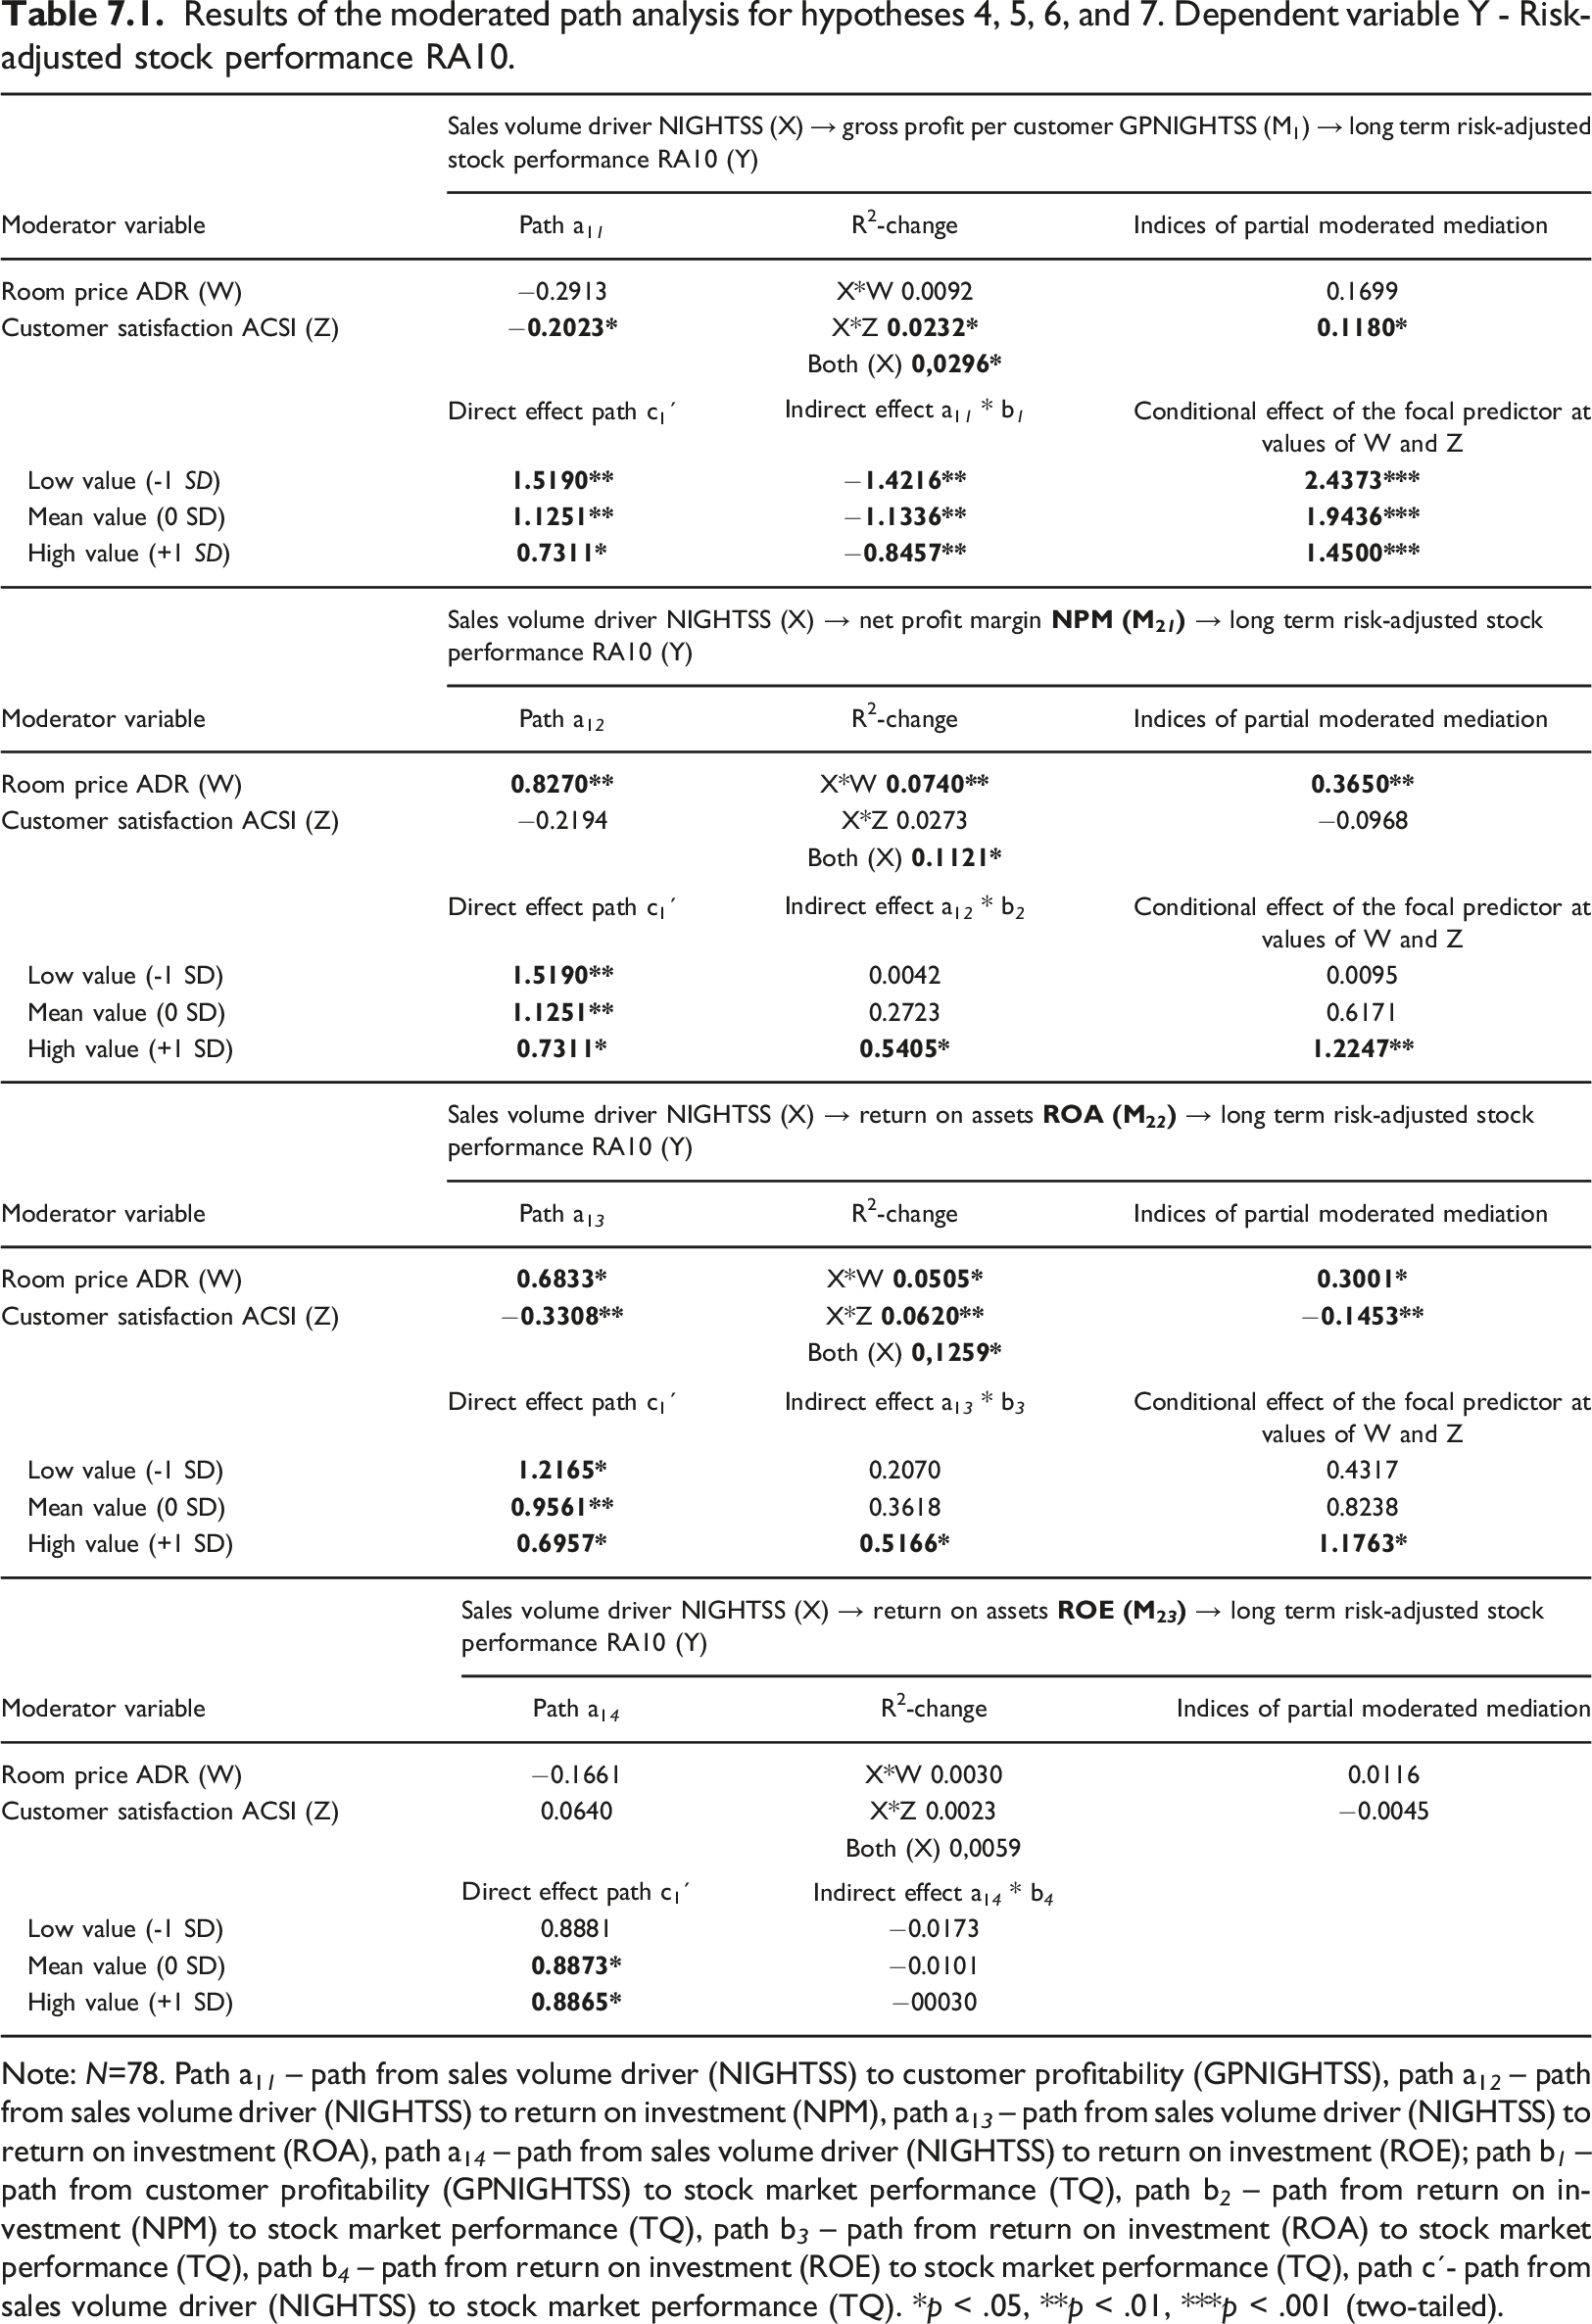
Note: N=78. Path a11 – path from sales volume driver (NIGHTSS) to customer profitability (GPNIGHTSS), path a12 – path from sales volume driver (NIGHTSS) to return on investment (NPM), path a13 – path from sales volume driver (NIGHTSS) to return on investment (ROA), path a14 – path from sales volume driver (NIGHTSS) to return on investment (ROE); path b 1 – path from customer profitability (GPNIGHTSS) to stock market performance (TQ), path b 2 – path from return on investment (NPM) to stock market performance (TQ), path b 3 – path from return on investment (ROA) to stock market performance (TQ), path b 4 – path from return on investment (ROE) to stock market performance (TQ), path c´- path from sales volume driver (NIGHTSS) to stock market performance (TQ). *p < .05, **p < .01, ***p < .001 (two-tailed).
Results of the Moderated Path Analysis for Hypotheses 4, 5, 6, and 7. Dependent variable Y - Tobin‘s q TQ.
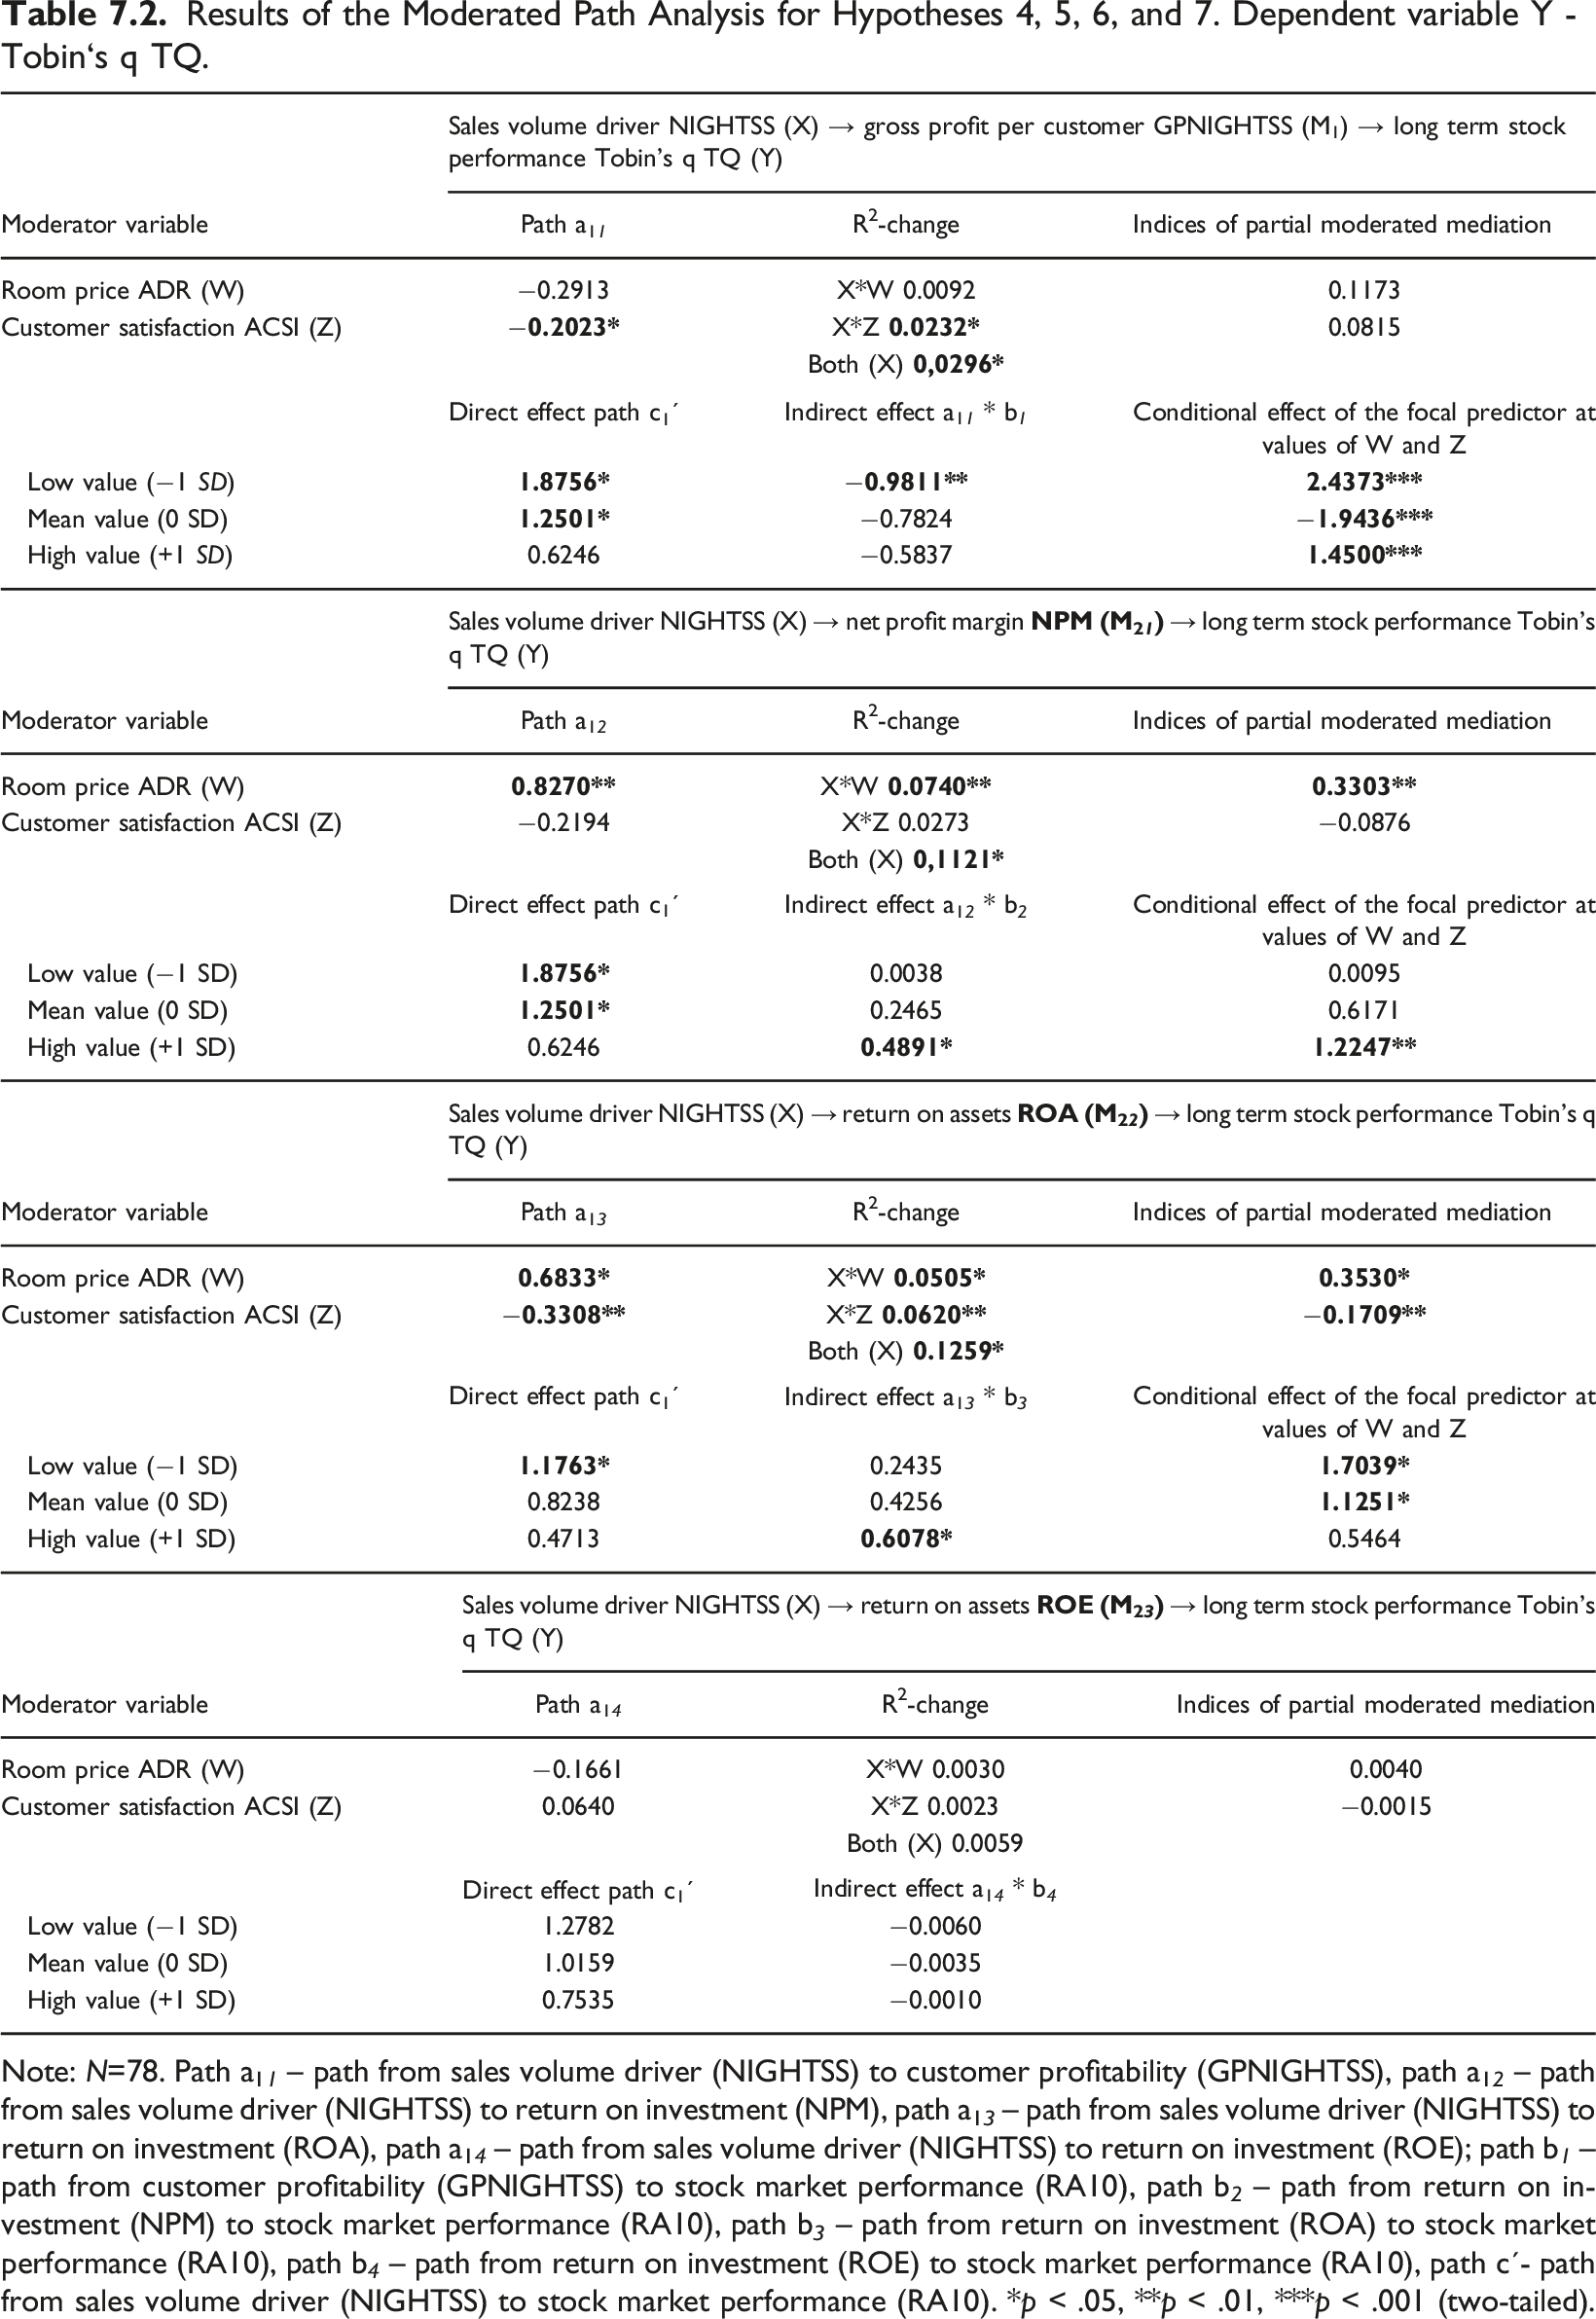
Note: N=78. Path a11 – path from sales volume driver (NIGHTSS) to customer profitability (GPNIGHTSS), path a12 – path from sales volume driver (NIGHTSS) to return on investment (NPM), path a13 – path from sales volume driver (NIGHTSS) to return on investment (ROA), path a14 – path from sales volume driver (NIGHTSS) to return on investment (ROE); path b 1 – path from customer profitability (GPNIGHTSS) to stock market performance (RA10), path b 2 – path from return on investment (NPM) to stock market performance (RA10), path b 3 – path from return on investment (ROA) to stock market performance (RA10), path b 4 – path from return on investment (ROE) to stock market performance (RA10), path c´- path from sales volume driver (NIGHTSS) to stock market performance (RA10). *p < .05, **p < .01, ***p < .001 (two-tailed).
The results for path a11 in the upper panel of Table 7.1 indicate evidence of moderated indirect effects of NIGHTSS on RA10 through GPNIGHTSS for customer satisfaction (ACSI) only and not for room price (ADR). That is, the index of moderated mediation for customer satisfaction (ACSI) was significantly different from zero (index I = 0.1180, confidence interval CI = [0.0021; 0.3361]), whereas this index was not significant for ADR (I = 0.1699, CI = [–0.0476; 0.5435]).
These results reveal that the indirect effect of NIGHTSS on stock performance (RA10) through GPNIGHTSS is consistently negative. However, at higher moderator value levels, both ADR and ACSI, the indirect effect is less negative. That is, at lower ADR and ACSI levels, a company scoring one SD higher for NIGHTSS is expected to score 1.42 SDs lower for RA10 because of higher GP per customer, which in turn lowers long-term performance. For higher price and customer satisfaction, the same indirect effect was –0.85 for higher ADR and ACSI, with one SD above its mean. This shows that, with an increase in price and customer satisfaction, the indirect negative effect of NIGHTSS on stock market performance through GPNIGHTSS is reduced. The indirect effect of NIGHTSS on TQ through GPNIGHTSS is also moderated in the upper panel of Table 7.2 (path a11), but the indirect effect for lower price and customer satisfaction is significantly different from zero (I = −0.9811, CI = [−23,131; −0.0006]); the indirect effects for average and high price and high satisfaction are non-significant. Overall, the moderated partial mediation model was supported.
In the second path mediation with accounting performance measures NPM, ROA, and ROE, the evidence for moderated mediation differs. In general, we find evidence for moderated mediation for moderator ADR and for mediator NPM in Tables 7.1 and 7.2 (path a12). This can be seen in the significant indices of moderated mediation for ADR, whereas the indices for ACSI were non-significant. The results reveal that at higher ADR and ACSI levels, the indirect positive effect of the sales volume driver NIGHTSS on long-term stock performance RA10 through accounting profitability NPM is higher (0.5405) and significant rather than the indirect effect of 0.0042 at a low ADR and ACSI levels (−1 SD). The effects are similar for TQ in Table 7.2. This shows that with an increase in room price and customer satisfaction, the indirect positive effect of room-nights sold on stock market performance through the net profit margin is elevated. In summary, the indirect effect of NIGHTSS on both RA10 and TQ through NPM depended on ADR but not on ACSI; hence, the moderated partial mediation model for mediator NPM was supported.
For ROA, we found evidence of moderated mediation for both moderators (price and satisfaction). In other words, in addition to price (ADR), the index of moderated mediation for customer satisfaction (ACSI) was also significant (I = −0.1453, CI = [−0.3265; −0.0391] for RA10, and I = −0.1709, CI = [−0.4081; −0.0486] for TQ). The results for Path a13 in Tables 7.1 and 7.2 reveal that the indirect positive effect of room-nights sold on stock market performance through ROA is higher for higher values of both room prices and customer satisfaction. 5 Hence, the indirect effects of NIGHTSS on RA10 and TQ through ROA depend on both price and satisfaction. The moderated partial mediation model for the mediator ROA was also supported.
Given that we find non-significant indices of moderated mediation for both ADR and ACSI in Table 7.1 and 7.2 the moderated mediation model for ROE was not supported.
Overview of hypotheses test results.
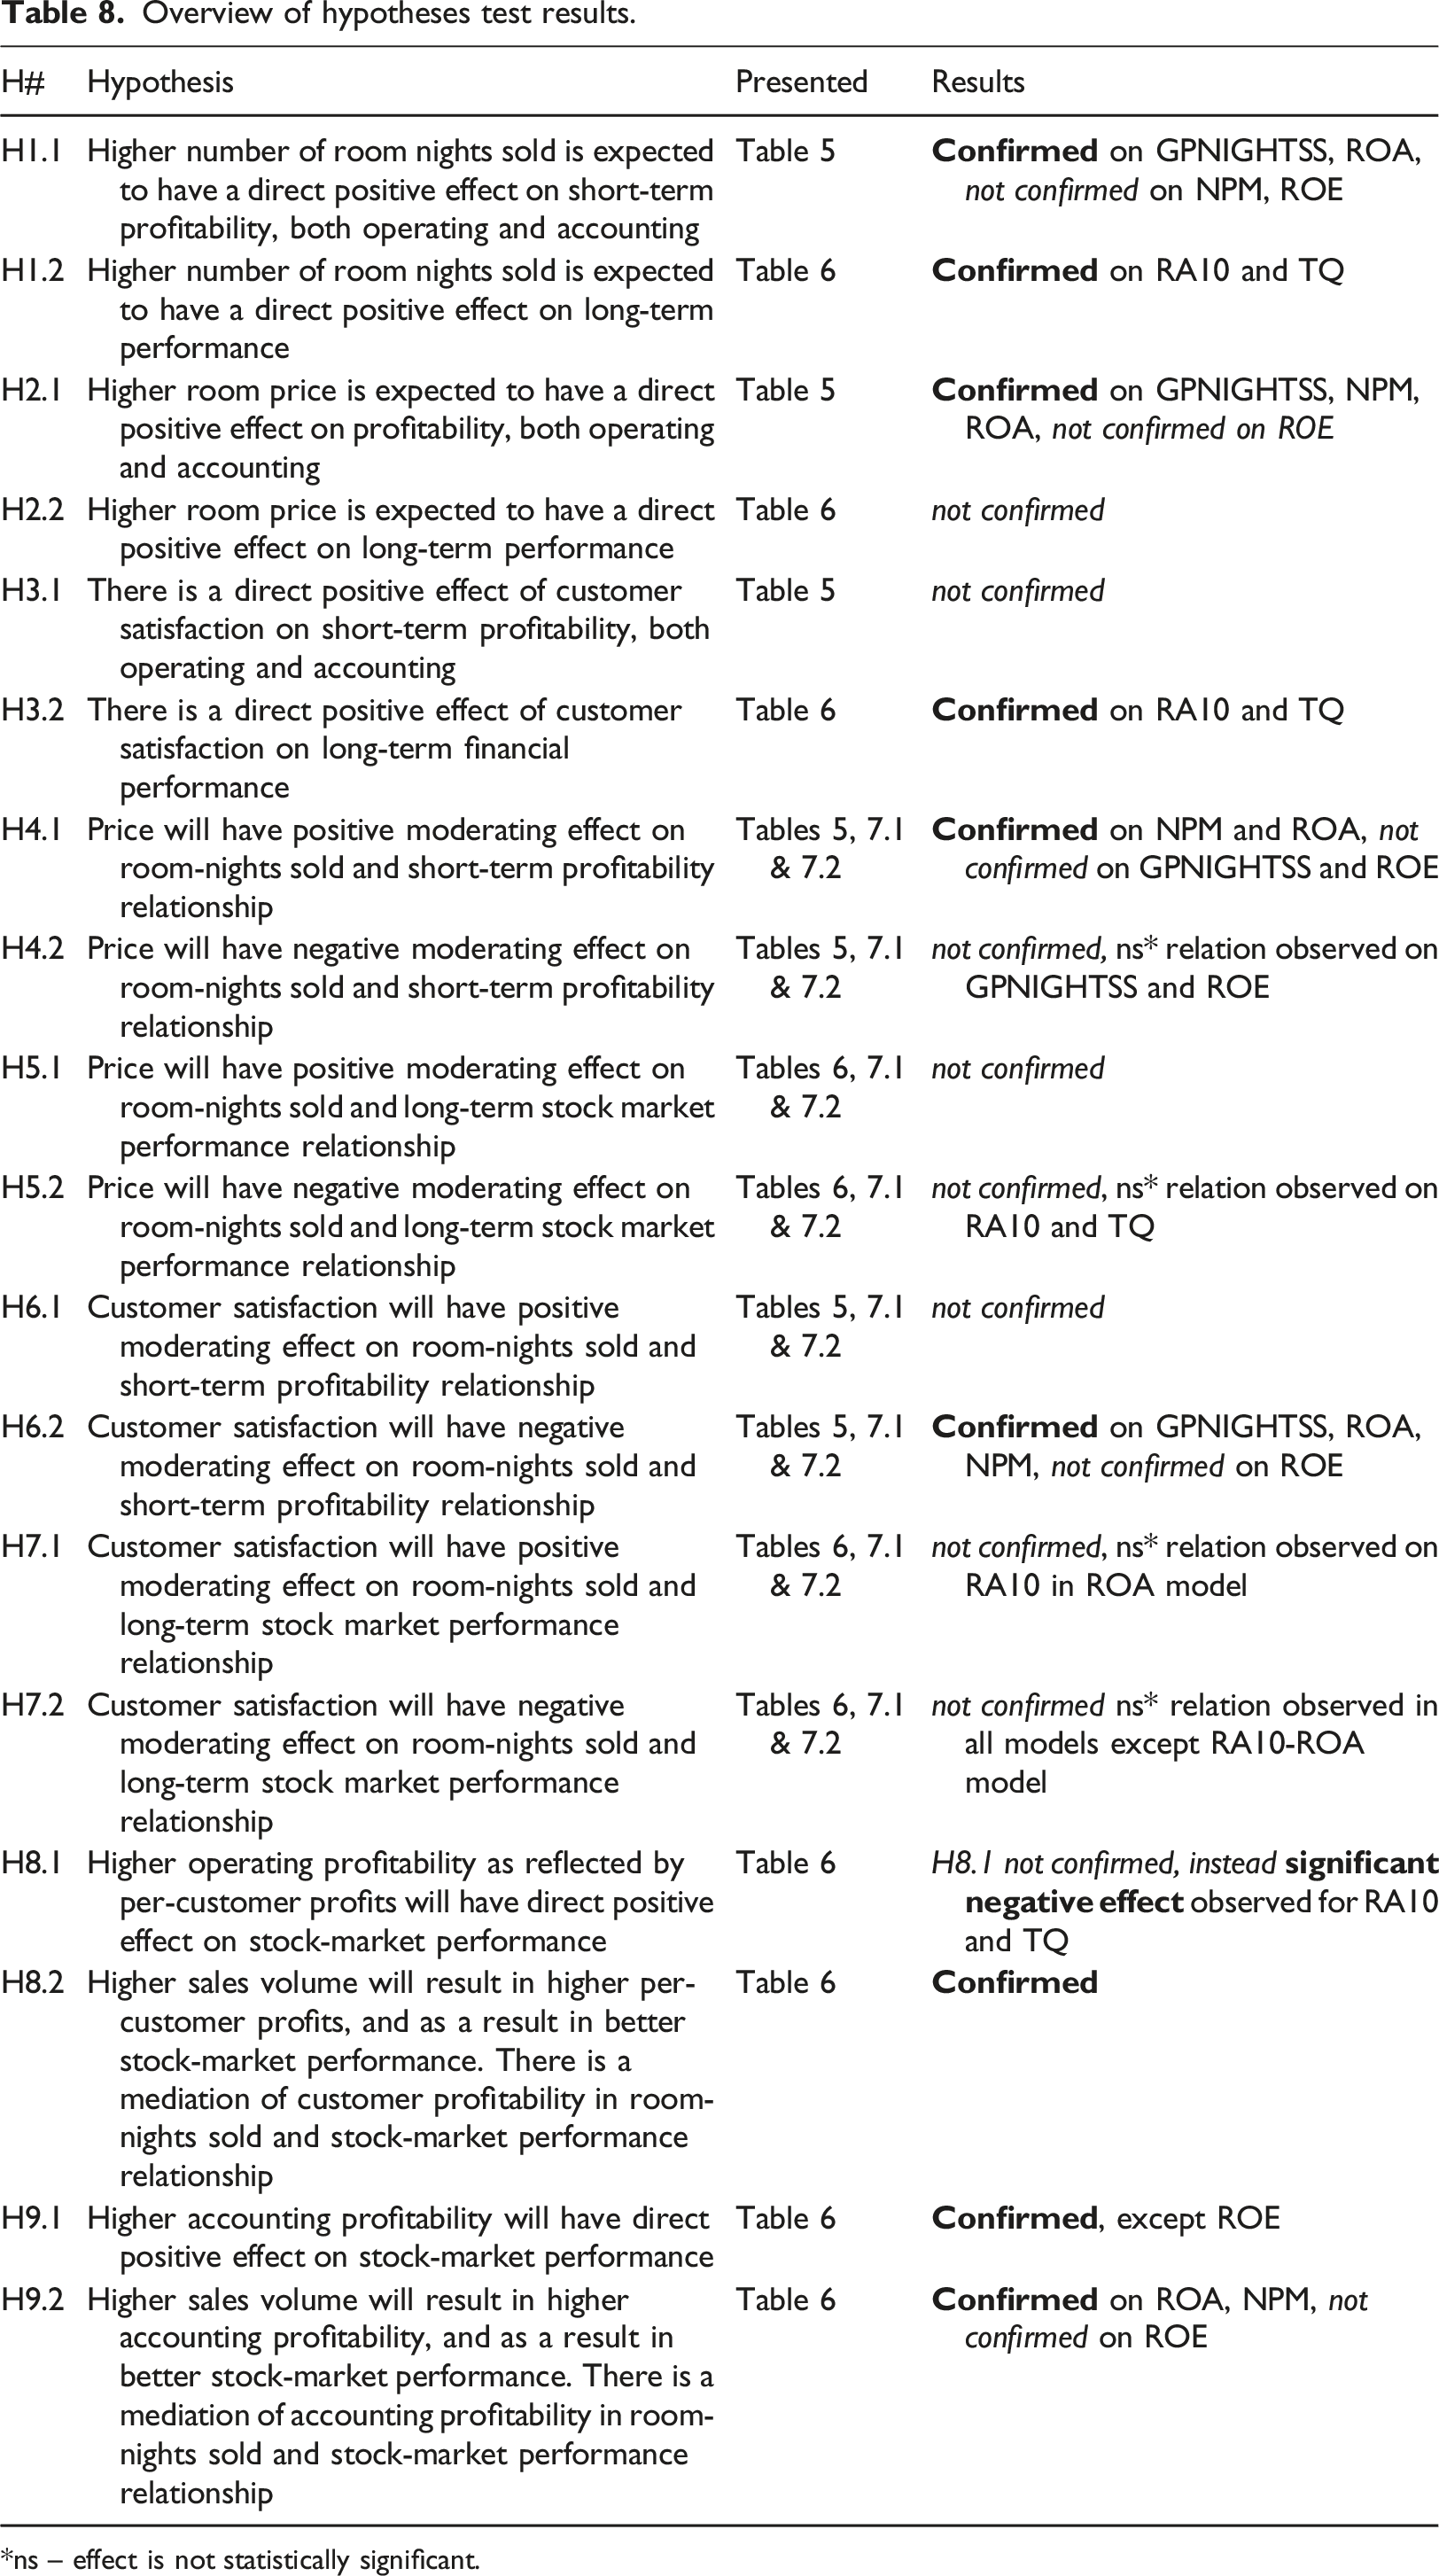
*ns – effect is not statistically significant.
Discussion
This study examines the financial performance of six hotel firms over a 17-year period from 2004 to 2020, focusing on the interaction effects of price and customer satisfaction on the relationship between room-nights sold and stock market performance through profitability. The study considered all three levels of organizational performance–operating, accounting, and capital market–and examined the effect of customer traffic through customer and accounting profitability on stock market performance. The study’s moderated mediation model was mainly supported (see Table 8 for further detail).
The findings suggest that customer satisfaction is more important than price in achieving long-term financial success in the hotel industry, whereas room-nights sold are significant positive drivers of all performance levels. There are several theoretical and practical implications to consider.
Theoretical implications
Significant effects of financial performance drivers.
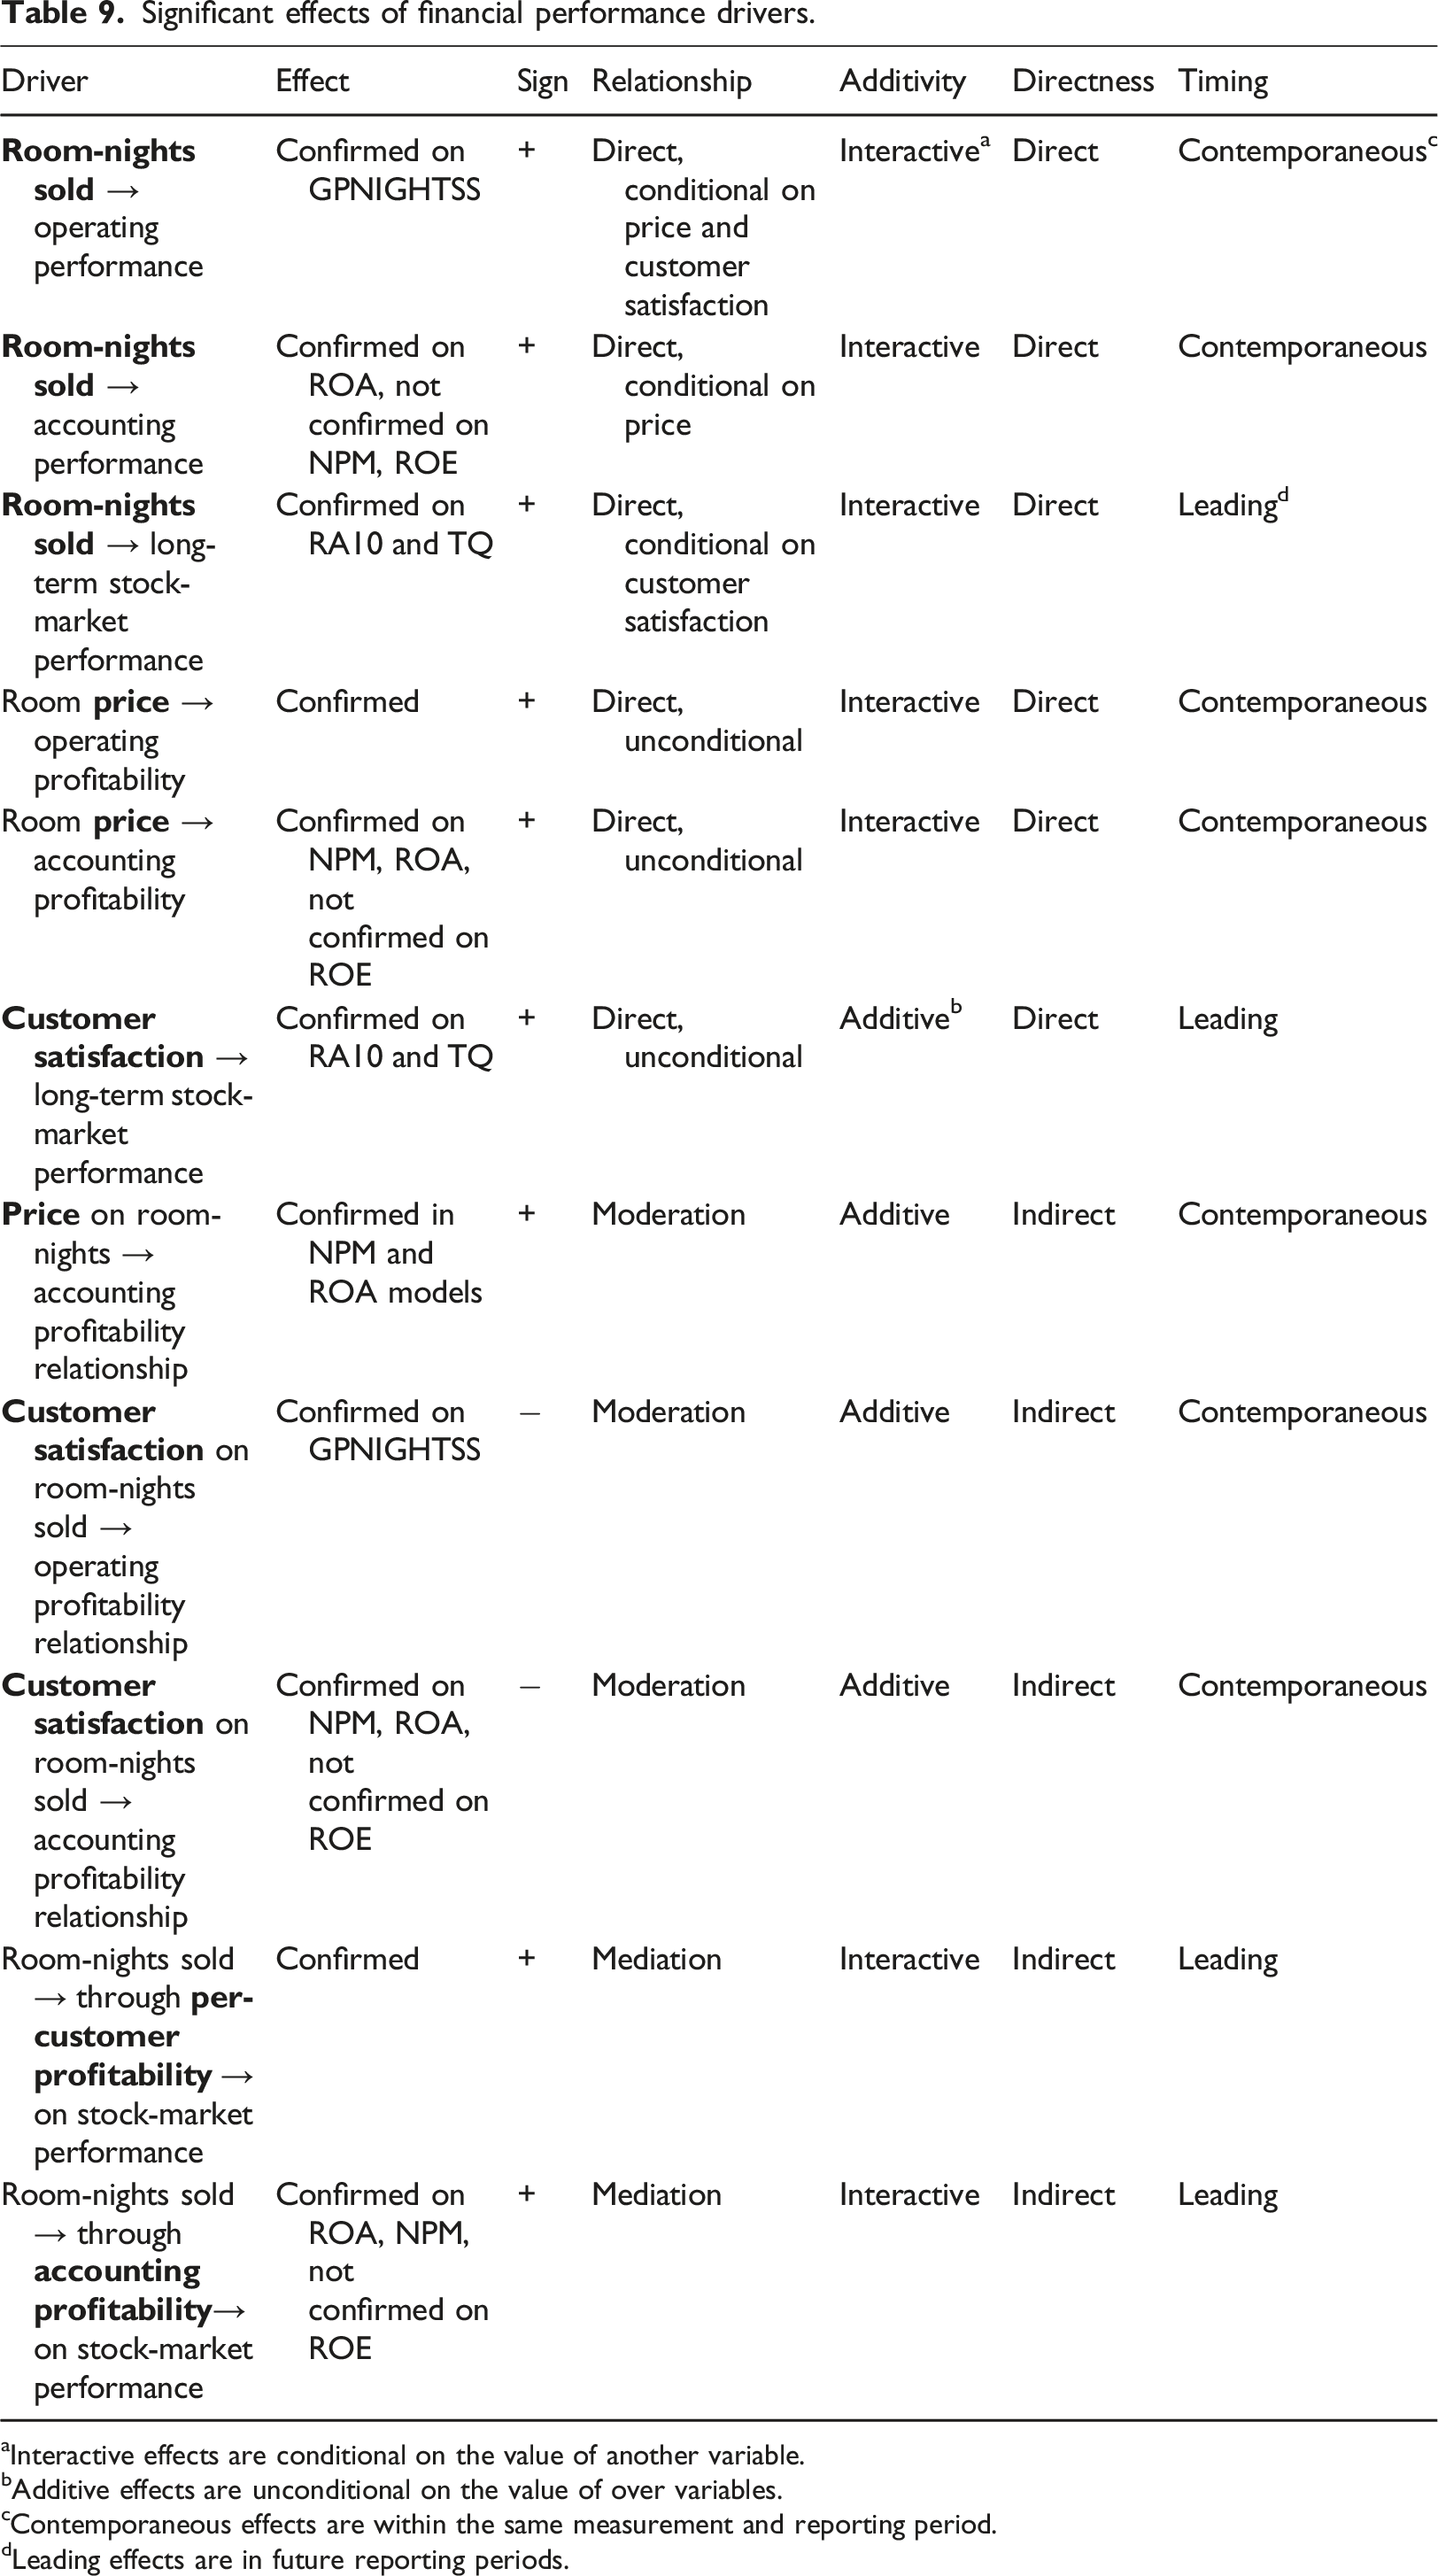
aInteractive effects are conditional on the value of another variable.
bAdditive effects are unconditional on the value of over variables.
cContemporaneous effects are within the same measurement and reporting period.
dLeading effects are in future reporting periods.
The analysis revealed interesting timing differences between room price and customer satisfaction in relation to financial performance. Thus, the expected positive effects of higher room price (ADR) on financial outcomes were only significant for the short-term perspective, specifically operating customer profitability (GPNIGHTSS) and accounting profitability (NPM, ROA). Thus, a 61.35-dollar increase in ADR (one SD) was associated with a 2.91-dollar increase in GPNIGHTSS (0.66 SDs), a 7.6% points increase in NPM (0.59 SDs), and a 3.9%-points increase in ROA (0.65 SDs). From a long-term stock market perspective, price had no significant effects on performance (RA10 and TQ).
On the other hand, customer satisfaction (ACSI) had negative contemporaneous effects on GPNIGHTSS with a 2.86-point increase in the ACSI index (one SD) related to a 9.38-dollar decrease in GPNIGHTSS (0.22 SDs), but a positive contemporaneous effect on ROA of 1.38 %-points (0.23 SDs). However, the lead effect of customer satisfaction on stock market performance was significantly positive for both RA10 and TQ. Specifically, a 2.86-point increase in the ACSI index (one SD) caused a meaningful 6 increase in the risk-adjusted stock return RA10: a 0.13%-points increase in the NPM model (0.39 SDs), 0.11%-points in the ROA model (0.32 SDs), and 0.16%-points (0.47 SDs) in the ROE model, as well as in the TQ ratio of market value: NPM model, 0.269 points (0.41 SDs); ROA, 0.197 points (0.30 SDs); and ROE, 0.315 points (0.48 SDs). These results contradict those of Ittner et al. (2009), who found that ACSI scores predict future operating income, but there is no evidence that ACSI predicts long-run returns. At the same time, the previous findings of Aksoy et al. (2008) that the market responds to the ACSI in the longer term are in line with our results.
This study extends the extant empirical evidence in the ACSI research to the lodging industry. Our findings validate previous studies that employ larger aggregate databases across various industries, as we demonstrate a positive additive direct leading relationship between ACSI and stock market performance within the lodging industry (Aksoy et al., 2008; Fornell et al., 2006; Ittner and Larcker, 1998). Unlike Sun and Kim’s (2013) research on the hospitality and tourism industry, our study, which relied solely on manually collected hotel data, found significant positive effects of ACSI on Tobin's q and RA10. That is, different hospitality industries feature different price-traffic relationships, and customer satisfaction impacts these relationships differently (Anderson et al., 1997; Anderson et al., 2004). Thus, industry-specific effects may not be observable in the aggregate sample. For instance, in this study, gross profit per room-night (GPNIGHTSS) was negatively related to risk-adjusted stock market performance, whereas a similar metric was consistently positive in a restaurant sample (Demydyuk et al., 2015).
Finally, customer traffic, as measured by room-nights sold (NIGHTSS), appeared as a positive direct leading indicator of stock market performance (TQ, RA10) conditional on customer satisfaction (ACSI). Specifically, under condition of higher price and customer satisfaction, a 44.013-unit increase in NIGHTSS (one SD) caused a roughly 0.003% change in the risk-adjusted stock return and a roughly 0.734-points increase in Tobin’s q (0.01 and 1.12 SDs, respectively), varying across models using different profitability variables. This relationship is further supported by the higher stock price returns and the lower systematic risk of individual stocks. 7 Importantly, the contemporaneous positive direct effect of NIGHTSS on accounting profitability (5%-points in ROA or 0.83 SDs) is conditional on price (ADR), whereas its contemporaneous positive direct effect on operating profitability of 85.39-dollar in GPNIGHTSS (1.94 SDs) is conditional on both price and customer satisfaction. In summary, in contrast to other metrics, customer traffic positively predicted financial performance at all performance levels.
Notably, the moderating effects of both ADR and ACSI were mainly significant in the first-stage mediation (short-term profitability) but were not valid for direct traffic—stock market performance relationships. Similar to Hsu and Jang’s (2008) findings, NPM and ROA exhibit significant positive relationships with risk-adjusted stock performance in all models and both types of relationships, direct and mediating. Return on equity (ROE) in turn, did not show statistically significant relationships with the other variables. Based on the regression coefficients and model fitness, ROA appears to be the best accounting metric for analyzing a hotel company, whereas ROE is the least suitable.
To conclude, this study identifies hotel customer traffic measured by NIGHTSS as a significant positive interactive predictor of financial performance across all levels, operating, accounting, and capital markets. Our results emphasize the contemporaneous nature of the positive price effects on profitability and the leading positive effects of customer satisfaction on stock market performance. Based on the level of performance, the positive effects of customer traffic are conditional on the price, customer satisfaction, or both. Therefore, room-nights sold, price per room, and customer satisfaction can be considered key drivers of financial performance in the hotel industry.
Practical implications
The results of this study offer important practical implications by clearly differentiating between short-term tactical decision-making contexts, and long-term strategic decisions. Based on the empirical results, customer satisfaction (ACSI) has a positive effect on long-term financial performance and a negative effect on short-term profitability, whereas ADR effects have a reverse timespan. However, room-nights sold (NIGHTSS) is a relevant positive performance driver at all performance levels.
As a performance metric, NIGHTSS can be identified with a customer; thus, it can provide a clear basis for developing value propositions and constellations from which customers can derive value and provide feedback. As room inventory represents the main cost driver in lodging, the current widely used metrics are not surprisingly inventory-based and capacity-focused (e.g., RevPAR and occupancy rate % measure per available room). Despite the usefulness of these metrics for other purposes, it is difficult or impossible to integrate them into the customer metrics. Thus, using per room-night sold or per customer metrics for analysis and planning can facilitate users’ involvement and acceptance, leading to the better use of control systems and higher quality of analysis and helping the hosts to stay in control of profit targets.
Emphasizing the importance of including customer metrics in performance measurement systems (Assaf and Magnini, 2012; Carlbäck, 2010; McManus, 2013), hosts should adjust their prices and focus on long-term goals instead of being distracted by the initial negative effects of customer satisfaction on profitability due to higher costs. In lodging, customer satisfaction does not have a quick effect; as for instance, in restaurants. A satisfied or unsatisfied guest will consider returning only after some time if ever. Therefore, the hotel industry should further improve and systemize the understanding of customer satisfaction determinants and their influence on financial performance for value-informed decision making, such as pricing (e.g., Ingenbleek, 2014) and resource allocation (Andersson and Carlbäck, 2009; Carlbäck, 2022).
Although the integration of customer satisfaction into performance management systems can be a complicated process, security analysts and investors can include customer satisfaction in their analytical toolbox. Analysts use various nonfinancial indicators, including RevPAR, Occupancy and ADR, for revenue growth forecasts. Our empirical results suggest that ACSI and NIGHTSS capture stock market performance better than ADR or RevPAR do. Considering the solid empirical evidence in the extant literature and the results of this study, ACSI and other customer satisfaction indexes could be used broadly for lodging investment decisions.
Limitations and directions for future research
The main limitation of this study was the accessibility of the information. The sample was not only limited to US-based publicly traded hotel chains but was also limited to companies with publicly available data necessary to conduct this research. Furthermore, the data up to 2020 contained even smaller sample, owing to changes in ownership, making the appropriateness of the inclusion of this highly disruptive year questionable. The analysis in this study was aimed at a longitudinal period covering different economic conditions, focusing on the main relationships. Due to the small sample size, it was not possible to isolate crisis years and analyze them separately. Therefore, we ran an additional test without 2020 to ensure the consistency of the main findings. However, the results may contain effects that require further investigation, using a sufficient amount of data. The small sample size also made it difficult to explain the stock market perspective and generalize the findings. Another limitation in generalizing the findings is that the sample consisted of luxury and upper-scale properties, which are especially different from the small independent operators.
While the unavailability of data is rather difficult to overcome by any researcher, especially for multiple firms, there are further limitations to this study that can be addressed by future research. Public corporate data are generic and do not allow the analysis of different service models, concepts, and markets. The need to perform additional computations based on these assumptions limited the accuracy of the results of this study. This limitation also extends to the relevance of ACSI company scores, which include satisfaction with all branded hotels, whereas this study includes only hotels under their own management. Moreover, customer satisfaction is likely to be measured with error, not least because of the arbitrary nature of score assignment, which is based on the judgments of individuals and can vary depending on the population.
Similarly, revenue and expense data from financial reports are very general, and using notes for financial statements does not allow for more detailed analysis. Extending corporate data to property-level data would make such an analysis more reliable and insightful. As a direction for future research, expanding the level of detail to include individual establishments, service models, and customer-associated details would provide more insight and examples of how the findings and recommendations can be applied in practice. The prerequisite for such research is access to past and future point-of-sale records, for example, from a large hotel chain. If such an opportunity is available, customer data can be collected in a similar cross-level model, particularly by verifying its leading and contemporaneous effects.
Additionally, the model in this study was built on the additive effects of both customer satisfaction and room price, assuming no interaction between these two variables. Future modelling could test the interactive relationships between these two variables within a similar profitability model. In addition, future work could review stock recovery in relation to customer metrics for a longer time span and over periods of peaks and troughs in the economy, such as the recession and COVID-19 pandemic. Doing so should enable a better understanding of price-traffic relationships and customer perceptions of price relative to satisfaction as long-term performance drivers.
Footnotes
Acknowledgements
We thank the 8th IATE conference participants for providing valuable comments and advice.
Declaration of conflicting interests
The author(s) declared no potential conflicts of interest with respect to the research, authorship, and/or publication of this article.
Funding
The author(s) received no financial support for the research, authorship, and/or publication of this article.