
Abstract
This paper examines the tourism markets’ convergence hypothesis across South Korea’s major source markets. In doing so, we use monthly data of visitor arrivals over the period July 1995 to June 2019 and adopt a novel quantile unit root tests that allows for multiple structural breaks via a Fourier expansion series. Our results indicate that seven countries out of 10 show firm convergence tendencies at most of the quantiles, and two countries have weak but significant converging trends at some quantiles.
Introduction
The central aim of this paper is to investigate the stationarity of tourist arrivals in South Korea from its 10 major source countries. Our motivation to examine convergence for tourist arrivals is two-fold. First, on the policy front, it is important to investigate whether a shock to the international tourist arrivals is permanent (tourist arrivals is I(1) process) or temporary (tourist arrivals is I(0) process). In particular, shocks to the tourism sector can cause volatility in tourism and foreign exchange revenues. If a tourist arrival series is I(1), then any shock to the tourist arrivals can cause a permanent shift from one level to another equilibrium level. This means that policy makers need to decrease reliance on the tourism industry by diversifying toward other industries. If tourist arrivals is I(0) otherwise, the series then is mean reverting following the shock. The implication is that governments can implement policies that help promote tourism. Second, tourist arrivals convergence has forecasting implications as well. Specifically, one can use any simple model for forecasting and any regression model if tourist arrivals is I(0). If a tourist arrival series is I(1), then forecasting model needs to be established based on non-stationary specification and the series cannot be used for regression model.
This paper focuses on South Korea because South Korea as a peninsula with a physical size similar to the US state of Kentucky, and generates the third largest tourism revenue in East Asia. Moreover, in the Travel and Tourism Competitiveness Report of the World Economic Forum (WEF), South Korea ranked 16th out of 140 countries. Tourism plays a vital role in South Korea’s economic growth. Before the outbreak of COVID-19 pandemic, the country’s tourism sector was growing constantly and was recording a new peak in the number of visitor arrivals. In 2018, tourism industry accounted for 4.7% of South Korean’s gross domestic product (GDP) and 5.3% of total employment. 1 The most popular city in South Korea is Seoul. The birthplace of K-pop and the Korean wave (also known as “Hallyu”), Seoul in 2019 ranked the 23rd most popular cities in the world with 9.11 million tourists. 2 Given the importance and rapid development of South Korean tourism industry, this paper examines whether South Korea’s 10 major tourist source markets are converging using monthly data from July 1995 to June 2019. 3
The work on investigating convergence for tourist arrivals is pioneered by Narayan (2006). Since then it has become an emerging topic in the recent tourism economics literature. To evaluate the convergence hypothesis of tourism markets, researchers mainly use the unit root tests and most of them find supporting evidence of convergence among major source countries (see e.g. Lean and Smyth, 2008; Lee, 2009; Ozcan and Erdogan, 2017). Another stream of more recent studies employs the log t test developed by Phillips and Sul (2007) for club convergence and provides mixed evidence (see e.g. Kourtidis et al., 2018; Me´rida et al., 2016; Pizzuto and Sciortino, 2021; Polemis et al., 2023). It is worth mentioning that the variants of unit root tests used in the literature do not consider the possibility of asymmetric convergence speed. In regards to the test for convergence in clubs, selection of split variables 4 remains one of the challenges in the convergence literature. Geographical locations and level of income are the two most widely used split variables in tourism economics literature. However, the top 10 countries by visitor arrivals to South Korea are relatively less heterogeneous in geographical locations 5 and income level. 6
The main purpose of this paper is to investigate the issue of convergence in the tourism markets of South Korea based on visitor arrivals from its major source countries. We contribute to the literature in two ways. Our principal contribution is that considering the possible asymmetric convergence speed, we adopt a novel quantile unit root test proposed by Bahmani-Oskooee et al. (2018). Specifically, the test captures asymmetric dynamics by allowing different speed of adjustment at various quantiles of visitor arrivals distribution. Furthermore, all visitor arrivals series experienced structural breaks due to the negative exogenous shocks such as outbreak of SARS. It is therefore possible that visitor arrivals series have outliers. The new method enables us to control for misspecification of errors associated with non-normality and in the presence of such outliers. Our second contribution is that, to the best of our knowledge, this is the first study to test the tourism markets’ convergence hypothesis across South Korea’s major source markets.
The rest of this paper is structured as follows: Data and Model and empirical methodology present the data used and the empirical methodology adopted in this study. Empirical results reports empirical findings, and Conclusion concludes.
Data
The data used in the present study are monthly total visitor arrivals to South Korea and visitor arrivals from 10 major source countries. These countries are China, Japan, the US, Taiwan, Hong Kong, the Philippines, Thailand, Indonesia, Malaysia, and Vietnam.
7
All data series are retrieved from Datastream. The sample period is from July 1995 to June 2019. Figure 1 plots the time path of visitor arrivals to South Korea from its 10 main source countries. It is evident from Figure 1 that South Korea’s tourism sector suffers its worst year on record in 2015, with the massive drop in visitor arrivals from most of the major source countries due to the Middle East respiratory syndrome (MERS) outbreak in South Korea. Plot of visitor arrivals to South Korea (July 1995 to December 2019).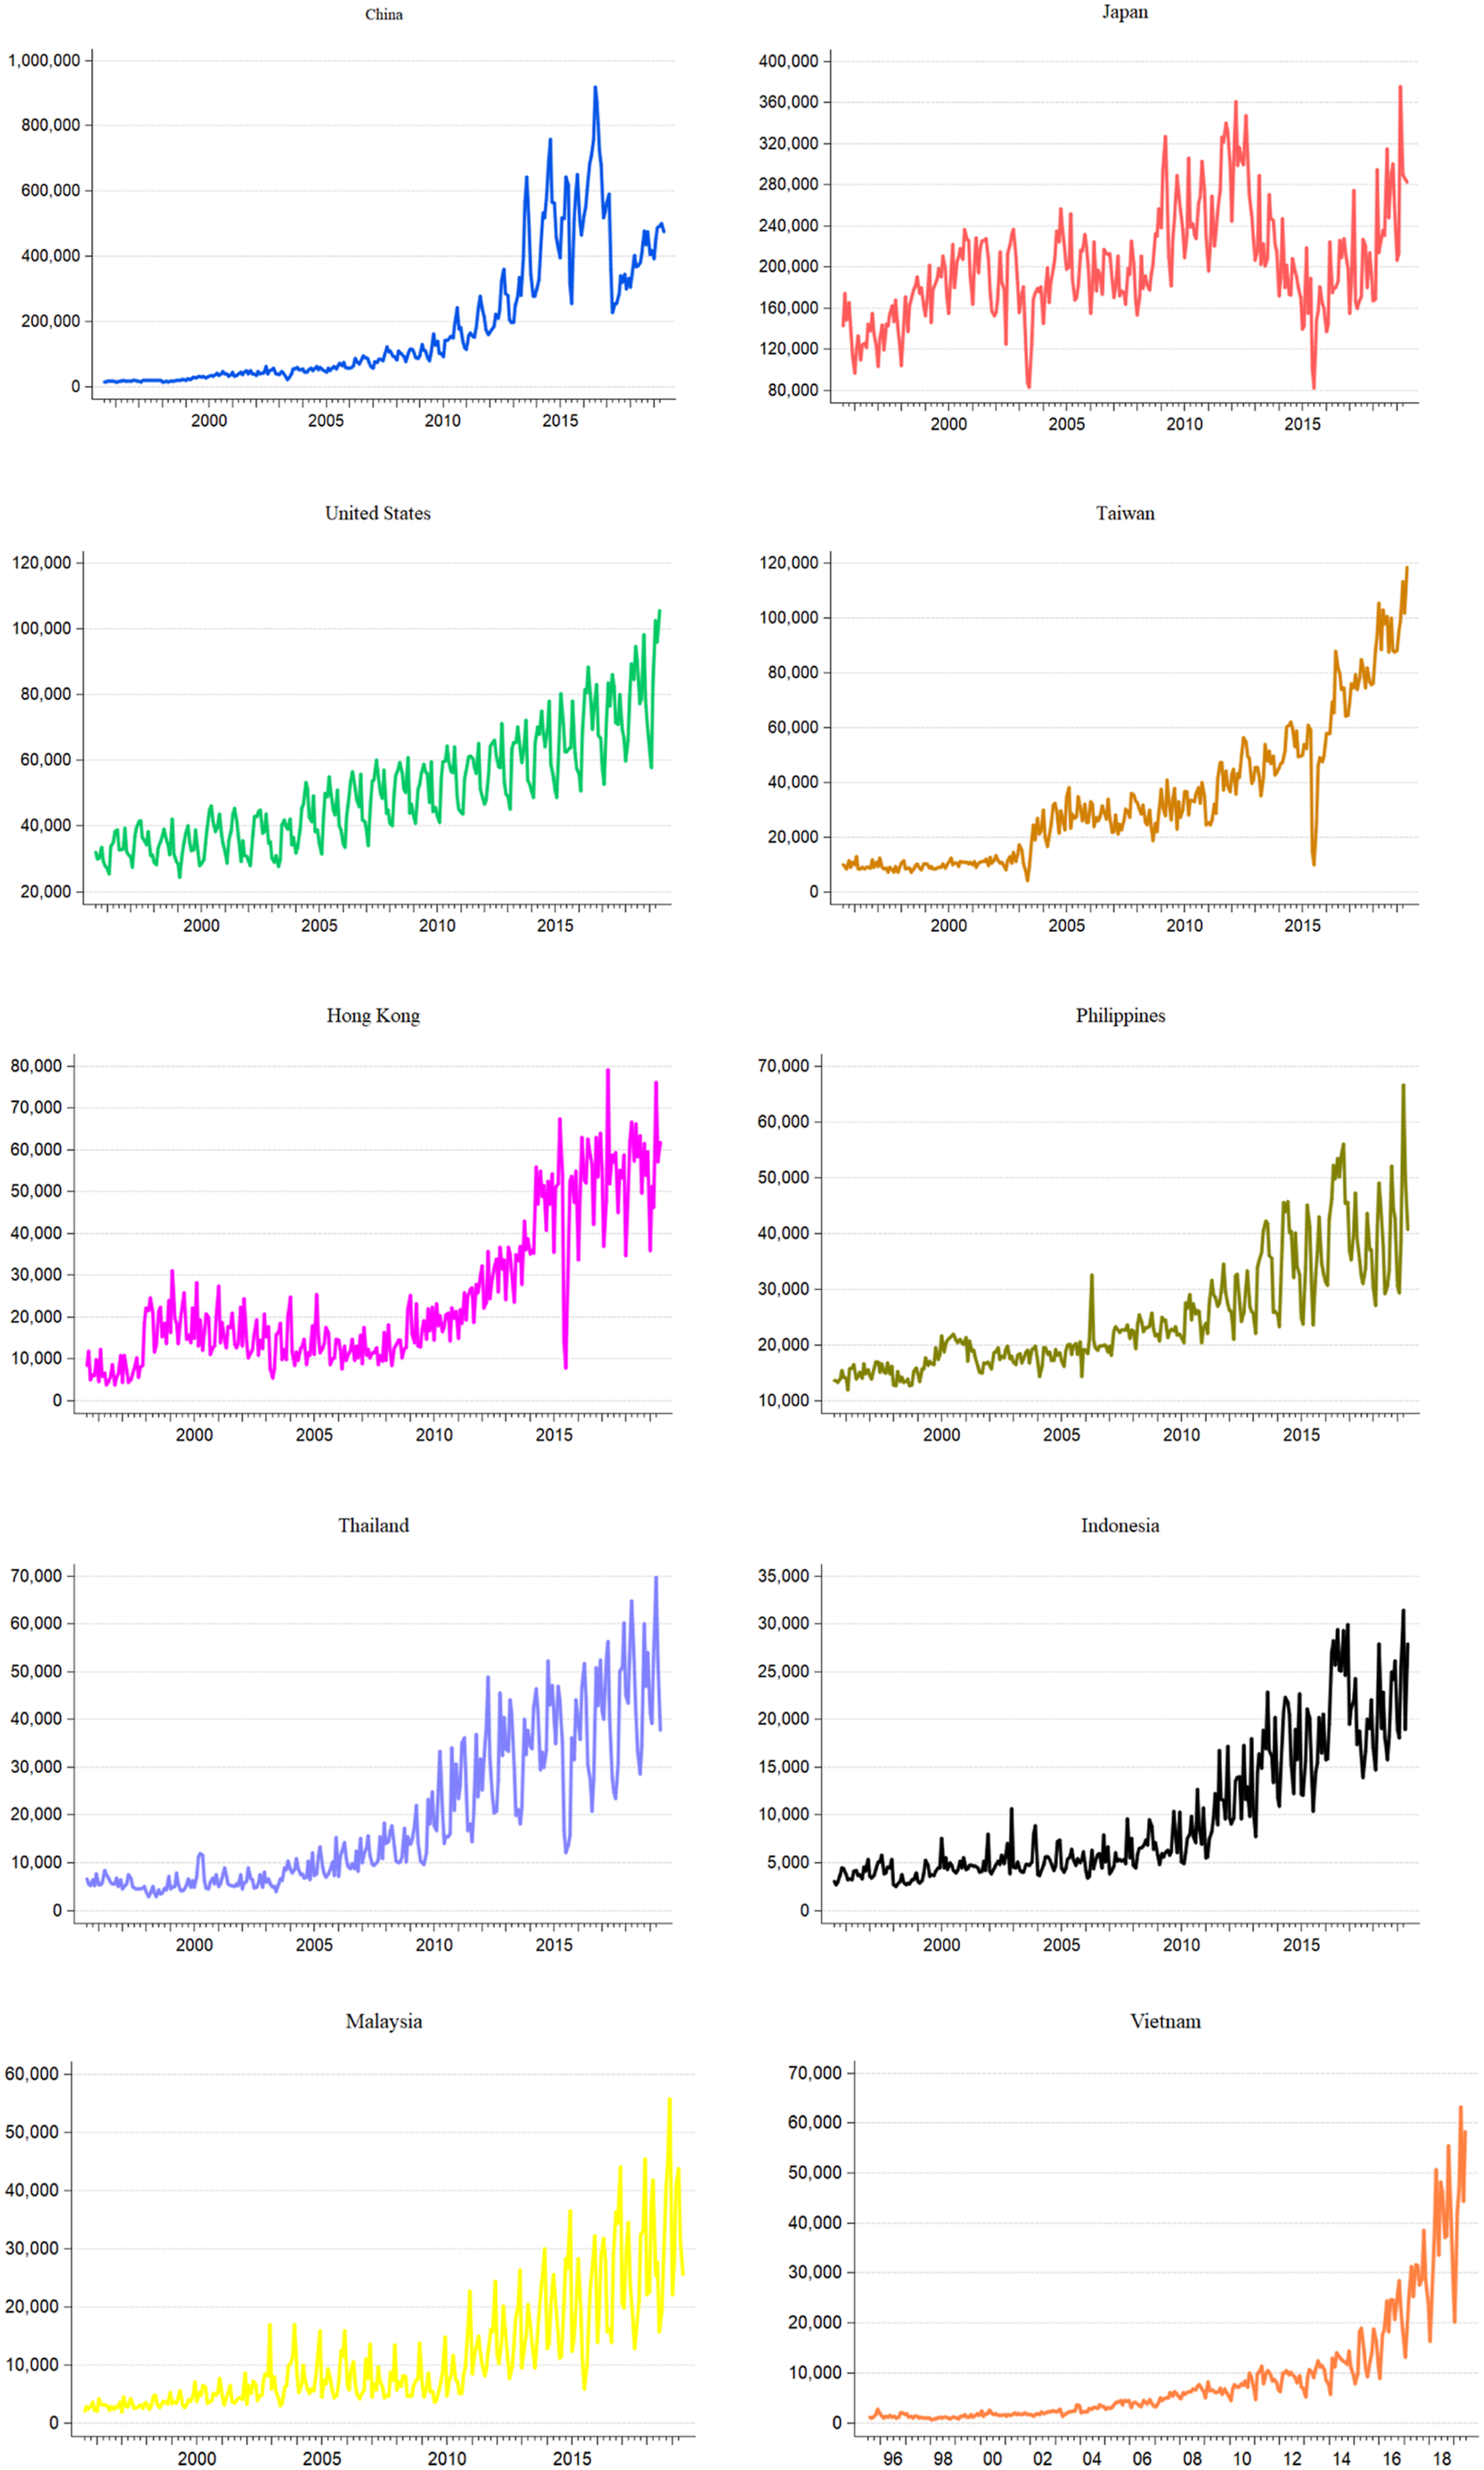
Model and empirical methodology
Model
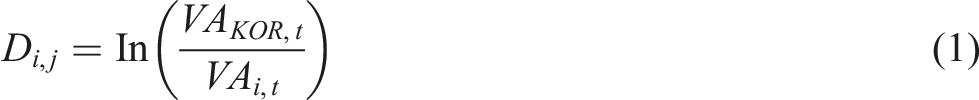
Following Narayan (2006), the idea of examining whether South Korean tourism markets are converging can be specified in equation (1) below:
Summary statistics of log difference in visitor arrivals.
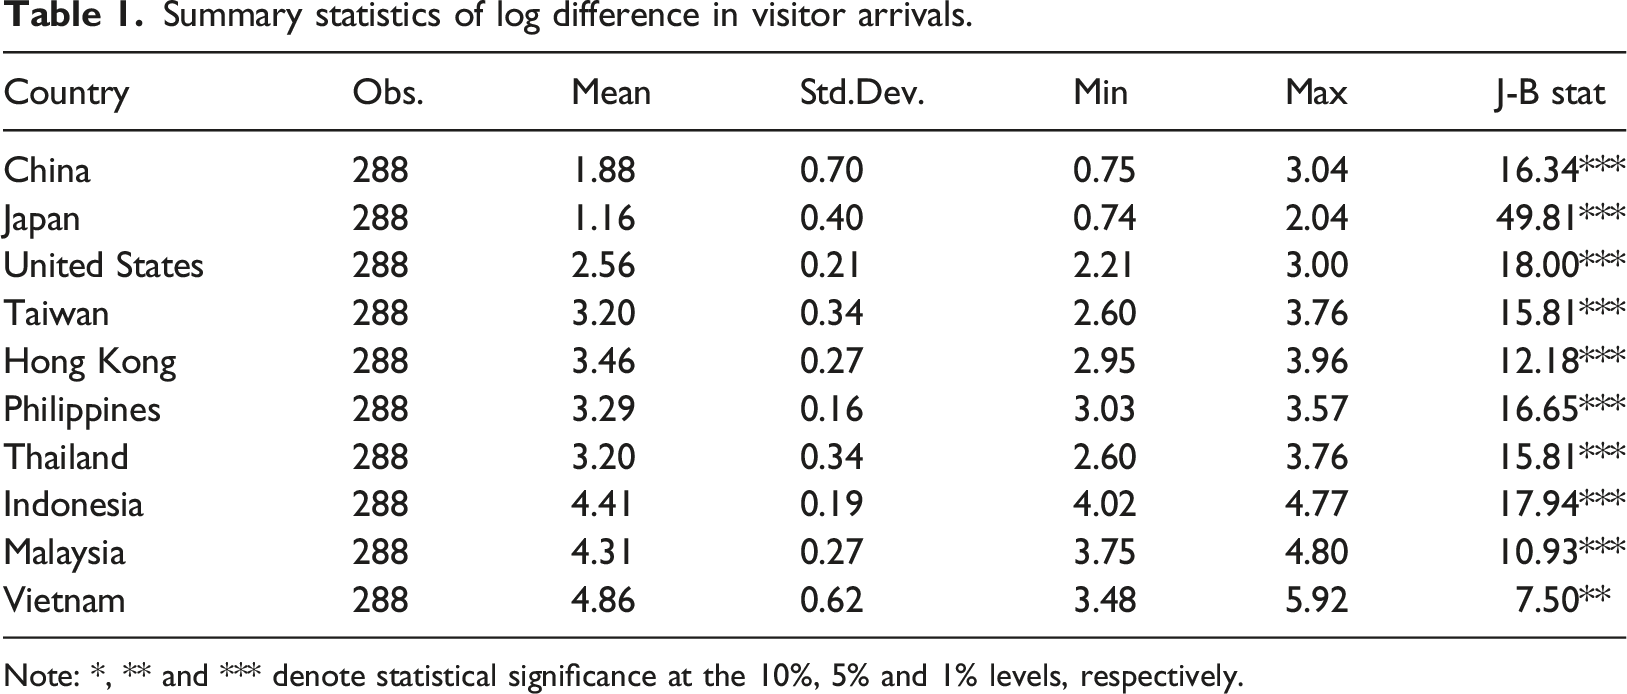
Note: *, ** and *** denote statistical significance at the 10%, 5% and 1% levels, respectively.
Empirical methodology
As illustrated in Figure 1, most of the data series experienced at least one or two drastic changes in their trends or a certain kind of nonlinearity. We, therefore, adopt a novel quantile unit root test proposed by Bahmani-Oskooee et al. (2018) that allows smooth breaks in the trend term. We briefly describe the methodology below.
Suppose a stochastic variable with unknown number and form of structural breaks is generated by the following Fourier expansion

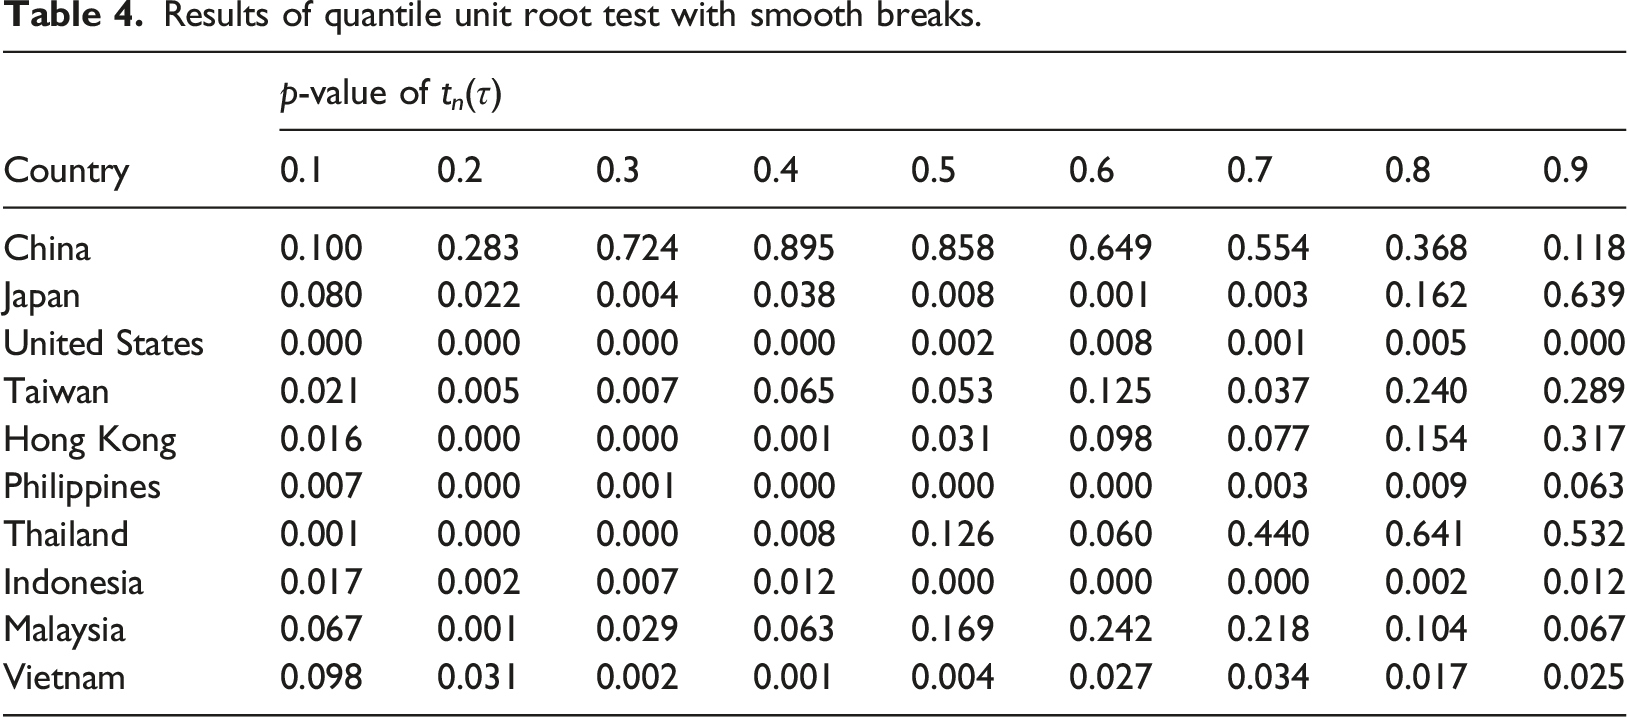
Although equation (3) follows standard augmented Dickey-Fuller (ADF) test at each quantile, our focal point is estimating the vector δ. Following Koenker and Xiao (2004), we use the following t ratio statistic to examine the stochastic properties within the τ


Because the limiting distribution of t n (τ i ) and QKS test statistics are not standard and depend on nuisance parameters, we calculate the critical values by adopting Bahmani-Oskooee et al. (2018) re-sampling procedures.
Empirical results
Traditional unit root tests results (model with constant without trend).
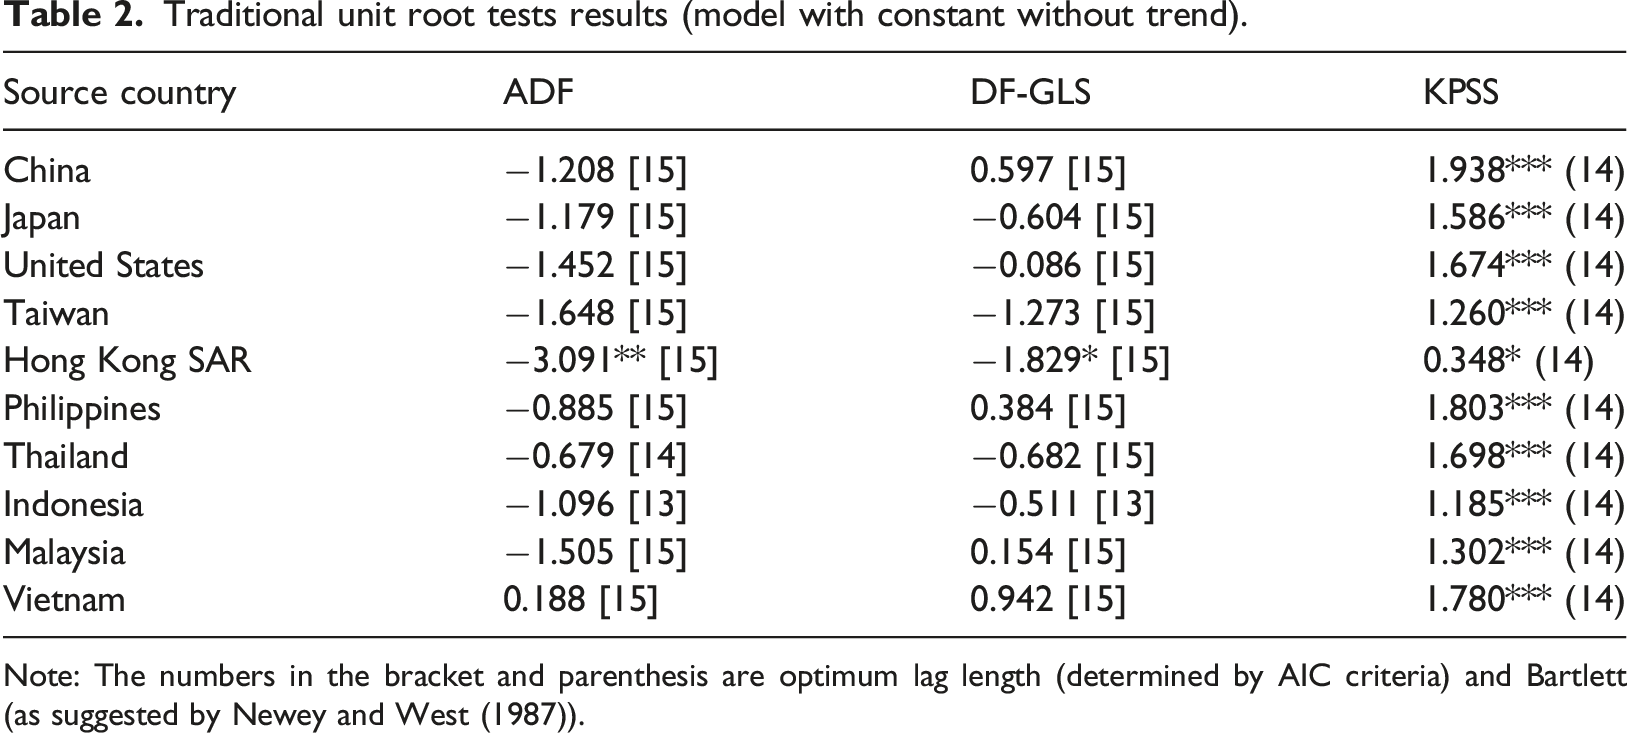
Note: The numbers in the bracket and parenthesis are optimum lag length (determined by AIC criteria) and Bartlett (as suggested by Newey and West (1987)).
To overcome these drawbacks, we estimate the Fourier function represented in equation (2). Figure 2 shows the time paths of the relative visitor arrivals series (12-months moving averaged series) and the estimated Fourier functions. Overall, each of the Fourier functions seems to be one of the possible candidate models to capture the fluctuations of the relative visitor arrivals series over time.
8
In addition, The F-test statistic (Becker et al., 2004) shown in Table 3, which tests the null of no sine and cosine terms in the model, also supports the inclusion of trigonometric functions because all the null hypotheses are rejected under the 1% significance level.
9
From Figures 1 and 2, we should note that the relative visitor arrivals series may have various types of structural breaks occurring at unknown dates. Therefore, our Fourier approximations seem to be supported by the data visualization. Estimated Fourier expansion series. Results of quantile unit root test with smooth breaks. F-statistic. Note: k∗ is optimum frequencies. The critical values of the faraday test and the Fourier QKS test are computed via Monte Carlo simulation with 5000 repli-cations. *, **, and *** denote statistical significance at the 10%, 5%, and 1% levels, respectively.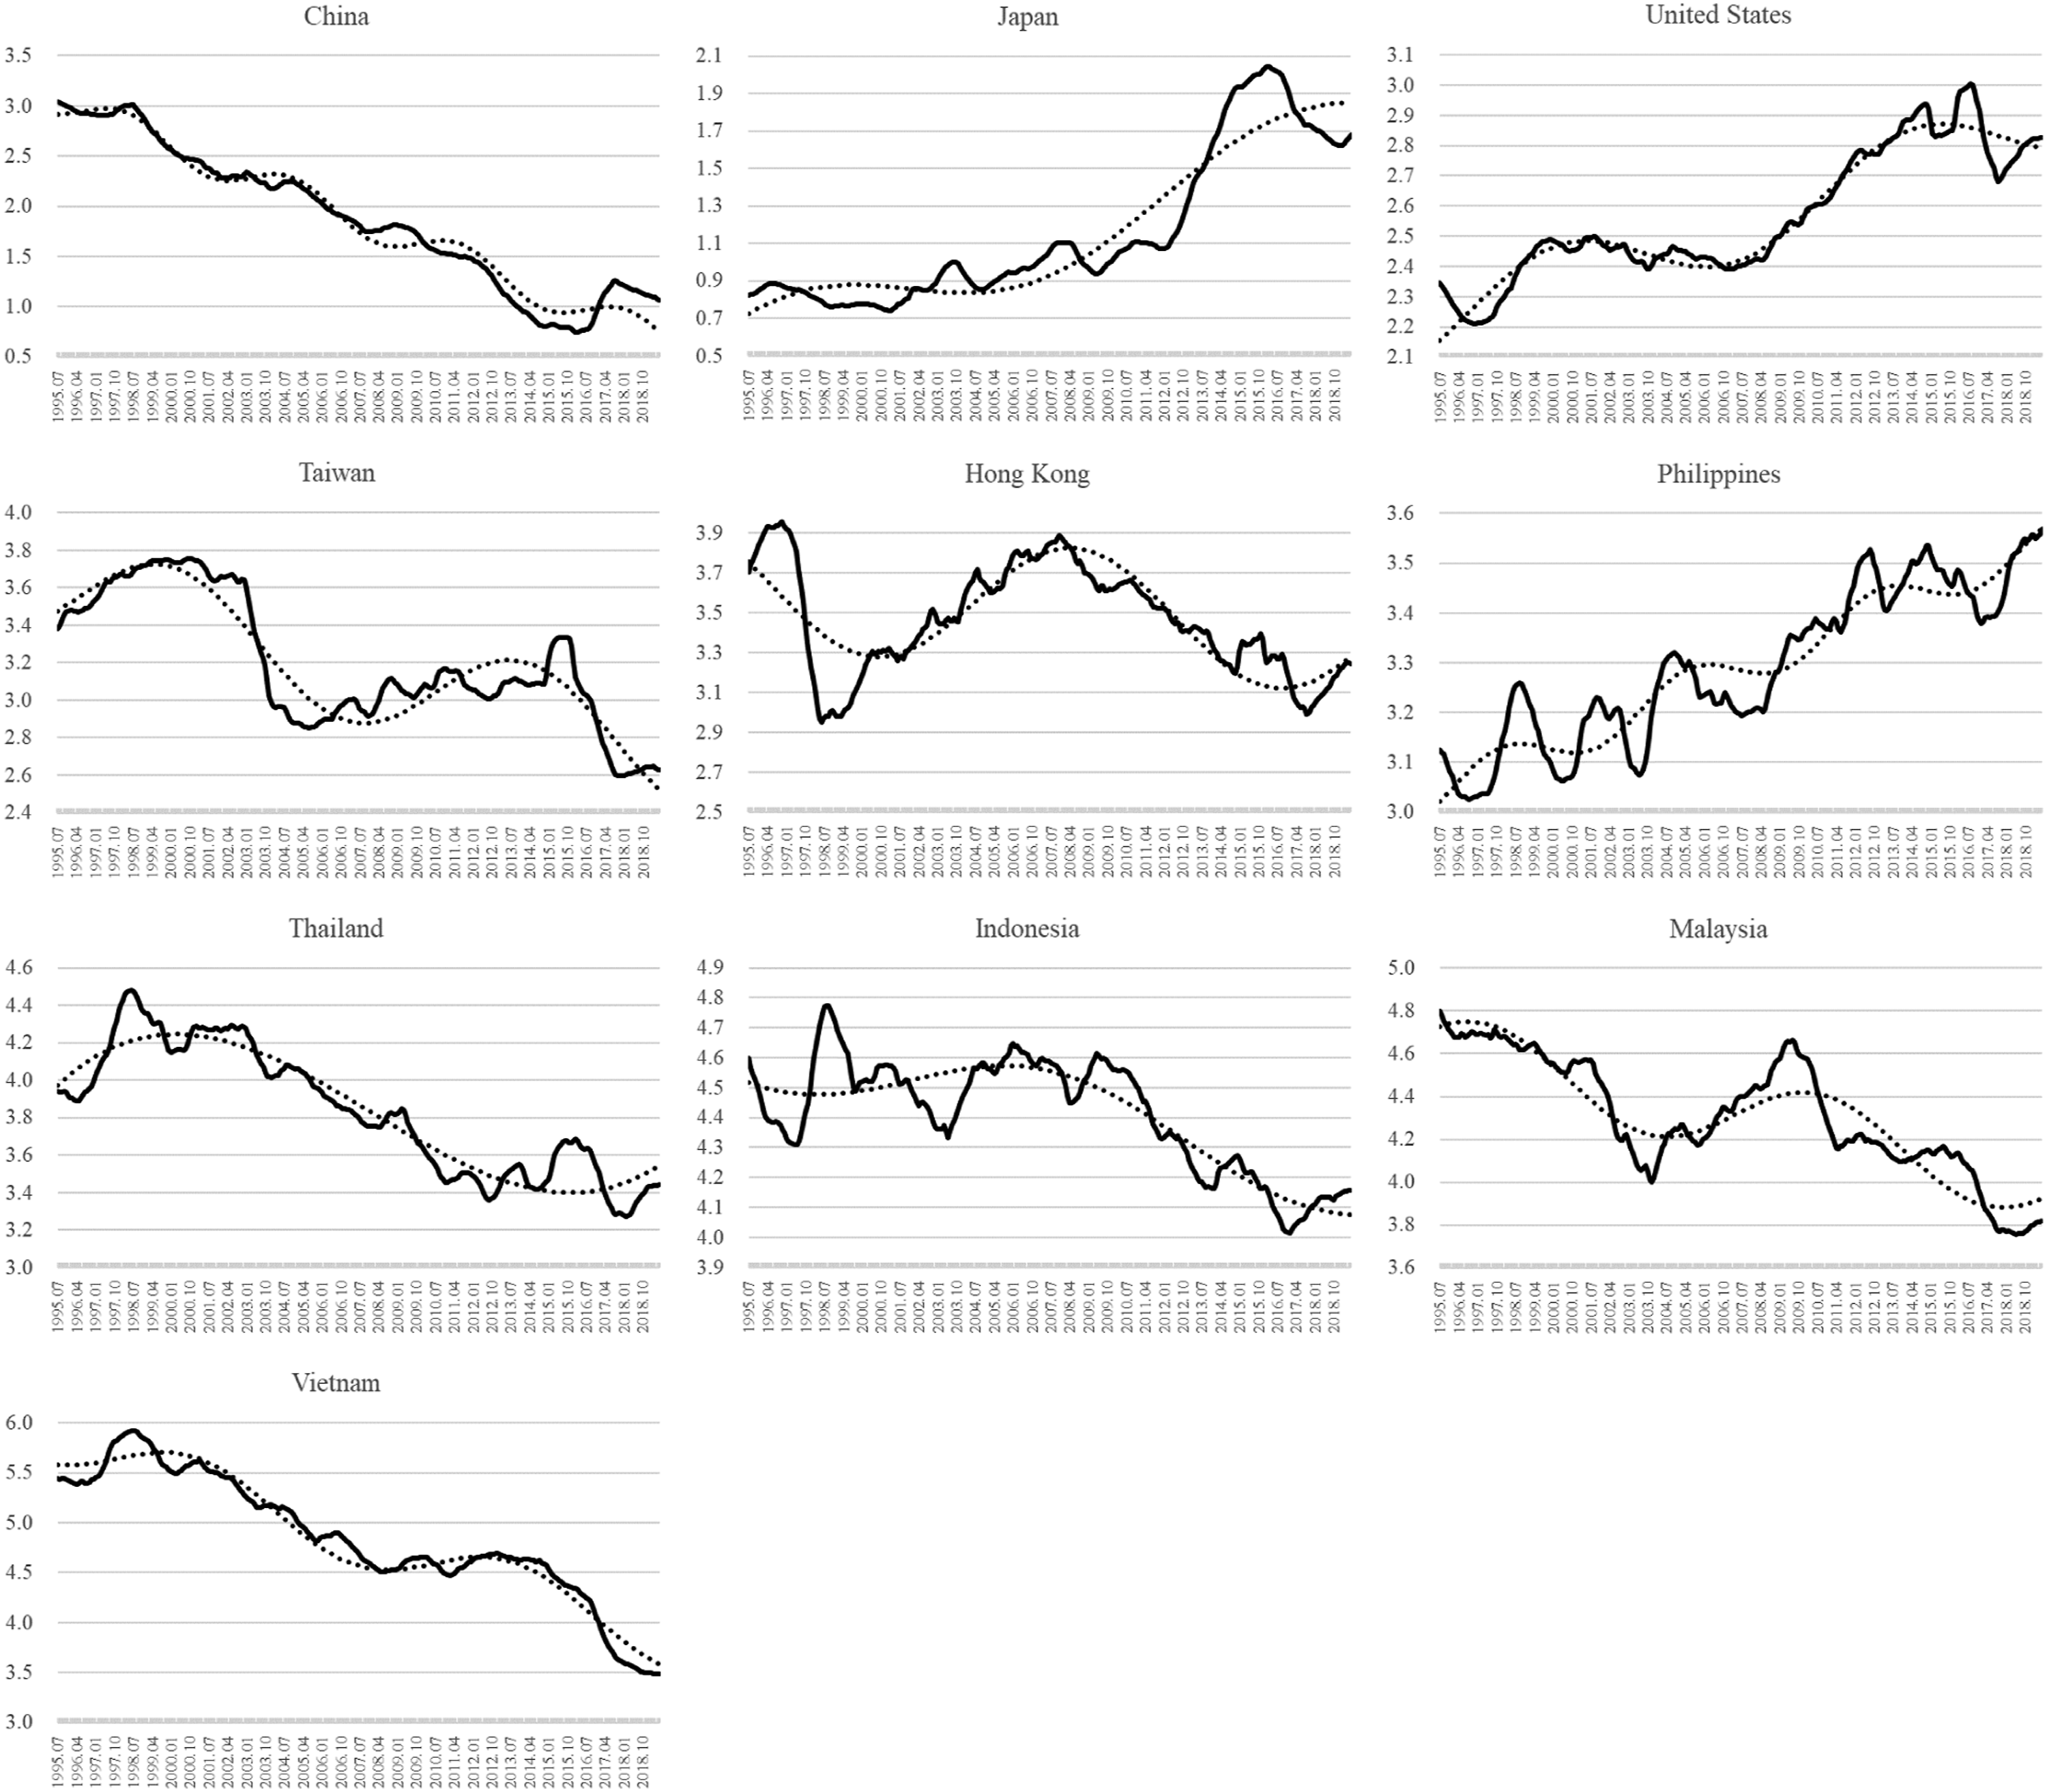
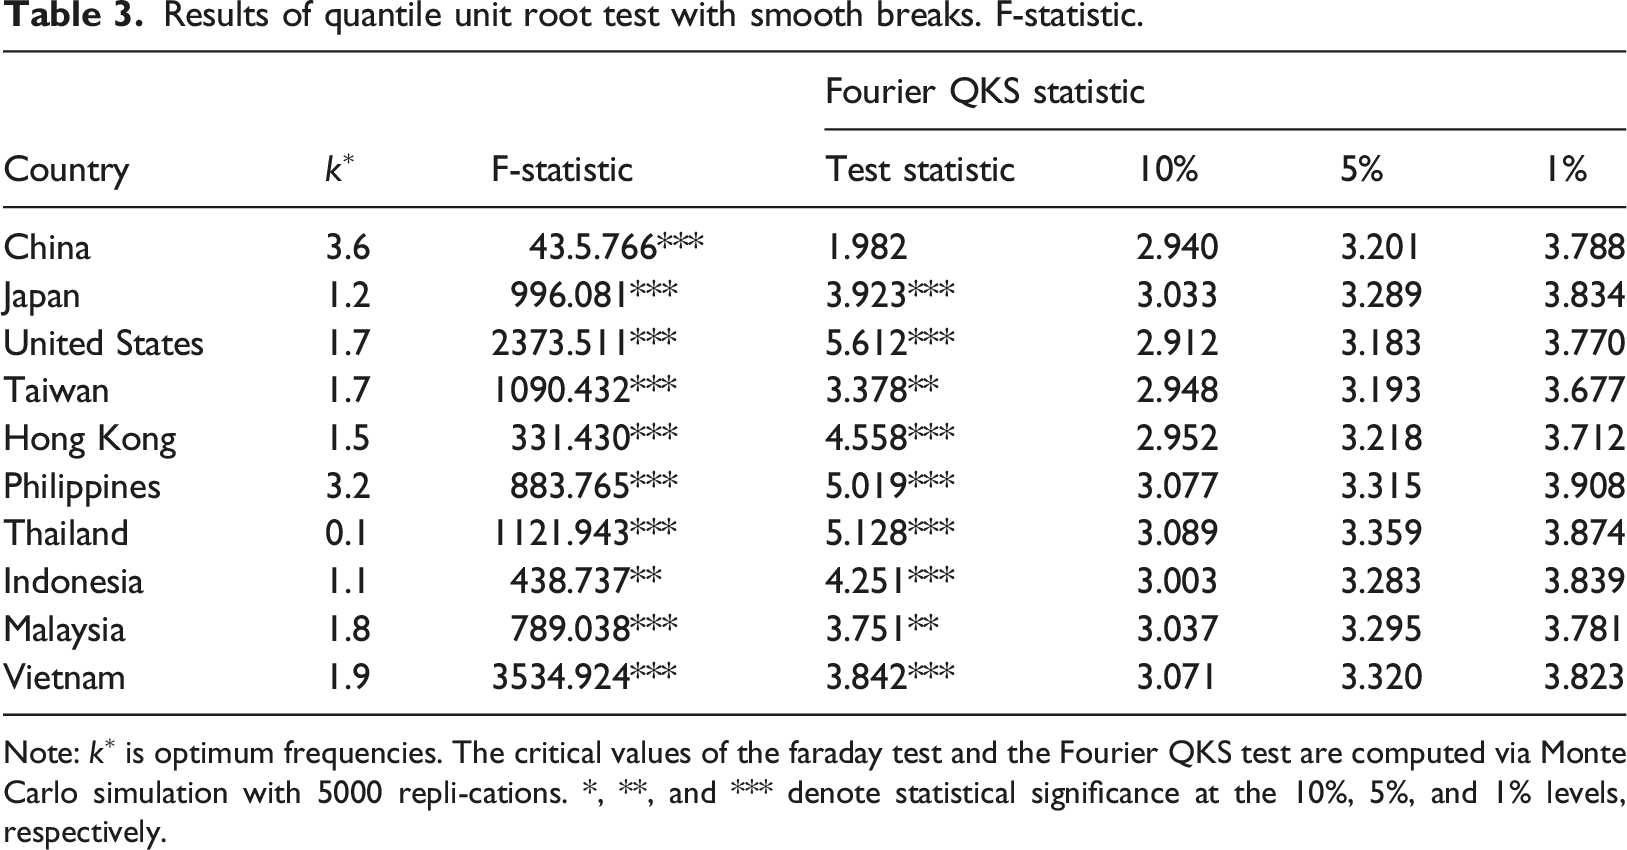
Table 3 indicates the results of the Fourier QKS statistic, which tests the unit root null hypothesis at all the quantiles ranging from 0.1 to 0.9 against the stationarity alternative hypothesis. The test results show that nine countries out of 10 significantly reject the null; namely, the relative visitor arrivals series for each country converges to the total visitor arrivals. k∗ indicates the optimum frequency for each series, which is between 0.1 and 3.6. As noted in Bahmani-Oskooee et al. (2018), these optimum frequencies imply structural breaks rather than short-term business cycles. For example, the Philippines, which has the frequency of 3.2, shows at least a 7.5-years cycle of its data variation. 10 On the other hand, Thailand has the minimum k∗ (0.1). As shown in Figure 2, the whole cycle appears to be longer than the sample period because the fitted line is only a part of the cycle. In this case, its optimum frequency is estimated to be the minimum value. If we try to avoid such corner solutions, we may need a longer time span to cover a larger range of data movements. Moreover, since all these frequencies are fractional, the results imply the possibilities that the breaks may permanently affect the movements of the relative visitor arrivals.
Results of quantile unit root test with smooth breaks.
Panels A and B of Figure 3 show the estimated coefficients (δ0(τ) and δ1(τ)) of equation (3) for the selected nine relative visitor arrivals series, significant in the Fourier QKS test. In Panel A, all the estimated quantile intercepts δ0(τ) have upward trends across quantiles. This means that when relative visitor arrivals receive a positive shock in a country, which makes its quantile lower, the intercept value correspondingly decreases. In other words, the positive shock helps narrow the gap between the total visitor arrivals and each country’s visitor arrivals. Conversely, when relative visitor arrivals receive a negative shock, which makes its quantile higher, the intercept value correspondingly increases. Panel B of Figure 3 observes three groups of the estimated autoregressive coefficients δ1(τ) in their shapes. First, the US, Indonesia, and Malaysia have inverse U-shaped curves. This fact means that when a certain positive shock on each country’s visitor arrivals, which makes the gap between the total and each country’s visitor arrivals smaller, occurs at lower quantiles, for example, less than 0.4-quantiles in the US, the impact of the shock is more transitory (the visitor arrivals tend to catch up with the total arrivals faster) because the autoregressive coefficient becomes further from one. When a negative shock occurs at higher quantiles, e.g. more than 0.7-quantiles in the US, the impact is also more transitory. However, in the middle of quantiles, any shock is more persistent because the autoregressive coefficient is closer to one. Second, Japan, Taiwan, Hong Kong, the Philippines, and Thailand have upward trends in their estimated δ1(τ). In particular, their slopes are steeper at higher quantiles. This implies that a negative shock raising the ratio of the total and each country’s visitor arrivals is more persistent, and it impedes the convergence tendencies toward the total visitor arrival level because the autoregressive coefficient becomes larger. Finally, the coefficient value of Vietnam is generally flat up to 0.7-quantiles, and at higher quantiles such as 0.8- and 0.9-quantiles, it becomes smaller. This also means that the decreases in Vietnam’s visitor arrivals caused by a negative impact are more transitory. Estimated quantile intercepts (δ0(τ) and autoregressive coefficients (δ1(τ))) Panel A: Estimated quantile intercepts. Panel B: estimated autoregressive coefficients.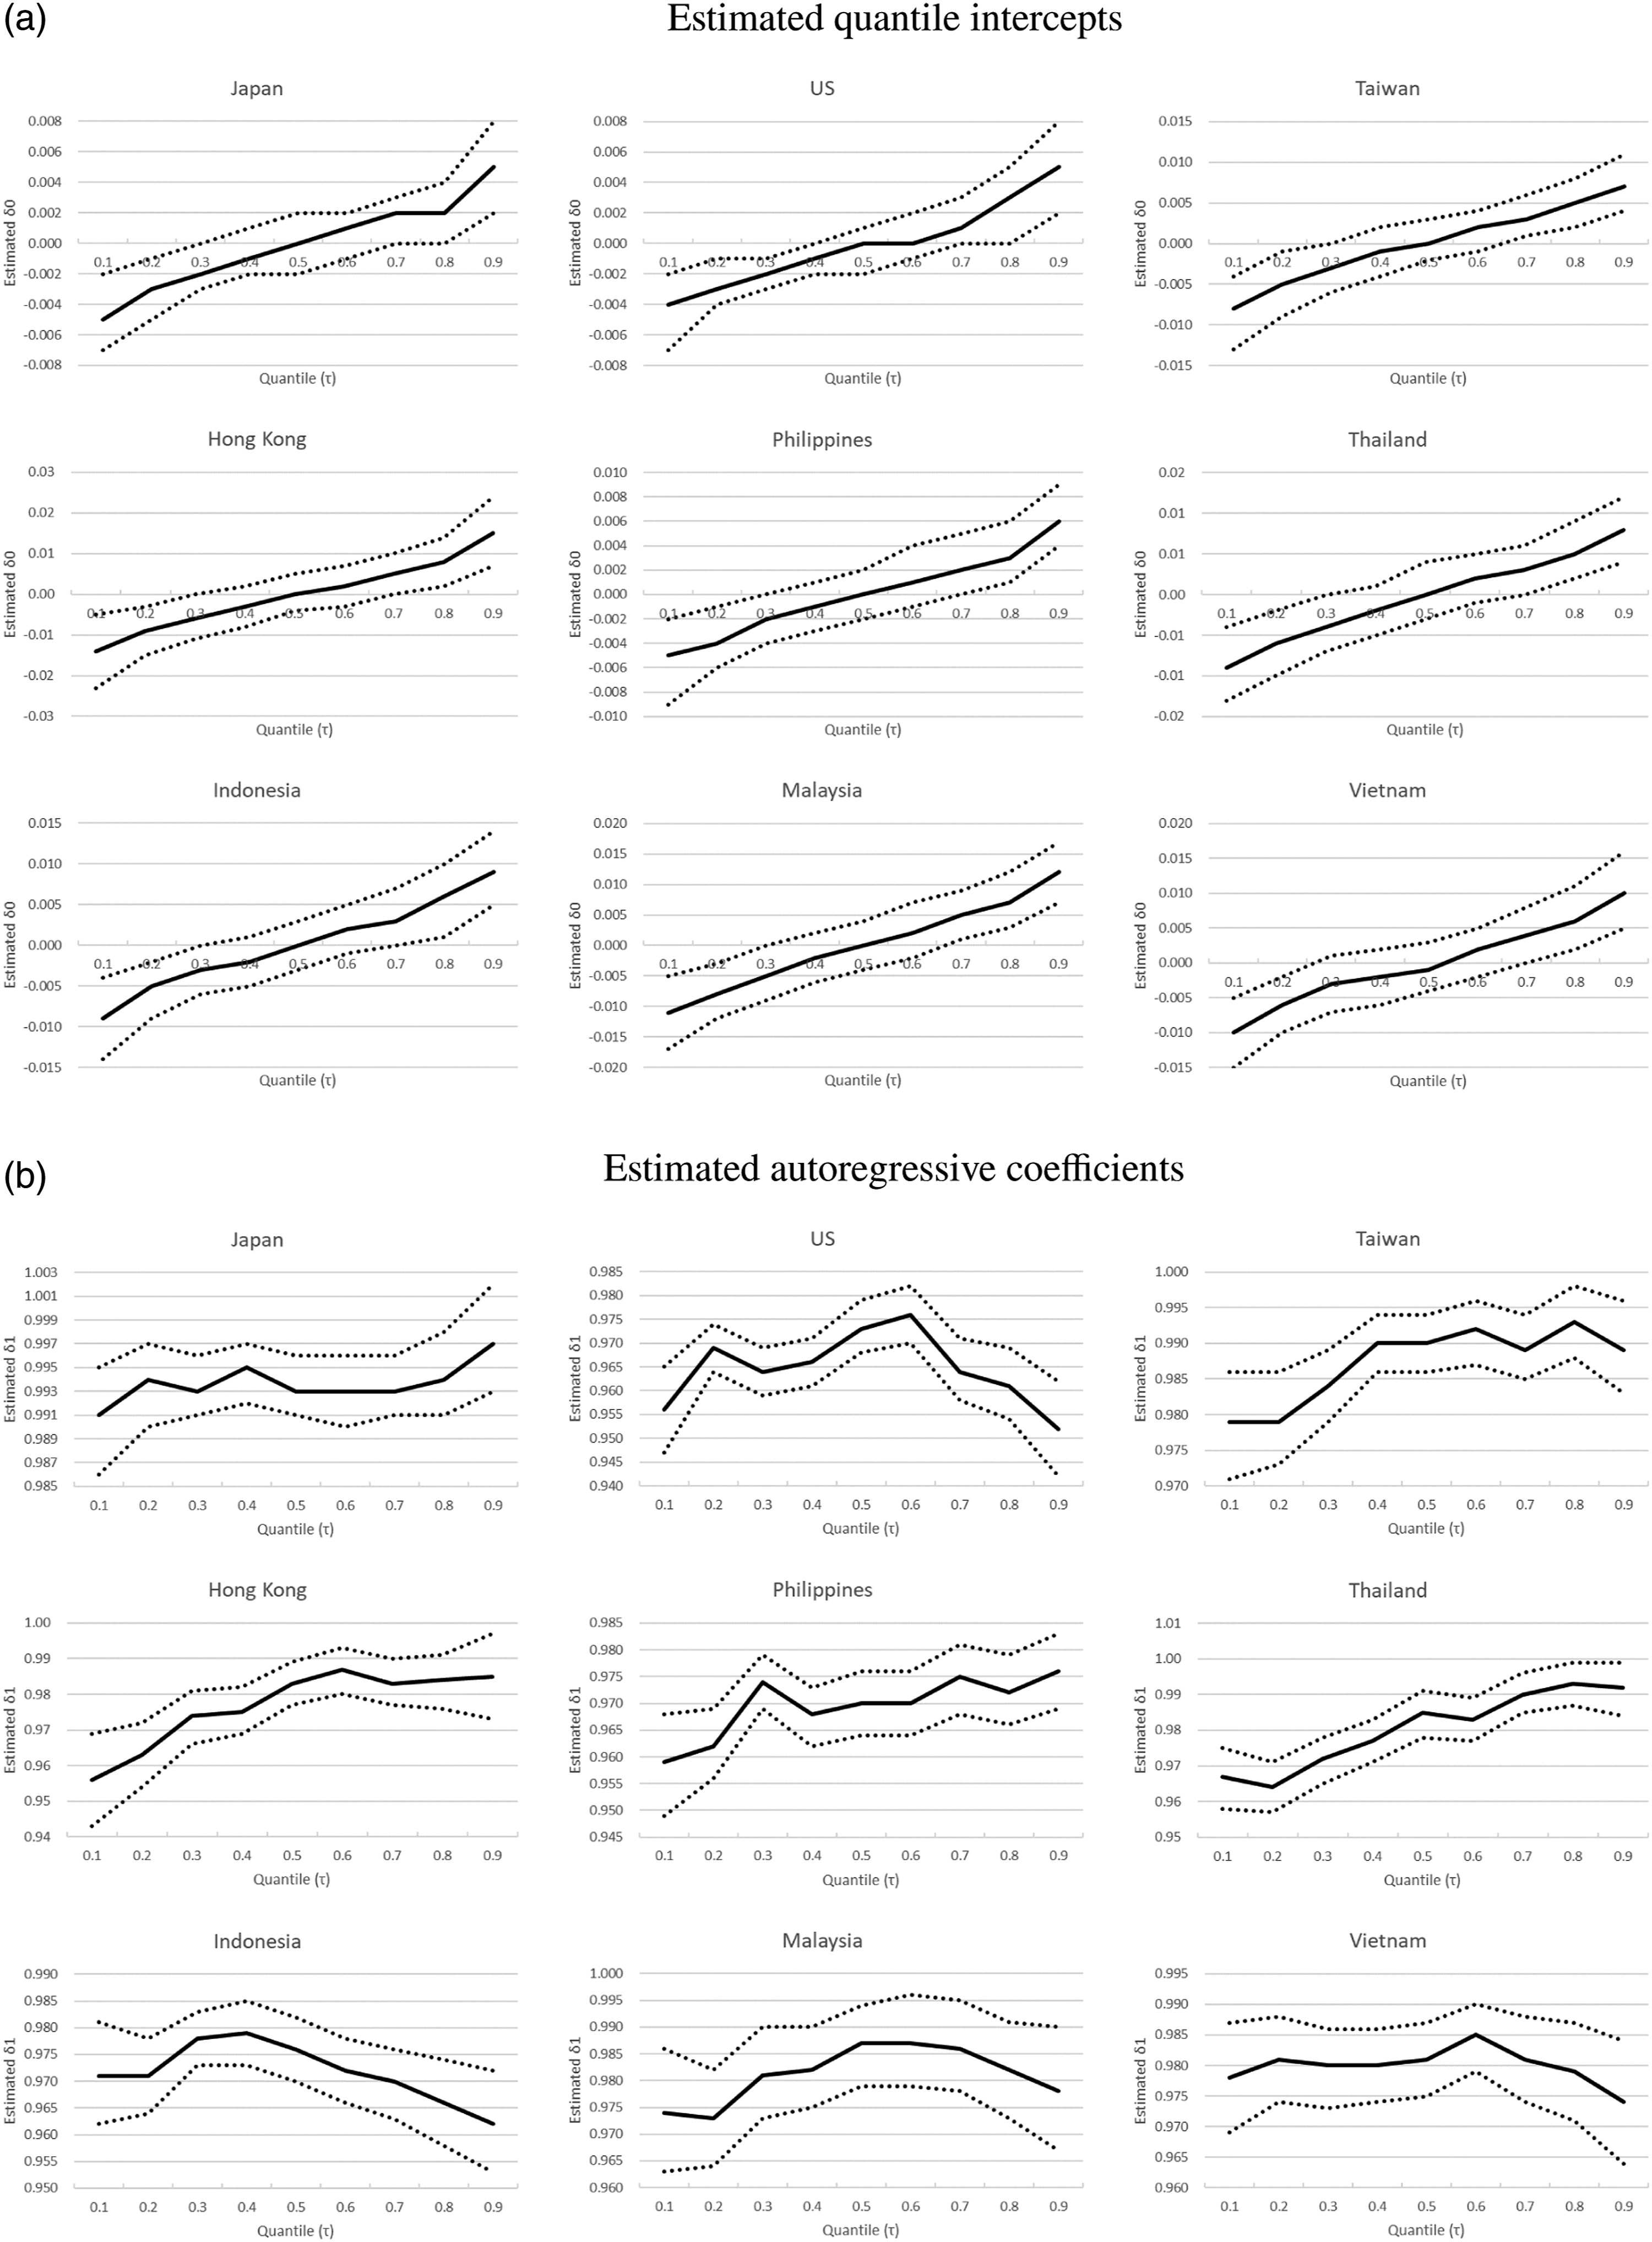
Conclusion
We examine the convergence hypothesis for visitor arrivals to South Korea over the period July 1995 to June 2019 using the novel quantile unit root test that allows for multiple structural breaks in the deterministic terms via Fourier expansion series. We obtain consistent evidence of tourism markets’ convergence in seven countries, and subtle and significant signs of convergence in two more countries. Our findings have important policy implications for South Korean tourism industry. Since almost all tourism markets are converging, this indicates a healthy condition for tourists’ arrivals from these markets. Furthermore, it also suggests that the difference between total visitor arrivals to South Korea and visitor arrivals from the nine tourist source countries is not drifting apart. Hence, South Korean government can develop tourism policies to increase the share of tourists coming from the nine particular destinations. Specifically, these tourism markets can be targeted with holiday packages and discounted airfares, among other policies, to attract visitors.
There is potentially one limitation in this study. Our analysis does not include the COVID-19 period since the Fourier quantile unit root test used cannot fit the data for the pandemic period very well. Hence, future research could investigate the issue of convergence in tourism markets during the COVID-19 period. Moreover, future research could also test the long-run cointegration relationship between visitor arrivals from source countries and destination country’s economic growth or foreign exchange reserve.
Footnotes
Declaration of Conflicting Interests
The author(s) declared no potential conflicts of interest with respect to the research, authorship, and/or publication of this article.
Funding
The author(s) received no financial support for the research, authorship, and/or publication of this article.