
Abstract
Raising capital is critical for the future expansion of travel and tourism businesses which have been adversely impacted by the COVID-19 pandemic. Investors sold their travel and tourism stocks below true value due to falling earnings during the pandemic. This study compares the sensitivity of stocks in different sectors to uncertainty when they are aggregated into different exchange-traded funds (ETFs). This reduces the extent of firm-specific peculiarities arising from market overreactions to news, mergers and acquisitions through time. Although previous studies have highlighted the effect of uncertainty on the financial decisions of travel and tourism firms, this study identifies a ‘fear-triggering point’ in the VIX index above which travel and tourism ETFs enter the state of uncertainty. This study has thus important implications for raising capital and financing tourism businesses in the US equity market, particularly during heightened uncertainty.
Introduction
Exchange-traded funds (ETFs) have become very popular since 1993 among investors who seek higher returns and lower volatility in diversified markets (Liang and Wei, 2020). According to Lynch et al. (2019: 34), in 2019 ETFs accounted for ‘30% of all trading volume on US exchanges, up from less than 2% in 2000’. It is important to understand how travel and tourism ETFs have performed compared with other sectoral ETFs 1 . Unlike other quarterly and monthly leading indicators, the VIX index is observed daily so it can provide early and timely warning signs for investors and businesses (Yost et al., 2020). The VIX index was first introduced by the Chicago Board Options Exchange (CBOE) as one of the widely used barometers of market sentiment based on the implied volatility of S&P500 index options. This index is a forward-looking indicator as it utilises the 30-day expected volatility following the measurement date and derived from real-time, mid-quote prices of call and put options. An increase in the VIX index is typically interpreted by investors as an indication of rising uncertainty in the market and vice versa. The VIX index is also known as the fear index, representing a quantifiable and high-frequency measure of market risk and investors’ sentiments.
This study identifies a ‘fear triggering point’ in the VIX index above which travel, leisure and tourism ETFs enter the state of uncertainty. The results have thus important timely implications for the funding of large travel and tourism businesses that intend to raise capital in the US, particularly during heightened uncertainty. To examine the sensitivity of ETFs to uncertainty across different sectors (including tourism, leisure and travel), a threshold model is adopted in which conditional betas can shift from regime 1 (low uncertainty) to regime 2 (high uncertainty) if the VIX index exceeds an optimized threshold value in a given sector. To the best of my knowledge, none of the previous studies incorporated the moderating impact of market uncertainty on the conditional betas of the travel, leisure and tourism ETFs. The aim of this study is to examine the following four research questions: (1) Do travel, leisure and tourism ETFs respond differently when uncertainty is on the rise? (2) Which travel, leisure and tourism ETFs increase (fall) more than the aggregated market in rallies (pullbacks)? (3) Are travel, leisure and tourism ETFs more sensitive to changes in the level of market uncertainty than their counterparts in the other sectors? (4) What is the specific threshold level for the VIX index above which investors in the travel, leisure and tourism sector start feeling fearful? What is this fear-triggering threshold for other major sectoral ETFs?
Previous studies have highlighted the importance of uncertainty in the financial decisions of hospitality and tourism businesses (Al-Qudah and Houcine, 2022; Carter et al., 2022; Cave et al., 2009; Daglis and Katsikogianni, 2022; Gozgor et al., 2021; Liew, 2022). Cave et al., (2009) examined the return and risk relationship of investment in the tourism and leisure sector across 15 countries. Their cross-country analysis reveals that investors typically seek the highest risk-adjust returns in the market which can subsequently boost income growth and employment in the tourism sector. Economic and political uncertainties can significantly and adversely influence the tourism sector by postponing the consumption decisions of travelers and investment decision of tourism managers in formulating effective recovery plans (Bashir and Kumar, 2022; Gozgor et al., 2021). Uncertainty and risk can adversely influence investment and consumption decisions by increasing fears for potential business failures (Akron et al., 2020; Gozgor et al., 2021; Madanoglu and Ozdemir, 2018). Akron et al. (2020) analysed the interplay between economic policy uncertainty and corporate investment among 305 hospitality companies in the US during 20001–2018. Akron et al. (2020, p. 104019) provide convincing evidence that ‘financial decisions of companies such as cash holding, capital structure, cost of capital, mergers and acquisitions, and corporate investment are affected by uncertainty’.
The tourism and travel sector contributes substantially to both national income and employment in the US, but the COVID-19 pandemic has adversely impacted on this sector to the extent that by April 2020, air travel was reduced to only 4% of what it was in 2019 (Carter et al., 2022). Most travel-, leisure- and tourism-related stocks in different continents fell sharply particularly within 4–5 weeks after the initial confirmed cases (Al-Qudah and Houcine, 2022). During the first wave of the COVID-19 pandemic, the travel and hospitality stocks suddenly switched from a positive return regime to a negative return regime (Lin and Falk, 2022). As a result, investors panicked and oversold (i.e. sold below true value) their stocks in response to dwindling earnings and future uncertainty (Daglis and Katsikogianni, 2022; Liew, 2022). On this very topic, Kaczmarek et al. (2021) examined the survival likelihood of 1200 travel and leisure companies among 52 countries using regression analysis and machine learning tools. Their findings revealed that only companies with low valuations, limited leverage and high investments had a better chance of surviving the pandemic. In a similar vein, Carter et al. (2022) also established that only companies with considerable cash and higher market-to-book ratios managed to limit their negative returns over this period.
Against this background, this study compares the sensitivity of stocks in different sectors to market uncertainty when they are aggregated into different ETFs, hence reducing the extent of firm-specific peculiarities arising from market overreactions to news, merger and acquisitions. It should be noted that an ETF resembles an index fund that tracks a basket of assets (e.g. stocks). When you buy an ETF, you invest in a bundle of assets that you can easily trade during market hours. For example, buying one unit of VTI enables investors to own more than 4000 different stocks in the US as if it were just one single stock. ETFs can thus assist investors to lower their risk via portfolio diversification.
Methodology
Karolyi and Stulz (1996) and Hong et al. (2007) have established that asset prices tend to fall together, but they climb individually and independently in market rallies. To measure the impact of uncertainty on the financial performance of tourism and leisure firms, previous studies use proxies such as the VIX index, stock market volatility, geopolitical risks and economic policy uncertainty (Akron et al., 2020). Following Pettengill et al. (1995), this study specifies the following mean equation that distinguishes between upside and downside betas:

Equation (1) incorporates the moderating impact of the VIX index on beta, whereby daily variations in returns for a particular asset or ETF are composed of two components: the first component arises from the systemic changes in the whole market and the second part relates to unexplained peculiarities specific to a given asset. A very high coefficient of determination thus implies that the asset performance closely follows the market. In the mean equation conditional, betas can switch from

Equation (2) models the standard deviation instead of the variance, and as a result the power parameter δ needs to be estimated rather than set equal to 2 a priori without testing. In the symmetric version of equation (2), it is assumed that γi = 0 for all i. This study uses the PARCH model because it is less restrictive than the GARCH model. For example, if both H0: δ = 2 and H0: γi = 0 are not rejected, the PARCH model will become a standard GARCH model. The presence of leverage effects can be tested using the null hypothesis H0: γi = 0. If the null is rejected, one can argue that the impact of news is asymmetric in that bad news increase volatility more than good news or put another way fear is more contagious than optimism. Equation (2) also captures volatility clustering even if the residuals do not exhibit significant signs of autocorrelation, but the standard deviation may vary through time. It should be recognised that the use of other alternative models instead of the PARCH models such as the threshold GARCH model (Glosten et al., 1993; Zakoïan, 1994) and the exponential ARCH model (Nelson, 1991) would have little impact on the magnitude and significance of
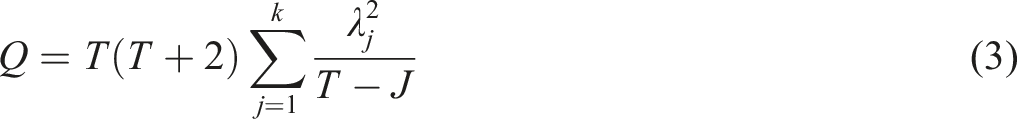
In equation (2) the ARCH coefficients (αi) denote the dynamic effect of a shock on future volatility, whereas the GARCH coefficients (bj) provide insights into the inertia and persistence of past volatility. Equations (1) and (2) are estimated in two stages. First, the optimal threshold parameter (τ) in the mean equation (equation (1)) is estimated by an iterative procedure discussed in Bai and Perron (1998). Second, after imposing the estimated threshold parameter in the mean equation, both equations (1) and (2) are re-estimated using an asymmetric version of PARCH proposed by Ding et al. (1993). Significant spikes in the correlograms of squared residuals are used to determine the optimal order of ARCH and GARCH terms in equation (2). Following the Occam's razor principle, a parsimonious PARCH model (with shorter lag lengths for p and q) is deemed more desirable as long as the Ljung–Box Q statistics in the correlograms of squared residuals are insignificant at all lags. The Q statistic at lag k is defined as follows:
Empirical findings and discussion
Data and ETF classifications
Top 10 holdings (constituents) and key characteristics of the travel and tourism ETFs.
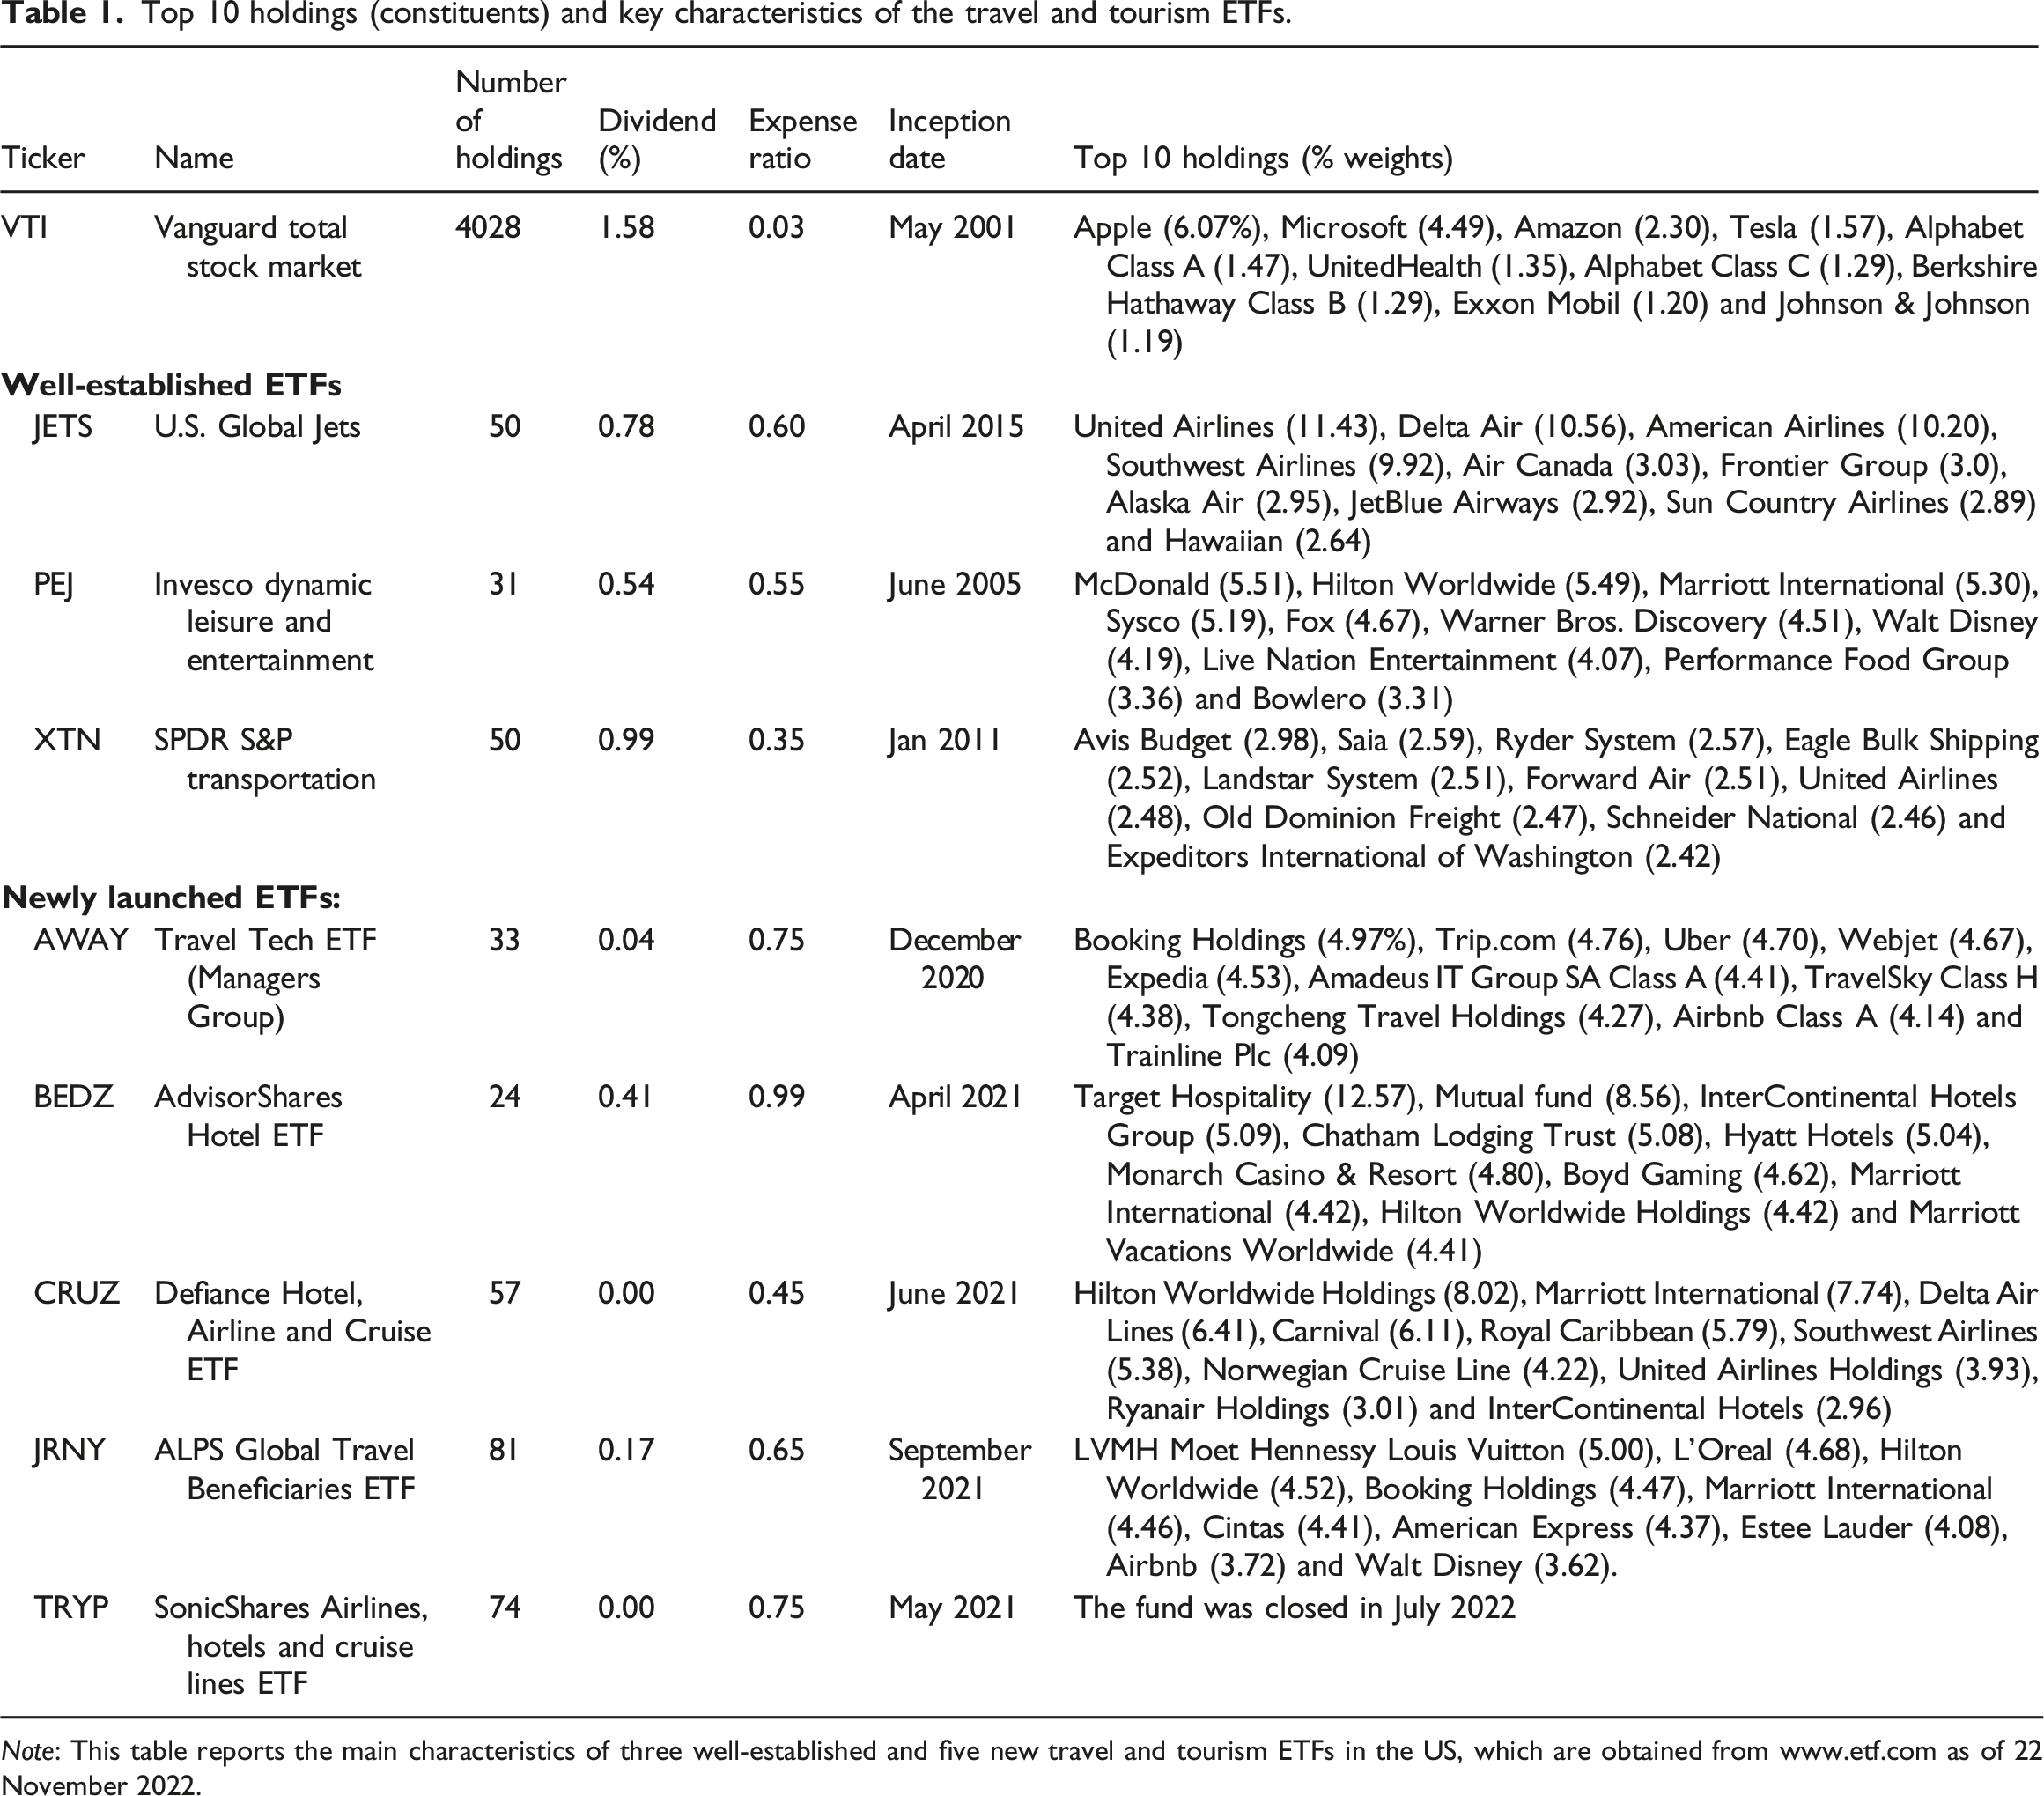
Note: This table reports the main characteristics of three well-established and five new travel and tourism ETFs in the US, which are obtained from www.etf.com as of 22 November 2022.
Spearman’s correlation coefficients between well-established and newly launched travel and tourism ETFs.
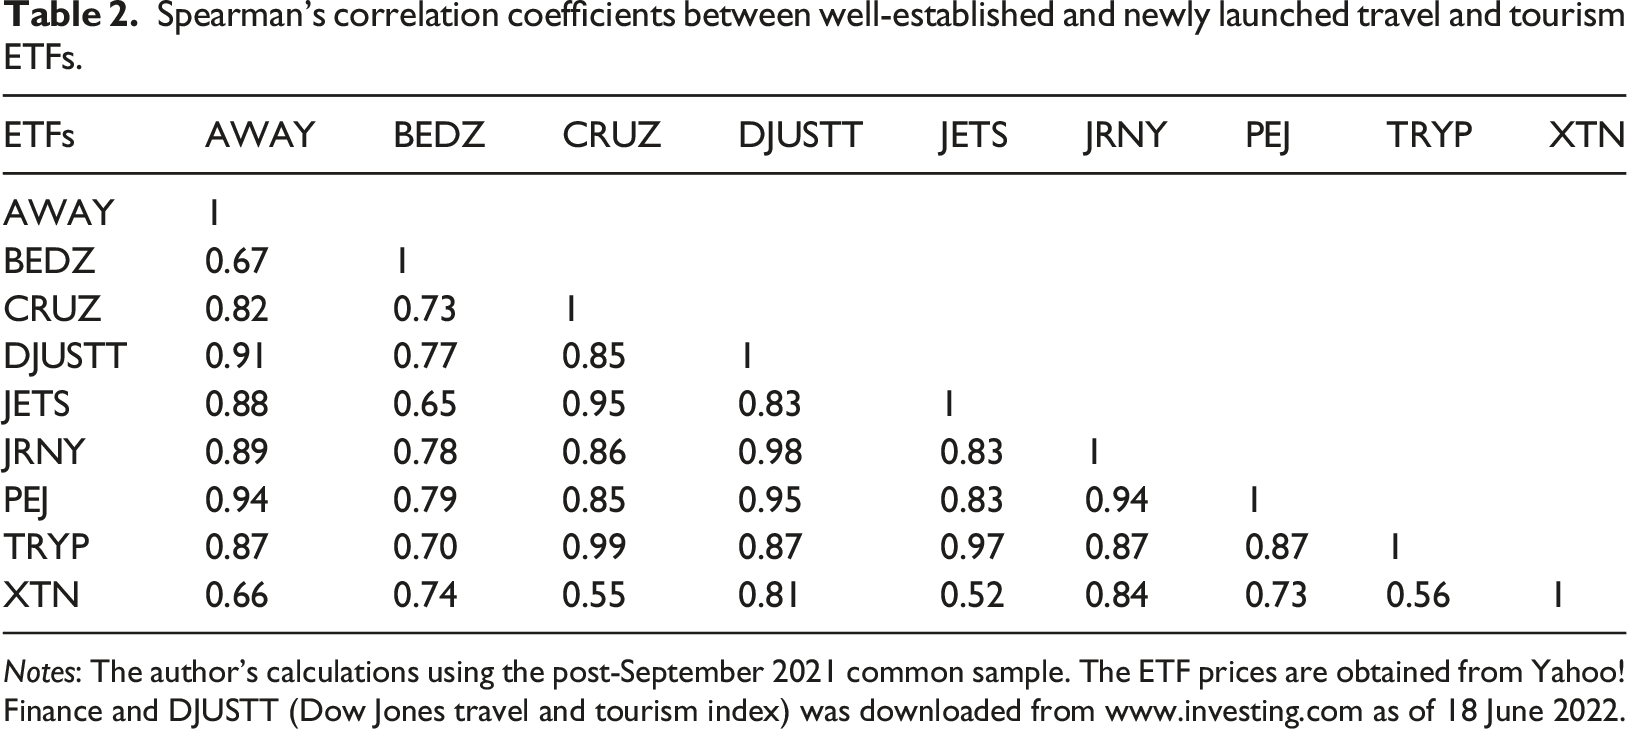
Notes: The author’s calculations using the post-September 2021 common sample. The ETF prices are obtained from Yahoo! Finance and DJUSTT (Dow Jones travel and tourism index) was downloaded from www.investing.com as of 18 June 2022.
Attention is now directed to the type of companies included in the three well-established travel and tourism ETFs. JETS invests in 50 different market-cap companies of both US and international passenger airline industry including aircraft manufacturers and airport companies. This ETF includes about 78% of its weight in US large-cap passenger airlines followed by Canada (3.10%), France (2.56), Hong Kong (2.39), Japan (2.37), Turkey (2.21), the UK (1.89), Thailand (1.13), Germany (1.10) and Spain (1.04). For a detailed account of this ETF, see its top 10 holdings in the last column of Table 1. PEJ invests in 31 different market-cap companies (99.9% US-based), including restaurant chains, hotels, as well as leisure and entertainment outlets. Its stock selection process is based on the following five factors: price momentum, earnings momentum, quality, management action and value. Finally, XTN invests in 50 companies (100% US-based) operating in the transportation industry utilising an equal-weighting scheme. The constituents of this ETF are all included in the S&P500 index and must meet certain liquidity and capitalisation thresholds. This ETFs includes the following segments: air freight and logistics, airlines, airport services, highways and rail tracks, marine, marine ports and services, railroads and trucking. See also the top 10 holdings of PEJ and XTN in Table 1.
Results and discussion
Figure 1 presents the time plot of the VIX index versus the relative performance of different ETFs to the market as a whole during the sample period (1 May 2015−17 June 2022). In all individual graphs, all ETF prices and the VIX index are normalized to make a like-with-like comparison. As can be seen from Figure 1, the three travel, leisure and tourism ETFs were consistently outperforming the market until March 2020 when things went pear-shaped due to the pandemic when the normalised VIX index exceeded 3. See the two horizontal (blue dotted) zero lines showing the normalised relative to the market performance and the average normalized VIX index. According to Figure 1, compared to other ETFs, XLK and XLP were the only two ETFs exhibiting an overall positive trend. This is the reason why both tech and consumer discretionary ETFs had the highest average return in Figure 2. VIX index versus the relative performance of different ETFs to the market as a whole (1 May 2015−17 June 2022). Notes: To make a like-with-like comparison, ETF prices and the VIX index are normalized. Most ETFs (particularly the three travel, leisure and tourism ETFs) tend to underperform the total market (the blue zero line) when the normalised VIX index exceeds 3.0. The two horizontal zero (dotted) lines represent the relevant means. Source: The author’s calculations based on daily data obtained from https://finance.yahoo.com. Total cumulative returns (%) for different ETFs during the entire sample period (1 May 2015–17 June 2022). Notes: Total returns are calculated during the entire sample period (1 May 2015−17 June 2022) using daily data from Yahoo! Finance. The total cumulative returns for three travel and tourism ETFs are substantially lower than those for other sectoral ETFs except for energy even after taking into account both dividends and the expense ratios.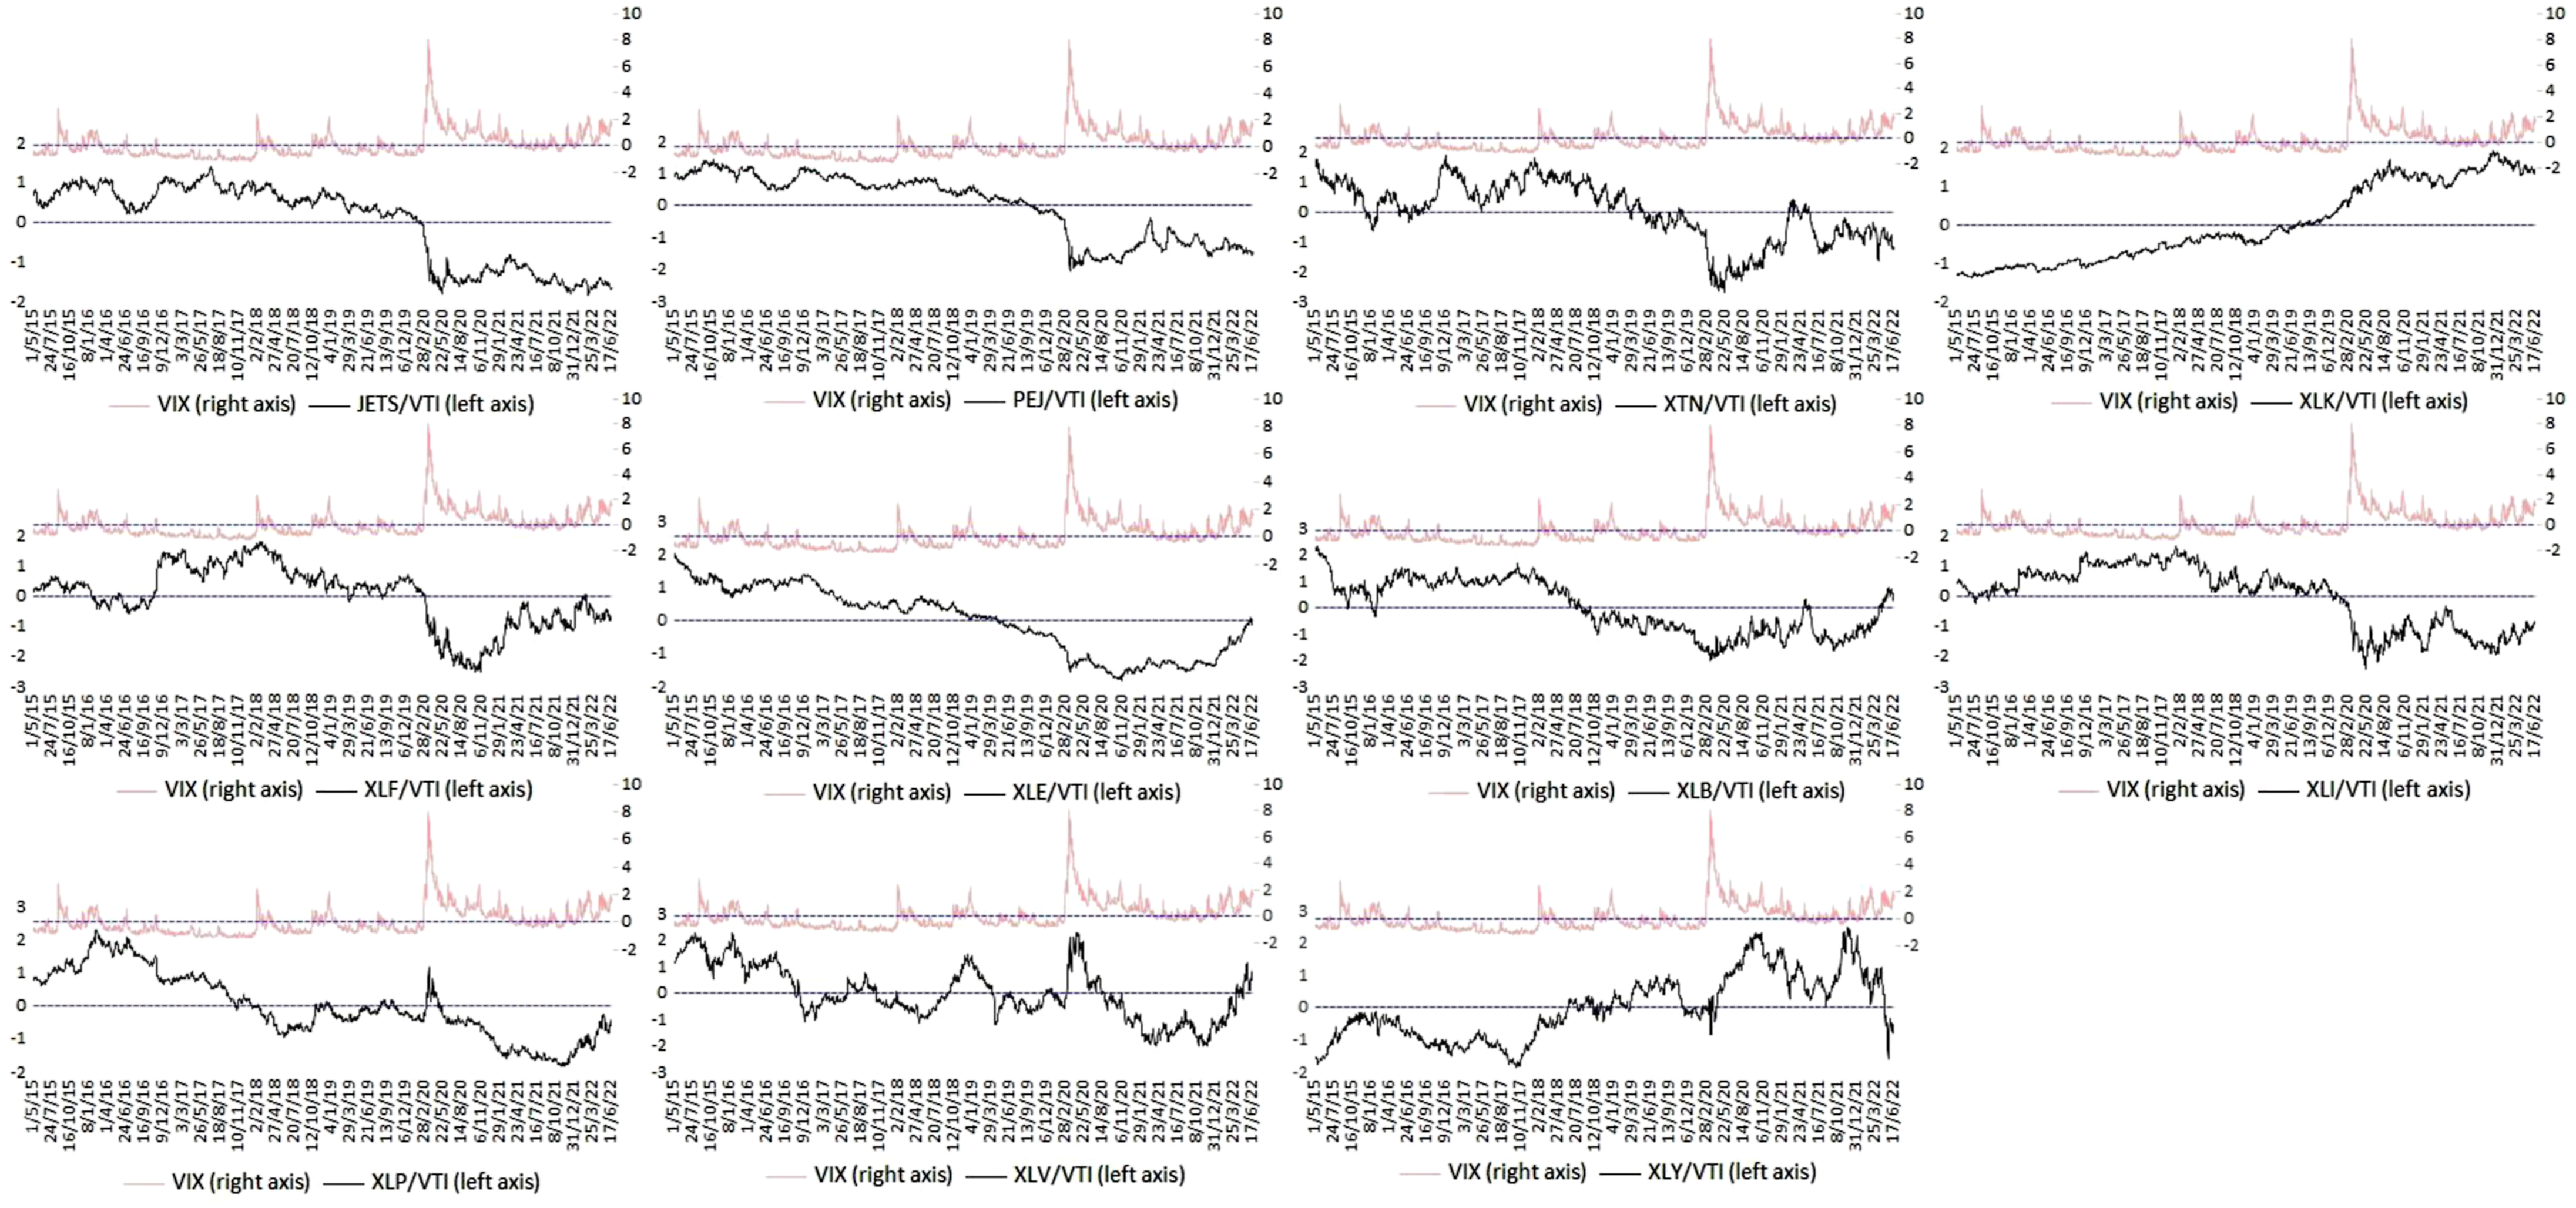
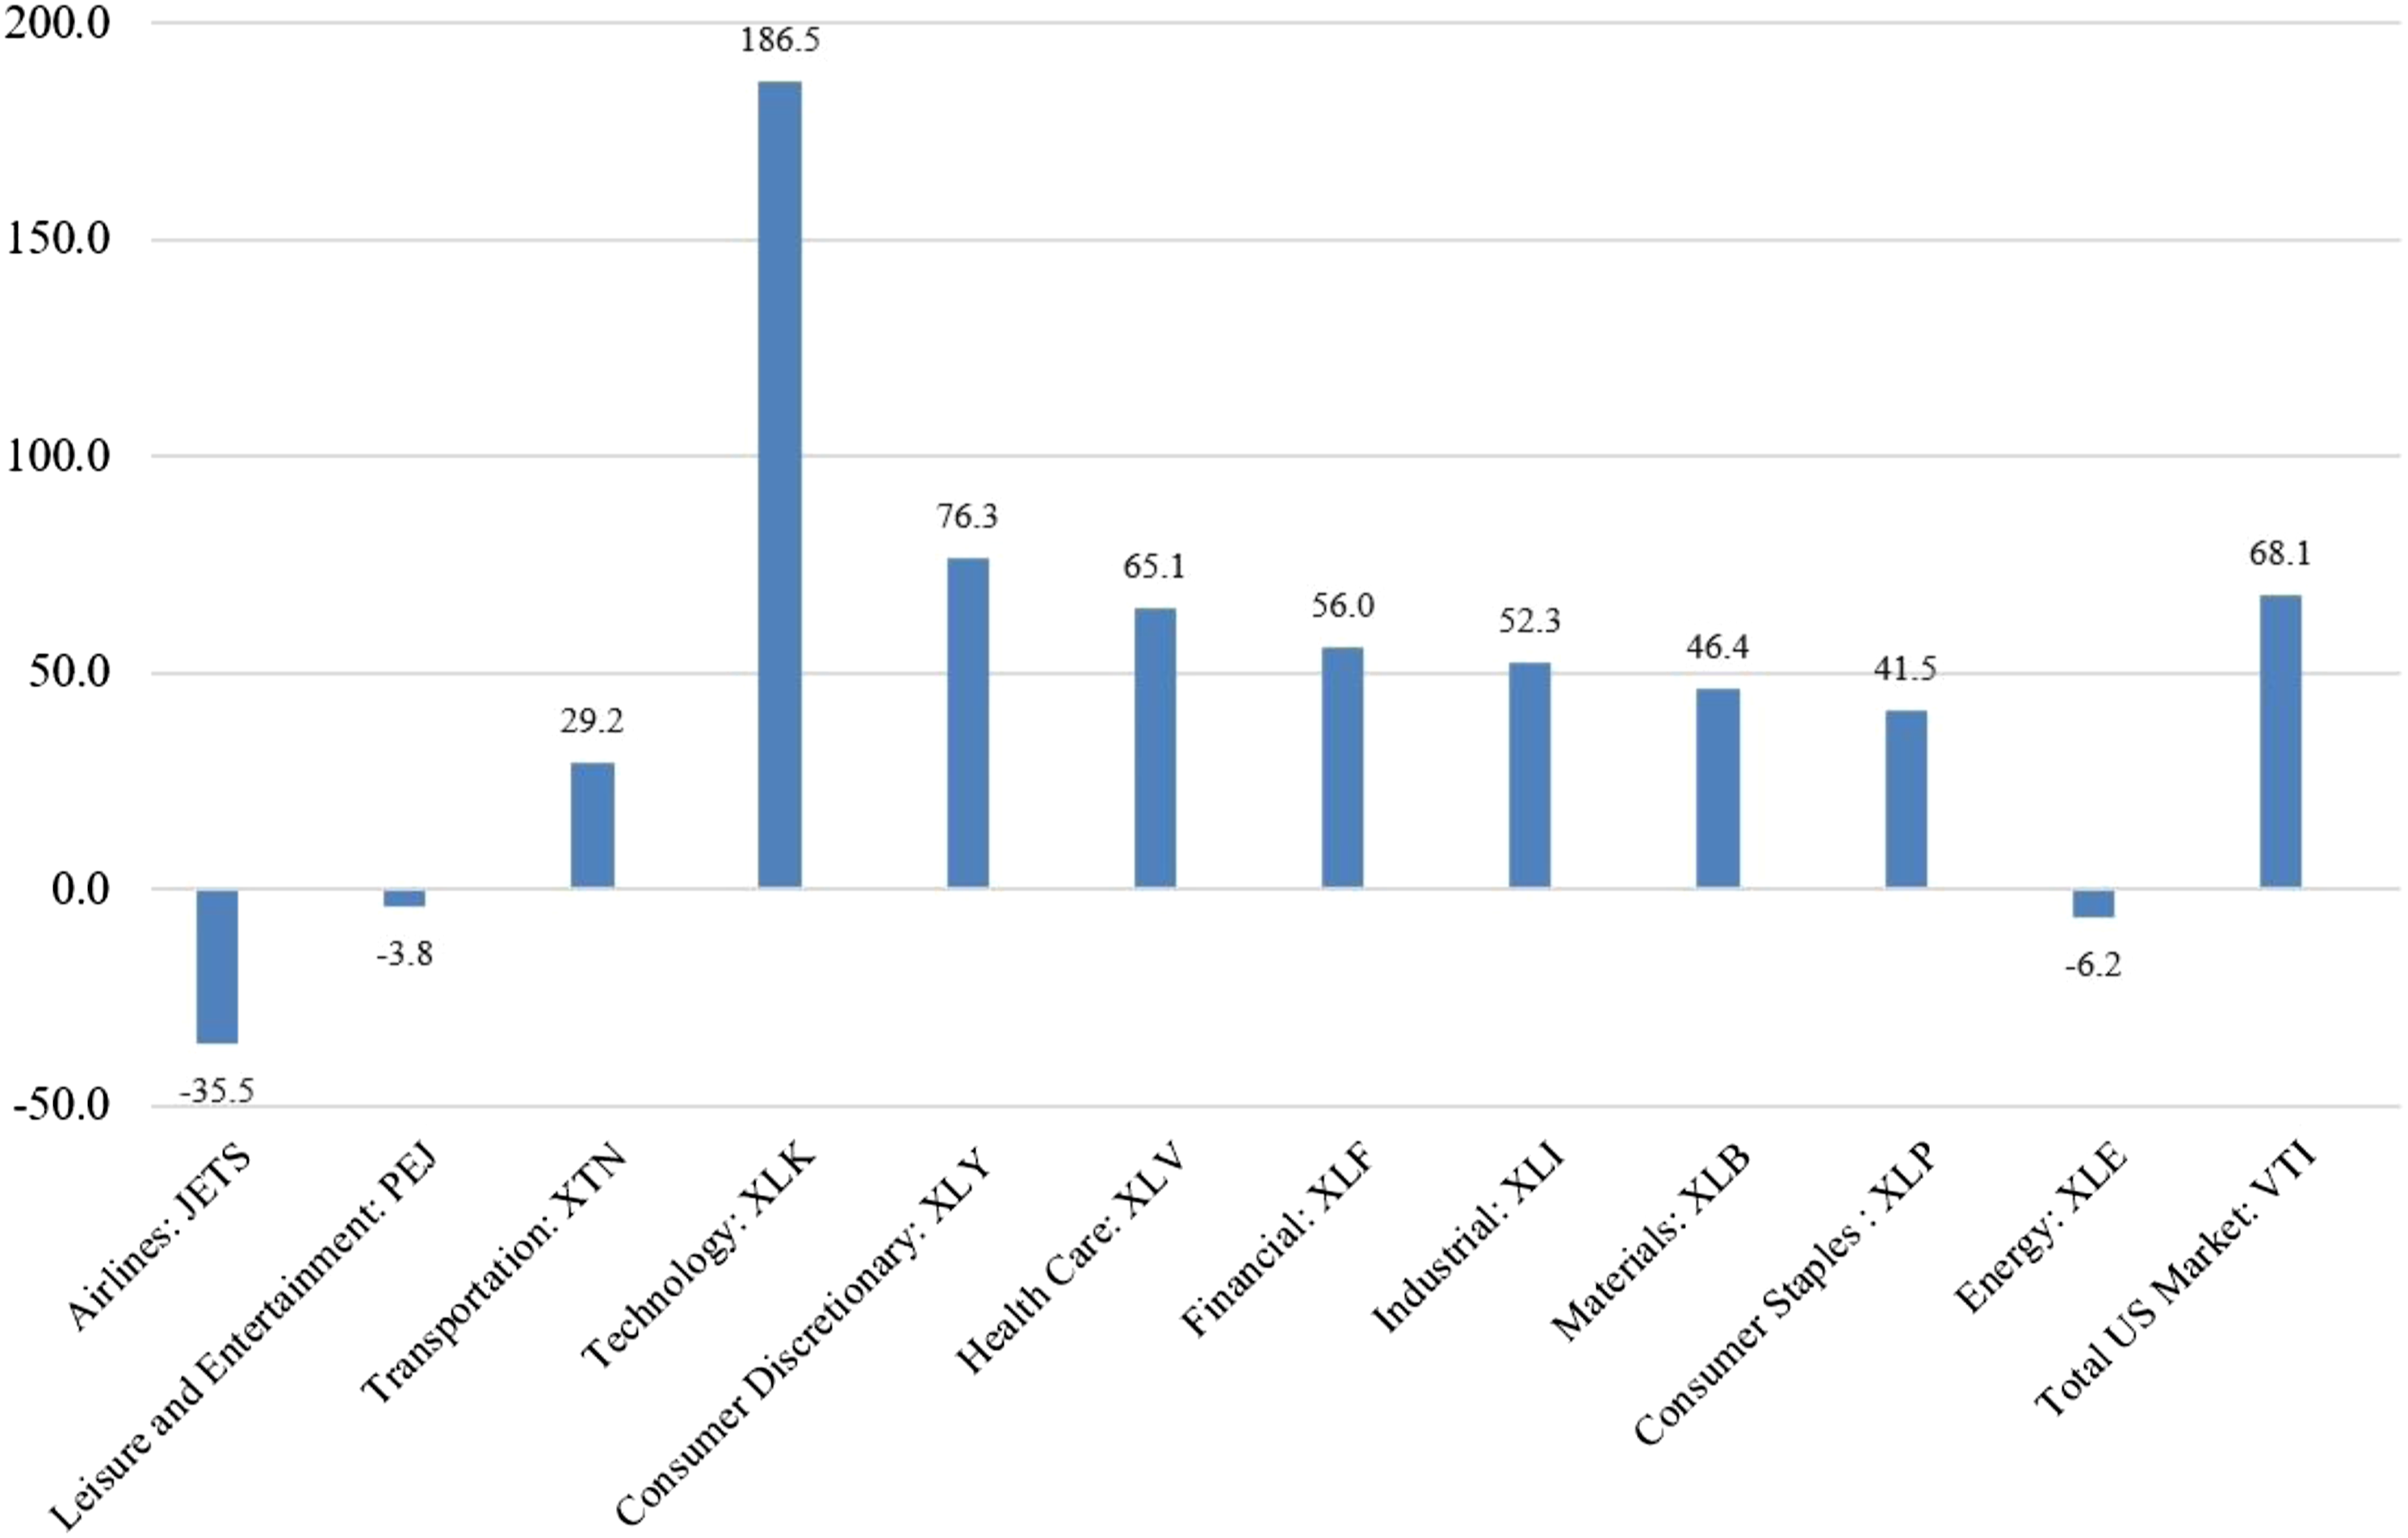
Once again in order to make a like-with-like comparison in Figure 2, the total return is calculated using the same sample period (1 May 2015−17 June 2022) for three well-established travel and tourism ETFs (JETS, PEJ and XTN) and major sectoral ETFs, namely, XLK (technology), XLY (consumer discretionary), XLV (health care), XLE (energy), XLF (financial), XLI (industrial), XLB (materials), XLP (consumer staples) and VTI (total market). All the sectoral ETFs are issued by the State Street Global Advisors. As can be seen, the total returns during the last 13 years for three travel and tourism ETFs are substantially lower than those for other sectoral ETFs except for energy, even after taking into account both dividends and the expense ratios.
Unit-root test results.
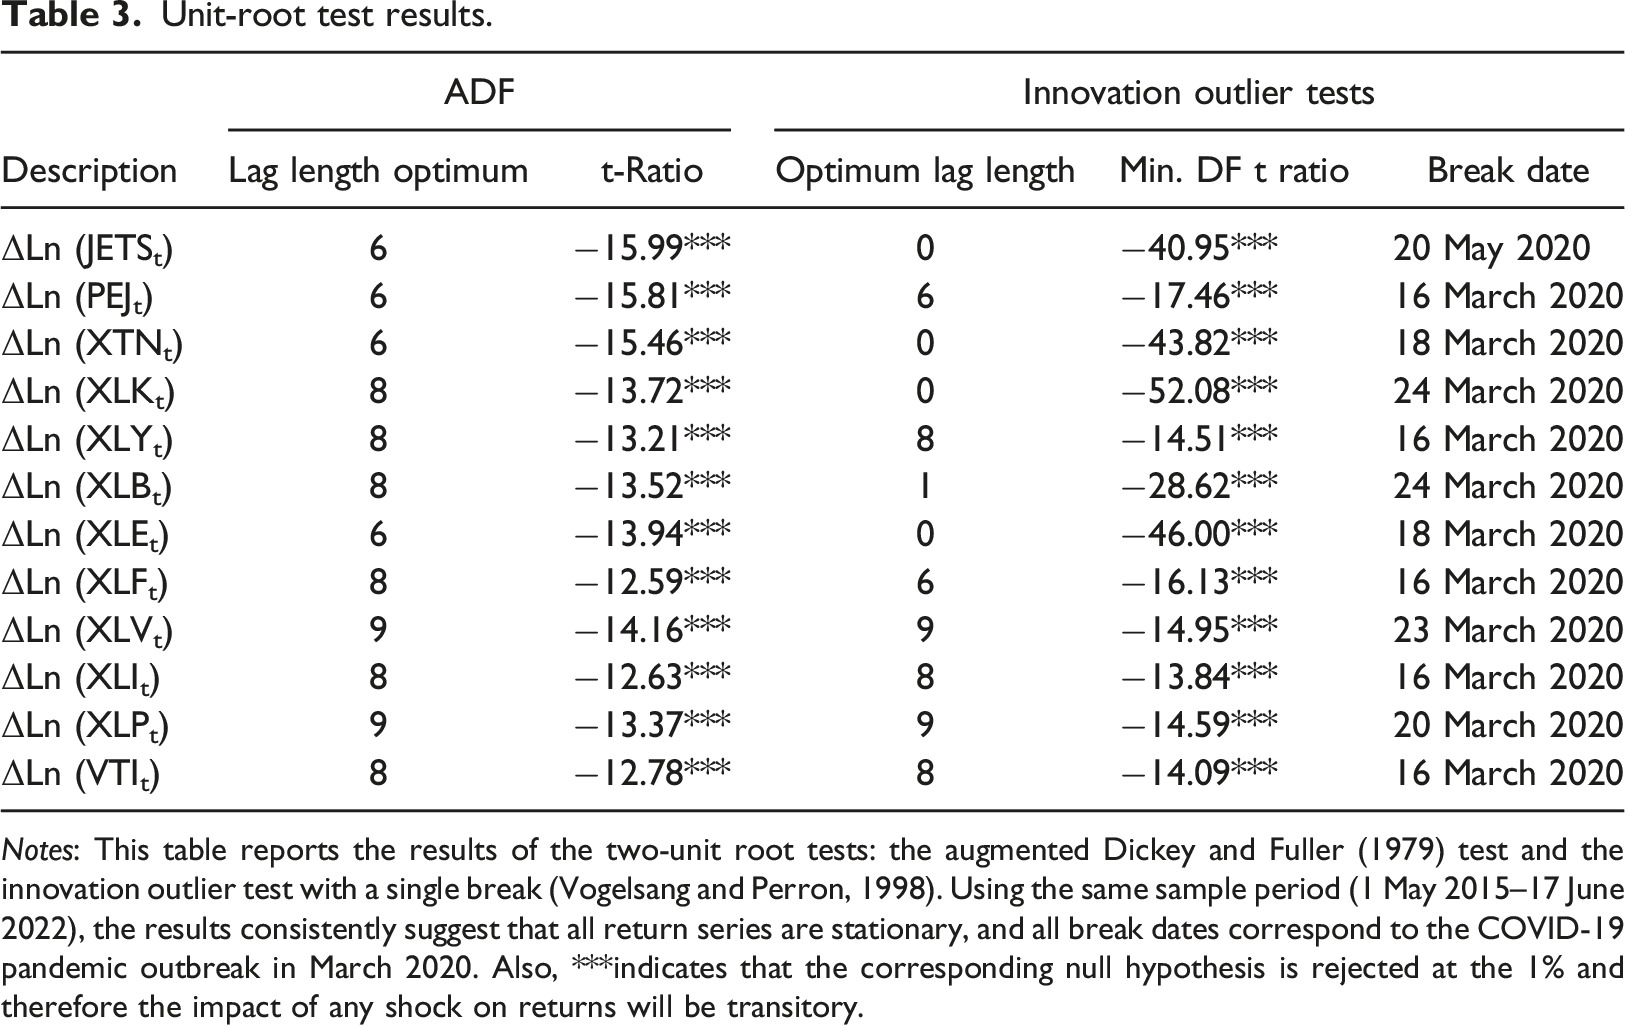
Notes: This table reports the results of the two-unit root tests: the augmented Dickey and Fuller (1979) test and the innovation outlier test with a single break (Vogelsang and Perron, 1998). Using the same sample period (1 May 2015–17 June 2022), the results consistently suggest that all return series are stationary, and all break dates correspond to the COVID-19 pandemic outbreak in March 2020. Also, ***indicates that the corresponding null hypothesis is rejected at the 1% and therefore the impact of any shock on returns will be transitory.
Estimated mean and PARCH equations
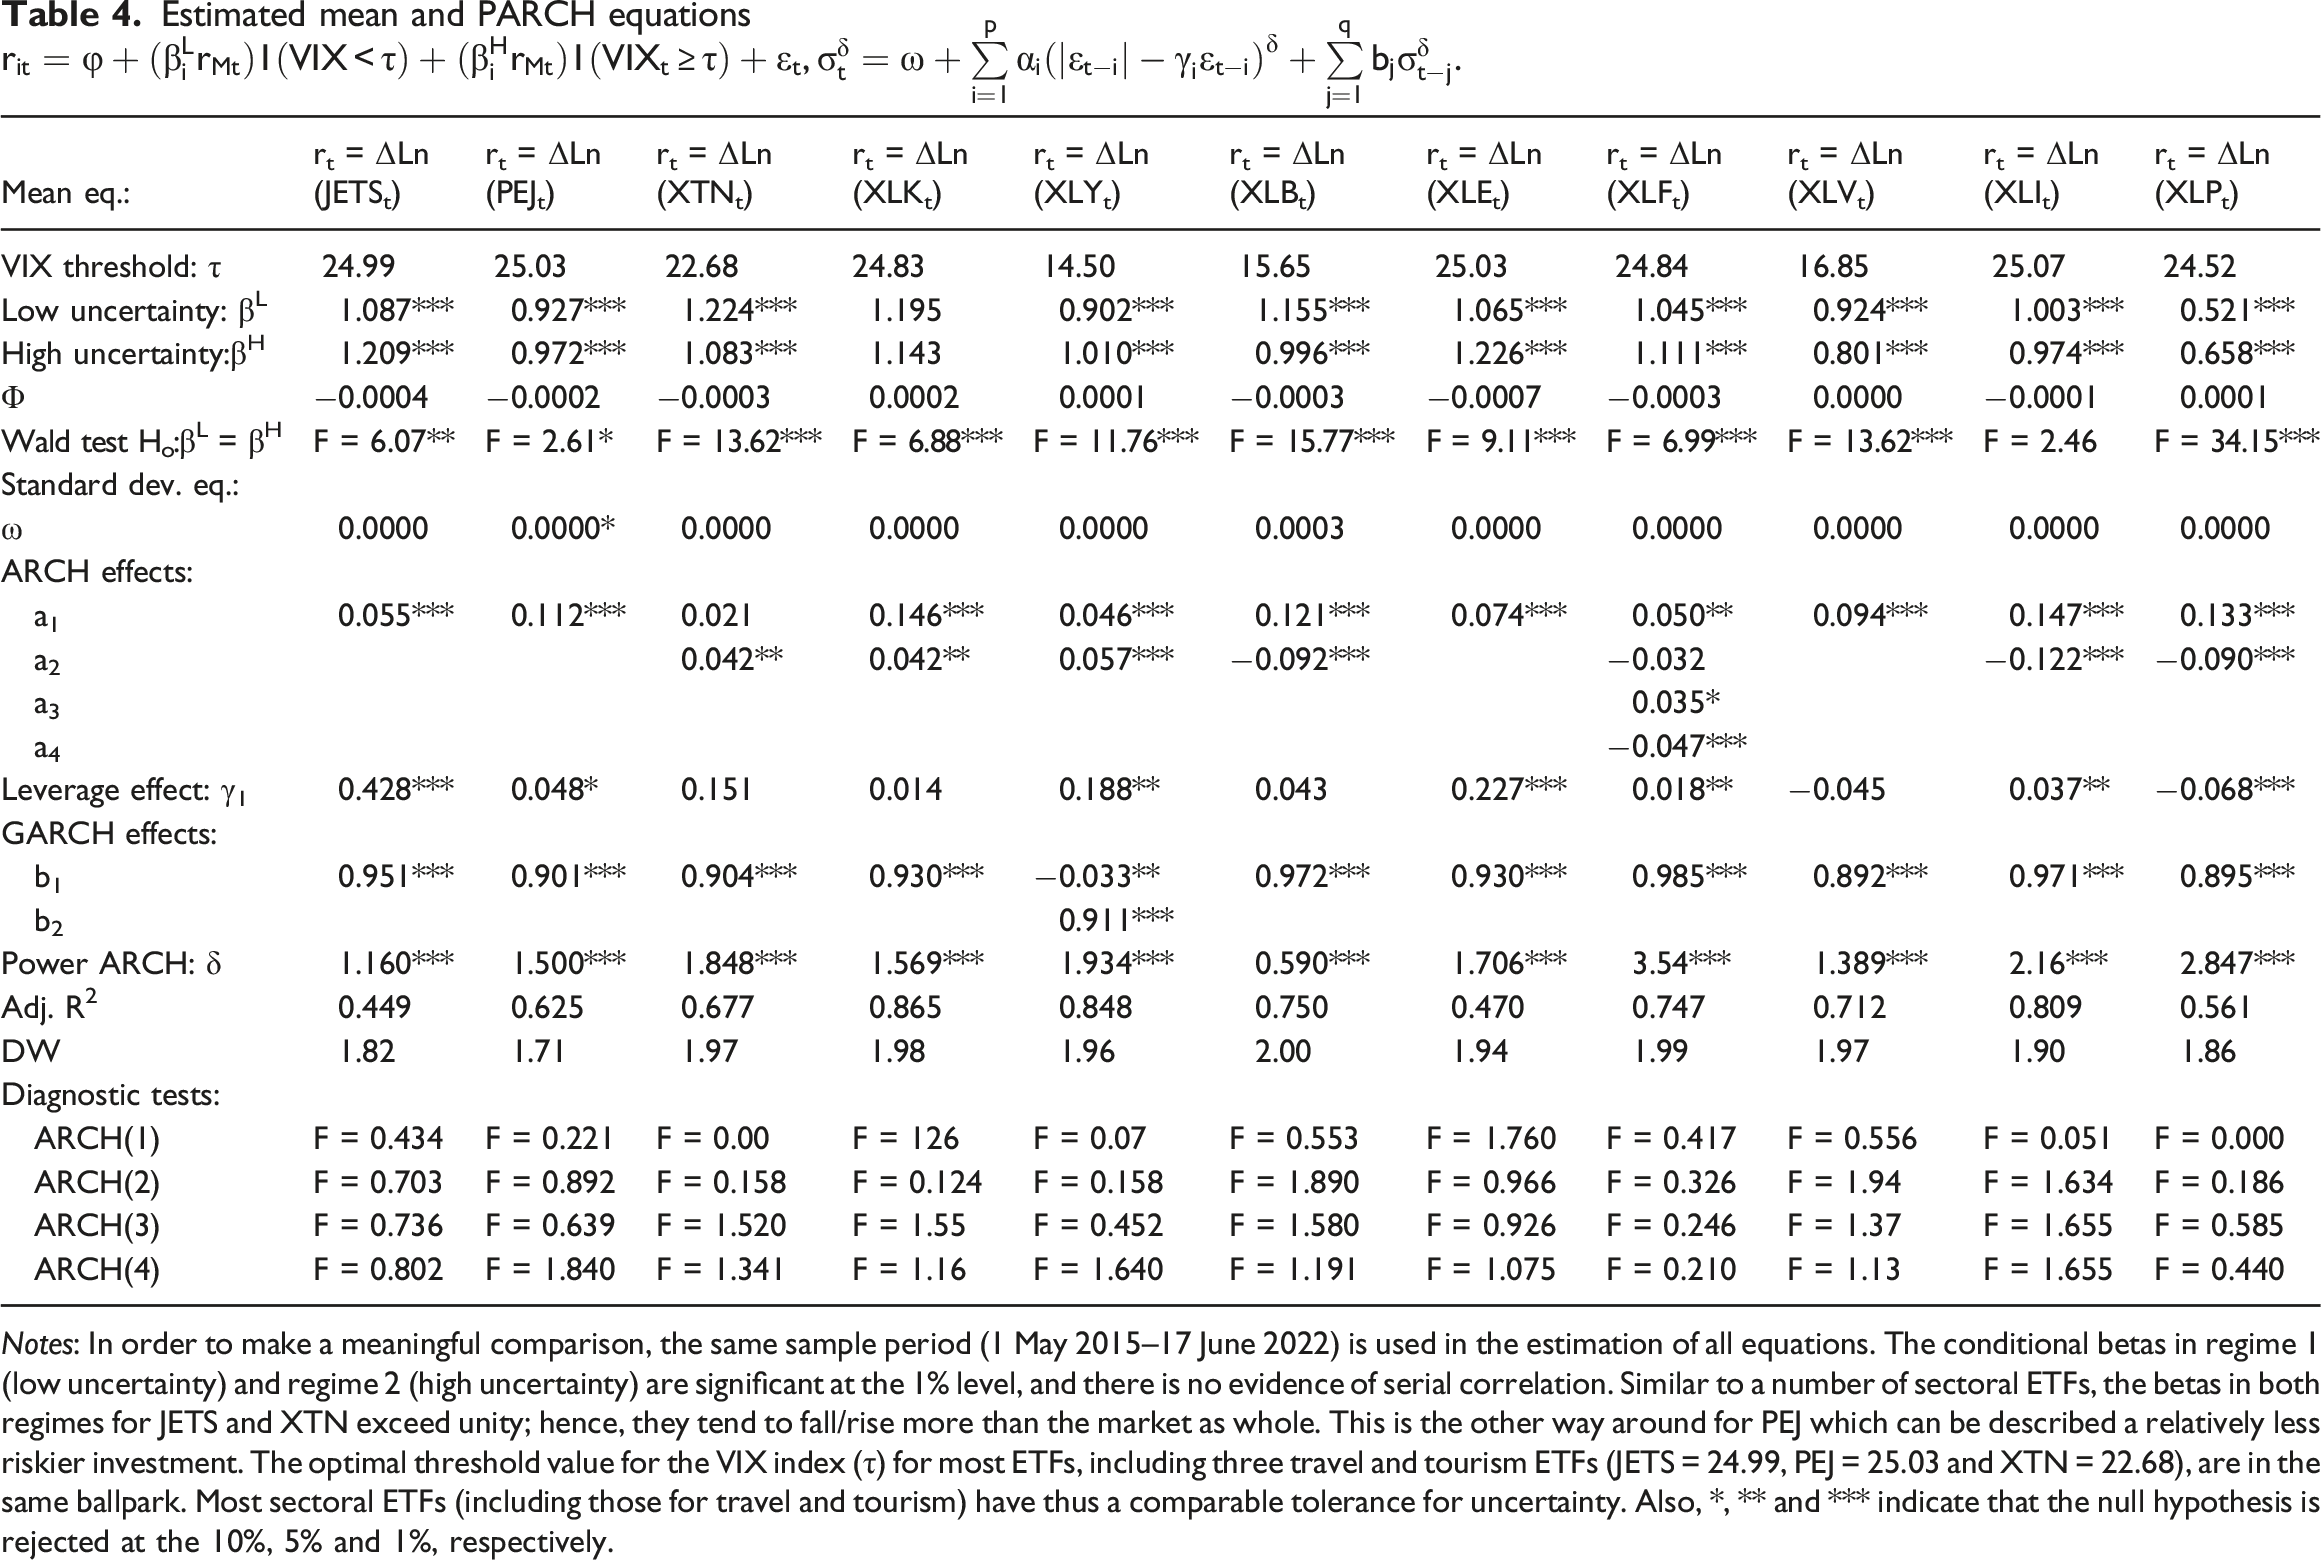
Notes: In order to make a meaningful comparison, the same sample period (1 May 2015–17 June 2022) is used in the estimation of all equations. The conditional betas in regime 1 (low uncertainty) and regime 2 (high uncertainty) are significant at the 1% level, and there is no evidence of serial correlation. Similar to a number of sectoral ETFs, the betas in both regimes for JETS and XTN exceed unity; hence, they tend to fall/rise more than the market as whole. This is the other way around for PEJ which can be described a relatively less riskier investment. The optimal threshold value for the VIX index (τ) for most ETFs, including three travel and tourism ETFs (JETS = 24.99, PEJ = 25.03 and XTN = 22.68), are in the same ballpark. Most sectoral ETFs (including those for travel and tourism) have thus a comparable tolerance for uncertainty. Also, *, ** and *** indicate that the null hypothesis is rejected at the 10%, 5% and 1%, respectively.
In relation to the first research question stated at the outset, these findings suggest that travel, leisure and tourism ETFs indeed respond asymmetrically to changes in the market in regimes 1 and 2. The estimated βH coefficients for JETS, PEJ, XLY, XLE, XLF and XLP are significantly larger than the estimated βL coefficients. These ETFs are thus relatively more sensitive to changes in the market when the VIX index exceeds their trigger point, which is mainly in the vicinity of 23–25. The lowest unconditional betas in both regimes belong to XLP (consumer staples), XLV (health), PEJ (leisure and entertainment) and XLI (industrials). These ETFs can thus be described as less risky. Irrespective of the level of uncertainty (proxied by the VIX index), these four ETFs tend to fall (rise) less than the other ETFs during the market pullback (rallies). It should be noted that Cowan (2020) argues that many investors turn to utilities, consumer staples and health care at the time of crises because they hold up better than other sectors.
As to the second research question, the results indicate that different tourism ETFs react differently to changes in the market. The estimated βL and βH for PEJ are less than those for JETS and XTN. This finding can be explained by the fact that PEJ is more diversified than the other two ETFs. The sectoral composition of PEJ is as follows: consumer services (78.8%), transportation (14.8%), distribution services (3.3%) and commercial services (3.1%). However, in terms of the percentage share, XTN (89.6%) and JETS (89.6%) heavily invest in transportation. Therefore, it is not surprising that PEJ is less riskier than JETS and XTN, irrespective of the level of uncertainty in the market as PEJ tends to fall (rise) less than the market.
Correlograms of the squared residuals and the Ljung–Box Q statistics.
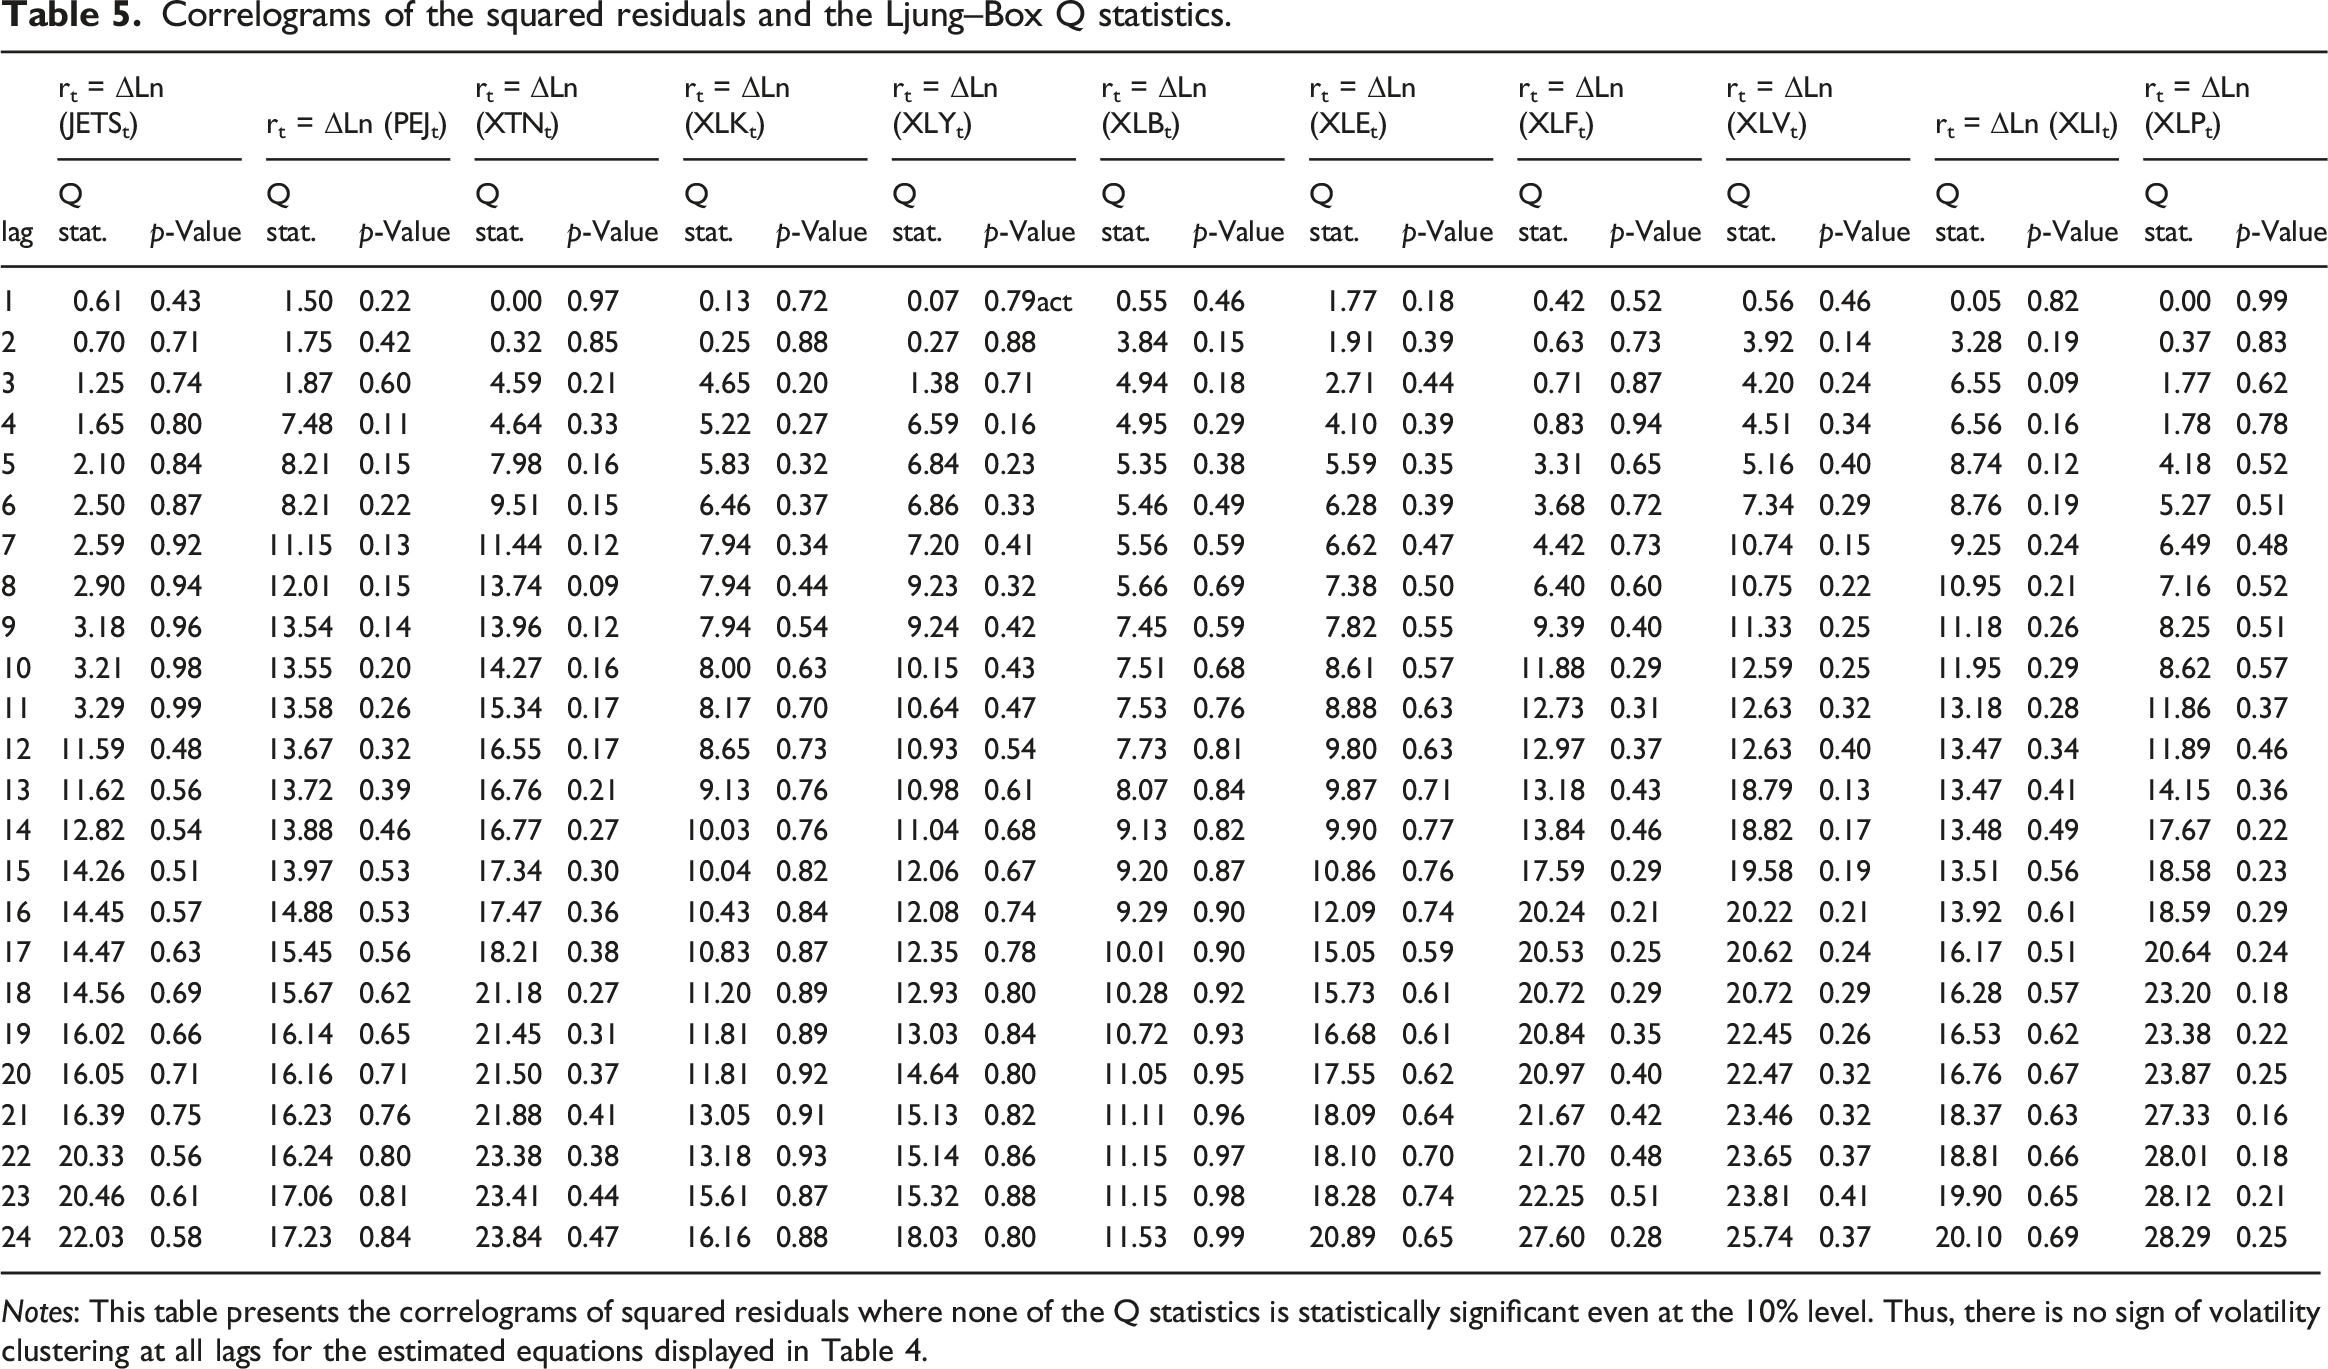
Notes: This table presents the correlograms of squared residuals where none of the Q statistics is statistically significant even at the 10% level. Thus, there is no sign of volatility clustering at all lags for the estimated equations displayed in Table 4.
In relation to the third and fourth research questions, it is found that the optimal threshold values for the VIX index (τ) for most ETFs, including three travel and tourism ETFs (JETS = 24.99, PEJ = 25.03, XTN = 22.68), are in the same ballpark. Therefore, one can argue that most sectoral ETFs (including those for travel and tourism) have a comparable tolerance for uncertainty. The lowest VIX threshold parameter belongs to XLY (τ = 14.50), XLB (τ = 15.65) and XLV (τ = 16.85). This means the sectoral ETFs for consumer discretionary, materials and health are more ‘skittish’ than the other ETFs because they easily switch to an uncertain regime as soon as the VIX index is slightly elevated. As a result, they are also more likely to remain in an uncertain regime. In contrast, the VIX index should rise substantially and reach 23–25 before the other eight ETFs (including the three travel and tourism ETFs) switch to an uncertain regime.
Figure 3 shows four unprecedented and comparable spikes in the VIX index since 1993, all relating to the 1997 Asian financial crisis, the 2008–2012 global financial crisis and more recently the outbreak of the COVID-19 pandemic in March 2020. The scatterplot between S&P500 returns and the VIX index in Figure 3 also indicates that there is very strong inverse relationship between the pairs when this index exceeds approximately 25 (see the oval in Figure 3). It is interesting to note that there are more frequent and sudden jumps in the VIX index in recent years. Plot of S&P500 daily returns and the VIX index (1 February 1993−8 April 2022). Notes: The top graph shows four unprecedented spikes in the VIX index since 1993. The bottom scatterplot reveals a very strong inverse relationship between the pairs but only when the VIX exceeds approximately 25. Source: The author’s calculations based on daily data obtained from https://finance.yahoo.com.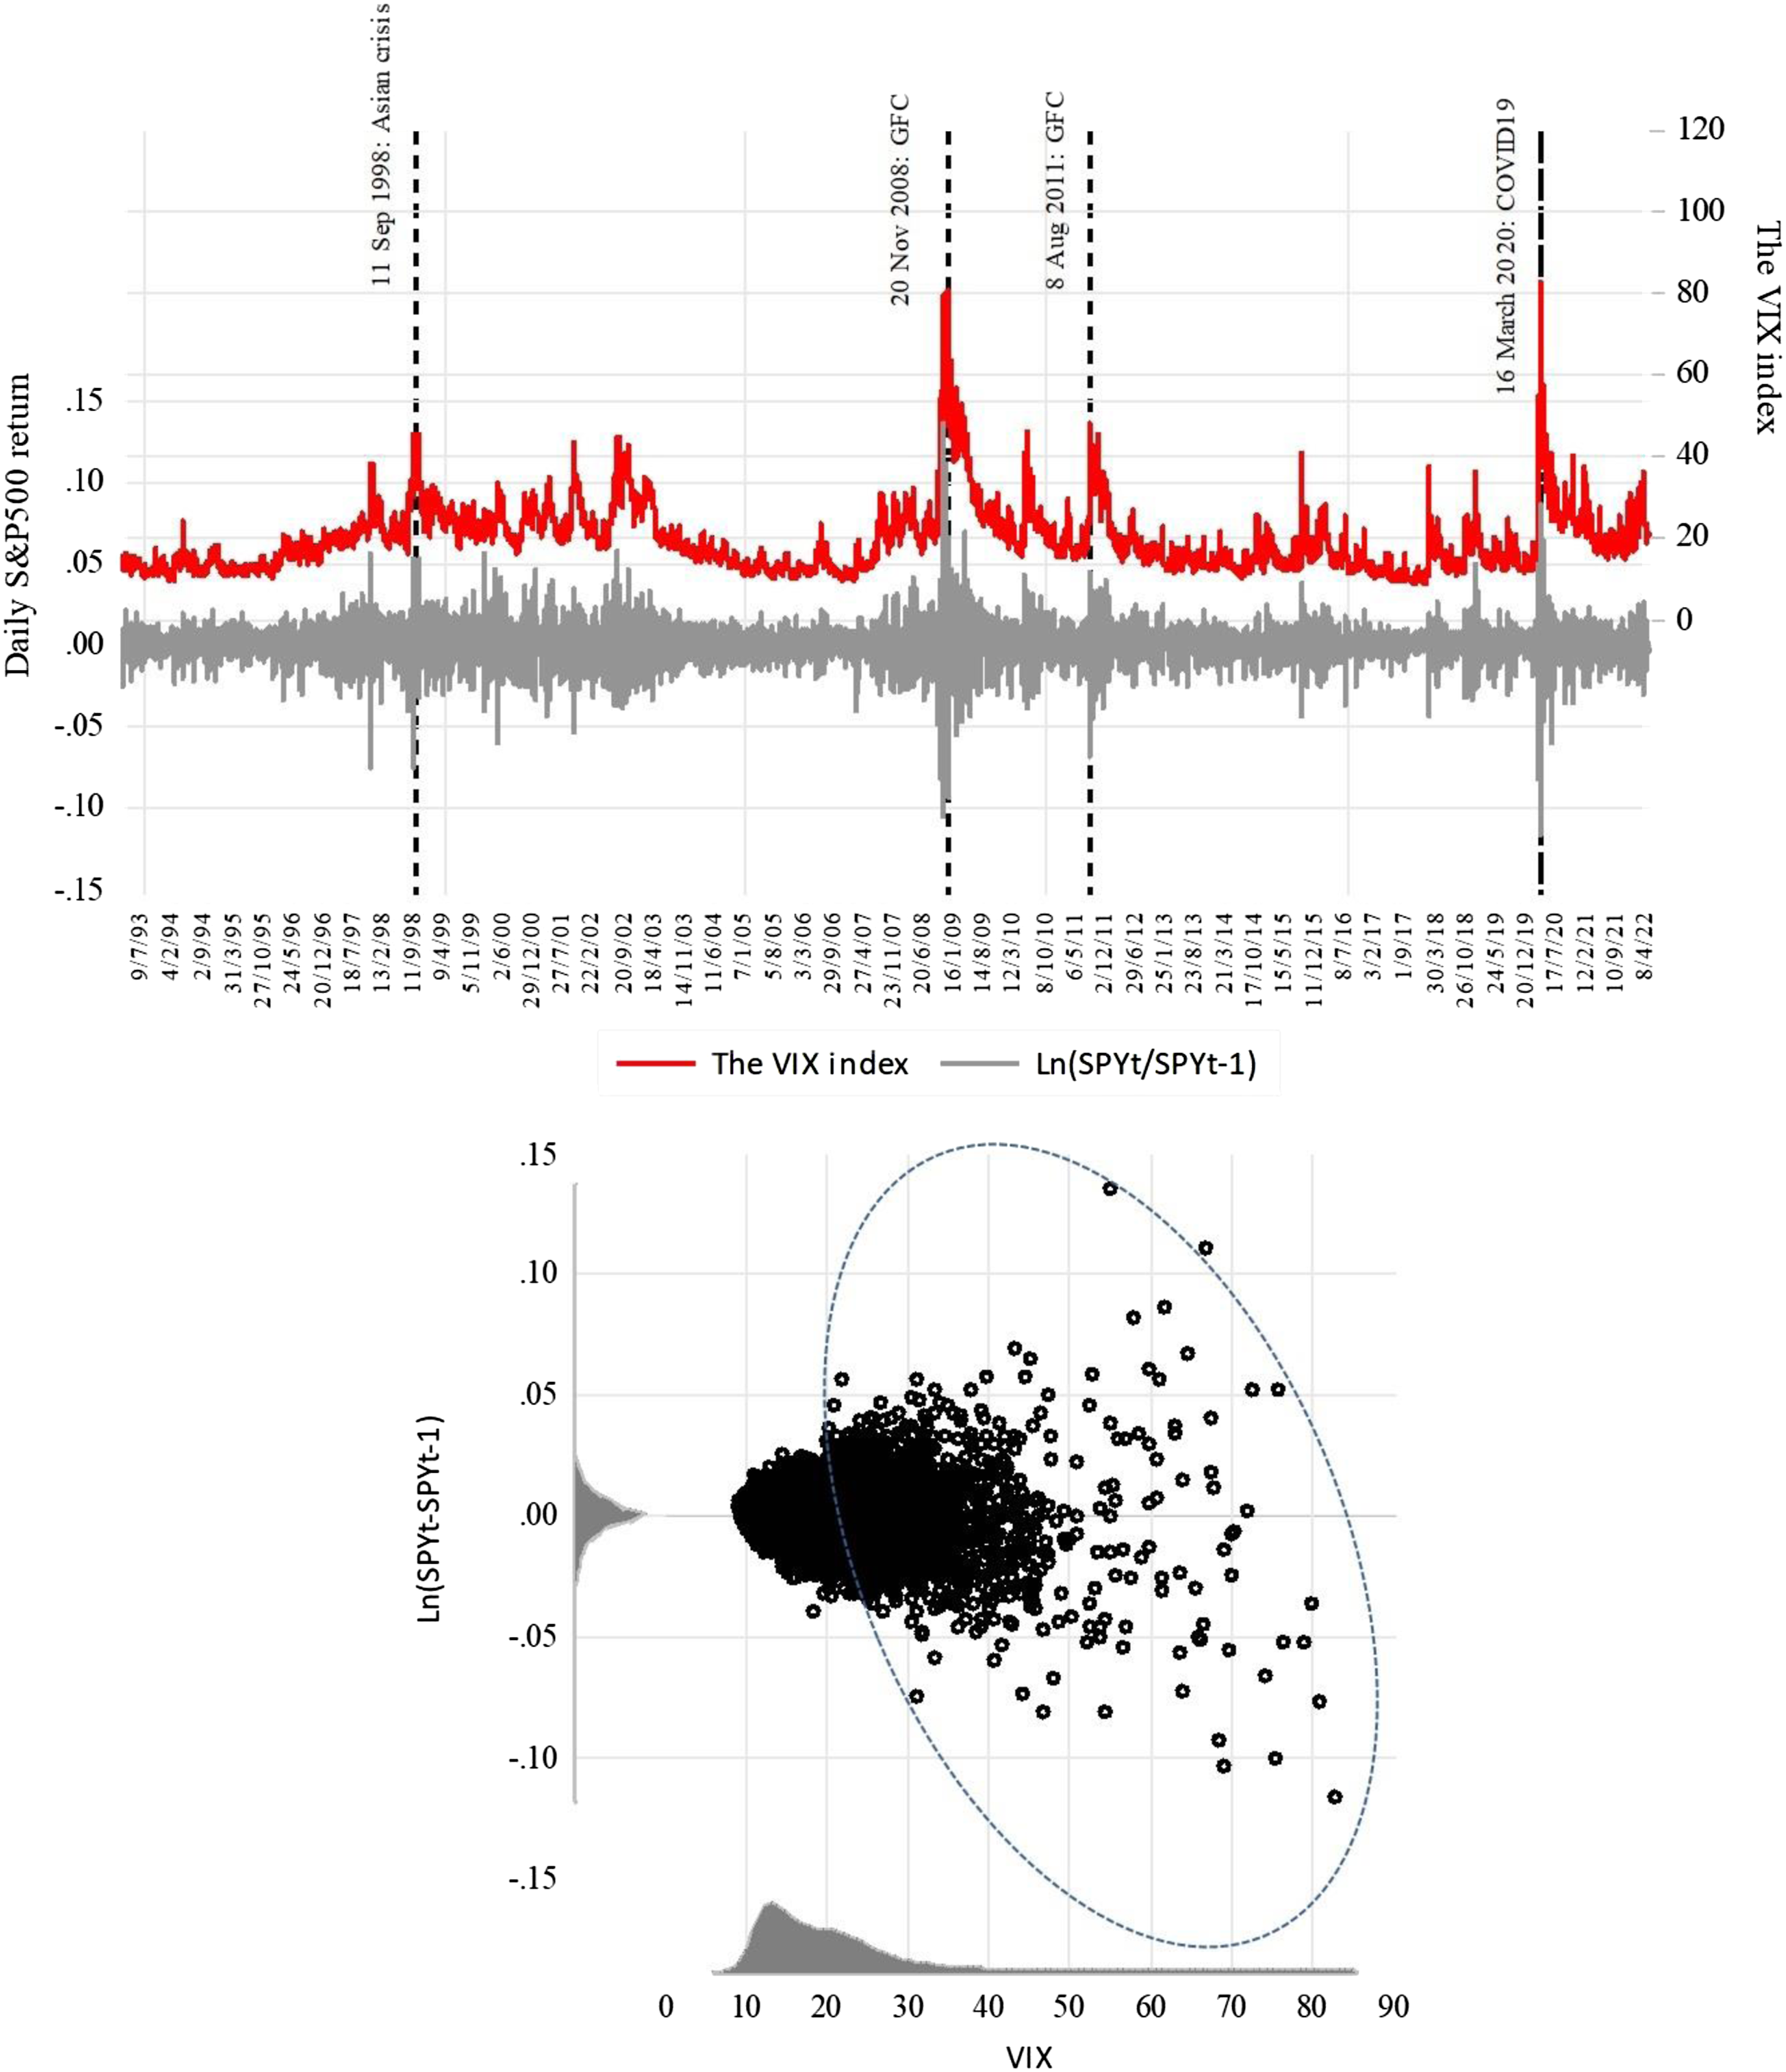
Overall, travel and tourism ETFs exhibit the same resilience to uncertainty as most other ETFs in the US. As a rule of thumb, it can be stated that when the VIX index exceeds approximately 25, investors in XLK, XLE, XLF, XLI and XLP as well as the three well-established travel and tourism ETFs start feeling fearful as they enter the state of uncertainty. A number of studies (Bekaert et al., 2013; Grechi et al., 2017; Whaley, 2000) have already established that the VIX index strongly covariates with monetary conditions, consumer and investor sentiments and broader economic activities. Therefore, it is not surprising to observe a similar threshold for uncertainty across a number of sectors. According to Grechi et al. (2017), changes in the VIX index affect the risk-adjusted return performance of travel and tourism stocks, particularly during turbulent times when the VIX index is elevated. Similarly, using causality and cointegration tests, Akdağ et al. (2019) also found that an increase in the VIX index can adversely influence the returns of businesses operating in the tourism sector in 11 countries. In the present study, the threshold values for the VIX index (τ) for all three travel and tourism ETFs (JETS = 24.99, PEJ = 25.03 and XTN = 22.68) are very similar. As discussed earlier, this finding can be explained by the fact that their stocks are selected from similar industries resulting in a strong degree of positive covariations as shown in Table 2.
According to Table 4, the leverage effect (γ1) is statistically significant with the correct sign for seven out of the eleven ETFs (i.e. JETS, PEJ, XLY, XLE, XLF, XLI and XLP), suggesting that for these ETFs bad news increases volatility more than good news or put simply ‘pessimism is more contagious than optimism’. The sum of ARCH effects (Σαi) varies from 0.006 for XLF to 0.188 for XLK, and the three travel and tourism ETFs lie somewhere in between. The sum of GARCH effect (Σbj) varies from 0.985 for XLF to 0.878 for XLY, where the relevant figures for the three travel and tourism ETFs lie consistently above 0.90. This means that the effect of past volatility shocks on future volatility in the travel and tourism sector is more or less the same as the other sectors. Given the estimated GARCH effects, shocks in the market tend to have the highest degree of inertia and persistence for XLF. In relation to the three travel and tourism ETFs, the sum of GARCH effect (Σbj) indicates that once a shock hits the market it takes slightly longer for JETS (b1 = 0.951) to return to normalcy than XTN (b1 = 0.904) and PEJ (b1 = 0.901). Given the constituents of the three travel and tourism ETFs are from similar market segments, the estimated GARCH (inertia) coefficients are not significantly dissimilar. A quick glance at Table 2 also confirms a strong degree of pairwise covariations among the three ETFs throughout the sample period.
Structural breaks in the mean equations for three travel and tourism ETFs
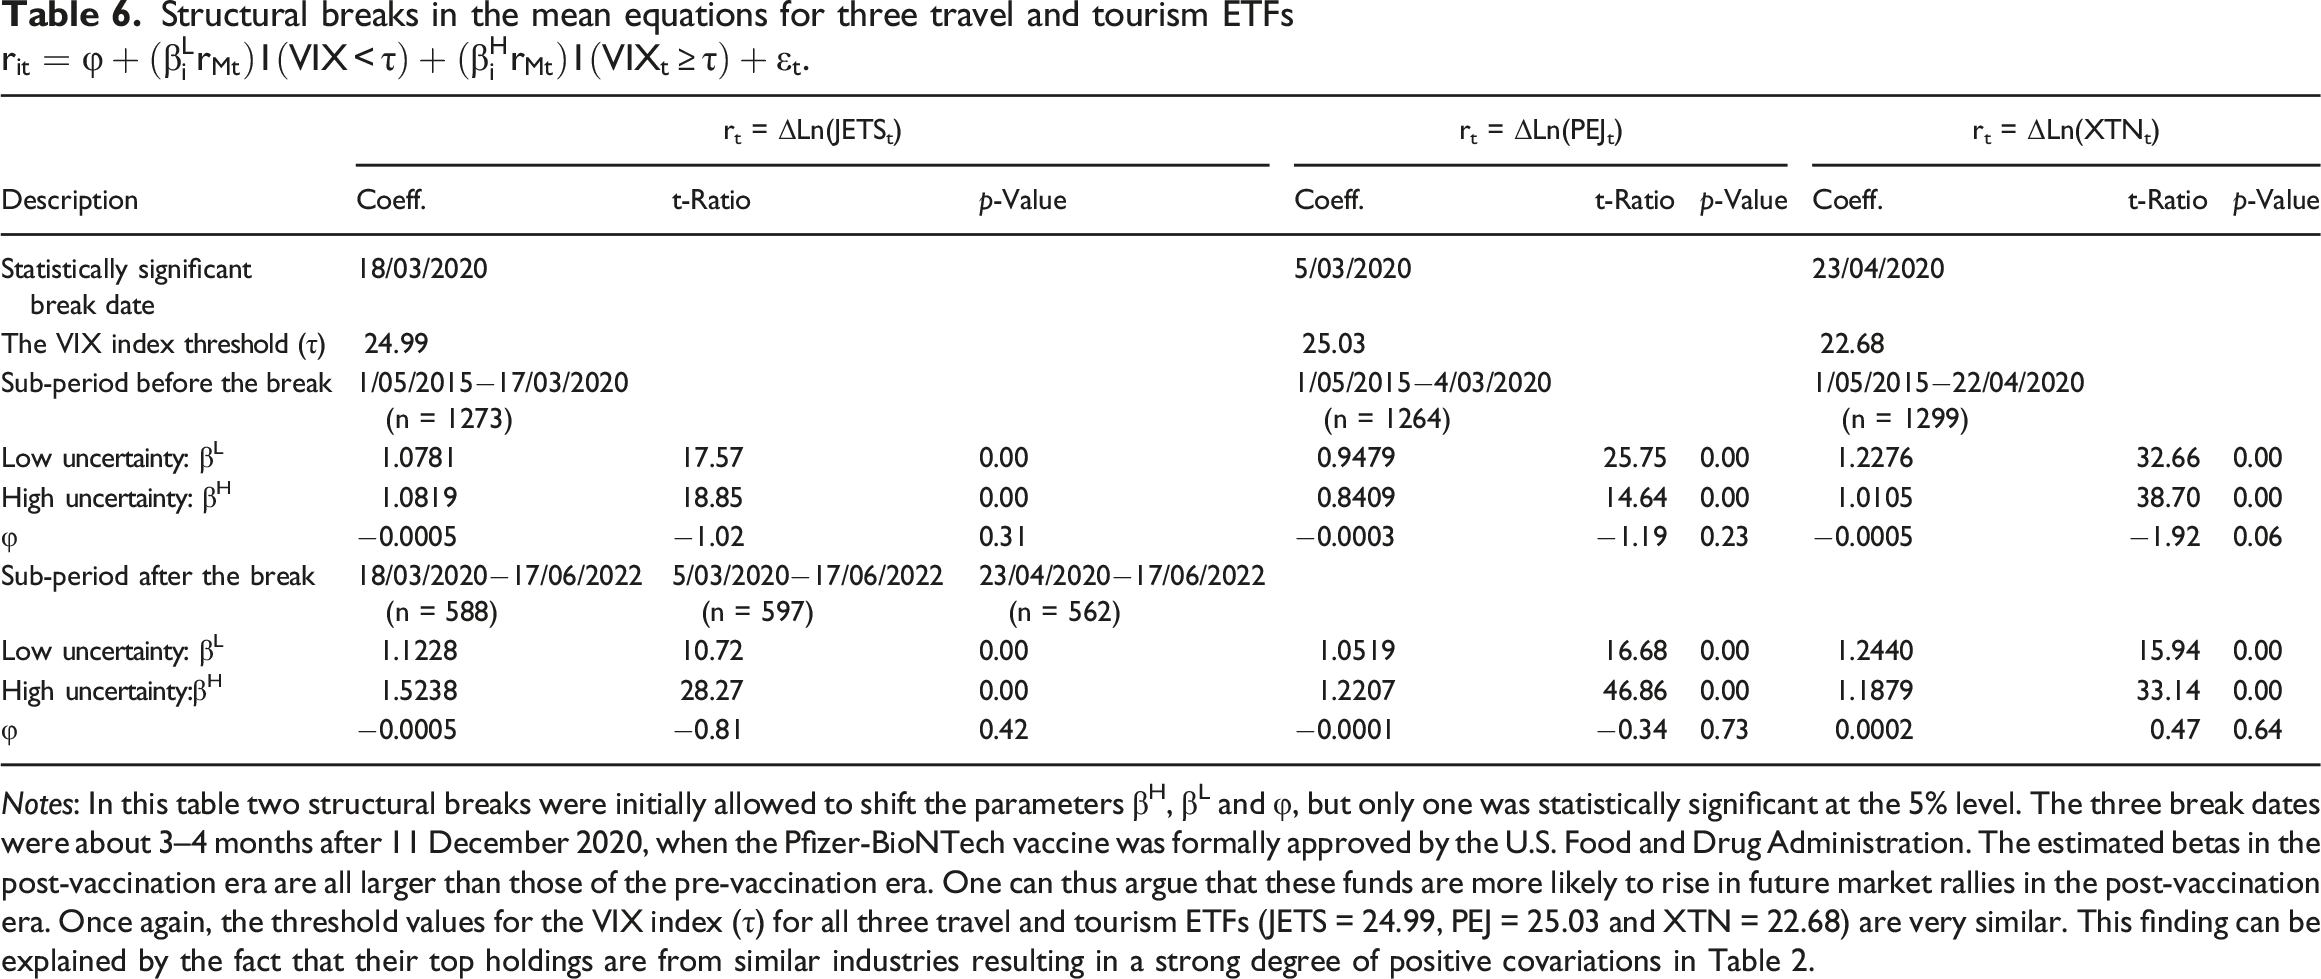
Notes: In this table two structural breaks were initially allowed to shift the parameters βH, βL and φ, but only one was statistically significant at the 5% level. The three break dates were about 3–4 months after 11 December 2020, when the Pfizer-BioNTech vaccine was formally approved by the U.S. Food and Drug Administration. The estimated betas in the post-vaccination era are all larger than those of the pre-vaccination era. One can thus argue that these funds are more likely to rise in future market rallies in the post-vaccination era. Once again, the threshold values for the VIX index (τ) for all three travel and tourism ETFs (JETS = 24.99, PEJ = 25.03 and XTN = 22.68) are very similar. This finding can be explained by the fact that their top holdings are from similar industries resulting in a strong degree of positive covariations in Table 2.
Conclusions
The aim of this paper is to examine the sensitivity of daily price returns of major ETFs to market uncertainty across different sectors including travel, leisure and tourism. To this end, a mean equation is specified in which conditional betas switch from regime 1 (low uncertainty) to regime 2 (high uncertainty) when the VIX index exceeds an endogenously determined threshold for each sector. Given the use of high frequency data, this study also captures volatility clustering in the squared residuals of the estimated mean equations by a parsimonious power-ARCH (PARCH) model. The sample includes daily price returns for three well-established travel, leisure and tourism ETFs (JETS, PEJ and XTN) as well as eight other US-based ETFs in the following sectors: materials (XLB), energy (XLE), financial (XLF), industrial (XLI), technology (XLK), consumer staple (XLP), health (XLV) and consumer discretionary (XLY).
To make meaningful comparisons, this study utilizes the same sample period (1 May 2015−17 June 2022) in the estimation of all equations. The three travel, leisure and tourism ETFs were consistently outperforming the market until March 2020 when the normalized VIX index suddenly jumped to three due to the COVID-19 pandemic. In eight out of the eleven ETFs in the sample (including three travel and tourism ETFs), investors tend to switch to an uncertain regime when the VIX index exceeds 23–25. Only in the following three sectors (XLY = 14.50, XLB = 15.65 and XLV = 16.85) such a threshold is below 23 and as a result their tolerance for uncertainty is relatively low and they are more likely to remain in an uncertain regime longer. It is interesting to note that for PEJ and XLP the estimated betas in both regimes are below unity, whereas for the other nine ETFs (including JETS and XTN) they exceed unity. This means PEJ falls (rises) less the market as a whole, whereas JETS and XTN fall (rises) more than the market during pullbacks and rallies. Similar to other sectoral ETFs, there is a leverage effect for JETS and PEJ, whereby bad news causes more volatility than good news. Finally, it is found that the estimated sum of GARCH effects for all travel and tourism ETFs is more than 0.90; hence, future shocks are more likely to exhibit a strong degree of inertia and persistence. These findings have important implications for large travel and tourism firms that intend to raise capital in the US, particularly during heightened uncertainty.
Footnotes
Declaration of conflicting interests
The author(s) declared no potential conflicts of interest with respect to the research, authorship and/or publication of this article.
Funding
The author(s) received no financial support for the research, authorship and/or publication of this article.
Note
Author biography
![]() .
.