Global perspective on the permanent or transitory nature of shocks to tourist arrivals: Evidence from new unit root tests with structural breaks and factors
Free accessResearch articleFirst published online February, 2024
Global perspective on the permanent or transitory nature of shocks to tourist arrivals: Evidence from new unit root tests with structural breaks and factors
This study extends the literature on the permanent or transitory nature of shocks to per capita tourist arrivals along several dimensions. First, the study evaluates the nature of shocks to per capita tourist arrivals for a global panel of 129 countries. Second, unlike previous studies, we jointly estimate structural changes that represent either abrupt breaks or as a Fourier approximation of smooth breaks along with introducing a factor structure to test for the presence of unit roots in per capita tourist arrivals. Third, contrary to previous studies, our results show that rejection of the null hypothesis of a unit root in per capita tourist arrivals is quite limited compared to other unit root tests that fail to account for cross-correlations. Policy implications of the findings are also discussed.
The United Nations World Tourism Organization noted a 4% increase in international tourist arrivals, reaching 1.5 billion in 2019. However, we observed a decline of 74% globally due to the onset of the COVID-19 pandemic in the first quarter of 2020 alone. Even the first quarter of 2021 witnessed a decrease of 83%.1 The emergence of the COVID-19 virus, the rapid development of a vaccine, and the recurring mutations of the virus have generated a great deal of uncertainty about its global impact, particularly in the tourism sector. While tourism researchers understand the susceptibility of the tourism sector to exogenous shocks and the subsequent negative impact of such shocks, the question remains whether shocks to tourist arrivals are permanent or transitory. This question is even more relevant in light of the global economic repercussions of the recent COVID-19 pandemic (Payne et al., 2022b, among others).
Indeed, international tourism contributes significantly to the balance of payments for destination countries through foreign exchange earnings and government revenues (UNWTO, 2020). As such, examining the effects of shocks on international tourist arrivals that impact the flow of foreign exchange earnings and tourism revenues is important for the sustainability of a country’s tourism and hospitality sector. In this regard, we evaluate the permanent or transitory nature of shocks through panel unit root tests that simultaneously recognize structural breaks and common factors. Yucel (2021) notes that country-specific shocks occurring in a country may lead to spillover effects on international tourist arrivals in other countries. Hence, the panel framework proposed in this study allows for the interdependence between tourist arrivals in various countries. If tourist arrivals follow a unit root process, then shocks to tourist arrivals will have a permanent impact as tourist arrivals will not return to their original trend. On the other hand, if tourist arrivals are stationary, shocks will have a transitory impact. As for the policy implications, if an adverse shock is considered transitory, the need for a policy response is less likely, whereas an adverse shock viewed as permanent in nature will more likely require an offsetting policy response.
This study extends the research on the second-generation panel unit root and stationarity tests to determine the permanent or transitory nature of shocks to tourist arrivals by Lee et al. (2014), Yang et al. (2014), Solarin (2015), Dash et al. (2017), Xie et al. (2018), Kyophilvaong et al. (2019), Yucel (2021), and Payne and Nazlioglu (2022) on several fronts. First, as the literature review will show, this study will be the largest multi-country examination of a global panel of 129 countries. Second, we employ a new panel unit root test that allows for both structural breaks and cross-sectional dependence (i.e. common factors) simultaneously. The presence of cross-sectional dependence due to unobservable common factors or spatial spillover effects is a serious consideration in the estimation and the validity of inferences drawn from panel data models (Baltagi and Pirotte, 2010). Studies by Pesaran (2006), Bai (2009), among others, suggest using factor structures associated with the error terms to appropriately model such cross-sectional dependence. Likewise, the absence of structural breaks within the modeling framework may lead to inconsistent estimation and invalid inferences. As noted by Bai (2010), Baltagi et al. (2016), and Baltagi et al. (2017), standard panel estimators may be biased when not appropriately accounting for cross-correlations and structural breaks. To address these concerns, we employ new panel unit root tests that utilize either the two break tests of Lee and Strazicich (2003b) or the Fourier approximation of Enders and Lee (2012a,b) to capture smooth breaks alongside the PANIC procedure of Bai and Ng (2004) within a factor structure to account for cross-correlations. Finally, this new test is compared to several unit root tests with and without structural breaks and/or cross-correlations to gauge the sensitivity of the results.
Section 2 provides an overview of the literature on the unit root properties of tourist arrivals, expenditures, and receipts. Section 3 describes the methodology and data while Section 4 presents the empirical results with discussion. Concluding remarks are given in Section 5.
Literature review
The literature on the time series behavior of tourist arrivals, expenditures, and receipts with respect to the extent to which shocks are permanent or transitory has emerged in recent years. While several studies have evaluated the degree of persistence through fractional integration models, we focus our review of the literature on those studies utilizing unit root and stationarity tests with and without structural breaks and/or cross-sectional dependence.2Table 1 displays a summary table of the literature utilizing unit root/stationarity tests in regards to tourist arrivals, expenditures, and receipts.
Summary of empirical studies (Chronological order).
Lee and Strazicich (2003a,b) tests without structural breaks reveal stationarity of visitor arrivals for eight of the 28 countries, with one structural break stationarity for 13 of the 28 countries, and with two structural breaks stationarity for 25 of the 28 countries. The LM panel unit root test with structural breaks and Im et al. (2003) test supports stationarity for the panel of countries.
Seemingly unrelated regresssion Dickey and Fuller (1979, 1981) and Taylor and Sarno (1998) tests reveal stationarity of visitor arrivals for the panel of 20 countries and G7 countries, but non-stationarity for the eight country Asian panel. Im et al. (2005) test with structural breaks supports stationarity for all three country panels.
Lee and Strazicich (2003a,b) test with one break in the intercept reveals stationarity of international visitor arrivals for six of the 10 countries, with breaks in the intercept and slope stationarity for nine of the 10 countries, and with two breaks stationarity for all 10 countries.
Lee and Strazicich (2003a,b) test with structural breaks reveals stationarity of international tourist arrivals for all 10 countries and Im et al. (2005) test with structural breaks supports stationarity for the panel of countries.
Lee and Strazicich (2003a,b) test with one and two structural breaks reveals stationarity of international visitor arrivals for all 15 countries while Im et al. (2005) test with one and two structural breaks supports stationarity for the panel of countries.
Carrion-i-Silvetre et al. (2005) test with structural breaks reveals stationarity of international tourist arrivals for individual countries and the panel of countries.
Kwiatkowski et al. (1992) test with structural breaks and Fourier function reveals stationarity of tourist arrivals with the exception of South Korea and Europe while Carrion-i-Silvestre et al. (2005) test with Fourier function for graduate breaks supports stationarity for the panel of countries and regions.
Dickey and Fuller (1979, 1981) test reveals stationarity of visitor arrivals for seven of the 15 countries while Im et al. (2003) test supports stationarity for the panel of countries.
Kruse (2011) non-linearity test reveals stationarity of international tourist arrivals for 15 of the 16 countries while Lee and Strazicich (2003a,b) test with structural breaks supports stationarity (linearity test) in Malagasy Republic.
Choi (2006) test reveals stationarity of tourist arrivals for Brazil and Russia panels and non-stationarity for India and China panels. Pesaran (2007) test supports non-stationarity for Brazil, Russia, and India panels and stationarity for China panel. Demestrescu and Hanck (2012) tests find stationarity for Brazil, Russia, and India panels while non-stationarity for China panel. Im et al. (2005) test with structural breaks shows stationarity for Brazil, Russia, India, and China panels.
Total tourist arrivals to La Reunion, tourist arrivals to La Reunion disaggregated by major source markets, and tourist arrivals to La Reunion disaggregated by visiting motivations
Nazlioglu and Karul (2017) and Nazlioglu et al. (2021) panel tests reveal non-stationarity. Tests of stationarity with a common factor structure without structural breaks at the individual country level support non-stationarity in 24 and 26 countries with respect to per capita tourism expenditures and receipts, respectively. With inclusion of a Fourier function for gradual breaks and the common factor structure show non-stationarity in 48 and 54 countries with respect to per capita tourism expenditures and receipts, respectively.
A great deal of the research to date has focused on the Asia-Pacific Rim region. Narayan (2005a) employs the Zivot and Andrews (1992) and Lumsdaine and Papell (1997) unit root tests with structural breaks to examine the stationarity of real tourism expenditures in Fiji. The structural breaks identify the military coup in 1987, but the null hypothesis of a unit root is rejected to suggest the military coup was only a temporary shock. In a related study, Narayan (2005b) finds non-stationarity of tourism expenditures in Fiji; however, the Vogelsang (1997) structural break test and Vogelsang and Perron’s (1998) unit root test confirm a structural break with the 1987 military coup and the stationarity of tourism expenditures. Narayan (2005c) deploys Sen’s (2003) unit root test with structural breaks alongside the augmented Dickey and Fuller (1979, 1981) and Phillips and Perron (1988) unit root tests, as well as the Kwiatkowski et al. (1992) stationarity test to examine visitor arrivals from Australia, New Zealand, and the U.S. to Fiji. The results indicate that visitor arrivals follow a stationary process once structural breaks are introduced.
Through the seemingly unrelated regression Dickey and Fuller (1979, 1981) and augmented Dickey-Fuller (MADF) tests of Taylor and Sarno (1998), Narayan and Prasad (2008) show that tourist arrivals to Australia from a panel of 20 tourist source markets and G7 countries, respectively, are stationary, which is not the case for a panel of eight Asian countries. However, when using the Im et al. (2005) panel unit root tests with structural breaks, they find that all three country panels are stationary. In another study, Narayan (2008) uses univariate and panel unit root tests with respect to visitor arrivals to Australia from 28 tourist source markets. The results from the univariate Lagrange multiplier (LM) tests of Lee and Strazicich (2003a, 2003b) indicate that when structural breaks are not allowed for the null hypothesis of a unit root is rejected for eight of the 28 countries. But, when one structural break is considered the null hypothesis is rejected for 13 of the 28 countries, and with two structural breaks the null hypothesis is rejected for 25 of the 28 countries. The panel LM version of the test, including one and two structural breaks, based on the panel test of Im et al. (2003) reveals that visitor arrivals are stationary. Valadkhani and O’Mahony (2018) undertake a much larger study of tourist arrivals from 53 countries to Australia. The augmented Dickey and Fuller (1979,1981) and Phillips and Perron (1988) unit root tests show that tourist arrivals are non-stationarity for most countries. On the other hand, the Kwiatkowski et al. (1992) test identifies tourist arrivals from 48 of the 53 countries as stationary, while the Zivot and Andrews (1992) test finds stationarity in 50 of the 53 countries.
In addition to the research on Australia, a number of studies investigate tourist arrivals to Singapore. Lee (2009) tests the stationarity of tourist arrivals to Singapore from 12 major source markets using the joint augmented Dickey and Fuller (1979, 1981) and Kwiatkowski et al. (1992) test to discover that tourist arrivals except from India, Malaysia, and the U.S. are stationary. Lee (2011) employs the Zivot and Andrews (1992) unit root test with one structural break for visitor arrivals from China, Australia, India, Japan, the U.K., South Korea, and the U.S. to Singapore. The results fail to reject the null hypothesis of a unit root, lending support for the permanent nature of shocks. Tan and Tan (2014) apply the Carrion-i-Silvestre et al. (2005) panel stationarity test with structural breaks to examine tourist arrivals to Singapore from 20 major source markets to find the shocks to tourists arrivals are temporary.
Several studies evaluate tourist arrivals in the case of Malaysia. Lean and Smyth (2009) utilize the Lee and Strazicich (2003a, 2003b) one and two structural break unit root tests for visitor arrivals to Malaysia from the top 10 tourist source markets to show that tourist arrivals from all countries are stationary with allowance for two structural breaks. Using the Wu and Lee (2009) unit root test with allowance for both non-linearity and cross-sectional dependence, Solarin (2015) examines the tourist arrivals from the 10 major source markets to the community of Sarawak on the island of Borneo in Malaysia to discover that shocks to tourist arrivals are transitory.
A number of studies also examine the time series behavior of tourist arrivals to Taiwan. Chu et al. (2008) investigate tourist arrivals from 22 countries to Taiwan using a battery of univariate unit root and stationarity tests to reveal the non-stationarity of visitor arrivals. In contrast, the Breuer et al. (2001) panel SURADF unit root test identifies the stationarity of tourist arrivals from 10 of the 22 countries. Lee et al. (2014) employ a variety of first- and second-generation unit root tests to determine the stationarity of tourist arrivals to Taiwan from six countries and regions. While the panel tests of Maddala and Wu (1999), Levin et al. (2002), Im et al. (2003), Moon and Perron (2004), and Pesaran (2007) support stationarity, the tests by Choi (2002), Bai and Ng (2004), and Chang (2002) provide evidence of non-stationarity. Further results show that the Ucar and Omay (2009) non-linear panel unit root test, which combines the non-linear framework of Kapetanios et al. (2003) and the panel unit root procedure of Im et al. (2003) with the sequential panel selection method of Chortareas and Kapetanios (2009), also support stationarity in tourist arrivals with the exception of South Korea. Yang et al. (2014) utilize the panel stationarity tests of Carrion-i-Silvestre et al. (2005) with a non-linear Fourier function and individual Kwiatkowski et al. (1992) stationarity tests with allowance for sharp and smooth breaks to test the stationarity of tourist arrivals from Japan, Southeast Asia, Hong Kong and Macao, the U.S., South Korea, and Europe to Taiwan. Their results show stationarity of tourist arrivals for the overall panel of countries and regions; however, on an individual basis tourist arrivals are non-stationary in the case of South Korea and Europe.
In addition, there have been several other studies of international tourist arrivals to Asian countries. Using visitor arrival data from 18 countries to China, Chu et al. (2014) discover that the panel unit root tests of Levin et al. (2002), Im et al. (2003), Maddala and Wu (1999), and Hadri (2000) fail to reject the null hypothesis of a unit root in all the countries. However, the Breuer et al. (2001) panel SURADF test fails to reject the null hypothesis of a unit root for only 13 of the 18 countries (Indonesia, Malaysia, Philippines, Singapore, Korea, Thailand, U.K, Germany, France, Italy, Portugal, Sweden, and Switzerland).
Tang and Wong (2009) explore the impact of the SARS epidemic on international visitor arrivals from five geographical regions (ASEAN, Asia and Oceania, Europe, and the Americas) to Cambodia. With the exception of Indonesia, the augmented Dickey and Fuller (1979, 1981) unit root test reveals that visitor arrivals to Cambodia are non-stationary, while the tests of Lanne et al. (2002) and Saikkonen and Lutkepohl (2002) with structural breaks demonstrate stationarity. Saleh et al. (2011) examine the time series behavior of tourist arrivals from 10 countries to Thailand using the Lee and Strazicich (2003a, 2003b) univariate unit root tests with structural breaks and the Im et al. (2005) panel unit root tests with structural breaks. Both the univariate and panel unit root tests reject the null hypothesis of a unit root.
In addition to the numerous studies related to Asia-Pacific Rim countries, a number of other country studies have been undertaken. Lorde et al. (2009) test the stationarity of tourist arrivals from the U.S., U.K, Canada, and other minor markets to Barbados using the augmented Dickey and Fuller (1979, 1981) unit root test and Kwaitkowski et al. (1992) stationarity test to demonstrate the non-stationarity of tourist arrivals. The panel unit root tests of Breitung (2000), Hadri (2000), Levin et al. (2002), and Im et al. (2003) reveal that exogenous shocks will have permanent effects on tourist arrivals to Barbados. Bassil et al. (2014) evaluate international visitor arrivals from Yemen, Kuwait, Qatar, Algeria, Bahrain, Oman, United Arab Emirates, Tunisia, Egypt, Jordan, Morocco, Syria, Iraq, Saudi Arabia, and expatriate Lebanese to Lebanon using the Lee and Strazicich (2003a, 2003b) univariate unit root tests and Im et al. (2005) panel unit root test with structural breaks to show that tourist arrivals are stationary.
Dedeoglu (2016) utilizes the augmented Dickey and Fuller (1979, 1981) unit root test and the panel unit root test of Im et al. (2003) to investigate the stationarity of tourist arrivals from 15 major source markets to Turkey. The null hypothesis of a unit root is rejected for Germany, Netherlands, France, the U.S., Georgia, Romania, and Syria, while the Im et al. (2003) panel unit root test rejects the null hypothesis of a unit root for the panel of countries. Solarin (2016) applies the Kruse (2011) non-linear unit root test to examine the 16 major tourism source markets to Mauritius to find that international tourist arrivals are stationary in 15 of the 16 countries; however, the linear unit root test of Lee and Strazicich (2003a, 2003b) supports stationarity for tourist arrivals from the Malagasy Republic. Charles et al. (2019) use data on total tourist arrivals, disaggregated tourist arrivals by major source markets, and tourist arrivals disaggregated by visitor motivations to the French island of La Reunion. Charles et al. (2019) implement the structural break tests of Perron and Yabu (2009) and Kejriwal and Perron (2010), then applies the Elliott et al. (1996) unit root tests to discover, with the exception of European tourist arrivals and business visitation, the transitory effect of external shocks.
Dash et al. (2017) use several panel unit root tests to yield mixed results with respect to the stationarity of tourist arrivals to BRIC countries. Choi (2006) tests reveal stationarity of tourist arrivals to Brazil and Russia; stationarity for China from Pesaran (2007) tests, and stationarity for Brazil, Russia, and India based on the tests from Demestrescu and Hanck (2012). The Im et al. (2005) panel unit root tests with structural breaks demonstrate stationarity for all four country panels. Yucel (2021) evaluates the top 20 tourist destinations in the world to determine through first- and second-generation panel unit root tests whether shocks to tourist arrivals are permanent or transitory. With the exception of the Hadri and Kurozumi (2012) test, the Breuer et al. (2002), Smith et al. (2004), and Pesaran (2007) second-generation panel unit root tests without structural breaks fail to reject the null hypothesis of a unit root. However, the LM panel unit root tests of Im et al. (2005) and Lee and Tieslau (2019) with structural breaks reject the null hypothesis of a unit root. Upon further evaluation of the results from the Fourier panel KPSS test of Nazlioglu and Karul (2017), the null hypothesis of stationarity is not rejected, irrespective of the Fourier frequency. Finally, Payne and Nazlioglu (2022) examine the stationarity of per capita tourism expenditures and receipts for a panel of 63 countries using several panel stationarity tests by Nazlioglu and Karul (2017) and Nazlioglu et al. (2021). Their findings reveal that the introduction of a common factor structure without structural breaks rejects the null hypothesis of stationarity for per capita tourism expenditures and receipts, respectively in less than half of the countries. However, the inclusion of a Fourier function with smooth breaks along with the common factor structure substantially increases the number of rejections of the null hypothesis of stationarity to more than 75% of the countries.
Methodology and data
While controlling for the effects of structural breaks is important, equally relevant is the cross-sectional dependence in per capita tourist arrivals. Indeed, we observe significant comovements among per capita tourist arrivals across countries. The cross-correlations in per capita tourist arrivals will likely reflect common shocks that can drive the comovements in the per capita tourist arrivals across countries. For instance, the diffusion of technological advances across countries, the synchronization of international business cycles, the interdependence of global supply chains, the global financial crisis of 2007–2009, and the more recent COVID-19 pandemic phenomenon are all sources of increased cross-correlations in per capita tourist arrivals (Payne and Lee, 2022; Payne and Nazlioglu, 2022).
A number of unit root tests have been considered to address the issue of cross-sectional dependence. The PANIC (panel analysis of non-stationarity in idiosyncratic and common components) procedure of Bai and Ng (2004) is a popular procedure to control the effects of comovements. The PANIC procedure is a generalized approach to treating comovements as a systemic component of a variable’s cross-sectional behavior. If cross-sectional dependence exists among the panel of per capita tourist arrivals by country, it is directly relevant to non-stationarity.
All tests utilizing the PANIC procedure impose an initial factor structure via the popular principal component analysis (PCA). The general PCA factor structure can be defined by
where denotes the panel data; is a vector of latent factors that captures commonalities across N countries; denotes the associated factor loadings of each individual i and ; and are the error terms. The estimated factor matrix is obtained as the eigenvectors corresponding to the first k largest eigenvalues of the square matrix multiplied by . Then, the factor loadings can be given as .
The focus of our analysis is to employ unit root tests that jointly allow for structural breaks in a factor structure to test the null hypothesis of a unit root in per capita tourist arrivals.3 To this end, we first employ the Lagrange multiplier (LM) unit root tests of Lee and Strazicich (2003b) with two structural breaks along with the Bai and Ng (2004) PANIC procedure. The LM tests are more convenient than the augmented Dickey-Fuller (1979, 1981) unit root tests when we allow for structural breaks. Thus, we can simultaneously allow for two structural breaks and cross-correlations in a factor structure. As noted by Payne et al. (2022a), the motivation of using the LM tests of Lee and Strazicich (2003b) is that they do not exhibit spurious rejections under the null hypothesis and allow for breaks under both the null and alternative hypotheses. Also, the LM tests exhibit good size properties under strong serial correlations based on the augmented version. Thus, we consider the following model:
where contains exogenous variables. The unit root null hypothesis is . The level-shift or “crash” model is given with , where for , j = 1,.., R, and 0.0 otherwise, and represents for the time period of the j-th break. The trend break model is denoted by , where for , and 0.0 otherwise. Using the LM (score) principle, the null restriction is imposed and the first step regression in differences is given as , where ,. The following regression, , where is used to obtain the unit root test statistics. Here, is the coefficient in the regression of on , and is the restricted MLE of with . Meng et al. (2013) consider a transformation procedure that makes the resulting test invariant to the locations of breaks. The response surface function estimates for these LM unit root tests with breaks is provided by Nazlioglu and Lee (2020).4
Our task is to allow for a factor structure in the above testing procedure in which consideration is given for a panel model with an alternative data generating process as follows.
where is an vector which represents the unobserved common factors and denotes factor loadings that represent the responses of each cross-section unit to the common factors. In light of the challenges of estimating the factor terms with other parameters within a linear framework, the iterative procedure for joint estimation is adopted by Payne et al. (2022a) and Payne and Lee (2022).
To control for structural breaks, we also consider an alternative procedure using a Fourier function. The LM tests with breaks employ dummy variables that require estimating the number of breaks, locations, and break types. While the models using dummy variables may work well in the cases of sharp or abrupt breaks when the relevant information is readily available, they do not work well in the cases of smooth or gradual breaks. As such, we adopt the PANIC-Fourier tests of Nazlioglu et al. (2022) and Payne and Lee (2022), who consider the LM version of the PANIC tests while allowing for a Fourier function. For these tests, the following Fourier function is used to model multiple non-linear breaks of unknown forms.
where mi represents the Fourier frequency for each cross-sectional unit, whereby we consider different results using a different number of cumulative frequencies with mi = 1, 2, and 3. The advantages of using the Fourier function are discussed in Enders and Lee (2012a, 2012b). In particular, the task of estimating the number of breaks and their locations is diverted to estimating a parsimonious frequency parameter. Then, we replace the dummy variables included in Zt of equation (2), and use the iterative procedure to estimate the parameters in the model and the test statistics.5
Annual data on international tourist arrivals and the population for 129 countries over the period 1995–2019 was obtained from the World Bank Development Indicators. The variable of interest in our analysis is per capita tourist arrivals, defined as international tourist arrivals divided by the population.6Table 2 displays the summary statistics associated with each country in our global panel. A quick perusal of Table 2 highlights the relative magnitude of tourism to a country’s population as the averages of per capita tourist arrivals are quite high for small island countries. The average per capita tourist arrivals range from 0.0046 in Ethiopia to 83.6523 in San Marino. As a measure of relative dispersion, the coefficient of variation ranges from 0.0609 in Luxembourg to 1.2617 in Bhutan. Moreover, the coefficient of variation for such small island countries as Aruba, Bahamas, Cayman Islands, among others, is relatively lower than other countries.
Summary statistics of per capita tourist arrivals.
Countries
Mean
STD
CV
Min
Max
Albania
0.7139
0.6973
0.9767
0.0378
2.2444
Algeria
0.0445
0.0166
0.3742
0.0181
0.0717
Angola
0.0104
0.0074
0.7115
0.0006
0.0250
Antigua & Barbuda
8.9418
1.3961
0.1561
6.5092
11.1271
Argentina
0.1163
0.0381
0.3274
0.0657
0.1679
Armenia
0.2109
0.1958
0.9287
0.0037
0.6404
Aruba
13.9569
2.3984
0.1718
10.3804
18.3520
Australia
0.2727
0.0454
0.1664
0.2062
0.3732
Austria
2.6288
0.4462
0.1697
2.0892
3.5906
Azerbaijan
0.1674
0.0891
0.5325
0.0121
0.3162
Bahamas
14.6436
1.9524
0.1333
11.5210
18.6143
Bahrain
6.5237
1.4040
0.2152
3.4355
9.6320
Bangladesh
0.0015
0.0005
0.3475
0.0007
0.0032
Barbados
3.9853
0.3671
0.0921
3.3656
4.7307
Belgium
0.6628
0.0615
0.0928
0.5485
0.8132
Belize
2.9282
1.0481
0.3579
1.3029
4.8062
Bermuda
9.2256
1.2715
0.1378
7.3275
12.5952
Bhutan
0.1013
0.1279
1.2617
0.0090
0.4141
Bolivia
0.0626
0.0214
0.3411
0.0368
0.1076
Brazil
0.0265
0.0051
0.1931
0.0123
0.0318
British Virgin Islands
12.7073
1.7650
0.1389
6.4440
14.8197
Bulgaria
1.0729
0.3448
0.3213
0.6024
1.7994
Burkina Faso
0.0132
0.0040
0.3000
0.0070
0.0203
Cabo Verde
0.6105
0.4121
0.6751
0.0725
1.3783
Cambodia
0.1616
0.1262
0.7808
0.0194
0.4010
Canada
1.0809
0.3381
0.3128
0.7174
1.6136
Cayman Islands
35.3578
4.1237
0.1166
28.7154
45.3200
China
0.0844
0.0227
0.2695
0.0385
0.1155
Colombia
0.0448
0.0247
0.5522
0.0161
0.0900
Comoros
0.0368
0.0104
0.2828
0.0168
0.0530
Costa Rica
0.4676
0.1378
0.2948
0.2588
0.6669
Croatia
10.2972
3.1534
0.3062
3.4848
14.7644
Cuba
0.2196
0.0946
0.4308
0.0684
0.4156
Curacao
4.9119
1.6619
0.3383
2.6451
8.2126
Cyprus
2.6050
0.3552
0.1364
2.1583
3.4349
Dominica
4.9402
1.5633
0.3164
2.7783
8.5818
Dominican Republic
0.4623
0.1327
0.2870
0.2310
0.7105
Ecuador
0.0718
0.0284
0.3950
0.0384
0.1484
Egypt
0.1012
0.0359
0.3551
0.0503
0.1780
Ethiopia
0.0046
0.0025
0.5473
0.0018
0.0088
Finland
0.5566
0.1152
0.2070
0.3364
0.7806
Gambia
0.1013
0.0691
0.6826
0.0399
0.2637
Georgia
0.6297
0.6872
1.0912
0.0182
2.0768
Germany
0.3065
0.0982
0.3203
0.1818
0.4761
Grenada
3.7165
0.5781
0.1556
2.6149
4.7466
Guam
8.0691
1.0561
0.1309
5.7696
9.9644
Guatemala
0.0962
0.0294
0.3057
0.0494
0.1542
Guyana
0.1981
0.0853
0.4303
0.0876
0.4024
Haiti
0.0754
0.0256
0.3390
0.0426
0.1198
Hong Kong
4.5649
2.5644
0.5618
1.5526
8.7435
Hungary
4.0805
0.9361
0.2294
2.8135
6.2835
Iceland
2.4311
1.9612
0.8067
0.7889
7.0537
India
0.0053
0.0037
0.6943
0.0022
0.0131
Indonesia
0.0309
0.0117
0.3781
0.0203
0.0595
Iran
0.0392
0.0258
0.6571
0.0074
0.1098
Ireland
1.7721
0.2349
0.1325
1.3351
2.2448
Italy
1.2005
0.1722
0.1434
0.9800
1.5972
Jamaica
1.0236
0.2426
0.2370
0.6915
1.4716
Japan
0.0838
0.0707
0.8439
0.0267
0.2525
Jordan
0.7566
0.2231
0.2949
0.4434
1.1124
Kenya
0.0346
0.0055
0.1583
0.0247
0.0469
Korea, republic
0.1715
0.0833
0.4859
0.0809
0.3385
Kuwait
1.4865
0.3991
0.2685
0.8986
2.0564
Lao PDR
0.3239
0.2206
0.6810
0.0714
0.6948
Latvia
2.1118
1.1993
0.5679
0.6571
4.3588
Lebanon
0.2397
0.0717
0.2990
0.1174
0.4377
Lesotho
0.2553
0.1678
0.6573
0.1101
0.5764
Liechtenstein
1.7930
0.2760
0.1539
1.4081
2.5802
Luxembourg
1.8318
0.1116
0.0609
1.5879
2.0048
Macao SA
38.8312
14.7419
0.3796
16.9645
61.5290
Malaysia
0.6603
0.2233
0.3382
0.2510
0.9187
Maldives
2.0599
0.5844
0.2837
1.2359
3.2074
Mali
0.0095
0.0019
0.1974
0.0044
0.0135
Malta
4.3684
1.1005
0.2519
2.9560
6.9813
Mauritius
0.7231
0.2118
0.2929
0.3893
1.1310
Mexico
0.8532
0.1320
0.1547
0.6544
1.0685
Moldova
0.0241
0.0171
0.7100
0.0048
0.0653
Monaco
8.4684
0.7123
0.0841
7.0903
9.5006
Mongolia
0.1363
0.0601
0.4409
0.0306
0.2263
Morocco
0.2304
0.0834
0.3621
0.1019
0.3594
Myanmar
0.0271
0.0255
0.9414
0.0044
0.0889
Namibia
0.5017
0.1166
0.2324
0.2586
0.6694
Nepal
0.0224
0.0083
0.3708
0.0111
0.0418
Netherlands
0.6970
0.1921
0.2757
0.4237
1.1605
New Calendonia
1.2052
0.5951
0.4938
0.6187
2.3204
New Zealand
0.5687
0.1207
0.2123
0.3836
0.7873
Nicaragua
0.1656
0.0602
0.3633
0.0733
0.3067
Niger
0.0053
0.0015
0.2916
0.0032
0.0082
North Mariana Islands
0.1462
0.0902
0.6169
0.0487
0.3650
Northern Macedonia
9.0650
2.4162
0.2665
6.3133
15.4889
Norway
0.8663
0.1683
0.1942
0.6134
1.1848
Palau
4.8793
1.7803
0.3649
2.7849
9.1707
Panama
0.3948
0.1725
0.4369
0.1522
0.6433
Paraguay
0.9007
0.7618
0.8458
0.4518
3.2821
Philippines
0.0385
0.0149
0.3875
0.0226
0.0764
Poland
1.8888
0.3350
0.1773
1.3271
2.3315
Portugal
1.0345
0.2851
0.2756
0.6093
1.6696
Puerto Rico
1.2605
0.1296
0.1028
1.1035
1.5440
Romania
0.3561
0.1298
0.3645
0.2146
0.6615
Russia
0.1585
0.0362
0.2281
0.0694
0.2341
San Marino
83.6523
27.2702
0.3260
55.4700
129.9132
Seychelles
2.3056
0.8720
0.3782
1.5277
4.3841
Singapore
2.2996
0.5338
0.2321
1.4890
3.3516
Sint Maarten
50.2347
10.0527
0.2001
32.5126
66.3925
Slovenia
0.9985
0.5335
0.5343
0.3679
2.2515
South Africa
0.1901
0.0570
0.3000
0.1130
0.2690
Spain
2.0570
0.3567
0.1734
1.3206
2.6769
Sri Lanka
0.0478
0.0318
0.6645
0.0172
0.1163
St. Kitts & Nevis
11.2583
6.4019
0.5686
4.0497
24.3716
St. Lucia
4.8845
0.9806
0.2007
2.7711
6.6741
St. Vincent & Grenadines
2.3044
0.4594
0.1994
1.8412
3.5445
Sweden
0.6092
0.2960
0.4858
0.2617
1.2997
Tanzania
0.0183
0.0046
0.2532
0.0099
0.0267
Thailand
0.2650
0.1456
0.5495
0.1169
0.5733
Togo
0.0299
0.0241
0.8080
0.0112
0.1084
Tonga
0.5736
0.1693
0.2952
0.3001
0.8995
Trinidad & Tobago
0.3533
0.0468
0.1324
0.2248
0.4100
Tunisia
0.5891
0.1043
0.1770
0.4192
0.8063
Turkey
0.3481
0.1630
0.4681
0.1202
0.6202
Ukraine
0.3636
0.1442
0.3965
0.1189
0.6232
United Kingdom
0.4958
0.0702
0.1417
0.3863
0.6219
United States
0.4205
0.1467
0.3488
0.2140
0.6139
Uruguay
0.7717
0.2175
0.2819
0.4071
1.2277
Uzbekistan
0.0461
0.0468
1.0155
0.0040
0.2010
Vanuatu
0.8235
0.3132
0.3803
0.4382
1.3911
Vietnam
0.0612
0.0457
0.7460
0.0180
0.1867
Virgin Islands
21.8223
2.8711
0.1316
16.1476
26.0841
Zambia
0.0522
0.0137
0.2619
0.0179
0.0717
Zimbabwe
0.1615
0.0238
0.1473
0.1146
0.2045
Note: STD denotes the standard deviation. CV is the ratio of STD over the mean. Min and Max are the minimum and maximum values of per capita tourist arrivals in each country.
Empirical results and discussion
To begin with, we evaluate the results using the Lagrange Multiplier (LM) unit root tests of Schmidt and Phillips (1992), without either structural breaks or cross-correlations. Also, to determine the net effects of cross-correlations and breaks, we consider the LM tests without breaks but with a factor structure, as well as the LM tests with breaks but without a factor structure. Table 3 presents the summary of these test results.
Note: Total counts show the number of rejections at least the 10% significance level. The p-values are obtained from the response surface estimates provided in Nazlioglu and Lee (2020). The maximum number of lags is set to 5, and the number of augmented lags k is determined by the general-to-specific approach based on the statistical significance of the lagged dependent variate at the 10% level of significance. The number of factors is estimated based on the panel information criterion (ICp) of Bai and Ng (2002) using a maximum of 5 factors. The Gauss codes for finding the critical values and computing the p-values are provided at the website: https://sites.google.com/site/junsoolee/codes. Significance levels: 1%(a), 5%(b), and 10%(c) and denoted in boldface type.
With respect to the Schmidt and Phillips (1992) unit root tests without structural breaks or cross-correlations shown in Table 3, we find that at least the 10% significance level only 12 of the 129 countries (Azerbaijan, Belize, British Virgin Islands, Cuba, Curacao, Genada, Iceland, Lebanon, Monaco, San Marino, United Kingdom, and Uzbekistan) reject the null hypothesis of a unit root. Thus, we find little evidence of stationarity in per capita tourist arrivals when there is no allowance for either structural breaks or cross-correlations.
Given the results from the Schmidt and Phillips (1992) unit root test, we next allow for a factor structure following Bai and Ng (2004) in the use of principal component analysis (PCA) to examine the degree of comovements among per capita tourist arrivals. We find that the first principal component (PC) explains about 93.3% of the variation of all per capita tourist arrivals in the global panel, while the second PC accounts for 6.1%. This principal component analysis explains a relatively high degree of comovement.
With the introduction of a factor structure through the new PANIC-LM unit root test, the number of rejections at least the 10% significance level increased to 18 of the 129 countries (Bahrain, Canada, Costa Rica, Italy, Jamaica, Kuwait, Lao PDR, Luxembourg, Maldives, Mexico, Nicaragua, Norway, Romania, Russia, St. Kitts & Nevis, Tonga, Tunisia, and United Kingdom). However, when we employ the Lee and Strazicich (2003b) LM unit root tests with two trend structural breaks without a factor structure, the null hypothesis is rejected at least the 10% significance level for all 129 countries. Though some of the structural breaks may be more country-specific in origin, a vast majority of the structural break dates coincide with the 2002–2004 SARS epidemic originating in Asia along with the onset and subsequent recovery from the global financial crisis.
Next, we formally examine the results from the new LM unit root tests, which incorporate the PANIC common factor structure into the Lee and Strazicich (2003b) unit root tests with two-level and two-trend structural break models, respectively as displayed in Table 4. The null hypothesis of a unit root is rejected at least the 10% significance level for 30 countries based on the level break tests and 13 countries for the trend break tests. Thus, the null hypothesis of a unit root is rejected far less than the Lee and Strazicich (2003b) unit root tests with breaks and without allowance for cross-correlations.
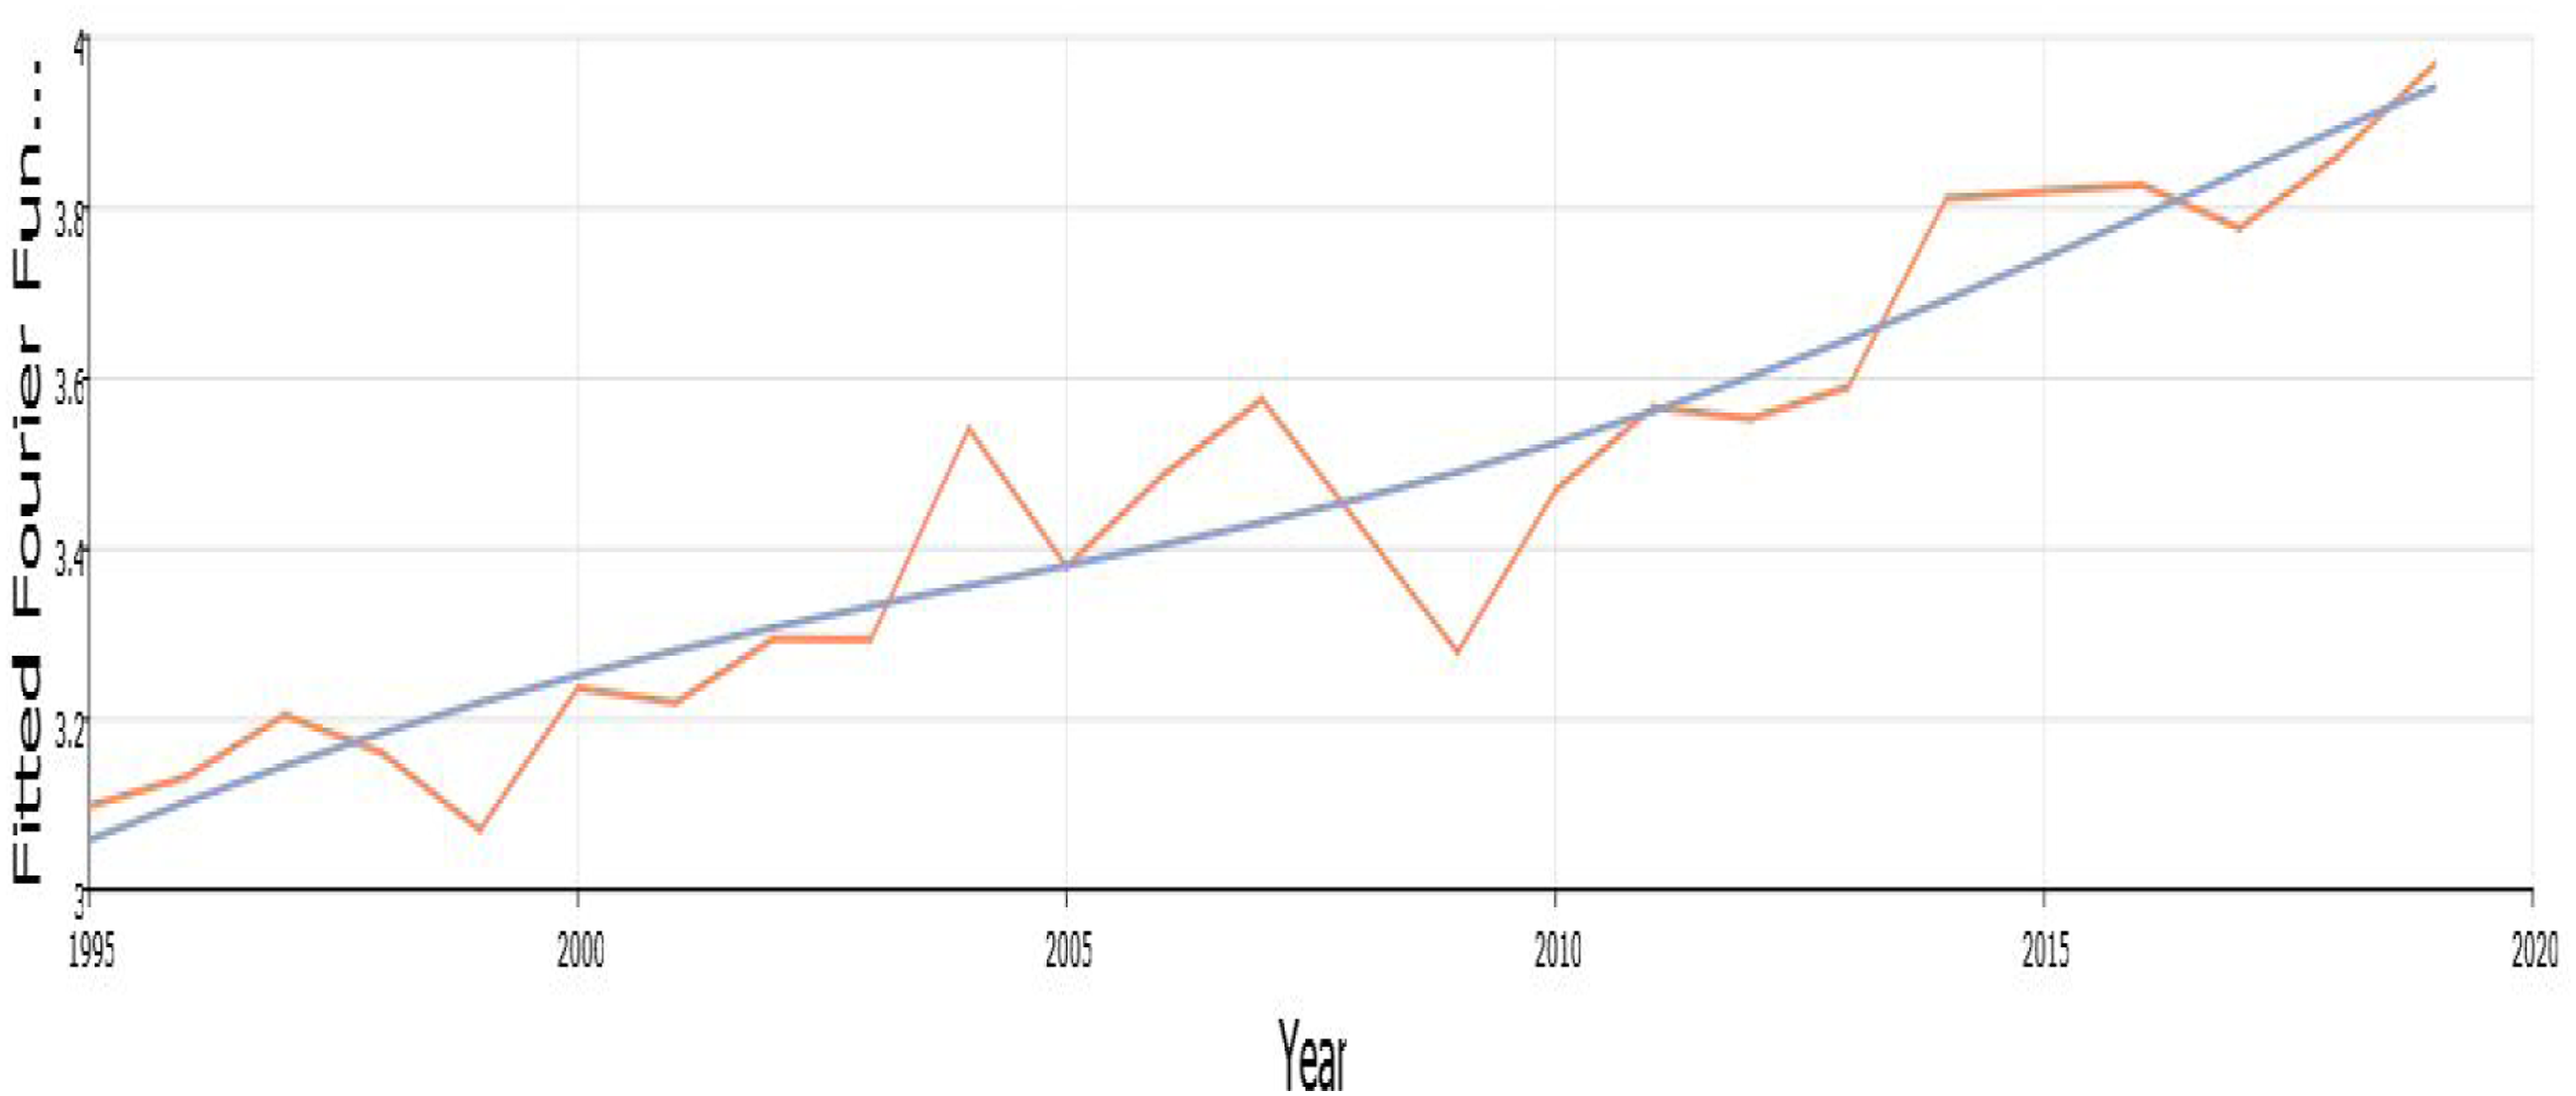
Recognizing the possibility that structural breaks do not follow an abrupt change, but a gradual process, we utilize the Fourier function to investigate the global trend of per capita tourist arrivals. In Figure 1, we present the plot of the estimated global Fourier function. When the Fourier breaks are allowed, which models structural breaks as a gradual process along with a factor structure, the number of rejections is 22 of the 129 countries. We find that the inclusion of structural breaks and cross-correlations through the PANIC common structure within the new LM unit root test results in a much lower number of rejections of the null hypothesis of a unit root in per capita tourist arrivals. Thus, these findings are dramatically different from the Lee and Strazicich (2003b) unit root tests that allows for endogenous structural breaks and the absence of cross-correlations. Indeed, the incorporation of the PANIC common structure in the Lee and Strazicich (2003b) unit root test with endogenous structural breaks illustrates that the number of rejections of the null hypothesis is reduced considerably. In summary, the evidence of stationarity in per capita tourist arrivals is not as robust as standard unit root tests would suggest, as it likely that shocks to per capita tourist arrivals are more permanent in nature, thereby requiring an offsetting policy response to restore per capita tourist arrivals to their original trend.
Plots of the estimated global Fourier function and the time means. Note: The smooth curve is the plot of the estimated global Fourier function of the per capita tourist arrivals. The red line depicts the time means of data in a given year.
Our results run counter in many respects to the previous studies using second-generation panel tests that incorporate cross-sectional dependence and/or structural breaks. The majority of the studies using second-generation panel unit root/stationarity tests by Lee et al. (2014), Yang et al. (2014), Solarin (2015), Dash et al. (2017), Xie et al. (2018), Kyophilavong et al. (2019), and Yucel (2021) provide support for the stationarity of tourist arrivals. Payne and Nazlioglu (2022) propose an alternative panel stationarity test that includes both structural breaks and common factors in the examination of per capita tourism expenditures and receipts to generally find non-stationarity of both tourism measures. Rather than use a panel stationarity test framework, as in Payne and Nazlioglu (2022), our analysis jointly estimates a Lagrange multiplier panel unit root test with allowance for structural changes that represent either abrupt breaks or as a Fourier approximation of smooth breaks along with introducing a factor structure to capture cross-sectional dependence. Second, unlike previous studies that test for structural breaks and cross-sectional dependence and find support for stationarity, our study reveals very limited support for stationarity in tourist arrivals. Third, our results reiterate the importance of simultaneously modeling both structural breaks and cross-correlations in per capita tourist arrivals across countries to ensure consistent estimation and validity of inferences drawn.
Concluding remarks
It has been well established, as evident from the COVID-19 pandemic, that the tourism and hospitality industry is susceptible to exogenous shocks and the subsequent negative impact of such shocks. The contribution of this study rests with the realization that shocks to tourist arrivals have repercussions with respect to the balance of payments for destination countries through foreign exchange earnings and tourism revenues. In response, our study extends the existing literature on testing the permanent or transitory nature of shocks to per capita tourist arrivals on several fronts. Unlike the majority of previous studies, our study scales tourist arrivals by the population of the tourist destination country to gauge the relative magnitude of the tourist flows. Second, our analysis serves as the largest multi-country study to date in the examination of a global panel of 129 countries. Finally, our study introduces new panel unit root tests that simultaneously model structural breaks (both sharp and smooth breaks) and a common factor structure. In this regard, the two break tests of Lee and Strazicich (2003b) and the Fourier approximation to capture smooth breaks of Enders and Lee (2012a, 2012b) are employed in tandem with the PANIC procedure of Bai and Ng (2004) in a factor structure to account for cross-correlations.
Our findings indicate that rejection of the null hypothesis of unit root is quite limited once cross-correlations are accounted for in a simultaneous fashion with structural breaks when compared to other unit root tests that fail to account for cross-correlations. This result is contrary to the majority of the previous studies that suggest tourist arrivals follow a stationary process. With the recent COVID-19 pandemic serving as a case in point, understanding the transmission of shocks in the tourism and hospitality sector is important in terms of modeling and forecasting of tourist flows and the possible need for policy intervention in the event shocks occur. Such policy discussions should also include the assessment of risk mitigation strategies, and for those countries heavily dependent on the tourism sector to explore avenues to diversify their economic base and export orientation in order to minimize the influence of adverse shocks impacting the tourism and hospitality sector and the overall economy.
Future research can extend the methodological approach of simultaneously modeling a common factor structure with structural breaks to test for unit root processes in other tourism indicators and over an expanded time horizon that incorporates the various phases of the COVID-19 pandemic.
Footnotes
Declaration of conflicting interests
The author(s) declared no potential conflicts of interest with respect to the research, authorship, and/or publication of this article.
Funding
The author(s) received no financial support for the research, authorship, and/or publication of this article.
ORCID iD
James E Payne
Notes
Author biographies
James E. Payne, PhD in Economics from Florida State University, serves as the Dean of the College of Business Administration at The University of Texas at El Paso and holds the Paul L. Foster and Alejandra de la Vega Foster Distinguished Chair in International Business. Dr. Payne has authored over 270 peer-reviewed journal articles and serves on the editorial board member for a number of academic journals.
Junsoo Lee, PhD in Economics from Michigan State University, serves as the William White McDonald Family Distinguished Faculty Fellow at The University of Alabama. Dr. Lee’s research interests include time series econometrics, non-linear models, and applied econometrics. His published articles include the Review of Economics and Statistics, International Economic Review, Econometric Theory, Journal of Applied Econometrics, Economics Letters, Journal of Money, Credit and Banking, Oxford Bulletin of Economics and Statistics, Journal of Time Series Analysis, Journal of Environmental Economics and Management, Journal of Health Economics, and Studies in Nonlinear Dynamics and Econometrics. Dr. Lee also serves as an Associate Editor for the Journal of Empirical Finance, Economic Modelling, and the Journal of Economics and Finance.
References
1.
Al-ShboulMAnwarS (2017) Long memory behavior in Singapore’s tourism market. International Journal of Tourism Research19(5): 524–534.
2.
AndrazJMCuerreiroRFCRodriguezPMM (2018) Persistence of travel and leisure sector equity indices. Empirical Economics54(4): 1801–1825.
3.
ApergisNMervarAPayneJE (2017) Forecasting disaggregated tourist arrivals in Croatia: Evidence from seasonal univariate time series models. Tourism Economics23(1): 78–98.
4.
AssafAGBarrosCPGil-AlanaLA (2011) Persistence in the short- and long-term tourist arrivals to Australia. Journal of Travel Research50(2): 213–229.
5.
AssafAGGil-AlanaLABarrosCP (2012) Persistence characteristics of tourism arrivals to Australia. International Journal of Tourism Research14(2): 165–176.
6.
AuAKMRamasamyBYeungMCH (2005) The effects of SARS on the Hong Kong tourism industry: An empirical evaluation. Asia Pacific Journal of Tourism Research10(1): 85–95.
7.
Bahmani-OskooeeMChangTWuT (2014) Revisiting purchasing power parity in African countries: Panel stationary tests with sharp and smooth breaks. Applied Financial Economics24(22): 1429–1438.
8.
BaiJNgS (2002) Determining the number of factors in approximate factor models. Econometrica70(1): 191–221.
9.
BaiJNgS (2004) A PANIC attack on unit roots and cointegration. Econometrica72(4): 1127–1177.
10.
BaiJ (2009) Panel data models with interactive fixed effects. Econometrica77(4): 1229–1279.
11.
BaiJ (2010) Common breaks in means and variances for panel data. Journal of Econometrics157(1): 78–92.
12.
BaigSHussainH (2020) Do shocks have permanent or transitory effects on tourist inflow? An application of stationarity tests with structural breaks: Evidence re-examined for Gilgit-Baltistan, Pakistan. Asia Pacific Journal of Tourism Research25(2): 120–130.
13.
BaltagiBHPirotteA (2010) Panel data inference under spatial dependence. Economic Modelling27(6): 1368–1381.
14.
BaltagiBHFengQKaoC (2016) Estimation of heterogeneous panels with structural breaks. Journal of Econometrics191(1): 176–195.
15.
BaltagiBHKaoCLiuL (2017) Estimation and identification of change points in panel models with nonstationary or stationary regressors and error term. Econometric Reviews36(1–3): 85–102.
16.
BassilCSalehSAAnwarS (2014) Is tourism in Lebanon subject to permanent or transitory exogenous shocks?Tourism Analysis19(6): 781–790.
17.
BhattacharyaMNarayanPK (2005) Testing for the random walk hypothesis in the case of visitor arrivals: Evidence from Indian tourism. Applied Economics37(13): 1485–1490.
18.
BreitungJ (2000) The local power of some unit root tests for panel data. In: BaltagiB (ed) Advances in Econometrics, Vol. 15 Non-stationary Panels, Panel Cointegration, and Dynamic Panels. Amsterdam, Netherlands: JAI Pres, pp. 161–178.
19.
BreuerJBMcNownRWallaceMS (2001) Misleading inferences from panel unit root tests with an illustration from purchasing power parity. Review of International Economics9(3): 482–493.
20.
BreuerJBMcNownRWallaceMS (2002) Series specific unit root tests with panel data. Oxford Bulletin of Economics and Statistics64(5): 527–546.
21.
CaporaleGMGil-AlanaLA (2019) UK overseas visitors: Seasonality and persistence. Tourism Economics25(5): 827–831.
22.
Carrion-i-SilvestreJLBarrio-CastroTDLopez-BazoE (2005) Breaking the panels: An application to the GDP per capita. Econometrics Journal8(2): 159–175.
23.
Carrion-i_SilvestreJLKimDPerronP (2009) GLS-based unit root tests with multiple structural breaks both under the null and the alternative hypotheses. Econometric Theory25(6): 1754–1792.
24.
ChangY (2002) Nonlinear IV unit root tests in panels with cross-sectional dependency. Journal of Econometrics110(2): 261–292.
25.
CharlesADarneOHoarauJ-F (2019) How resilient is La Reunion in terms of international tourism attractiveness: An assessment from unit root tests with structural breaks from 1981-2015. Applied Economics51(24): 2639–2653.
26.
ChenJHMalindaM (2014) Long memory and multiple structural breaks in returns of travel and tourism indexes. Journal of Business and Economics5(9): 1460–1472.
27.
ChoiI (2002) Combination Unit Root Tests for Cross-Sectionally Correlated Panels Mimeo. Clear Water Bay, Hong Kong: Hong Kong University of of Science and Technology.
28.
ChoiI (2006) Non-stationary panels. In: MillsTCPattersonK (eds) Econometric Theory, Volume I of Palgrave Handbook of Econometrics. Basingstoke, UK: Palgrave MacMillan, pp. 511–539. Chapter 13.
29.
ChortareasGKapetaniosG (2009) Getting PPP right: Identifying mean-reverting real exchange rates in panels. Journal of Banking and Finance33(2): 390–404.
30.
ChuF-L (2008) A fractionally integrated autoregressive moving average approach to forecasting tourism demand. Tourism Management29(1): 79–88.
ChuH-PChangTChangH-L, et al. (2008) Are visitor arrivals to Taiwan stationary? An empirical study based on panel SURADF tests. Empirical Economics Letters7(10): 1001–1007.
33.
ChuH-PYehM-LChangT-Y (2014) Are visitor arrivals to China stationary? An empirical note. Asia Pacific Journal of Tourism Research19(2): 248–256.
34.
CunadoJGil-AlanaLAPerez de GraciaF (2004) Modelling monthly Spanish tourism: A seasonal fractonally integrated approach. Tourism Economics10(1): 79–94.
35.
CunadoJGil-AlanaLAPerez de GraciaF (2005) The nature of seasonality in Spanish tourism time series. Tourism Economics11(4): 483–499.
36.
CunadoJGil-AlanaLAPerez de GraciaF (2008a) Persistence in international monthly arrivals in the Canary Islands. Tourism Economics14(1): 123–129.
37.
CunadoJGil-AlanaLAPerez de GraciaF (2008b) Fractional integration and structural breaks: Evidence from international monthly arrivals in the USA. Tourism Economics14(1): 13–23.
38.
DashAKSureshKGTiwariAK (2017) Are tourist arrivals stationary? Evidence from BRIC countries. Current Issues in Tourism20(3): 221–224.
39.
DedeogluM (2016) Are shocks to Turkey’s tourist arrivals permanent?Ekonometri ve Istatistik sayi24: 30–39.
40.
DejongRAmslerCSchmidtP (2007) A robust version of the KPSS test based on indicators. Journal of Econometrics137(2): 311–333.
41.
DemetrescuMHanckC (2012) Unit root testing in heteroscedastic panels using the cauchy estimator. Journal of Business and Economic Statistics30(2): 256–264.
42.
DickeyDAFullerWA (1979) Distributions of the estimators for autoregressive time series with a unit root. Journal of the American Statistical Association74(366a): 427–431.
43.
DickeyDAFullerWA (1981) Likelihood ratio statistics for autoregressive time series with a unit root. Econometrica49(4): 1057–1072.
44.
ElliottGRothenbergTJStockJH (1996) Efficient tests for an autoregressive unit root. Econometrica64(4): 813–836.
45.
EndersWLeeJ (2012a) A unit root test using a fourier series to approximate smooth breaks. Oxford Bulletin of Economics and Statistics74: 574–599.
46.
EndersWLeeJ (2012b) The flexible fourier form and Dickey-Fuller type unit root tests. Economics Letters117: 196–199.
47.
Gil-AlanaLA (2005) Modelling international monthly arrivals using seasonal univariate long-memory processes. Tourism Management26(6): 867–878.
48.
Gil-AlanaLA (2009) Americans Traveling to Europe: A new perspective based on persistence. Tourism and Hospitality Research9(1): 3–8.
49.
Gil-AlanaLA (2010) International arrivals in the Canary Islands: Persistence, long memory, seasonality, and other implicit dynamics. Tourism Economics16(2): 287–302.
50.
Gil-AlanaLA (2011) Tourism in South Africa-time series persistence and the nature of the shocks: are they transitory or permanent?African Journal of Business Management5(12): 4686–4698.
51.
Gil-AlanaLAPerez de GraciaFCunadoJ (2004) Seasonal fractional integration in the Spanish tourism quarterly time series. Journal of Travel Research42(4): 408–414.
52.
Gil-AlanaLACunadoJPerez de GraciaF (2008) Tourism in the Canary Islands: Forecasting using several seasonal time series models. Journal of Forecasting27(7): 621–636.
53.
Gil-AlanaLAFischerC (2010) International traveling and trade: Further evidence for the case of Spanish wine based on fractional vector autoregressive specifications. Applied Economics42(19): 2417–2434.
54.
Gil-AlanaLAMudidaRPerez GraciaF (2014) Persistence, long memory and seasonality in Kenyan tourism series. Annals of Tourism Research46: 89–101.
55.
Gil-AlanaLAMervarAPayneJE (2015) Measuring persistence in Croatian tourism: Evidence from the Adriatic region. Applied Economics47(46): 4901–4917.
56.
Gil-AlanaLAMervarAPayneJE (2016) Modeling the degree of persistence in Croatian tourism. Tourism Economics22(3): 655–664.
57.
Gil-AlanaLAHuijbensEH (2018) Tourism in Iceland: Persistence and seasonality. Annals of Tourism Research68: 20–29.
58.
Gil-AlanaLARuiz-AlbaJLAyestaranR (2020) U.K. Tourism arrivals and departures: Seasonality, persistence, and time trends. Applied Economics52(46): 5077–5087.
59.
Gil-AlanaLAGil-LopezARomanES (2021) Tourism persistence in Spain: National versus international visitors. Tourism Economics27(4): 614–625.
60.
Gil-AlanaLAPayneJE (2022) Persistence, seasonality, and fractional integration within a nonlinear framework: evidence from U.S. citizens overseas travel. Tourism Economics28(3): 654–660.
61.
Gil-AlanaLAPozaC (2022) The impact of COVID-19 on the Spanish tourism sector. Tourism Economics28(3): 646–653.
62.
GrangerCWJ (1980) Long memory relationships and the aggregation of dynamic models. Journal of Econometrics14(2): 227–238.
63.
HadriK (2000) Testing for stationarity in heterogeneous panel data. Econometrics Journal3(2): 148–161.
64.
HadriKKurozumiE (2012) A simple panel stationarity tests in the presence of serial correlation and a common factor. Economics Letters115(1): 31–34.
65.
HyllebergSEngleRGrangerC, et al. (1990) Seasonal integration and cointegration. Journal of Econometrics44(1–2): 215–238.
66.
ImKSPesaranMHShinY (2003) Testing for unit roots in heterogeneous panels. Journal of Econometrics115(1): 53–74.
67.
ImKSLeeJTieslauM (2005) Panel LM unit root tests with level shifts. Oxford Bulletin of Economics and Statistics67(3): 393–419.
68.
KapetaniosGShinYSnellA (2003) Testing for a unit root in the non-linear STAR framework. Journal of Econometrics112(2): 359–379.
69.
KejriwalMPerronP (2010) A sequential procedure to determine the number of breaks in trend with an integrated or stationary noise component. Journal of Time Series Analysis31(5): 305–328.
70.
KruseR (2011) A new unit root test against ESTAR based on a class of modified statistics. Statistical Papers52(1): 71–85.
71.
KwiatkowskiDPhillipsPCBSchmidtP, et al. (1992) Testing the null hypothesis of stationary against the alternative of a unit root. Journal of Econometrics54(1–3): 159–178.
72.
KyophilavongPTiwariAKJozwikB, et al. (2019) Are tourist arrivals stationary? Evidence from Laos. Anatolia: An International Journal of Tourism and Hospitality Research30(4): 622–625.
73.
LanneMLutkepohlHSaikkonenP (2002) Comparison of unit root tests for time series with level shifts. Journal of Time Series Analysis23(6): 667–685.
74.
LeanHHSmythR (2009) Asian financial crisis, avian flu and tourist threats: Are shocks to Malaysian tourist arrivals permanent or transitory?Asia Pacific Journal of Tourism Research14(3): 301–321.
75.
LeeCG (2009) Are tourist arrivals stationary? Evidence from Singapore. International Journal of Tourism Research11(4): 409–414.
76.
LeeCG (2011) Whether a shock has a temporary or permanent effect on visitor arrivals in Singapore. Tourism Review International14(1): 43–46.
77.
LeeCHYingYHYangGJA (2014) Assessing whether tourist arrivals are stationary: Evidence from Taiwan using sequential panel selection method. Journal of China Tourism Research10(2): 206–221.
78.
LeeJStrazicichMC (2003a) Minimum LM Unit Root Test with One Structural Break. Mimeo.
79.
LeeJStrazicichMC (2003b) Minimum Lagrange multiplier unit root test with two structural breaks. Review of Economics and Statistics85(4): 1082–1089.
80.
LeeJTieslauM (2019) Panel LM unit root tests with level and trend shifts. Economic Modelling80: 1–10.
81.
LevinALinCFChuC-S (2002) Unit root in panel data: Asymptotic and finite sample properties. Journal of Econometrics108(1): 1–24.
82.
LordeTFrancisBSkeeteS (2009) Are shocks to Barbados long-stay visitor arrivals permanent or temporary: A short empirical note. Journal of Public Sector Policy Analysis3: 3–19.
83.
LumsdaineRPapellD (1997) Multiple trend breaks and the unit root hypothesis. Review of Economics and Statistics79(2): 212–218.
84.
MaddalaGSWuS (1999) A comparative study of unit root tests with panel data and a new simple test. Oxford Bulletin of Economics and Statistics61(S1): 631–652.
85.
MengMPayneJELeeJ (2013) Convergence in per capita energy use among OECD countries. Energy Economics36: 536–545.
86.
MoonRPerronP (2004) Testing for a unit root in panels with dynamic factors. Journal of Econometrics122(1): 81–126.
87.
NarayanPK (2005a) The structure of tourist expenditure in Fiji: Evidence from unit root structural break tests. Applied Economics37(10): 1157–1161.
88.
NarayanPK (2005b) Did Rabuka’s military coups have a permanent effect or a transitory effect on tourist expenditure in Fiji: Evidence from Vogelsang’s structural break test. Tourism Management26(4): 509–515.
89.
NarayanPK (2005c) Testing the unit root hypothesis when the alternative is a trend break stationary process: An application to tourist arrivals in Fiji. Tourism Economics11(3): 351–364.
90.
NarayanPK (2008) Examining the behavior of visitor arrivals to Australia from 28 different countries. Transportation Research Part A: Policy and Practice42(5): 751–761.
91.
NarayanPKPrasadA (2008) Examining the Behaviour of visitor arrivals to Australia from twenty different countries: An application of panel unit root tests. Economic Papers27(3): 265–271.
92.
NarayanPKPoppS (2010) A new unit root test with two structural breaks in level and slope at unknown time. Journal of Applied Statistics37(9): 1425–1438.
93.
NazliogluSKarulC (2017) A panel stationarity test with gradual structural shifts: Re-investigate the international commodity price shocks. Economics Modeling61: 181–192.
94.
NazliogluSLeeJ (2020) Response surface estimates of the LM unit root tests. Economics Letters192: 109136.
95.
NazliogluSPayneJELeeJ, et al. (2021) Convergence of OPEC carbon dioxide emissions: Evidence from new panel stationarity tests with factors and breaks. Economic Modelling100: 105498.
96.
NazliogluSLeeJTieslauM, et al. (2022) Smooth structural changes and common factors in nonstationary panel data: An analysis of healthcare expenditures. Econometrics Review, forthcoming.
97.
NgSPerronP (2001) Lag length selection and the construction of unit root tests with good size and power. Econometrica69(6): 1519–1554.
98.
NowmanKBVan DellenS (2012) Forecasting overseas visitors to the U.K. using continuous time and autoregressive fractional integrated moving average models with discrete data. Tourism Economics18(4): 835–844.
99.
PayneJEGil-AlanaLA (2018) Data measurement and the change in persistence of tourist arrivals to the United States in the aftermath of the September 11th terrorist attacks. Tourism Economics24(1): 41–50.
100.
PayneJEGil-AlanaLAMervarA (2022a) Persistence in Croatian tourism: The impact of COVID-19. Tourism Economics28(6): 1676–1682.
101.
PayneJEGil-AlanaLAMervarA, et al. (2022b) Tourist arrivals and overnight stays along the Croatian Adriatic coast: changes in persistence and seasonality from the COVID-19 disruption. Tourism Economics, forthcoming.
102.
PayneJELeeJIslamT, et al. (2022) Stochastic convergence of per capita greenhouse gas emissions: New unit root tests with breaks and a factor structure. Energy Economics113: 106201.
103.
PayneJELeeJ (2022) Stochastic and Club Convergence in Per Capita International Tourist Arrivals: Evidence from a Global Panel with Breaks and Comovements, Working Paper. Tuscaloosa, AL: University of Alabama.
104.
PayneJENazliogluS (2022) The permanent or transitory nature of shocks to tourism expenditures and receipts: evidence from new panel stationarity tests with breaks and factors. Tourism Economics, forthcoming.
105.
Perez-RodriguezJVSantana-GallegoM (2020) Modelling tourism receipts and associated risk, using long-range dependence models. Tourism Economics26(1): 70–96.
106.
PerronPYabuT (2009) Testing for shifts in trend with an integrated or stationary noise component. Journal of Business and Economic Statistics27(3): 369–396.
107.
PesaranMH (2006) Estimation and inference in large heterogeneous panels with a multifactor error structure. Econometrica74(4): 967–1012.
108.
PesaranMH (2007) A simple panel unit root tests in the presence of cross section dependence. Journal of Applied Econometrics22(2): 265–312.
109.
PhillipsPCBPerronP (1988) Testing for a unit root in time series regression. Biometrica75(2): 335–346.
110.
SaikkonenOLutkepohlH (2002) Testing for a unit root in a time series with a level shift at unknown time. Econometric Theory18(2): 313–348.
111.
SalehASVermaRIhalanayakeR (2011) Do external shocks have a permanent or a transitory effect on Thailand’s tourism industry?Tourism Analysis16(4): 483–491.
112.
SchmidtPPhillipsPCB (1992) LM tests for a unit root in the presence of deterministic trends. Oxford Bulletin of Economics and Statistics54(3): 257–287.
113.
SenA (2003) On unit root tests when the alternative is a trend-break stationary process. Journal of Business and Economics Statistics21(1): 174–184.
114.
SmithLVLeybourneSKimT-H, et al. (2004) More powerful panel data unit root tests with an application to mean reversion in real exchange rates. Journal of Applied Econometrics19(2): 147–170.
115.
SolarinSA (2015) September 11 attacks, H1N1 influenza, global financial crisis, and tourist arrivals in Sarawak. Anatolia: An International Journal of Tourism and Hospitality Research26(2): 298–300.
116.
SolarinSA (2016) Global financial crisis and stationarity of tourist arrivals: Evidence from Mauritius. Current Issues in Tourism19(9): 869–875.
117.
SmythRNielsenIMishraV (2009) I’ve been to Bali too’(and I will be going back): Are terrorist shocks to Bali’s tourist arrivals permanent or transitory?Applied Economics41(11): 1367–1378.
118.
TanS-HTanS-K (2014) Are shocks to Singapore’s tourist arrivals permanent or transitory? An application of stationarity test with structural breaks. Current Issues in Tourism17(6): 480–486.
119.
TangTCWongKN (2009) The SARS epidemic and international visitor arrivals to Cambodia: Is the impact permanent or transitory?Tourism Economics15(4): 883–890.
120.
TaylorMPSarnoL (1998) The behavior of real exchange rates during the post-Bretton woods period. Journal of International Economics46(2): 281–312.
121.
TiwariAKDashAKNarayananDG (2018) Foreign tourist arrivals in India from major source countries: An empirical analysis. Current Issues in Tourism21(10): 1137–1156.
122.
UcarNOmayT (2009) Testing for unit root in non-linear heterogeneous panels. Economics Letters104(1): 5–8.
123.
United Nations World Tourism Organization (UNWTO) (2020) UNWTO world tourism Barometer and statistical annex. UNWTO World Tourism Barometer18(6): 1–23.
124.
ValadkhaniAO’MahonyB (2018) Identifying structural changes and regime switching in growing and declining inbound tourism markets in Australia. Current Issues in Tourism21(3): 277–300.
125.
VanzettiDPetersR (2021) COVID-19 and Tourism : An Update Assessing the Economic Consequences. New York, NY: United Nations Conference on Trade and Development.
126.
VogelsangTJ (1997) Wald-type tests for detecting breaks in the trend function of a dynamic time series. Econometric Theory13(6): 818–849.
127.
VogelsangTJPerronP (1998) Additional tests for a unit root allowing for a break in the trend function at an unknown time. International Economic Review39(4): 1073–1100.
128.
WuJLLeeHY (2009) A revisit to the non-linear mean reversion of real exchange rates: Evidence from a series-specific non-linear panel unit root test. Journal of Macroeconomics31(4): 591–601.
XieHTiwariAKChangT (2018) Investigating stationarity in tourist arrivals to India using panel KPSS with sharp drifts and smooth breaks. Applied Economics50(46): 4985–4998.
131.
YangGJ-AYingY-HChangK, et al. (2014) Investigating stationarity in tourist arrivals to Taiwan using panel KPSS with sharp drifts and smooth breaks. Tourism Analysis19(5): 573–580.
132.
YucelAG (2021) Are shocks to tourist arrivals permanent or transitory? A comprehensive analysis on the top 20 most-visited countries. Current Issues in Tourism24(16): 2294–2311.
133.
ZivotEAndrewsD (1992) Further evidence of the great crash, the oil-price shock, and the unit root hypothesis. Journal of Business and Economic Statistics10(3): 251–270.