
Abstract
Using a bilateral dataset of trips for 32 European countries for the period 2012–2019, we aim to gauge the size and evolution of the border effect on tourism: the extent to which domestic tourism is greater (or lesser) than international tourism. We found that the tourism flow within countries was 24 times greater than between countries. Also, we show that, relative to 2012, the border effect diminished by 13% in 2019. Our results suggest that the size (and evolution) of the border effect is the same for trips that last between one and three nights (short trips) and those that last four nights or more (long trips). Nonetheless, our findings show that bilateral determinants that represent travel and transaction costs are more important when explaining short trips than long ones.
Introduction
International tourism is a consolidated, rapidly expanding industry; since the 1950s tourism activities have increased by an average of 6% per year (Eriksen, 2016). It generates more than half a trillion dollars in annual revenues and represents 10% of total international trade and almost half of total trade in services (Eilat and Einav, 2004). Considering the global aggregate, tourism contributes, directly or indirectly, to one in 10 jobs, and is responsible for 10.3% of the global GDP (WTTC, 2020).
International mobility and borders are two inseparable concepts of analysis (Richardson, 2013), since, as pointed out by Rumford (2006: 155) “to theorize mobilities and networks is at the same time to theorize borders”. Tourists are a particular type of mobile subject that crosses a world full of borders, their movements affect and are affected by the construction and performance of these borders (Rowen, 2016). Certainly, there is a vast academic literature that relates mobility to the performance of state borders (Parsley 2003; Dauvergne 2004; Salter 2006, 2008; Wonders 2006). Whereas the study of tourism flows in relation to the effect of borders has received very little attention (Rowen, 2016). Some studies have been published on the role of borders in encouraging or restricting tourism (Timothy, 2005; Timothy and Tosun, 2003; Sofield, 2006; Tubadji and Nijkamp, 2018), but the literature that quantifies the extent to which national borders condition tourism flows is very limited. This present paper seeks to fill this gap in the literature: to quantify the size and evolution of the border effect on international tourism.
From a theoretical point of view, the analysis of the impact of borders on international economic relations is simultaneous with the development of the economy as a discipline. However, empirical estimates of the border effect are relatively recent. The basic idea that gives meaning to the analysis of the border effect derives from the fact that borders represent a legal, physical, cultural and psychological barrier that hinders the exchange of goods, services, capital and people between countries, so that these exchanges will always be - everything else being equal - more fluid between regions in the same country than between territories in different countries. As in other areas of international economy, the border effect began to be estimated for the trade in merchandise (McCallum, 1995), and was subsequently extended to other areas of international economic relations, such as trade in services (Anderson et al., 2018), foreign investment (Mayer et al., 2010), tourism (Paniagua et al., 2022) and forced migrations (Carril-Caccia et al., 2021).
This paper proposes a country-level study focused on a sample of European countries. The selection of this area is justified considering that, in terms of tourism, it forms a space for the free movement of people that is unique in the world. Therefore, legal and administrative restrictions are completely removed from the equation. Europe is a recognized tourism power, accounting for half of international tourism flows (UNWTO, 2019). For a large number of member states of the European Union (EU), tourism has been a major driver of economic growth and job creation (Salinas et al., 2020). Tourism contributes not only to the economic growth of countries and regions, but also to their social and cultural development and their general well-being (Martín et al., 2020). In particular, in the EU, borders have become, with regard to mobility and trade, symbolic representations of integration and cooperation (Więckowski, 2010). In addition, the implementation of the monetary union has broken down the intangible border associated with the different currencies in circulation, something that also drives tourist movements (Khalid et al., 2021).
To the best of our knowledge, Anderson et al. (2018) and Paniagua et al. (2022) are the only other works that have attempted to quantify the border effect on tourism. The present analysis contributes to the literature in four different ways. First, we focus on a sample of countries for which, during our period of analysis, there were no formal barriers to touristic flows. Second, we do not approximate domestic tourism; we use statistics that directly measure domestic and international tourism 1 . Third, the present work also contributes to the literature by quantifying the evolution of the border effect. Fourth, our analysis sheds new light on the different drivers of tourism depending on the length of the stay.
In the present work, for a sample of European countries, we estimate a structural gravity model with domestic and international tourism flows. Our analysis shows that domestic tourism is 24 times greater than international. In addition, our estimates indicate that the border effect is lower for long trips (trips that last four nights or more) than for short trips (trips that last between one and three nights), although the difference in size is not statistically significant. Furthermore, we demonstrate that between 2012 and 2019 for both, long and short trips, the border effect diminished by nearly 13%. In addition, our findings suggest that travel costs and transaction costs have a significantly greater impact on short trips than on long ones. Our results remain qualitatively and quantitatively unchanged when the sample is restricted to EU countries.
The following section provides an overview of the literature related to the drivers of tourism flows and the border effect. The Methodology and data section presents the data and empirical strategy, and the Results section reports the results. The article ends with a discussion of the results and some concluding remarks.
The border effect on touristic flows
Historically, international touristic flows have increased as transport technology has evolved, but at the same time they have been hampered by the territorial rights exercised by sovereign countries through frontiers (Sofield, 2006). The generally accepted definition of international tourism includes the process of crossing the border from one country to another, staying at least one night (UNWTO, 1991), as well as the recreational and temporary nature of the trip (Hall, 2005).
The study of international flows and the border effect has experienced significant change in the last decades, as a result of international trade and flows of people and knowledge growing smoother and altering the traditional role of borders (Hageman et al., 2004). There are many academic papers on the implications for mobility of a reshaped world map resulting from decades of decolonization, territorial changes following the Cold War and the collapse of the Soviet Union, and regional integration processes. However, only a few studies specifically examine the role of borders on tourism. Some exceptions are the research conducted by Timothy (1999, 2001, 2005), Więckowski and Timothy (2021), Timothy and Tosun (2003), several of which have a qualitative nature.
The behaviour of tourists during their trips cannot be separated from the geographical, cultural and political conditioning factors on a national scale (Rowen, 2016). Borders are understood to be institutions that mark a functional barrier between countries, impose control over flows of people and trade, identify the entry point and facilitate contact and exchange (Hageman et al., 2004). International borders have geopolitical, historical and symbolic values and meanings (Więckowski and Timothy, 2021) which have an influence on tourists when choosing a destination. In a globalised world, the choice of a tourist destination is determined by a great variety of socioeconomic and environmental factors. This makes demand difficult to predict and it complicates tourism management (Albrecht, 2013; Liu et al., 2015; Song et al., 2017; Van der Zee and Vanneste, 2015; Von Bergner and Lohmann, 2014). The previously mentioned border effect can be produced in tourism by two types of factors: the administrative and physical elements that limit tourist movement and the psychological and perception elements that generate the image of crossing to another reality or into the unknown (Timothy and Tosun, 2003). This means that regions located in neighbouring countries have a lower level of interaction than expected (Smith, 1984; Timothy and Tosun, 2003).
Timothy and Tosun (2003) analysed touristic flows at the border between the US and Canada. They concluded that borders can create real barriers that can be perceived by the traveller (even between countries with strong bonds of friendship and cooperation) due to the existence of economic and cultural differences, when there are security problems or when crossing procedures are tedious for the visitor. Sofield (2006) focused on border tourism and on the factors that can revitalize the roles of borders (such as international security problems and pandemics). More recently, Mayer et al. (2019) focused on this topic, whereas the attraction of travelling is, for some tourists, the fact of crossing a border and being immersed in a foreign culture, for others, it could be a bother and cause anxiety. Therefore, as in the case of the previous literature on trade in merchandise and services, FDI and forced migration (e.g. Anderson et al., 2018; Carril-Caccia et al., 2021; Umber et al., 2014), we expect touristic flows to have a positive border effect. That is to say, after controlling for multiple drivers of international tourism, we expect domestic touristic flows to be greater than international ones. In addition, in line with previous works focused on international trade (e.g. Anderson et al., 2018; Bergstrand et al., 2015; Franco-Bedoya and Frohm, 2021), as a result of the advance of globalization, we expect to find a reduction in the border effect over time.
The hypotheses we posit are to a certain extent aligned with the previous findings by Anderson et al. (2018) and Paniagua et al. (2022). The first finds that the border effect has diminished for international trade in services, but also finds that for trade in travel services the border effect is negative. That is to say, after controlling for multiple drivers of international tourism, Anderson et al. (2018) find that international tourism is greater than domestic. Paniagua et al. (2022) find a positive border effect. Also, for two of the three proxies that domestic tourism authors’ employ, they obtain results that suggest a reduction in the border effect. However, when Paniagua et al. (2022) proxy domestic tourism with the number of guests, their results suggest an increase in the border effect.
Methodology and data
Methodology
In the mid-1990s, taking the gravity models that had been used in economics since the 1960s as a basis -which in their simplest version consider that exchanges are directly proportional to the economic size of the countries and inversely proportional to the physical distance that separates them-the first estimations of the border effect were made for the Provinces of Canada and the States of the USA (McCallum, 1995). The measurement was made by introducing a dummy in the gravity equation, which takes the value 0 for regions within the same country and one when the regions are separated by a border. Anderson and Van Wincoop (2003) criticized the work of McCallum (1995) for being based on a gravity equation without theoretical foundations, which could introduce important biases in the estimates due to specification errors. Starting from the theoretical formulations of Anderson (1979) and Bergstrand (1985), Anderson and Van Wincoop (2003) developed a new gravity model with theoretical foundations and tested it empirically. Bergstrand et al. (2015) set out to simultaneously measure the impact of trade integration agreements, borders, and physical distance on trade flows, concluding that previous estimates were biased upwards.
We use the gravity equation to estimate the border effect on tourism. Mimicking Newton’s universal law of gravitation, the gravity model for tourism predicts that international travel will be positively moderated by the countries’ economic masses (or population) and negatively by the geographic distance between them. This model has been widely and successfully used by previous literature that sought to explain the drivers of bilateral tourism (e.g. Gil-Pareja et al., 2007; Keum, 2010; Santana-Gallego and Paniagua, 2022). In addition, Morley et al. (2014) provided a theoretical background that supports the use of the gravity equation to model tourism demand. We estimate the following equation:
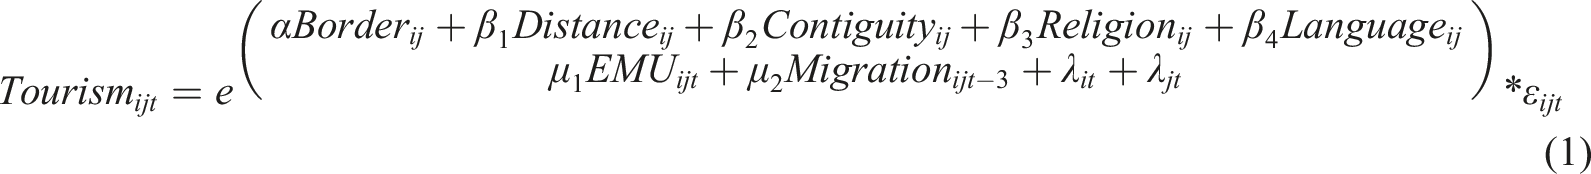
Border and Contiguity are different explanatory variables. The first quantifies the relevance of internal flows relative to international ones, while Contiguity represents the effect that sharing a geographic border with another country has on international flows. Accordingly, the coefficient associated with Border
Since our analysis covers the 2012–2019 period for a sample of highly integrated European countries, we do not need to control for other relevant time variant bilateral drivers of tourism such as trade agreements or the cost of visas (Balli et al., 2013; Santana-Gallego et al., 2016).
Equation (1) includes origin country-year fixed effects
In this paper the concept of distance is addressed from a spatial point of view, although there are other non-physical factors that increase the perception of distance between two countries (Popli et al., 2016). These factors correspond to social and cultural differences that can modify human and economic interactions between territories (Björkman et al., 2007; Basuil and Datta, 2015), acting as a mental barrier (Maddux and Galinsky, 2009). Hence, the importance of including elements such as language, social values, cultural aspects, religion and contiguity in the analysis, which in a way capture distances/cultural frontiers, as this paper proposes. In the European context, there are several forces that condition - in different ways - the non-physical and non-political barriers between countries. Such as the creation of a European identity and policies that encourage interaction between citizens and companies, the reinforcement of national identity and the homogenization processes associated with globalization (Weidenfeld, 2013).
Equation (1) is estimated to gauge the size of the border effect. Equation (2) measures the evolution of the border effect during our period of analysis:

As in Bergstrand et al. (2015) the
Equations (1) and (2) are estimated with the Pseudo Poisson Maximum Likelihood (PPML) estimation. Since the work from Santos-Silva and Tenreyro (2006), the PPML has been the standard estimator for the gravity model. The estimator allows estimation of a log linear model at the same time that we are able to conserve the zeros usually present in bilateral data and to overcome the heteroskedasticity problems usually present with Ordinary Least Squares. Following Egger and Tarlea (2015), robust standard errors are multiway clustered at the origin and destination country. We use the PPML high-dimensional fixed effects estimator from Correia et al. (2020).
Data overview
The data about international and domestic tourism is from Eurostat. We used a bilateral dataset of the number of tourists between 29 source and 32 destination European countries for the period 2012–2019 (The list of countries and details about the treatment of the tourism data are available in the Supplemental Appendix). With the Eurostat data we can have separate statistics for the number of tourists according to different lengths of stay: the number of tourists that stayed between one and three nights and the number that stayed four or more nights. A limitation of our data is that it does not account for tourists spending their trip in establishments that are outside the market (e.g. a family house). This limitation is likely to be present in both, international and domestic trips, however it might be more important in the case of domestic trips. Nonetheless, our database should be useful to compare domestic and international tourism that is measured in a homogeneous way.
Figure 1 illustrates the evolution of the ratio of international-domestic tourists by different lengths of stay. As expected, independent of the length of stay the number of domestic tourists is significantly larger than the number of international ones. Nevertheless, the difference is smaller for tourists that stay four or more nights. On average, for each one hundred domestic tourists that stay one to three nights, there are nearly 15 that holiday abroad. For each one hundred domestic tourists that stay four nights or more, nearly 57 stay abroad. In both cases there appears to be a positive trend in the ratio of international-domestic tourists, growth being more marked for the case of tourist trips that last four nights or more. Alternatively, Table 1 shows that on average the number of tourists that stay between one and three nights is larger than the number of tourists that stay four nights or more. Short trips are more frequent and more likely to occur domestically than longer ones. Ratio of international-domestic tourists. Source: The Authors. Data from Eurostat. Descriptive statistics. Source: the authors. The number (No.) of tourists is reported in thousands.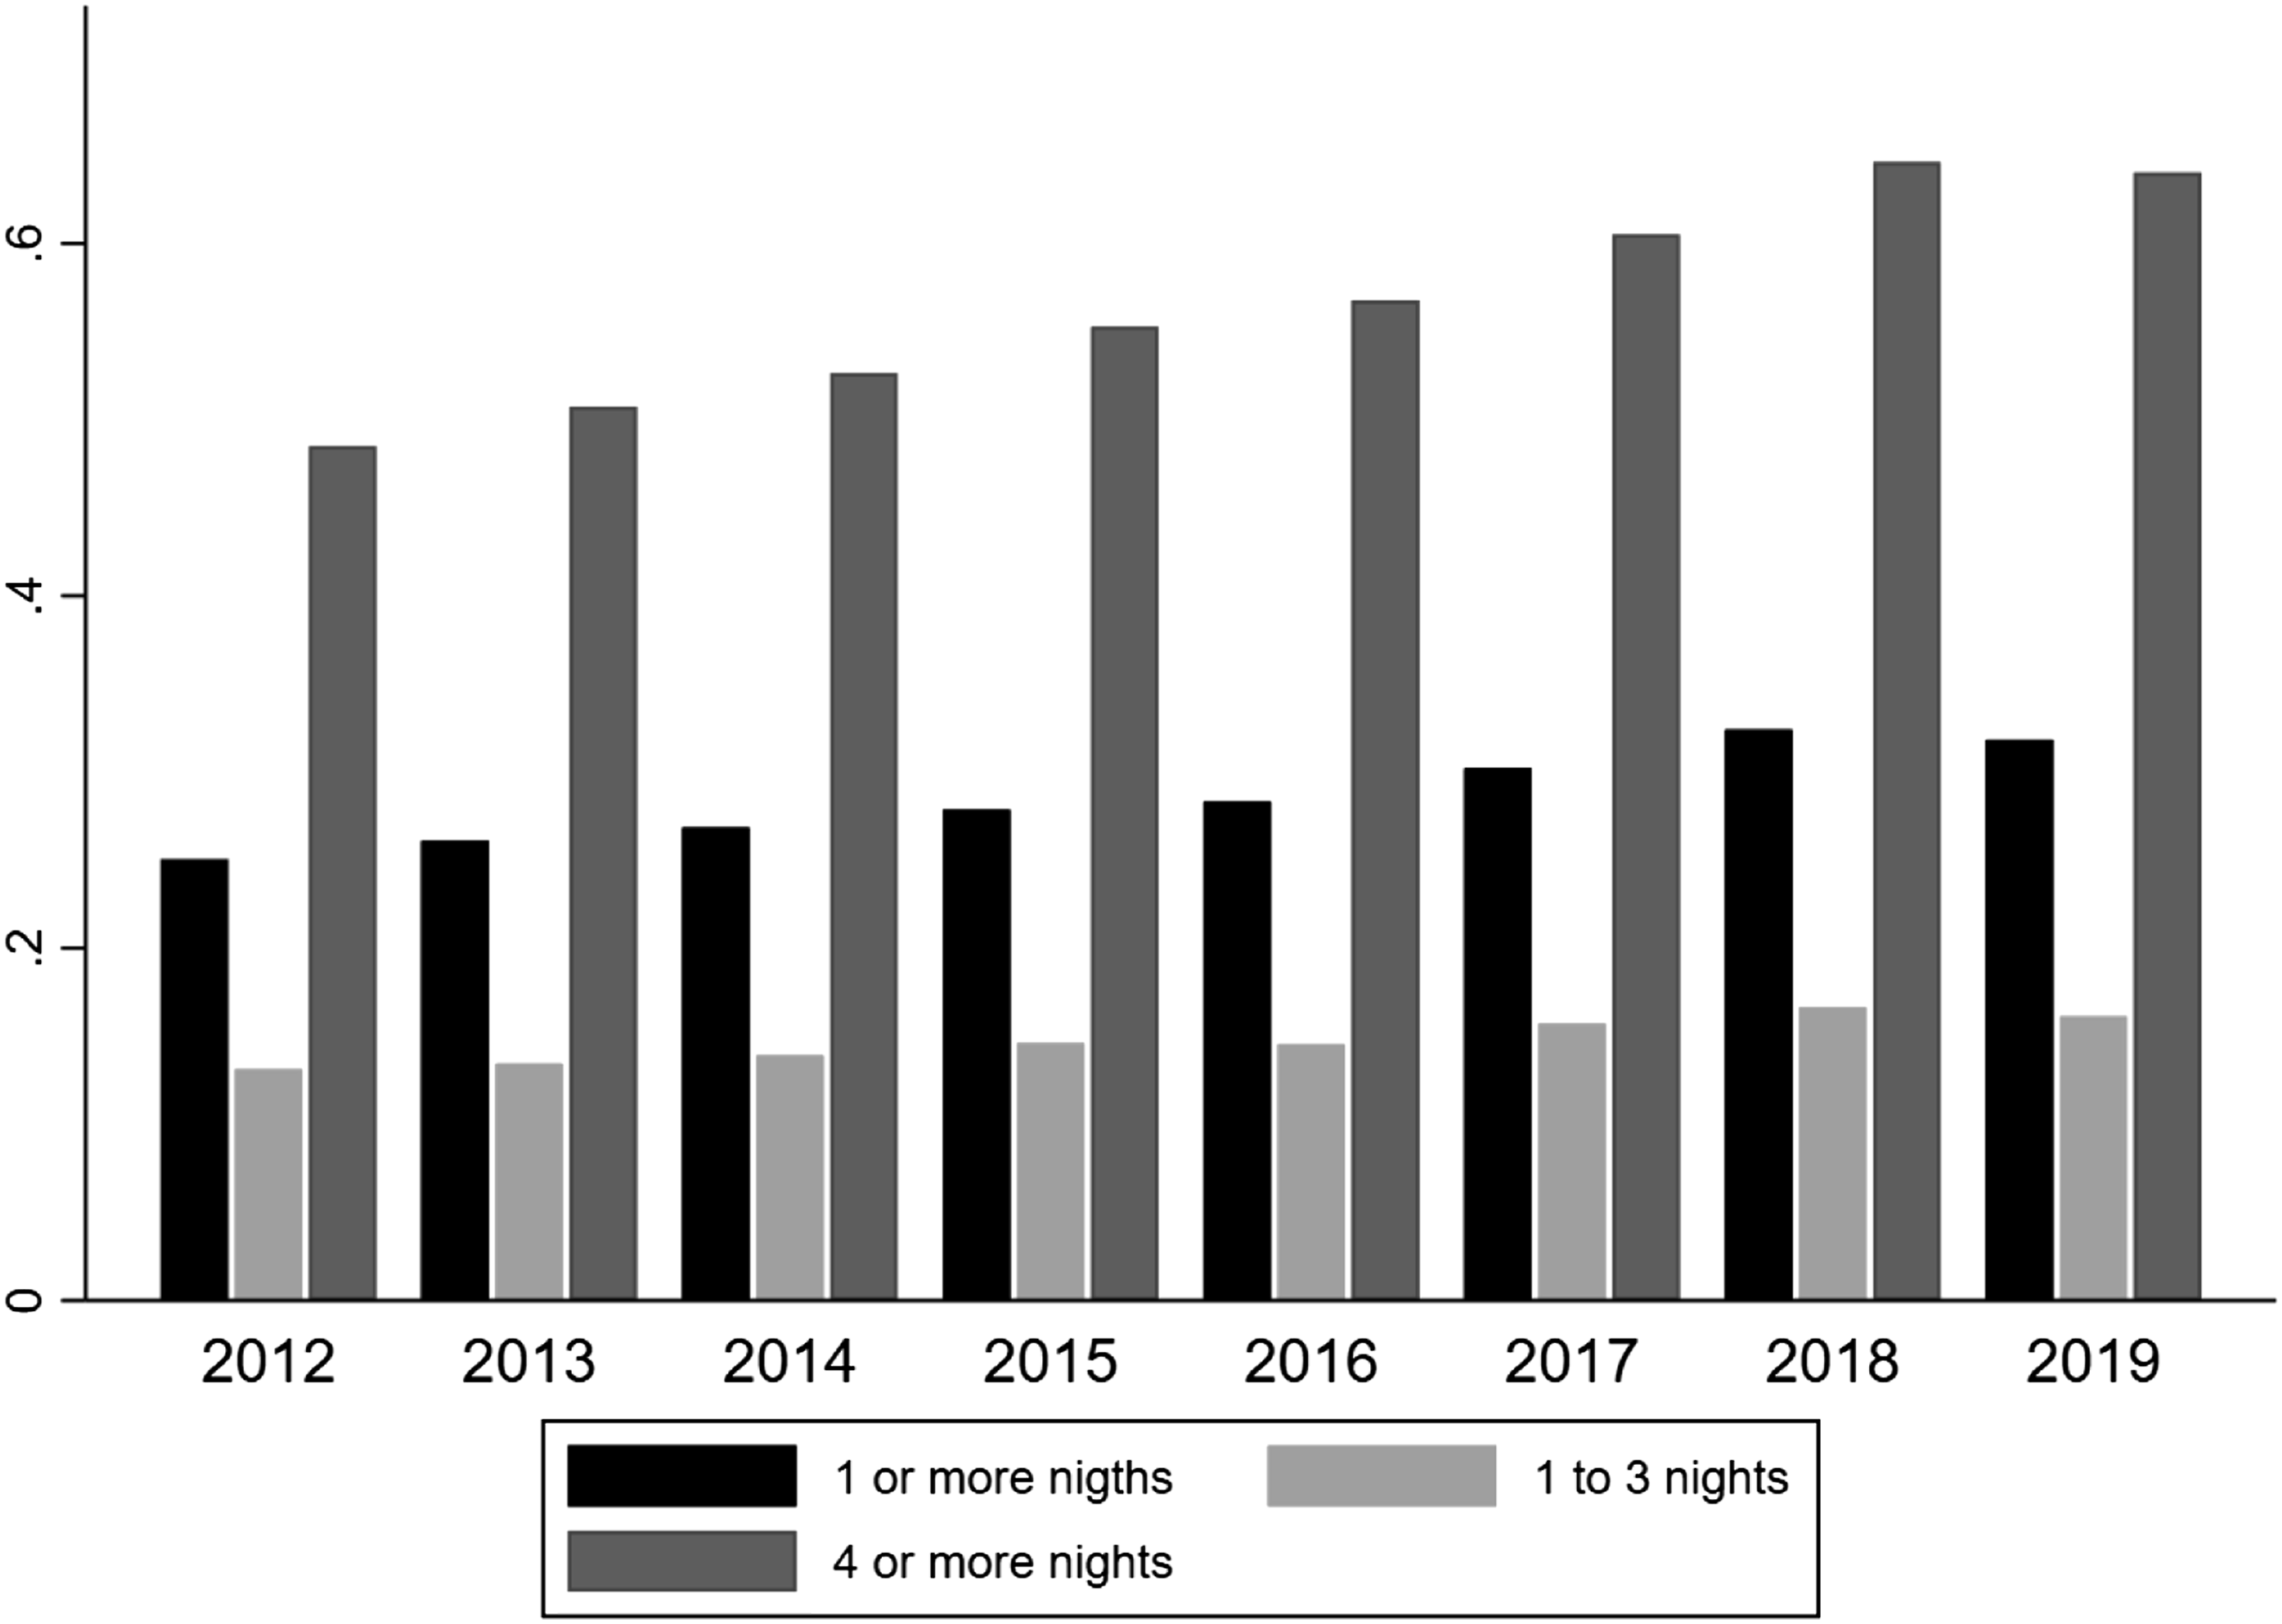
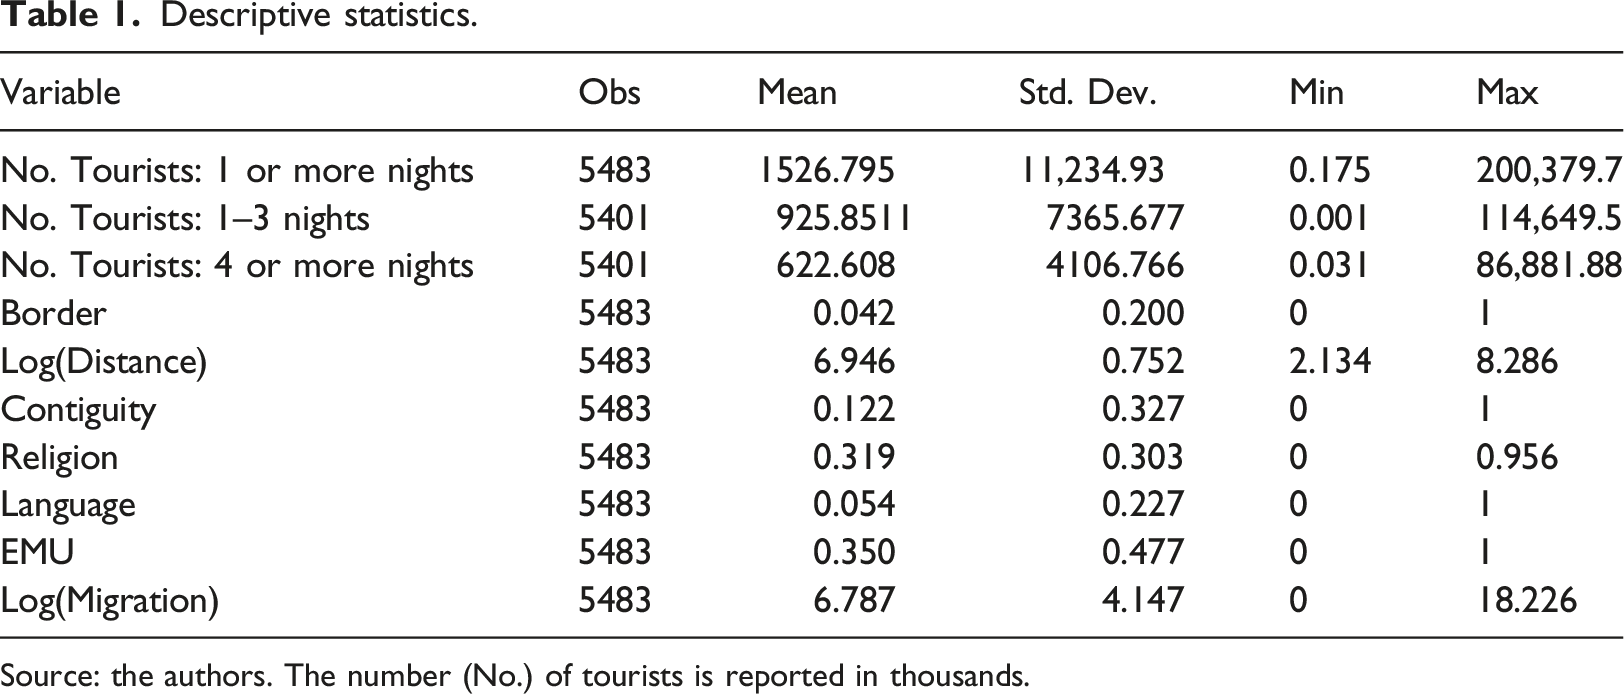
The variables for geographic distance, contiguity, religion similarity and language were obtained from the CEPII database (Head et al., 2010). Geographic distance between countries is the population-weighted distance between the most populated cities measured in kilometres. Contiguity is an indicator variable that has the value one when two countries share a geographic border. The religion similarity index was obtained by adding the products of the proportions of the different religions in the origin and destination countries. It is an index that can have a value between 0 and 1, the higher the value of the index, the higher the religious similarity between a pair of countries. Language is a dummy variable that has the value one when two countries share the same official or principal language. The EMU variable was constructed by the authors. This variable has a value of one when two countries are members of the EMU. Data on the stock of international migrants and domestic non-migrant population was obtained from Eurostat. For some countries, missing data on the domestic non-migrant population was imputed using a population data net of international migrants obtained from the World Bank’s Development Indicators 4 . Descriptive statistics are available in Table 1.
Results
The border effect on tourism trips of one night or more.
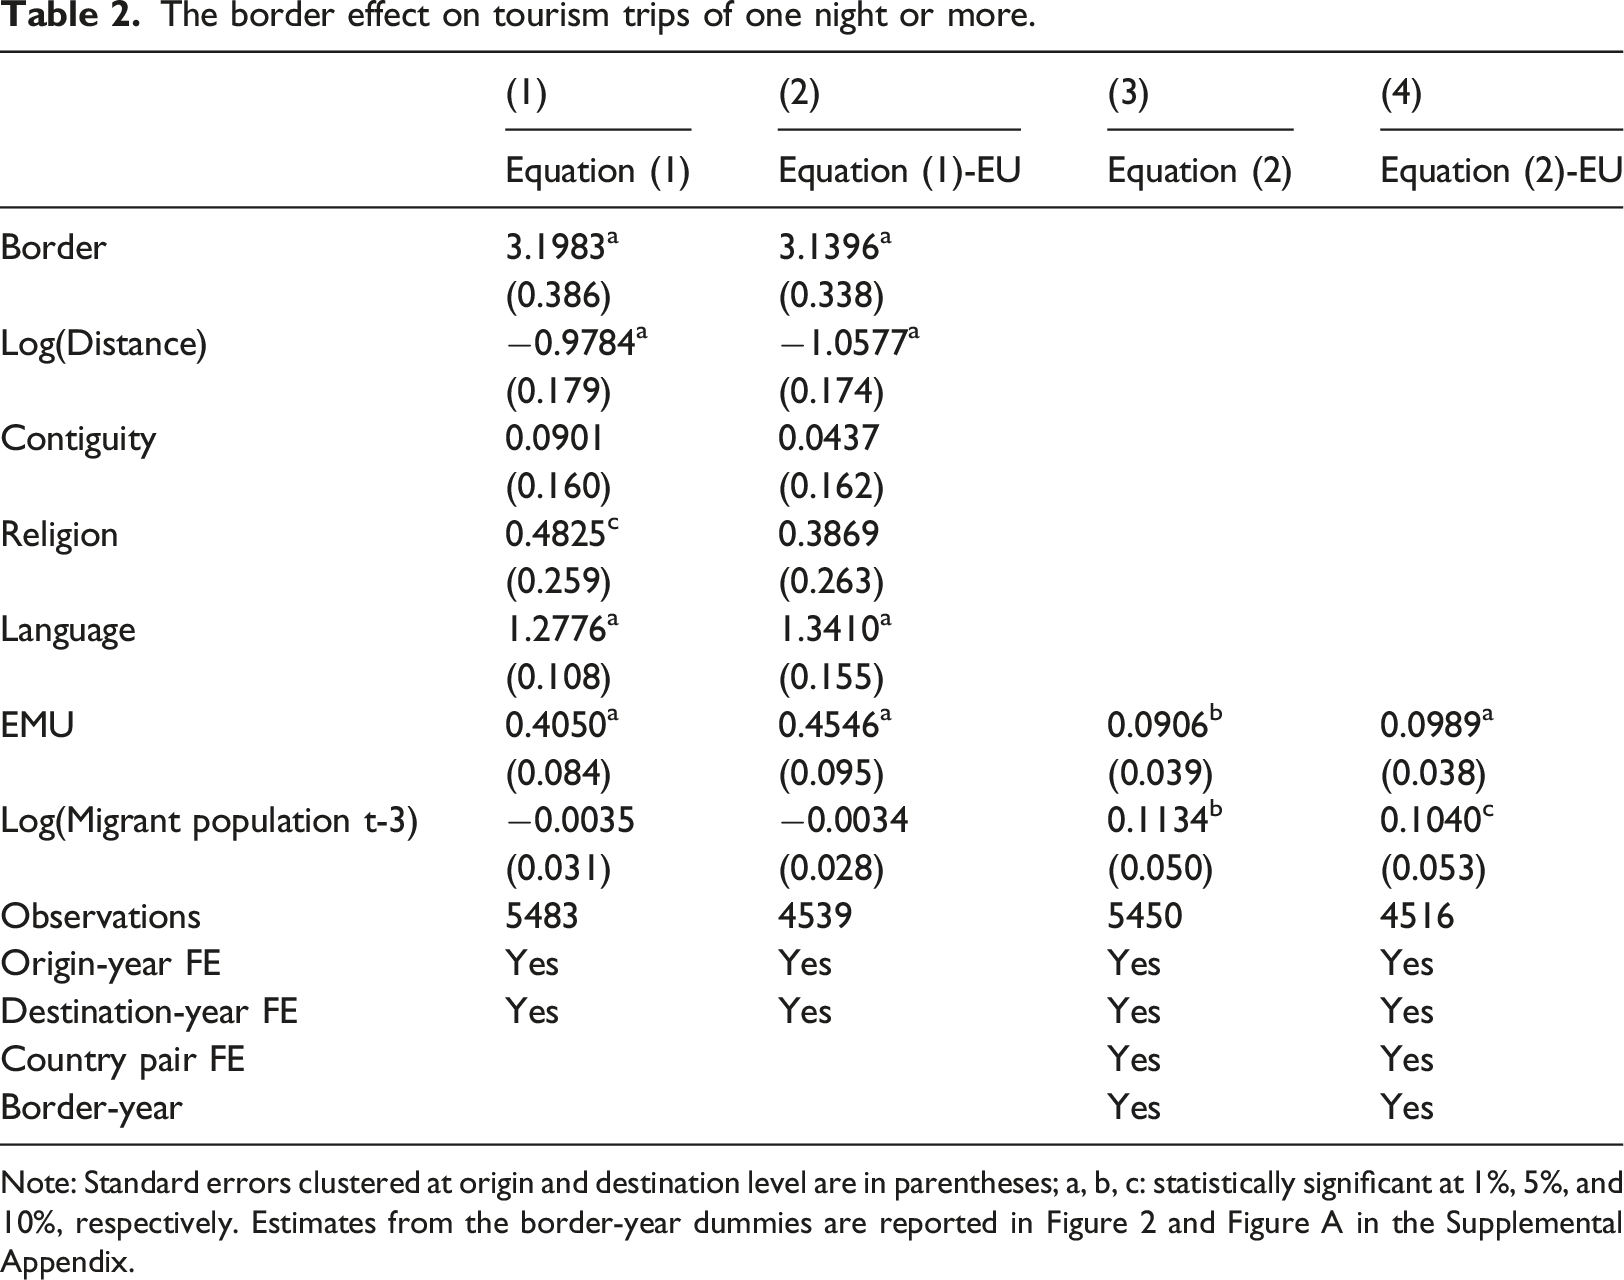
Note: Standard errors clustered at origin and destination level are in parentheses; a, b, c: statistically significant at 1%, 5%, and 10%, respectively. Estimates from the border-year dummies are reported in Figure 2 and Figure A in the Supplemental Appendix.
Columns 3 and 4 show that being a member of the EMU has a significant, positive effect on the number of tourism trips. 5 The positive effect of the EMU on the number of tourists trips is aligned with the previous literature that shows the positive effect that the EMU has between country members on tourism, international trade, cross-border M&As, bonds and equity holdings (e.g. Coeurdacier and Martin, 2009; Coeurdacier et al., 2009; Gil-Pareja et al., 2007; Glick and Rose, 2016).
Estimates in columns 3 and 4 indicate that the stock of migrant population from country
Regarding the border effect, columns 1 and 2 from Table 2 corroborate that even in the case of analyzing a sample of highly integrated countries, there was a stronger preference for travelling domestically than internationally. Our estimates show that domestic trips were between 23
Figure 2 illustrates the evolution of the border effect relative to the base year 2012. These estimates were obtained from equation (2) (column 3). The results show that during the years 2014–2016 there was no significant change in the border effect. However, in years 2018 and 2019 there was a reduction in the border effect of 11% Evolution of the border effect on tourism trips of one night or more. Note: Evolution of the border effect, 2012–2019. Change of the border effect relative to the border effect in 2012. Coefficients are obtained from estimating equation (2) with the whole sample.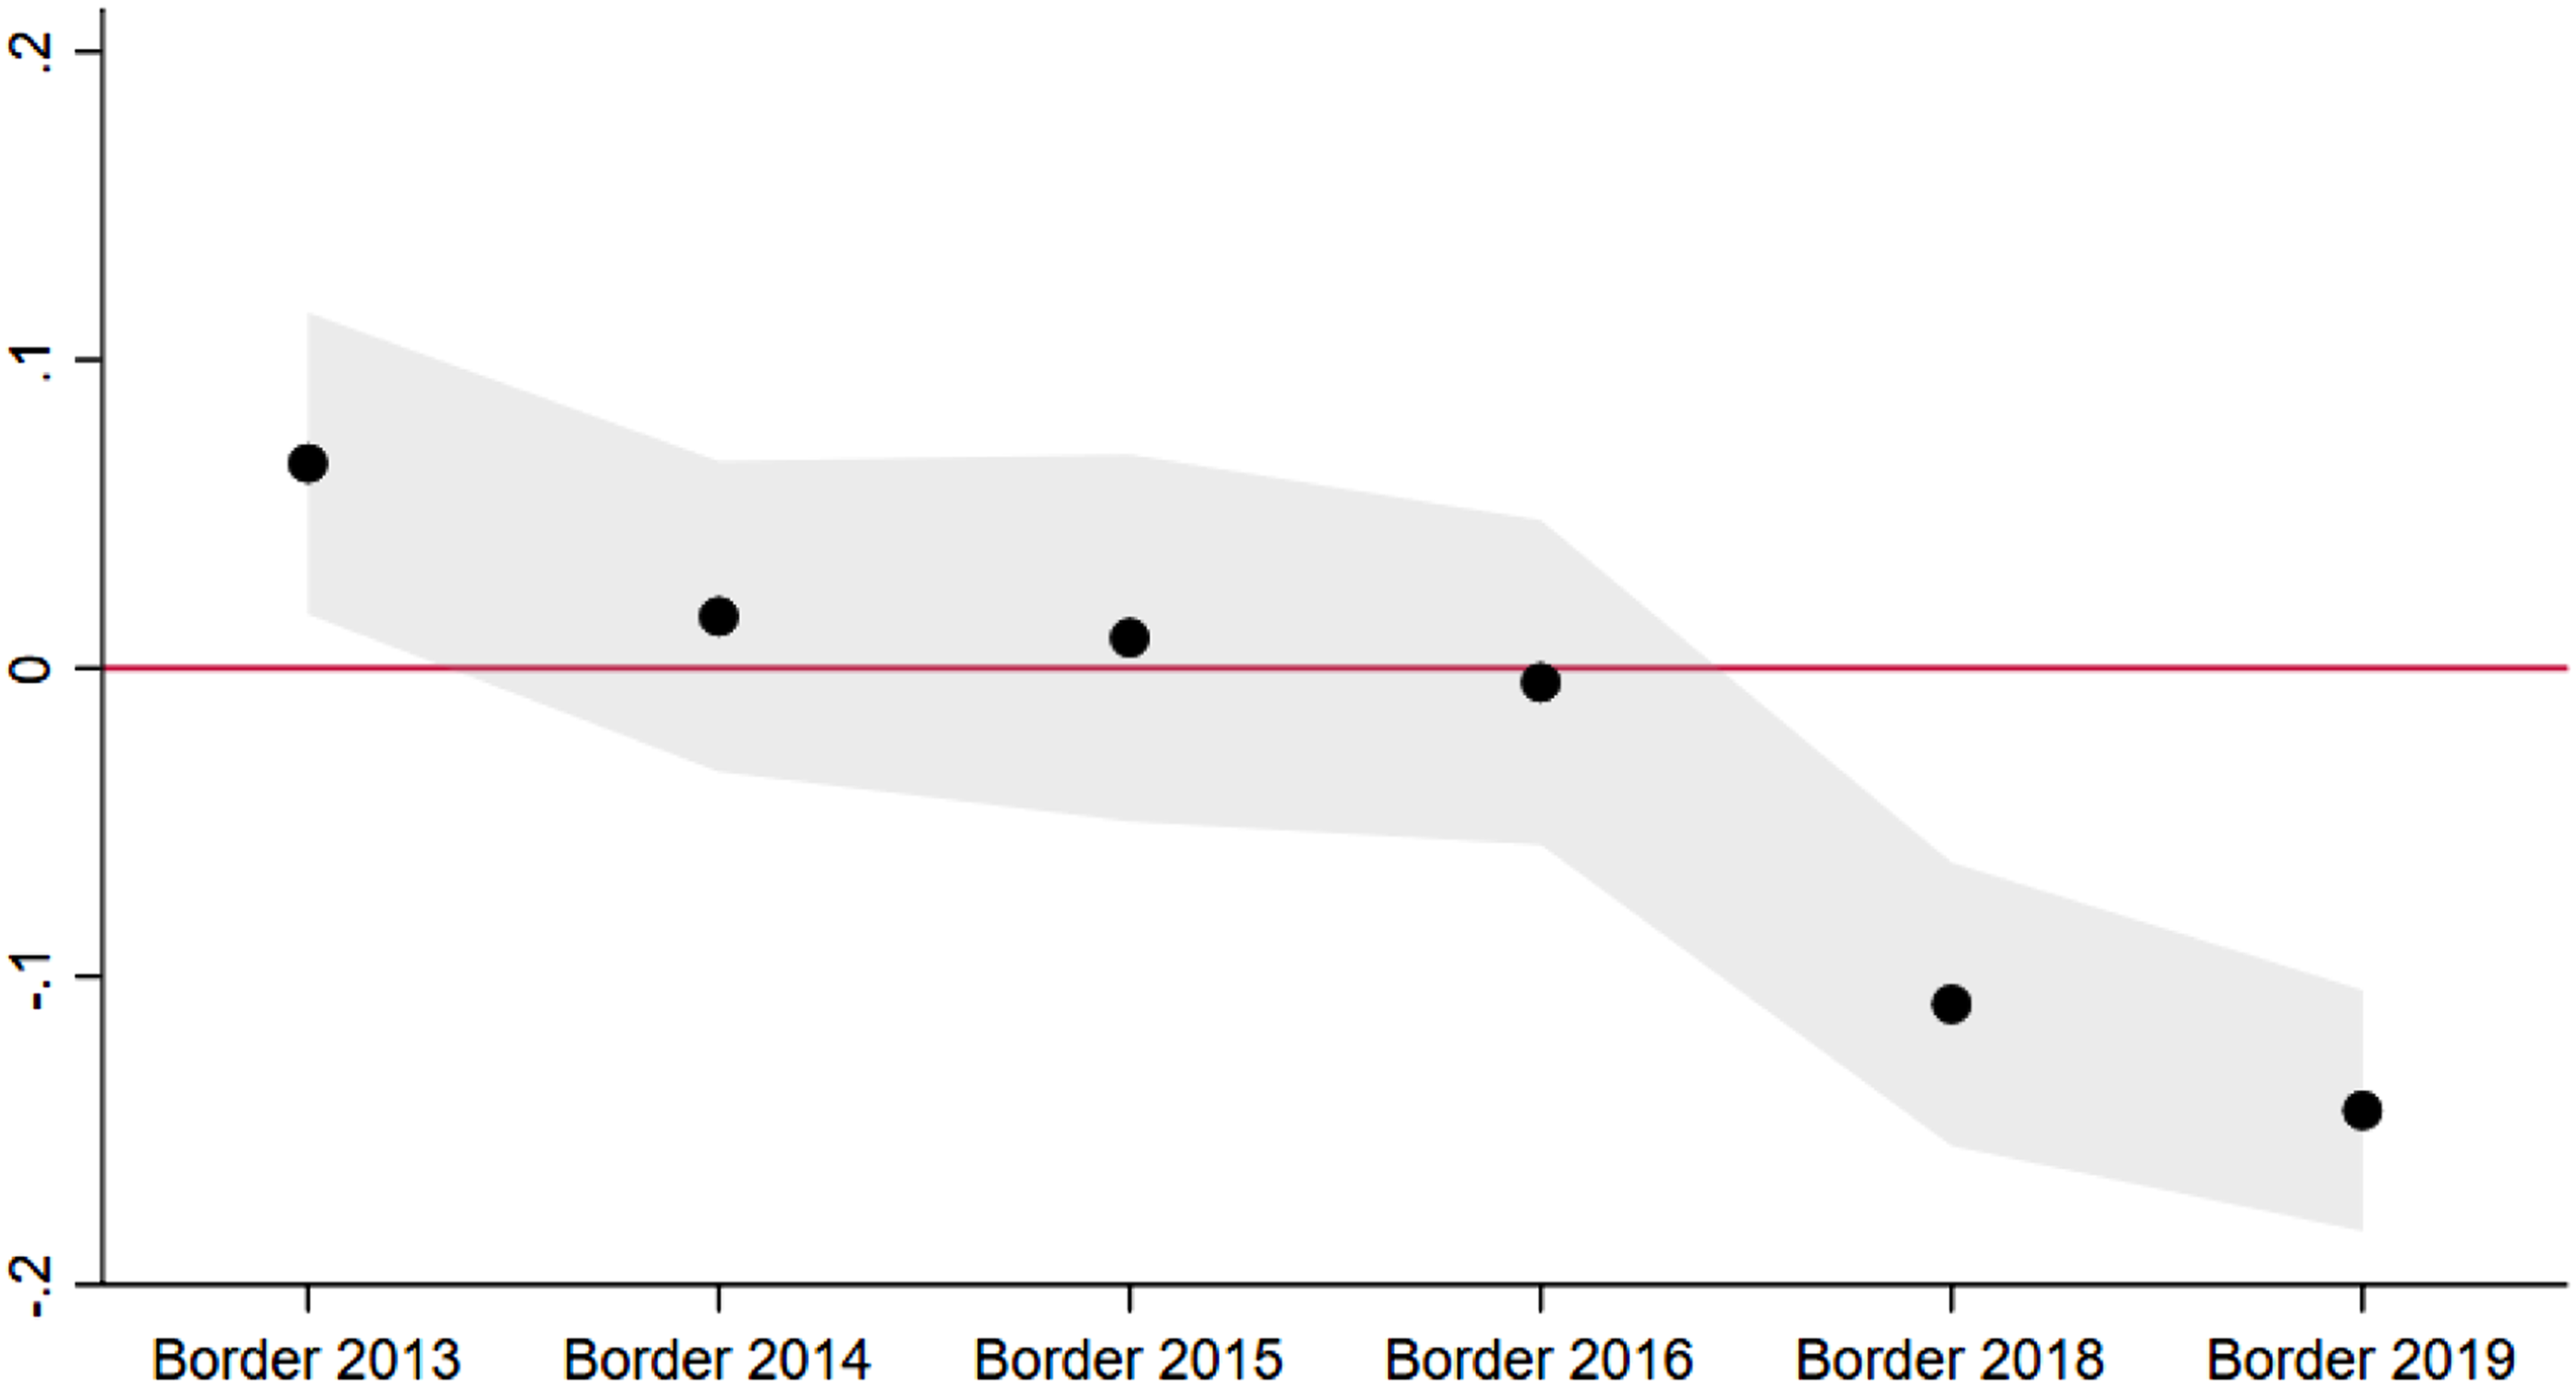
The border effect on tourism trips of one to three nights and four or more nights.
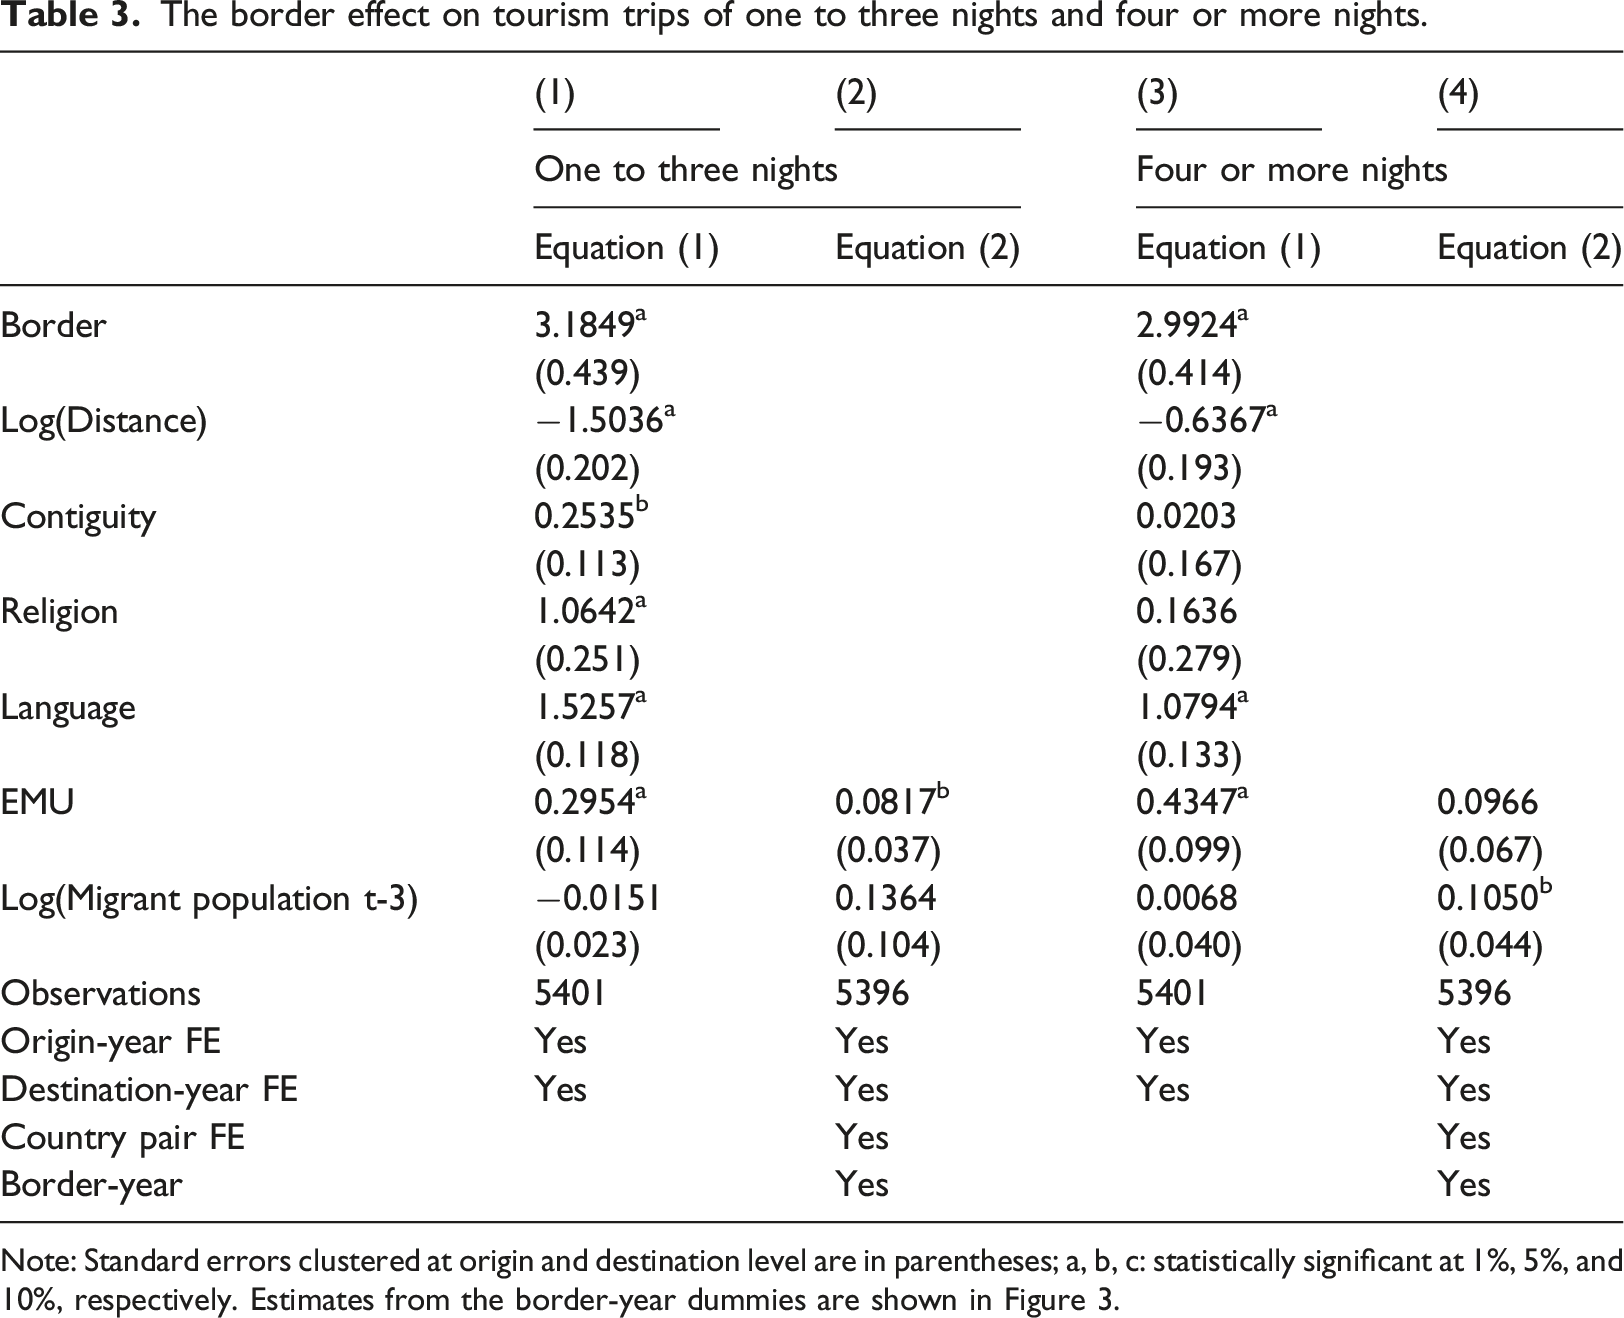
Note: Standard errors clustered at origin and destination level are in parentheses; a, b, c: statistically significant at 1%, 5%, and 10%, respectively. Estimates from the border-year dummies are shown in Figure 3.
In terms of the border effect, estimates from Table 3 are to a certain extent aligned with the descriptive statistics reported in Figure 1. The preference for making domestic tourists trips was greater for short trips than for long trips. For trips of one to three nights, estimates show that domestic trips were 24.2
Figure 3 presents the evolution of the border effect relative to the base year 2012 for those trips that last between one and three nights and those that last four nights or more. Estimates were obtained from columns 2 and 4 respectively. In both cases, there was a reduction of the border effect, in 2019 they were 10.9% Evolution of the border effect on tourism trips of one to three nights and four nights or more. Note: Evolution of the border effect, 2012–2019. Change of the border effect relative to the border effect in 2012. Coefficients are obtained from estimating equation (2) with the whole sample.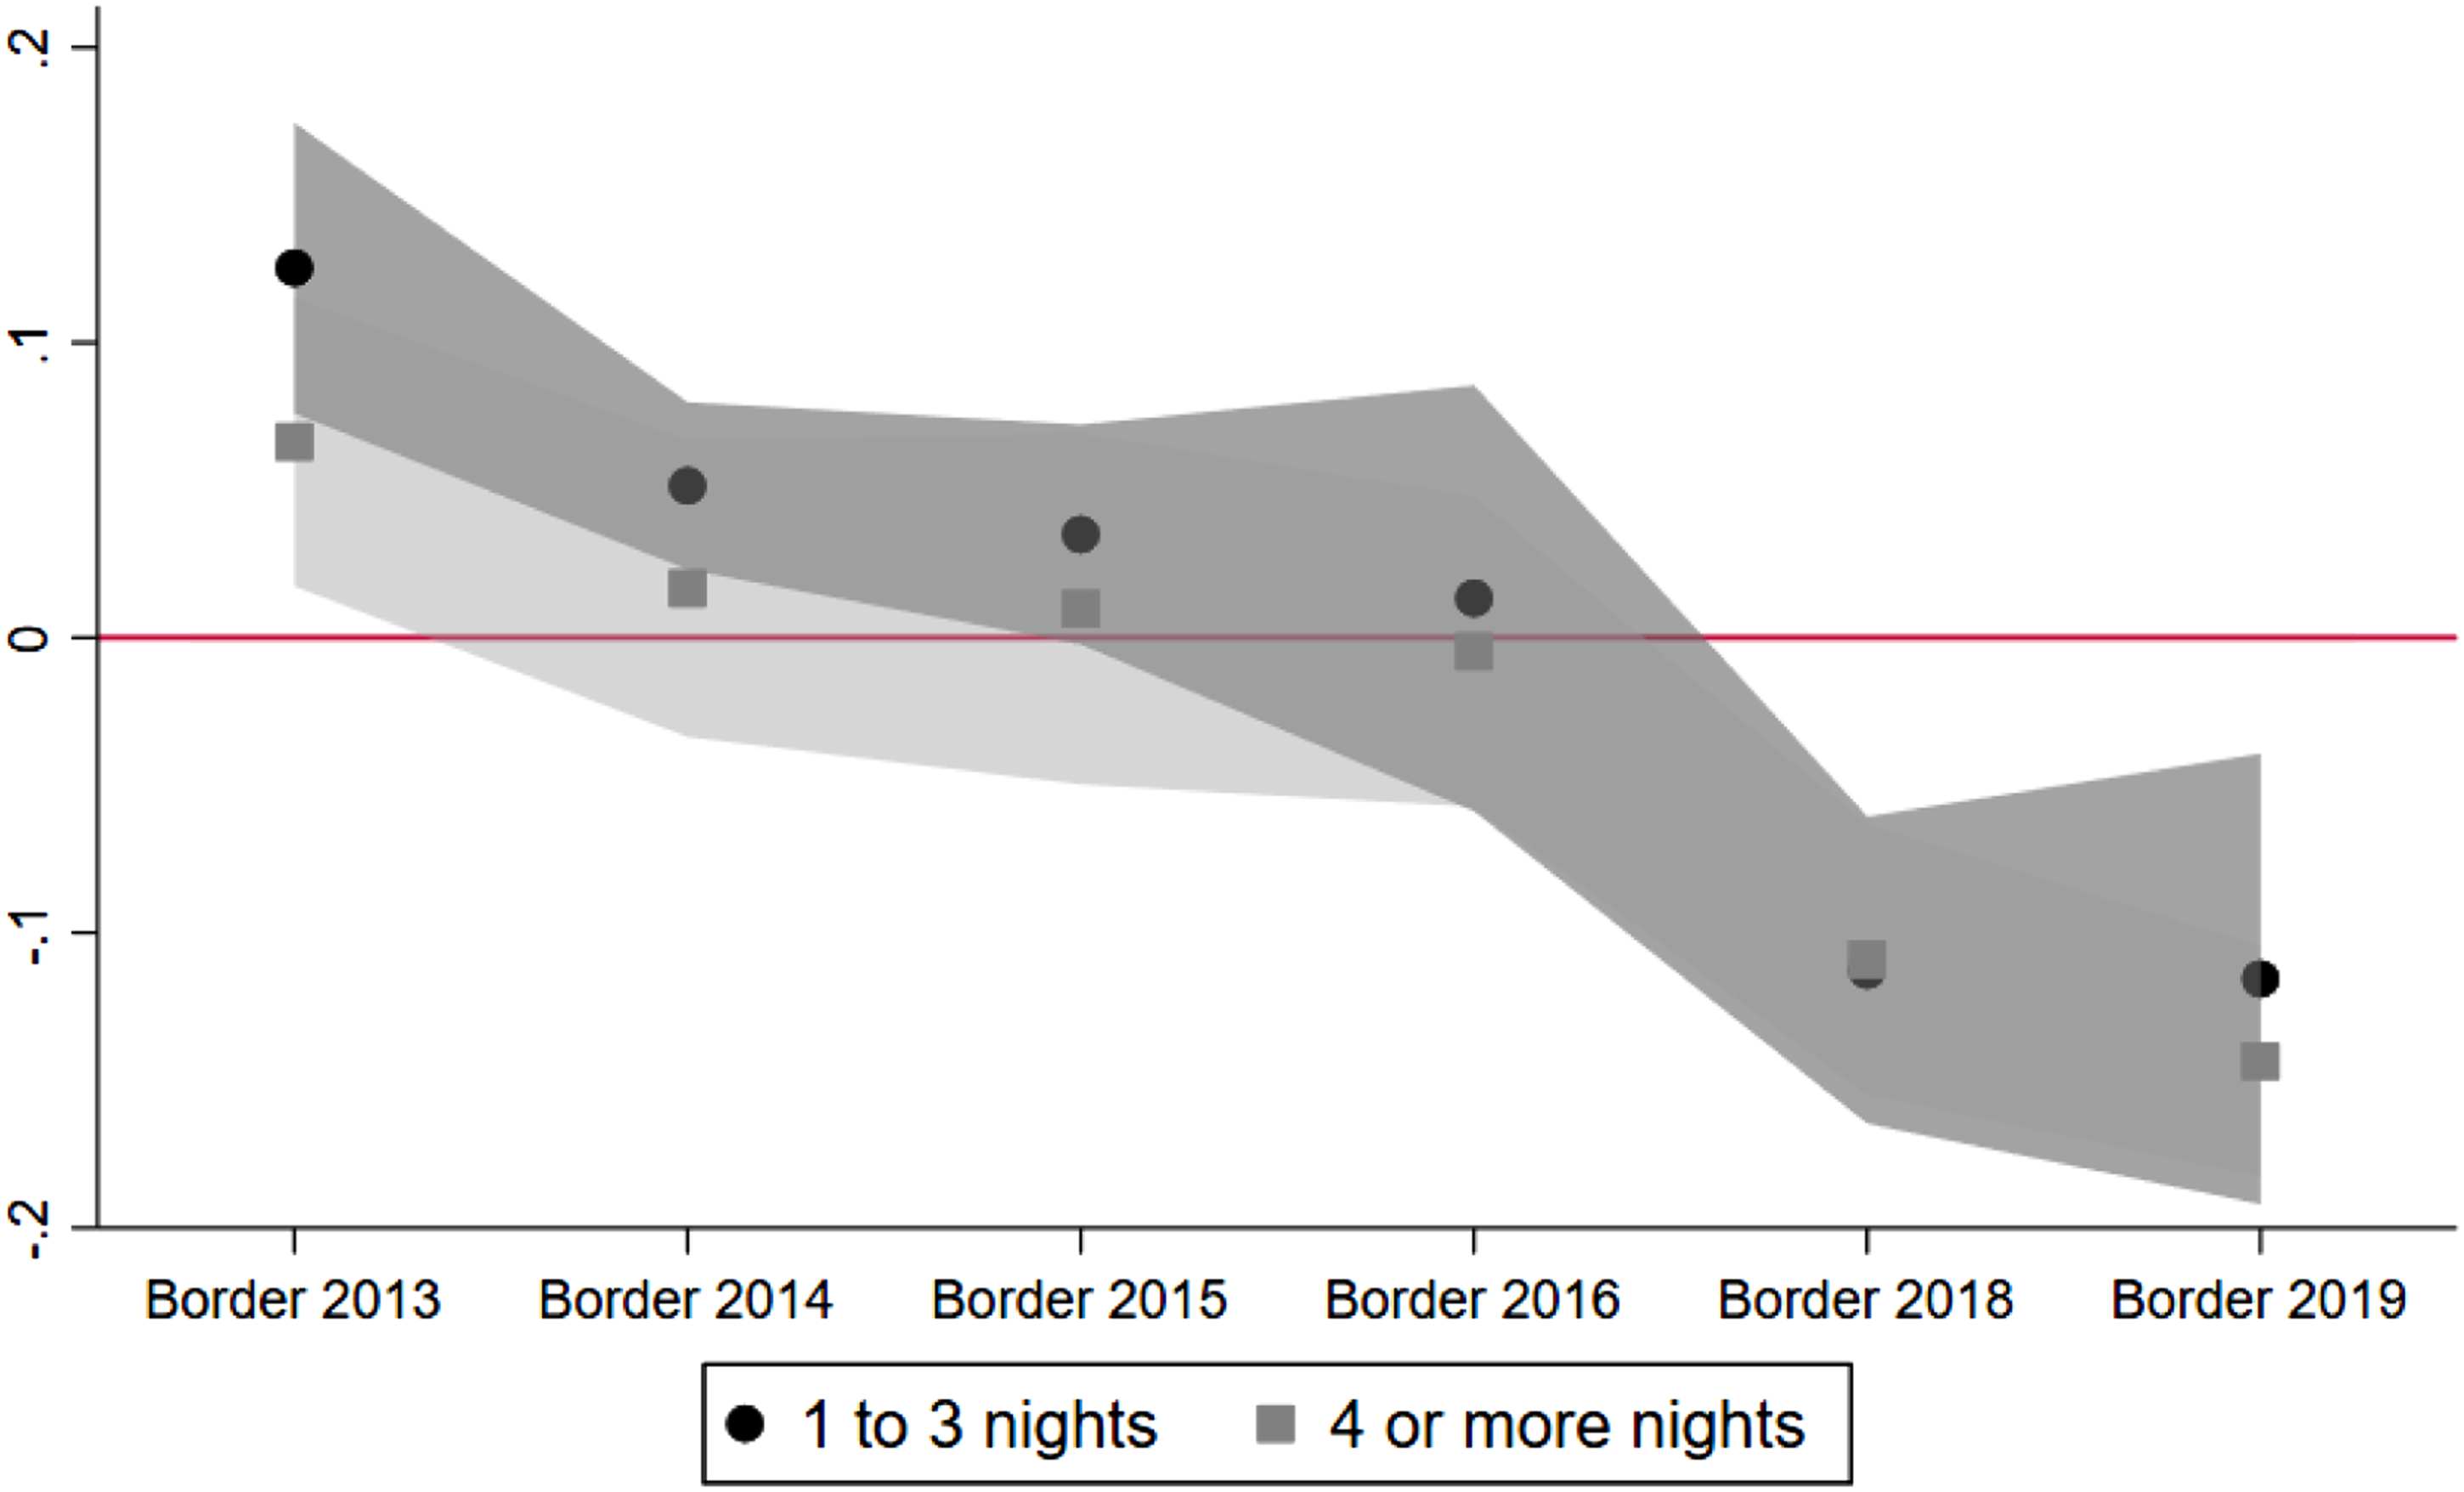
Discussion and conclusions
The study of the factors that influence international tourism flows is an object of increasing attention. In the past two decades, a lot of empirical works have emerged; most of them based on gravity models, which try to explain the general patterns observed in tourist movement on a global scale. This research is intended to contribute to that existing literature. It presents a gravity model with domestic and international tourist flows for a sample of 32 European countries for the period 2012–2019. Generally, referring to the most conventional hypothesis, our results are in concordance with the previous literature. Tourist flows are sensitive to physical distance, religious and linguistic affinity, the fact of sharing the same currency, and the previous existence of a certain stock of migrant population.
Regarding our most novel hypothesis, the results indicate that the border effect is a factor that greatly influences the travel decisions of tourists. Our results prove that domestic tourism is between 19 and 24 times higher than international tourism. Furthermore, in consonance with globalization, it was found that there was a reduction in the border effect between 2012 and 2019. This means that the tendency of the border effect to diminish could probably also be explained by the very same reasons that explain its loss of significance in commercial exchanges (reduction relating to international transport cost, opening of borders in the globalization scenario, etc.).
In addition, considering the type of trip and as economic intuition suggests, the negative effect of geographic distance on shorter trips is greater than on longer trips, while sharing a currency or language, having a common border, and having a religious affinity might have a greater positive effect on shorter trips. As far as the migrant population is concerned, it only seems to have a positive influence on long trips. Stated briefly, our results indicate that tourists prefer to incur lower travel and transaction costs when making short trips. However, we find no evidence that the border effect differs according to trip length.
These results could be relevant when it comes to designing tourism promotion policies by governments, and defining business strategies in order to attract travellers. The variables influencing short and long trips are significantly different in each case, and the source markets of tourists may necessarily be oriented towards one or the other travel mode, as is the case, for example, with transatlantic trips, which logically need to be scheduled for more days. The lure of a common language and culture may be relevant in certain markets or types of travel, but be much less relevant in other cases. Promotional campaigns for specific dates (weekends, special events such as fairs, exhibitions, etc.) may make sense in certain countries or types of travel, but not in others. In conclusion, policy makers and tourism businesses need to be aware of the differences in the factors influencing different types of travel in order to develop effective and efficient policies and business strategies.
Considering previous literature, we found that the border effect is close to the lower rank of the estimations given by Paniagua et al. (2022). The aforesaid work found that the border effect swings in such a manner that residential tourism flows are between 19 and 117 times greater than international ones. The rank of estimations of Paniagua et al. (2022) is determined by the different strategies used to approach residential tourism. In other matters, as opposed to Anderson et al. (2018) and the travel trade, we can see a positive frontier effect.
Furthermore, our estimates indicate that the border effect on tourism is greater than for international trade and FDI, but lower than for forced migration. Bailey et al. (2021) show that domestic trade is 5–9 times greater than international. Umber et al. (2014) conclude that domestic M&A is 6 times greater than cross-border. Carril-Caccia et al. (2021) found that domestic forced migration is 42 times greater than international. This is probably due to the greater subjective effect that frontiers have on personal decisions regarding travelling. Therefore, aligned with the previous literature on trade and forced migration (Anderson et al., 2018; Bergstrand et al., 2015; Carril-Caccia et al., 2021; Franco-Bedoya and Frohm, 2021; Head and Mayer, 2021), we also observe a decline over time in the border effect on tourism.
Finally, we should highlight that this work focuses on a geographic field and a quite homogeneous period of time from an economic, political, health and safety point of view. This homogeneity, most likely, is behind the strength of the obtained results. Nonetheless, at the same time, it constitutes a limitation of our analysis, due to the lack of diversity that stops our models from capturing more precisely the effects of cultural differences, administrative constraints, migratory flows, pandemics, the political situation and global security at a global scale. All of this indicates that we should increase the sample of countries and the analysed period of time in future works, contemplating them from an intercontinental perspective and covering more heterogeneous periods. Moreover, future research could address different dimensions that can potentially moderate the border effect. For instance, the border effect could be moderated by the cultural differences or social ties that there are between country pairs. In addition, country level factors, such as institutional quality and the number of World Heritage sites, could also affect the size of the border effect.
Supplemental Material
Supplemental Material - How important are borders for tourism? The case of Europe
Supplemental Material for How important are borders for tourism? The case of Europe by Federico Carril-Caccia, José María Martín Martín, Francisco Javier Sáez-Fernández in Tourism Economics
Footnotes
Acknowledgment
We are very grateful for the feedback from two anonymous reviewers. This research was conducted as part of the Project PID2021-122133NB-I00 financed by MCIN/AEI/10.13039/501100011033/FEDER, EU. We also gratefully acknowledge financial support from the Junta de Andalucía (SEJ 413) and Generalitat Valenciana (CIAICO/2021/006).
Declaration of conflicting interests
The author(s) declared no potential conflicts of interest with respect to the research, authorship, and/or publication of this article.
Funding
The author(s) received no financial support for the research, authorship, and/or publication of this article.
Supplemental Material
Supplemental Material for this article is available online.
Notes
Author biographies
References
Supplementary Material
Please find the following supplemental material available below.
For Open Access articles published under a Creative Commons License, all supplemental material carries the same license as the article it is associated with.
For non-Open Access articles published, all supplemental material carries a non-exclusive license, and permission requests for re-use of supplemental material or any part of supplemental material shall be sent directly to the copyright owner as specified in the copyright notice associated with the article.