
Abstract
In the post epidemic period, it is important to clarify the relationship between economic growth and tourism growth. The aim of this study is to characterize the co-movement between expected macroeconomic conditions and inbound tourism, focussing on the nonlinear relationship between these variables. Dynamic copula-based GJR-GARCH models are employed to measure nonlinear dependence. Total inbound tourism to Thailand and its disaggregation for its 10 main origin countries, are considered in the empirical study. The results show that there exists significant co-movement between expected economic growth and inbound tourism, and prove the importance of considering nonlinearities and extreme events. Also, copula nonlinear Granger causality is used to conclude that inbound tourism and expected economic growth have nonlinear bi-directional and unidirectional Granger causality relationship. Finally, this paper puts forward some policy suggestions to restore tourism and boost economic growth in the post epidemic period.
Keywords
Introduction
Tourism is considered as one of the key ways to boost the economy in the world. In 2019, 1.5 billion international tourist arrivals were recorded by the World Tourism Organization (UNWTO). This explains the importance of the tourism industry in the world economy (Assadzadeh et al., 2014). According to the World Tourism Travel Council (WTTC, 2021), Travel and Tourism (including its direct, indirect and induced impacts) accounted for one in four of all new jobs created across the world, 10.6% of all jobs (334 million) and 10.4% of global GDP (US$9.2 trillion) in 2019.
The analysis of the relation between economic growth and tourism has a long tradition in tourism economics studies (Comerio and Strozzi, 2019). Some scholars discuss the tourism-economic growth relationship in terms of different hypotheses, such as the ‘tourism-led economic growth (TLEG) hypothesis’ (Thirlwall, 2000), ‘economy-driven-tourism growth (EDTG) hypothesis’ (Kim et al., 2006), etc. While other academic approaches focus on their long-term and short-term relationship (Oh, 2005; Arslanturk et al., 2011; Nonthapot, 2013), causal relationship (Tugcu, 2014; Kumar et al., 2019; Enilov and Wang, 2021), etc. In short, scholars expose the relationship between tourism and economic growth from different perspectives, and thus promote the coordinated development of tourism and economy. However, there is a considerable debate on the mechanism and the nature of the relationship between tourism and economic growth. Song and Wu (2021) emphasize the need to strengthen the theoretical foundations of this link.
From the empirical approach, the methodologies focussing on nonlinear relationships seem to have become the mainstream research direction, instead of assuming linear correlations (Benkraiem et al., 2020). This is because a linear framework oversimplifies the tourism-growth relationship, as the underlying relationship between the variables is indeed complex and nonlinear in nature (Wang, 2012). However, existing studies mainly investigate time invariant nonlinear impacts of economic growth on tourism (Karimi, 2018). This kind of ‘nonlinear influence relationship’ might not be able to reveal the complete nonlinear relationship or co-movement between tourism and economic growth. In fact, some authors (Enilov and Wang, 2021; Santamaria and Filis, 2019) question the time invariant assumption of tourism-growth relationship. Moreover, countries where tourism is the leading industry need to clarify the relationship between tourism and economic growth in order to create conditions for economic recovery after COVID-19. Therefore, this paper studies the nonlinear and time-variant relationship between tourism and economic growth (dynamic co-movement) which has important practical value, particularly in the post-pandemic period.
In previous literature, the relationship between tourism and economic growth was mainly explained by three hypotheses. The first and widely accepted one is TLEG hypothesis. It derives from the general Export-Led Growth Theory (Thirlwall, 2000), and assumes that tourism is a major determinant of overall long-term economic growth. The TLEG hypothesis has been supported by a number of studies conducted either at a country or regional level such as Pérez-Rodríguez et al. (2015) and Eeckels et al. (2012). The empirical validity of the TLEG hypothesis is crucial for justifying that governments allocate resources to tourism development. However, the presumed impact of tourism development on economic growth is not necessarily conclusive and equally effective for all countries. A second proposition supported by some studies (e.g. Katircioglu, 2009a; 2009b; Tugcu, 2014) is the ‘neutrality hypothesis’. It posits that tourism and economic growth are actually independent. Thirdly, many studies have identified that economic development boosts tourism expansion, that is, the EDTG hypothesis, which assumes that the expected economic growth of a country promotes tourism development. The positive economic climate encourages the proliferation of tourism activities, and international visitors are also attracted by the country’s economic vitality (Kim et al., 2006; Shahbaz et al., 2017). In this latter context, Santamaria and Filis (2019) elaborate on the appropriateness of focussing on the dynamic relationship between tourism industry and expected economic growth, instead of considering the current growth.
The causal relationship between tourism and economic growth proposed by the TLEG hypothesis has been largely examined through a wide suite of econometric techniques, such as the Vector Error Correlation Model (VECM) (Arslanturk et al., 2011), Vector Autoregressive (VAR) model (Oh, 2005; Eeckels et al., 2012), Autoregressive Distributed Lag (ARDL) model (Nonthapot, 2013), Johansen approach of cointegration and Granger causality test (Oh, 2005; Surugiu and Surugiu, 2013; Chulaphan and Barahona, 2018) and asymmetric causality tests (Kumar et al., 2019). Considering the methods that model volatility, Generalized Autoregressive Conditional Heteroskedasticity (GARCH) and its extensions, such as the Dynamic Conditional Correlation (DCC)-GARCH, Glosten-Jagannathan-Runkel (GJR)-GARCH, are frequently used to analyze dynamic relationships between economic variables (Chan et al., 2005). Recently, Santamaria and Filis (2019) used the DCC-GARCH model to investigate the dynamic relationship between tourism and expected economic conditions in Spain.
Although all of these aforementioned studies contributed in gaining new and/or updated insights on the nature of the relationship between tourism and economic growth, many of these approaches assume that the variables are normally distributed. For example, VAR, VECM, DCC-GARCH and ARDL models assume that the data follows multivariate or bivariate normal distribution or student-t distribution with linear dependence. However, many socioeconomic variables, and particularly, tourism arrivals and expected economic growth, are skewed, leptokurtic and fat-tailed, which implies that they are not normally distributed (Santamaria and Filis, 2019). Therefore, dependence between two (or more) variables is more informative than linear correlation. When the joint distribution of the variables of interest is non-elliptical, the usual correlation coefficient is no longer sufficient to describe the dependence structure (Patton, 2006). Consequently, if we suspect that tourism arrivals and economic growth are not normally distributed, we should consider models that allow nonlinear dependence, or asymmetric dependence between these variables.
In view of the above understanding, we use time-varying copula-GARCH models to measure dynamic nonlinear dependence between tourism and expected economic growth. One remarkable advantage of this approach is that copula-GARCH models can consider any marginal distribution such as Gaussian, student-t, skewed Gaussian and skewed student-t. In fact, the Gaussian (T) copula-GARCH model with normal (student-t) distribution is equivalent to the DCC-GARCH model with a normal (student-t) distribution. Therefore, the copula-GARCH models can capture both linear correlation and nonlinear dependence.
The copula-based methods have been extensively used in many research fields, including finance (Patton, 2006), biology (Kim et al., 2008), agricultural economics (Albulescu et al., 2020) and energy economics (Elie et al., 2019). However, its application to tourism research is still limited. Some scholars have used copula-based methods to conduct research on decision making (Pérez-Rodríguez et al., 2021), travel behaviour (Zhang et al., 2012), exchange rate volatility and tourism (Tang et al., 2016) and tourism demand forecasting (Tang et al., 2017). As far as we are aware, only Pérez-Rodríguez et al. (2015) used copula-based methods to examine the interdependency between economic growth and tourism.
Our empirical analysis is applied to Thailand. During the last 15 years, the number of tourism arrivals to Thailand has increased remarkably, from less than 12 million in 2004 to 40 million in 2019. The country now ranks fifth in the world and second in Southeast Asia in terms of visitor arrivals. Tourism has strong linkages with other sectors such as transportation, accommodation, beverage and food and retail trade (Antonakakis et al., 2016; Mayer and Vogt, 2016), and it also contribute to increased tax revenues and foreign exchange earnings from related sectors (Kweka et al., 2003). According to the data from the Ministry of Tourism and Sports (2019), on average, tourism receipts accounted for 22.27% of GDP from 2014 to 2019. Moreover, international tourism receipts accounted on average for 58.89% of total tourism receipts, contributing to 13.17% of the GDP.
Given the increase of arrivals to Thailand during the last 15 years, and the corresponding importance of tourism for the Thai economy, understanding the relationship between these variables has gained increased attention. Previous scholars indicated that tourism expansion creates employment opportunities, increases foreign exchange income and tax revenue and promotes economic growth (Nonthapot, 2013; Liu et al., 2018). Some remarkable contributions are as follows: Lacher and Nepal (2011) studied the souvenirs’ impact on tourism economy; Oki et al. (1997) and Kofoworola and Gheewala (2008), quantified the tourism contribution to economic growth through other industries’ direct or indirect effects (e.g. construction, trade, telecommunications, transportation); Nonthapot (2016) considered tourism contribution to economic growth in the broader Greater Mekong Sub-region; and Harb and Bassil (2019) related terrorism impacts on tourism arrivals, economic growth and the stock performance. Finally, Chulaphan and Barahona (2018) pointed out that tourism development and economic growth in Thailand complement each other and are interdependent.
With all the above considerations, this study aims to investigate nonlinear relationship between Thailand’s inbound tourism growth and expected economic growth. Moreover, our proposed methodology is able to capture how extreme events influence their dynamic dependencies, and examines the linear and nonlinear causality relationship. The other objective of this paper is to put forward policy suggestions for the Thai government to restore tourism in the post-COVID-19 epidemic period.
The contributions of our study are as follows: the first and main contribution of the article is to measure the dynamic dependence between tourism and expected economic growth considering the nonlinear characteristics of these variables. We examine Thailand’s inbound tourism growth and expected economic growth with monthly frequency over the period January 2004 to December 2019. We employ the time-varying copula-based Autoregressive Moving Average with exogenous variables (ARMAX)-GJR-GARCH. In fact, we find that the relationship between tourism and expected economic growth is dynamic and nonlinear. The second contribution is that we also study linear and nonlinear Granger causality between the above variables. Thereby, we further reveal the tourism-economic growth relationship. Third, following Santamaria and Filis (2019), we also considered the influence of extreme events (i.e. global financial crisis (GFC), Thai floods, Thai coup and China-United States trade conflicts). Moreover, in our proposal, we used Google Trends data instead of dummy variables to represent these events. Finally, it is worth mentioning that Santamaria and Filis (2019)’s novel research focused on Spain, a mature tourism destination. Our empirical analysis considers Thailand, an emerging star in terms of tourism, which presents an interesting behaviour. During the last 15 years, inbound tourism to Thailand grew at a high average rate, but it is also characterized by remarkable volatility in terms of arrivals and on the relative weight of the main origin markets (Untong et al., 2014).
Compared with previous studies with a similar research focus, such as Santamaria and Filis (2019) and Pan and Dossou (2020), the novelty of this paper is to explore the nonlinear dynamic correlation between tourism and economic growth rather than the long-term and short-term relationship, which helps enrich and further clarify the theoretical relationship between tourism and economic growth. To the best of our knowledge, panel smooth transition-VAR/VECM is a mainstream econometric model to explore nonlinear causal relationship between tourism and economic growth (Wu et al., 2021). In this sense, the second novelty of this study is that we firstly make use of copula nonlinear Granger causality test to reveal the non-linear causal relationship between tourism and economic expectation. Another feature of this paper is that we use Google trends data to replace the dummy variables of extreme events, which provides new research ideas for the study of tourism economy.
The rest of the paper is organized as follows: Section 2 presents the methodology, including the copula-based ARMAX-GJR-GARCH model’s specification. Section 3 presents the data, descriptive statistics and some preliminary analyses. Section 4 details the empirical findings. Our last section summarizes the main conclusions and discusses the implications of our research for the economic recovery after COVID-19.
Methodology
In this section, we first introduce the ARMAX-GJR-GARCH model used to estimate the copula’s marginal distribution. Filtering data through ARMAX-GJR-GARCH model can effectively ensure that the marginals meet the condition of independent and identically distributed. This first method is used to capture the volatility of the series, considering the effect of the extreme events in the level equation. Next, the basics of static and time-varying copulas are presented. Copulas are used to measure the co-movement of the tourism and macroeconomic variables allowing for both linear and non-linear relations. We used the Akaike Information Criterion (AIC) to select the best static copula, and then the corresponding time-varying copula is estimated. Finally, the copula nonlinear Granger causality is introduced. We apply this approach to illustrate the Granger causality between the selected variables when we relax the assumption of linear relations, as compared with conventional Granger causality.
ARMAX-GJR-GARCH model
This model is able to deal with heteroscedasticity, volatility clustering, asymmetric effects and the effects of external extreme events. Following Liu et al. (2019) and Elie et al. (2019), the basic form of ARMAX-GJR-GARCH model is expressed as


Here,
The standardized residuals’ marginal distribution
Copulas
Copulas were proposed 60 years ago (Sklar, 1959). According to Sklar’s theorem, a bivariate copula can be expressed as follows

Many previous research (Pérez-Rodríguez et al., 2015; Liu et al., 2019) indicated that socioeconomic data (financial, economic or tourism growth, etc.) are non-normally distributed. If the marginal distribution is misspecified, the dependence structure might be incorrect (Wu et al., 2012). This illustrates that the time-varying copula-GARCH models are more suitable and flexible than the DCC-GARCH models.
The time-varying parameters


Copula nonlinear Granger causality
To further explore the nonlinear relationship between tourism growth and expected economic growth, we also examined its nonlinear causality. To do so, we use Kim et al. (2020), which proposes a copula nonlinear Granger causality (CNGC) approach as a novel method to test for nonlinear causality between two variables.
Following Kim et al. (2020) and Guolo and Varin (2014), first we estimated a Gaussian copula beta regression model. Then, we used the Wald test in CNGC, similarly as with linear Granger causality test (Kim and Hwang, 2017; Kim et al., 2020). Suppose that

That is,
Data, preliminary analysis and descriptive statistics
Data sources
The data set comprises monthly data from January 2004 to December 2019, giving a total of 192 observations. It includes total monthly tourist arrivals to Thailand and its disaggregation for the 10 main origin countries in 2019 (China (CN), Malaysia (MY), Korea (South) (KR), Laos (LA), Japan (JP), Russia (RUS), India (IN), Vietnam (VIE), Singapore (SG) and United States of America (USA)) provided by Thomson Reuters DataStream. These countries accounted for 66.52% of arrivals to Thailand in 2019 (Ministry of Tourism and Sports, 2019). Economic prospects are captured by Thailand’s government bond yield, given by the Thai Bond Market Association.
Following Santamaria and Filis (2019), the focus of this paper is on the link between tourism and expected (rather than current) macroeconomic conditions. The term structure of interest rate (TSIR) can be used as a proxy for expected macroeconomic prospects (Santamaria and Filis, 2019). It is defined by the difference between 10-years and 3-months government bond yields (Estrella and Hardouvelis, 1991). When the economic outlook is prosperous (uncertain or under recession), TSIR is typically positive (negative). A zero TSIR indicates that the economy is going through a transitional phase in the economic cycle from growth and expected increase in inflation to recession, and vice versa (Santamaria and Filis, 2019).
We incorporate four extreme events (the 2007–2008 financial crisis, the 2011 Thai floods, the 2014 and 2016 Thai coups and the China-United States trade conflict since 2018) using Google Trends data. We used data from Google trends as a continuous variable corresponding to the extreme events.
Tourist arrivals and term structure of interest rate in Thailand
In order to avoid deterministic seasonal behaviour, and capture the long-term trend of tourist arrivals, we used the twelfth month (year on year) difference in the logarithms of tourist arrivals data following Bartolomé et al. (2009). The transformed series of tourist arrivals to Thailand, after removing seasonality, are plotted in Figure 1. The series shows high volatility during the sample period. It is worthy to note that there are sharp decreases in total tourist arrivals to Thailand during the periods of the global financial crisis of 2007–2008, Thai floods in 2011 and Thai coups in 2006 and 2014. In addition, we also observe a decline in tourist arrivals from most origin countries in 2017. No control variables have been included for this time period, given the temporal overlap of several events in 2017, such as bombings in several places from April to June, the political turmoil, and the period of national mourning. Twelfth month difference tourist arrivals. Note: The solid dark colour line denotes the tourist arrivals during extreme events period.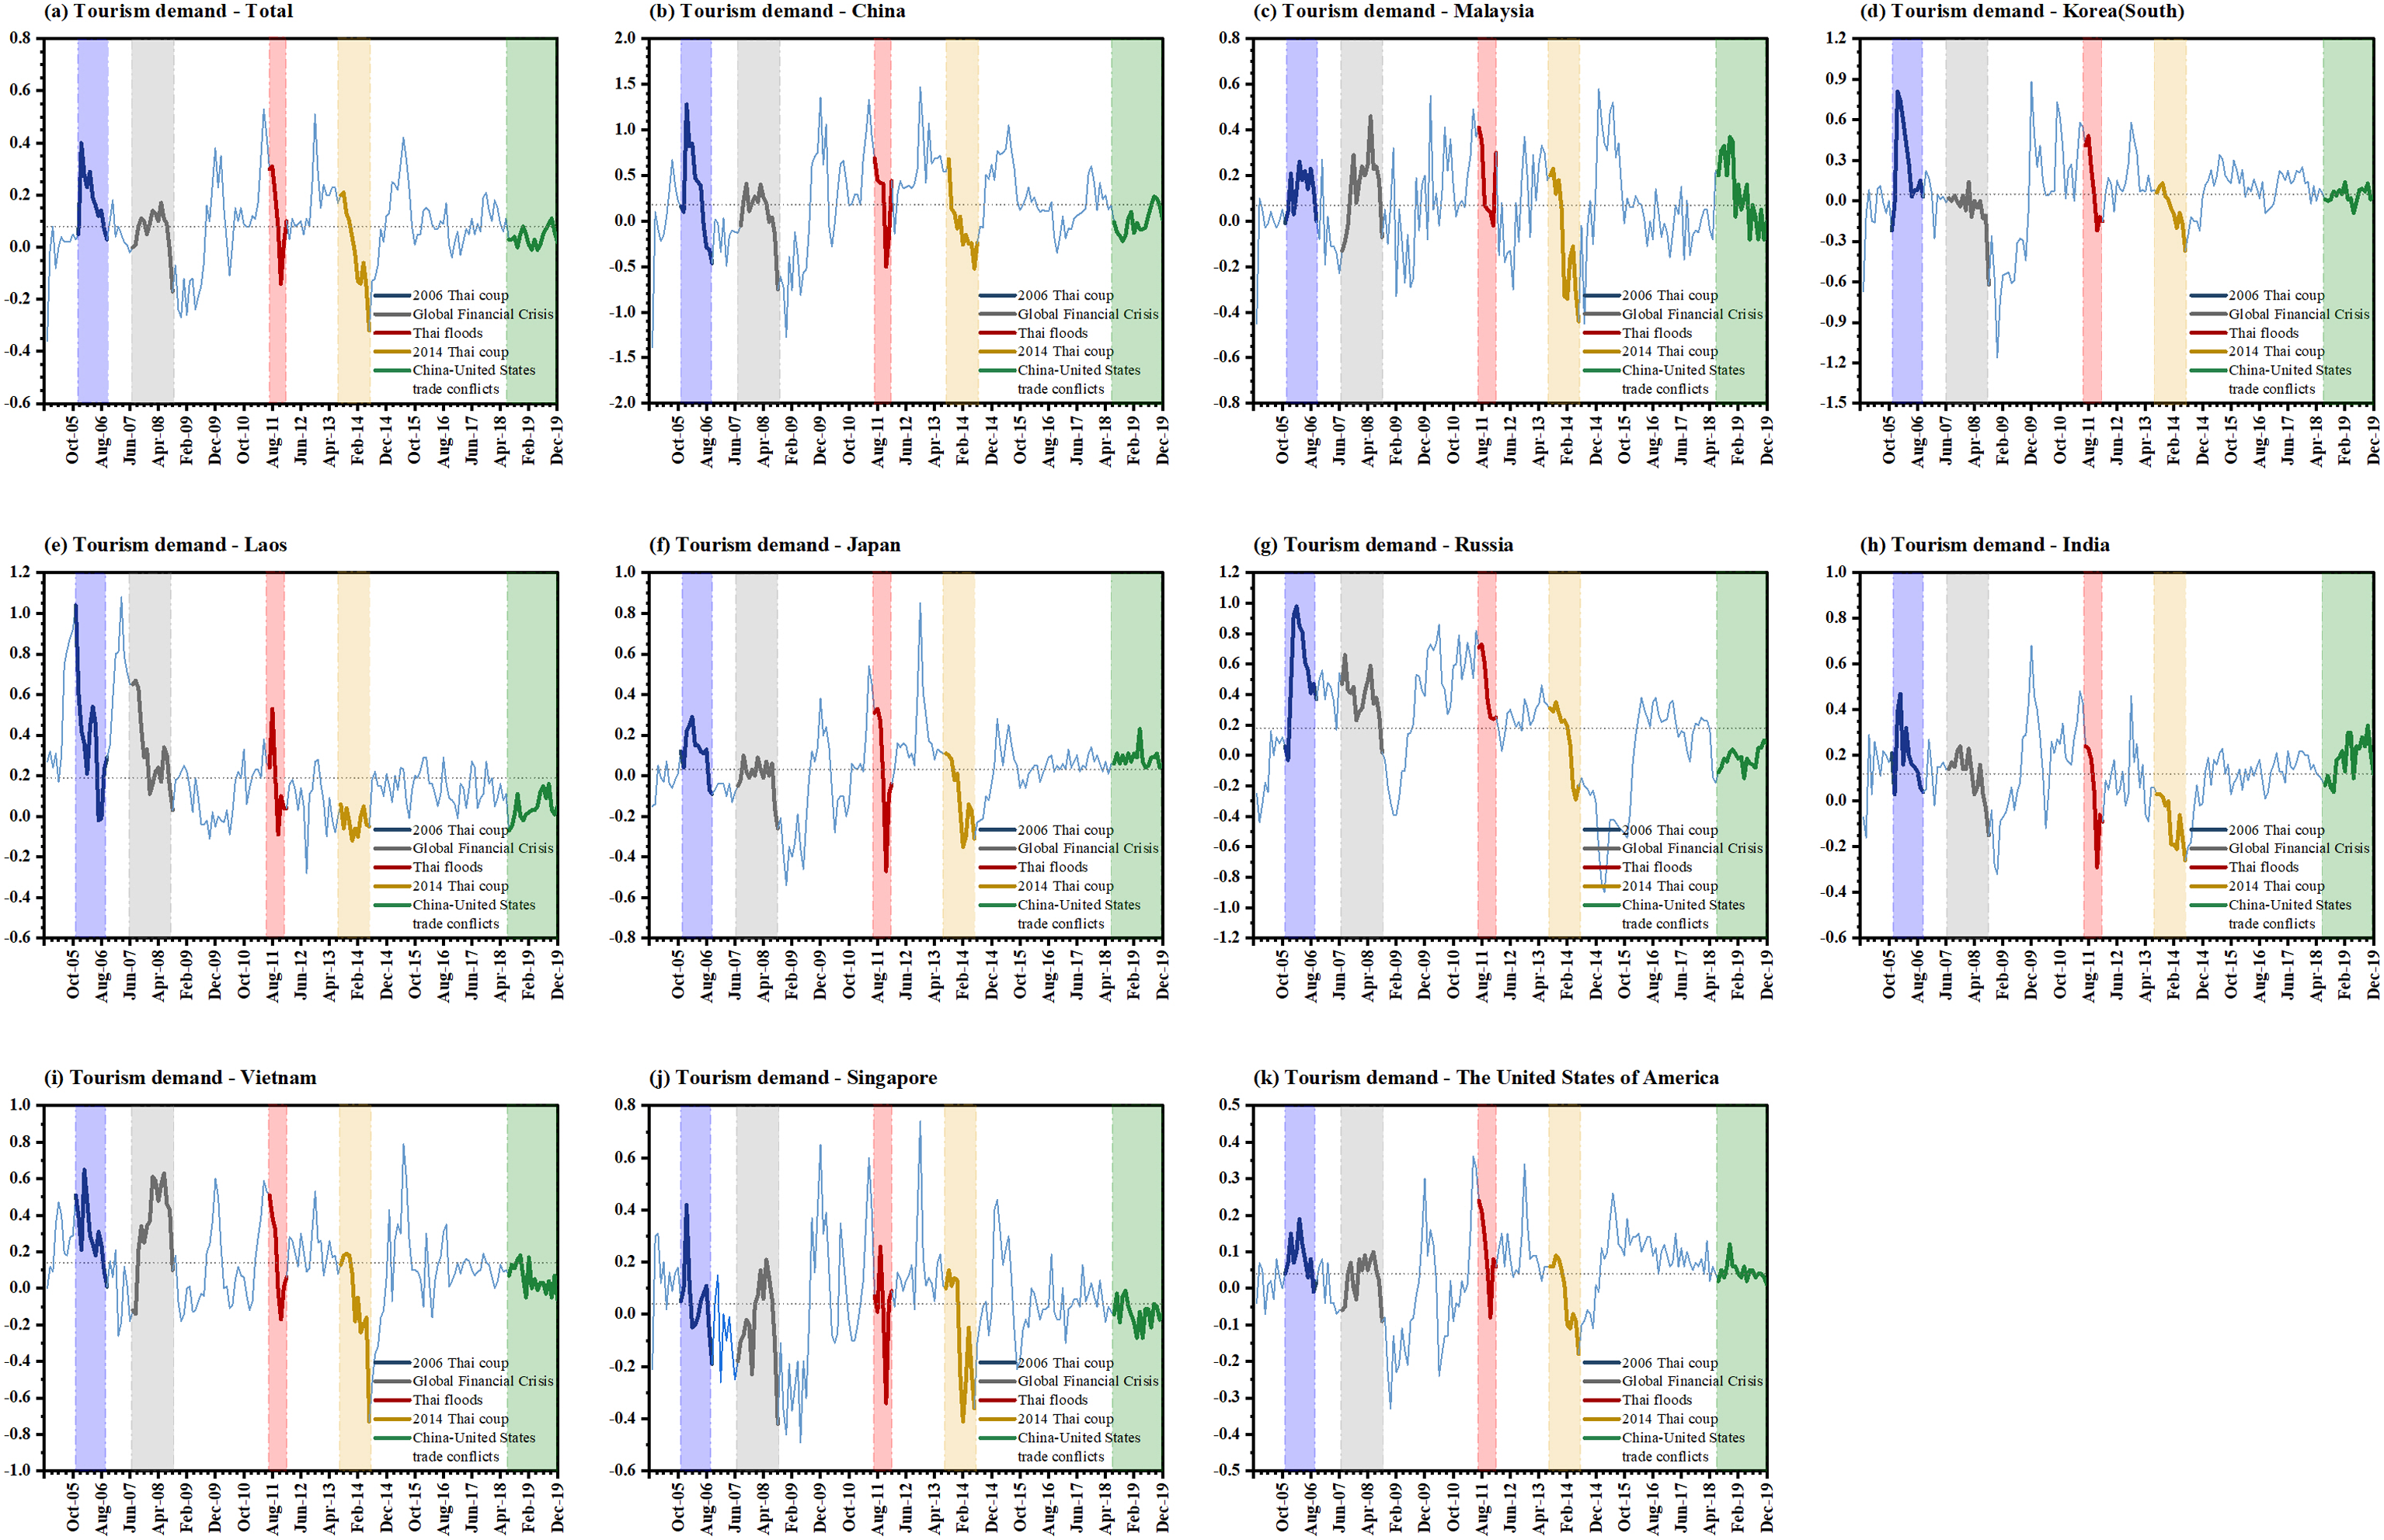
To preserve data consistency and stability, the TSIR data were also transformed by the twelfth month difference. Figure 2 plots both the original term structure of interest rate (blue solid line) and transformed series (red solid line). A noteworthy point in Figure 2 is that the transformed term structure of interest rate increased dramatically between January 2007 and June 2008, then decreased until January 2009 and peaked at the end of 2009. In this period, the TSIR trends in Thailand moved in a similar way to that of Japan and Spain (Hattori, 2018; Santamaria and Filis, 2019). As indicated by Hattori (2018), the financial crisis obviously affected the bond markets. In 2007, during the pre-financial crisis, the investor sentiment had a positive impact on long-term stock-bond correlations (Fang et al., 2018). For Thailand, during the first half of 2008, the market became more concerned about high inflation and a tight monetary policy of raising interest rates was adopted, which led to an upward trend in bond yield. In the second half of the year, due to the economic slowdown and continued decline in oil prices, the government bond yields fell in tandem with investors’ expectations. The global risk aversion also caused investors to divert their investments from the stock market to a more risk-resistant bond market. It also led to the decline in government bond yields, and impacted the TSIR (BOT, 2009). Thailand term structure of interest rate levels versus twelfth month difference. Note: The blue and red lines represent the TSIR and transformed TSIR, respectively. The solid dark red line denotes the extreme events, which are the 2006 Thai coup, the 2007–2008 financial crisis (GFC), the 2011 Thai floods, the 2014 Thai coup and the China-United States conflicts (trade conflicts).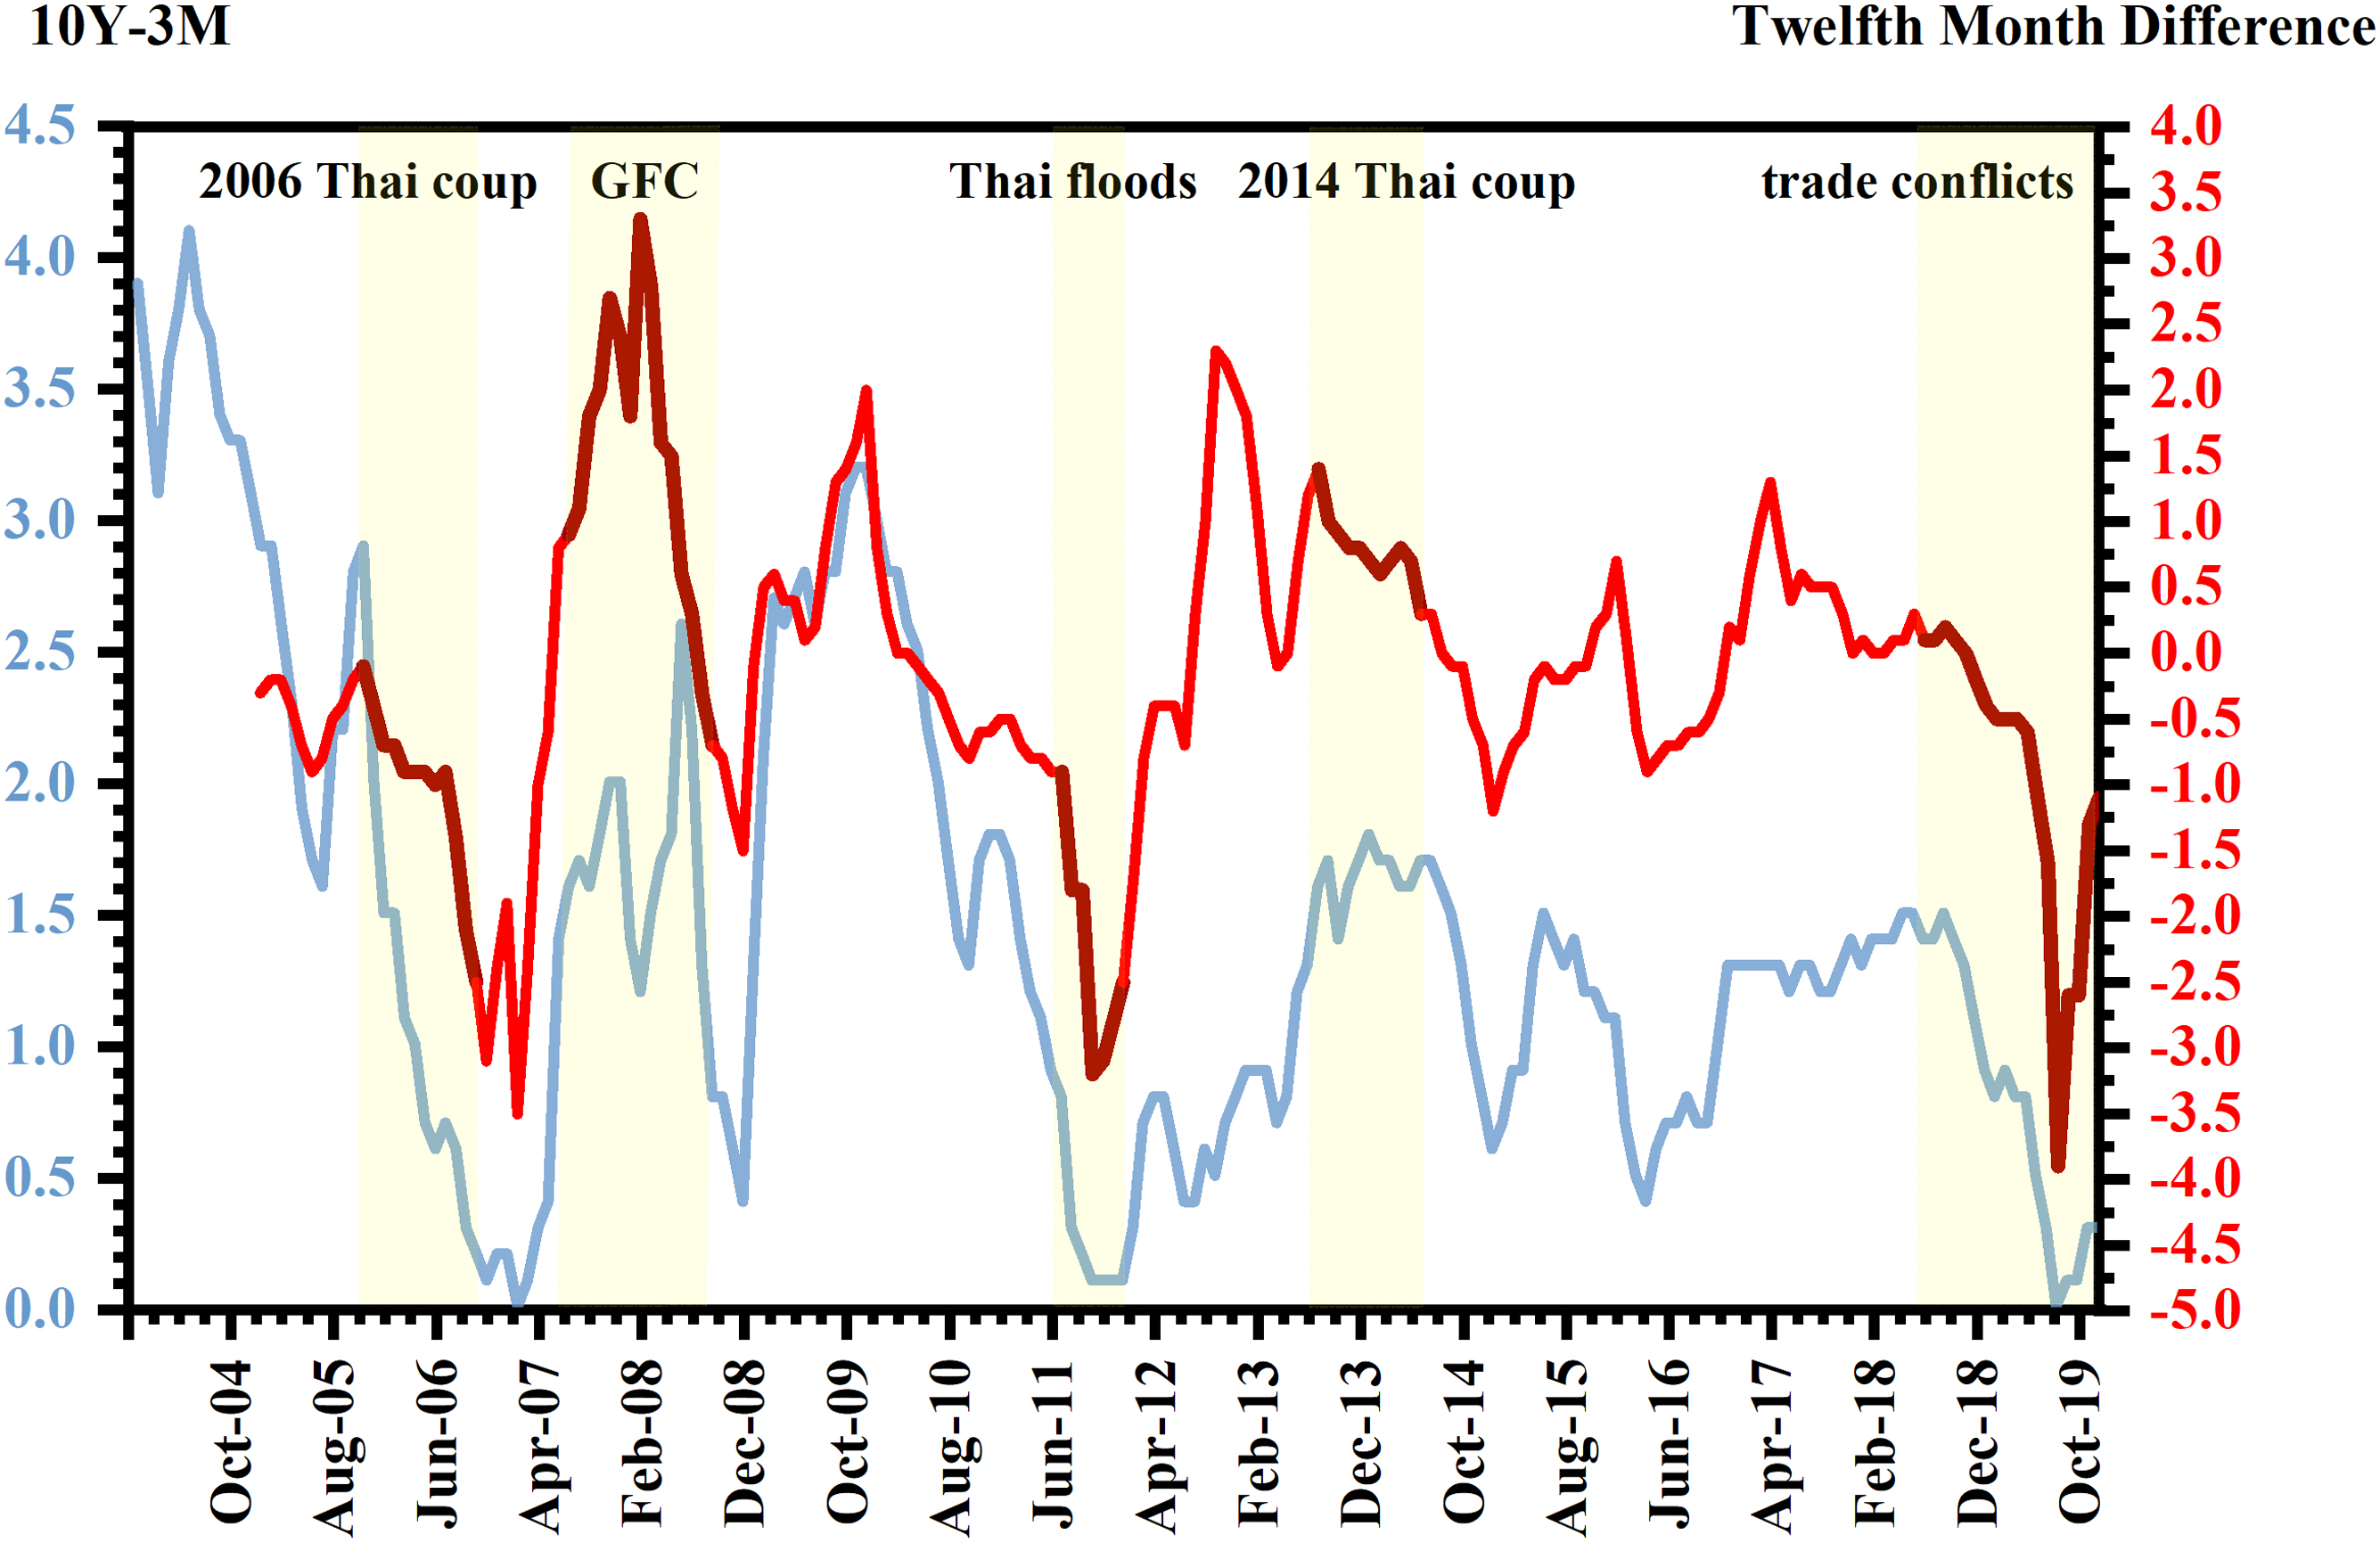
Empirical results
Marginal model estimates
ARMAX-GJR-GARCH(1,1) model estimates with control variables.
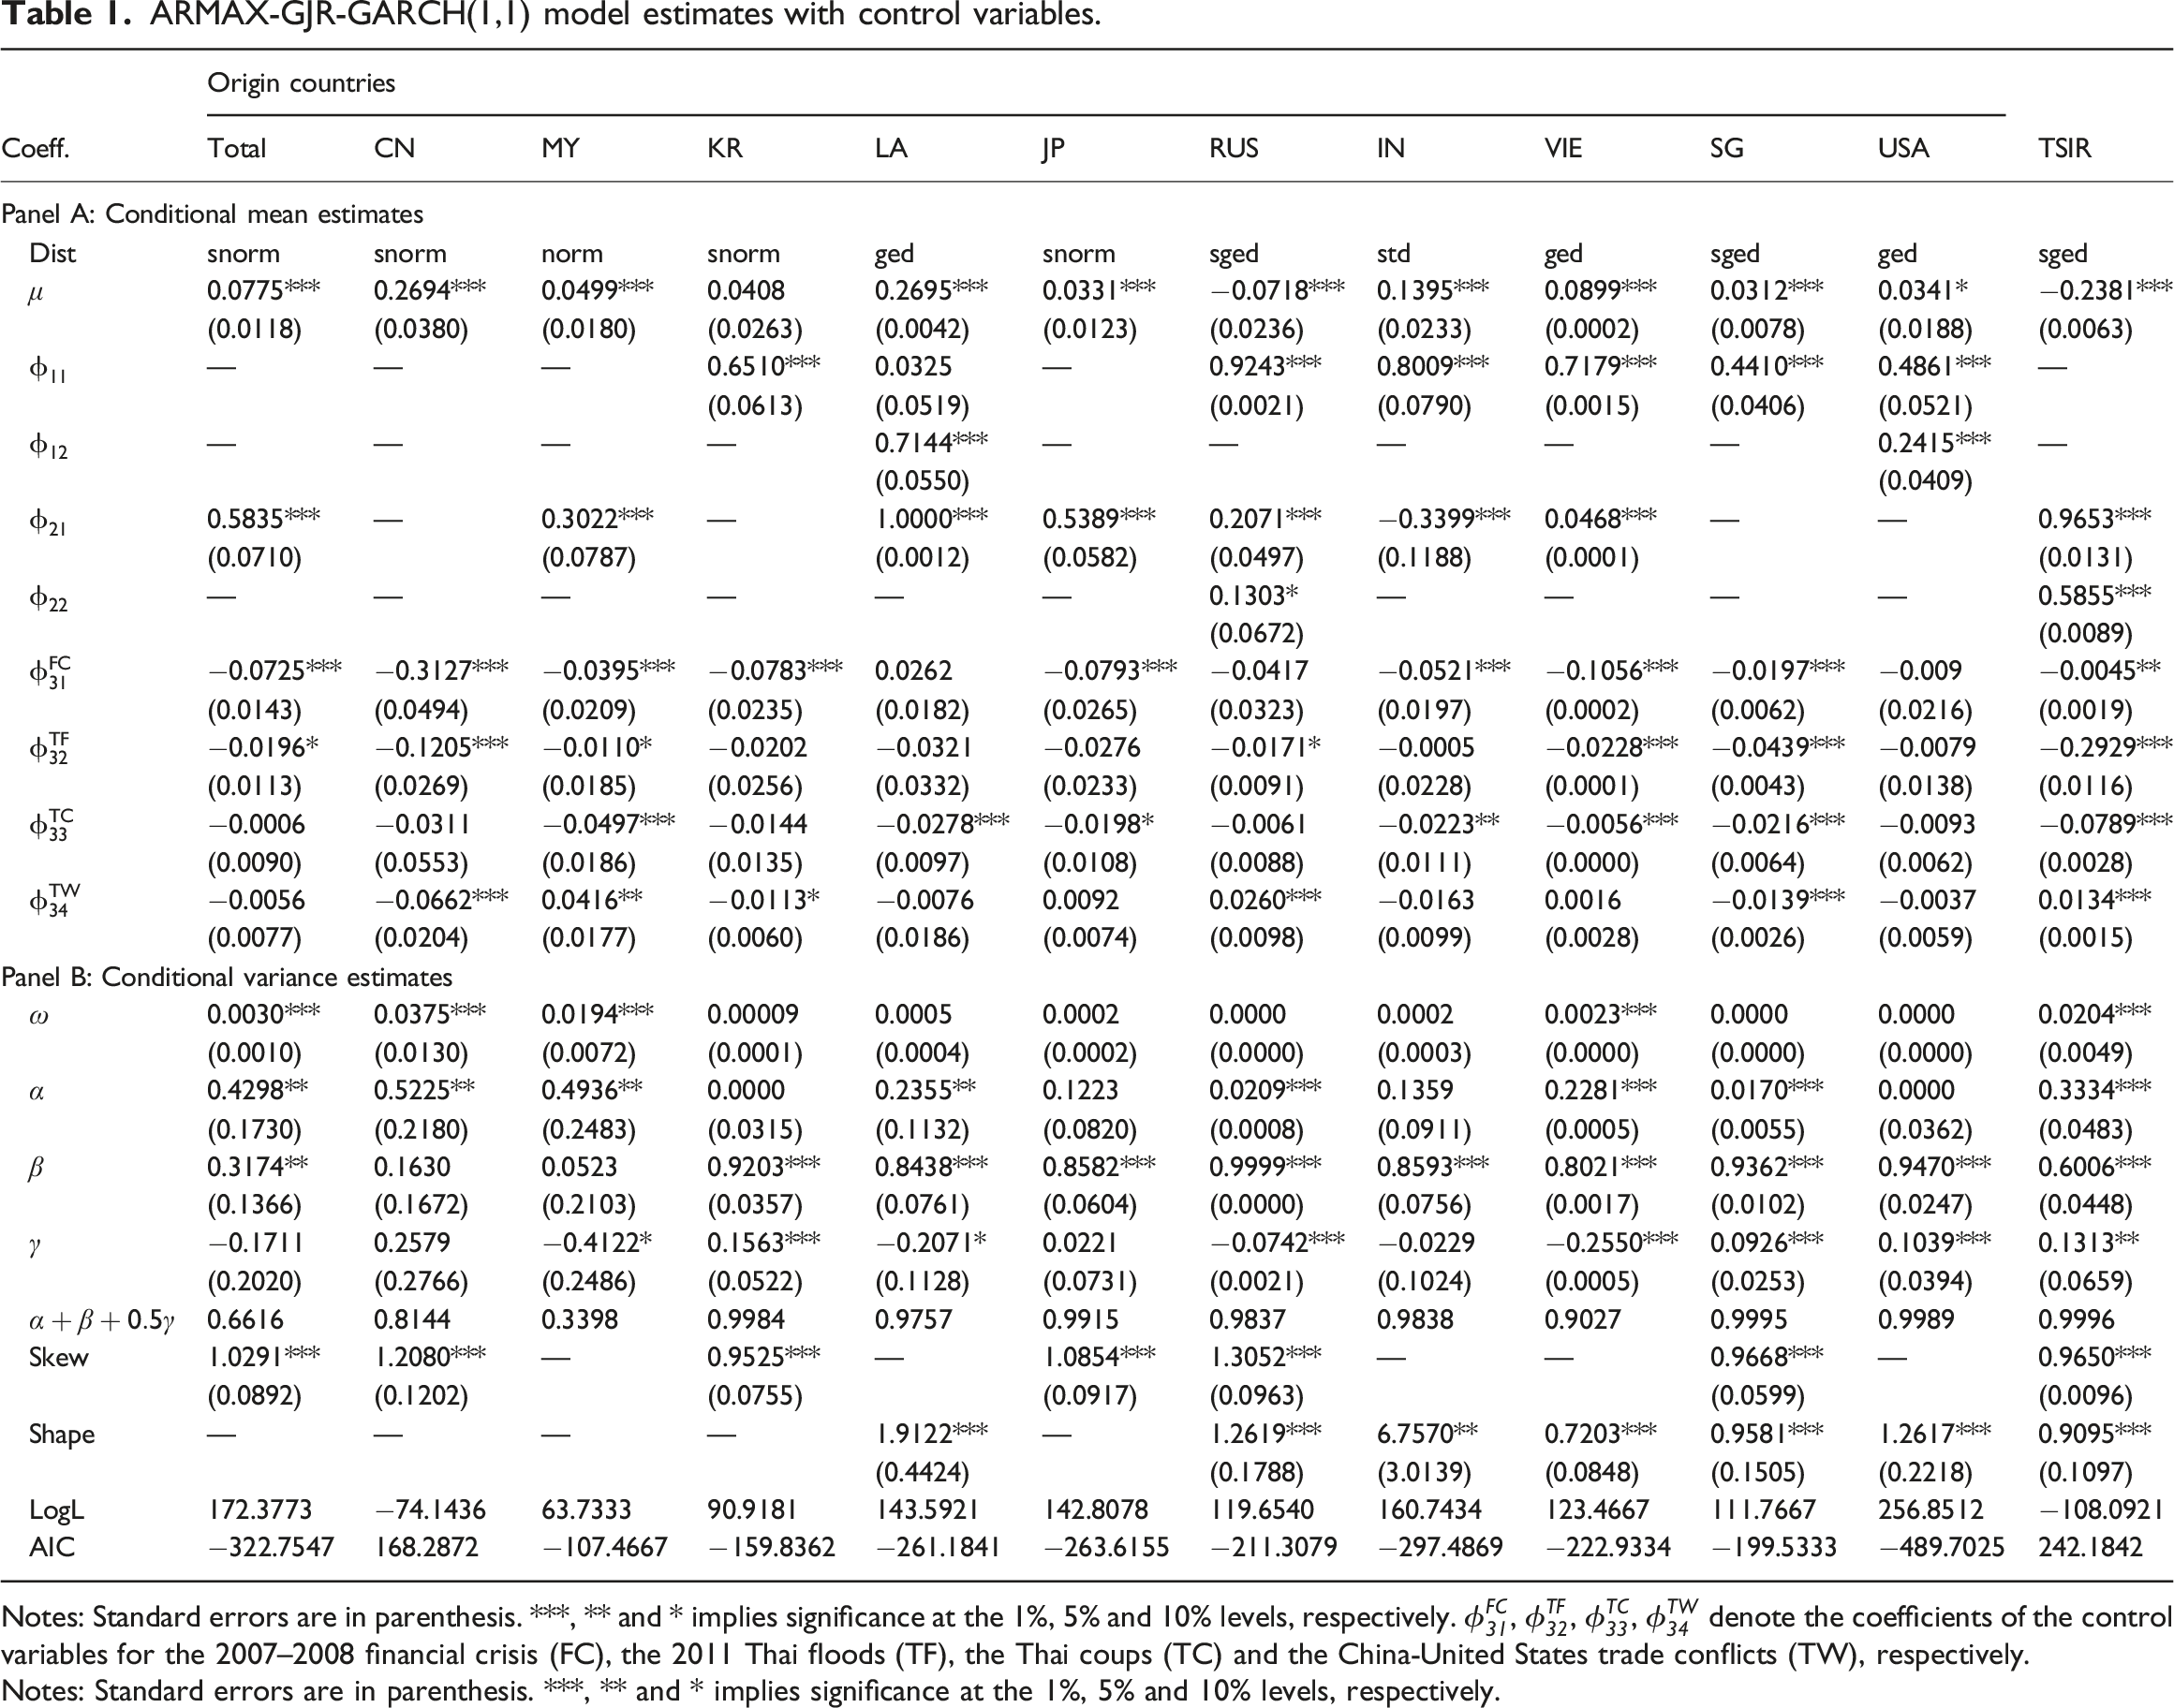
Notes: Standard errors are in parenthesis. ***, ** and * implies significance at the 1%, 5% and 10% levels, respectively.
Notes: Standard errors are in parenthesis. ***, ** and * implies significance at the 1%, 5% and 10% levels, respectively.
Regarding the TSIR results, TSIR decreased during the financial crisis, Thai floods, and the Thai coup. These shocks to the TSIR are sourced by monetary policy and investor sentiment (Fang et al., 2018). The statistically significant and negative effect of the 2014 Thai coup, is attributable to the continued accommodative monetary policy, and uncertainty on the timing of the Federal Reserve’s policy rate hike (BOT, 2015).
Panel B of Table 1 presents the variance equation’s results of the ARMAX-GJR-GARCH models for all tourism source markets and the expected economic growth.
Time-varying copulas estimates
Estimation results for time-varying copulas.
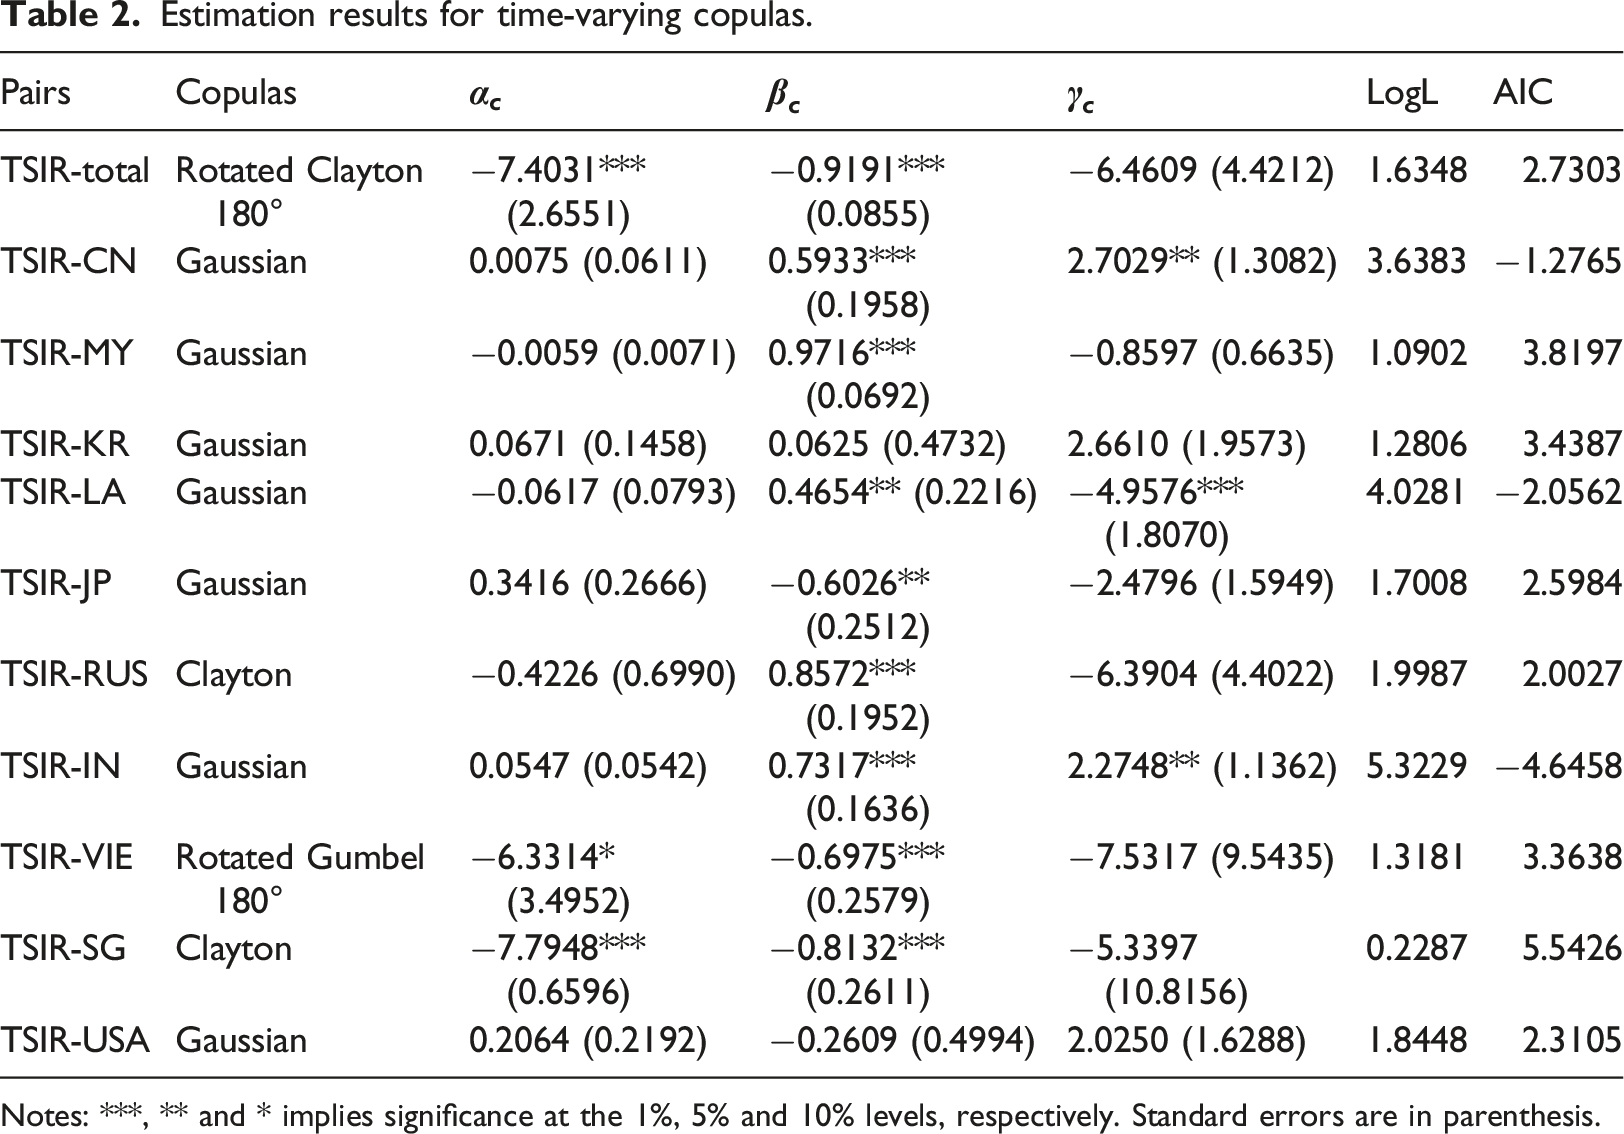
Notes: ***, ** and * implies significance at the 1%, 5% and 10% levels, respectively. Standard errors are in parenthesis.
Dynamic dependence
Figure 3 (a)–(i) illustrates the time-varying Kendall’s Time-varying Kendall’s 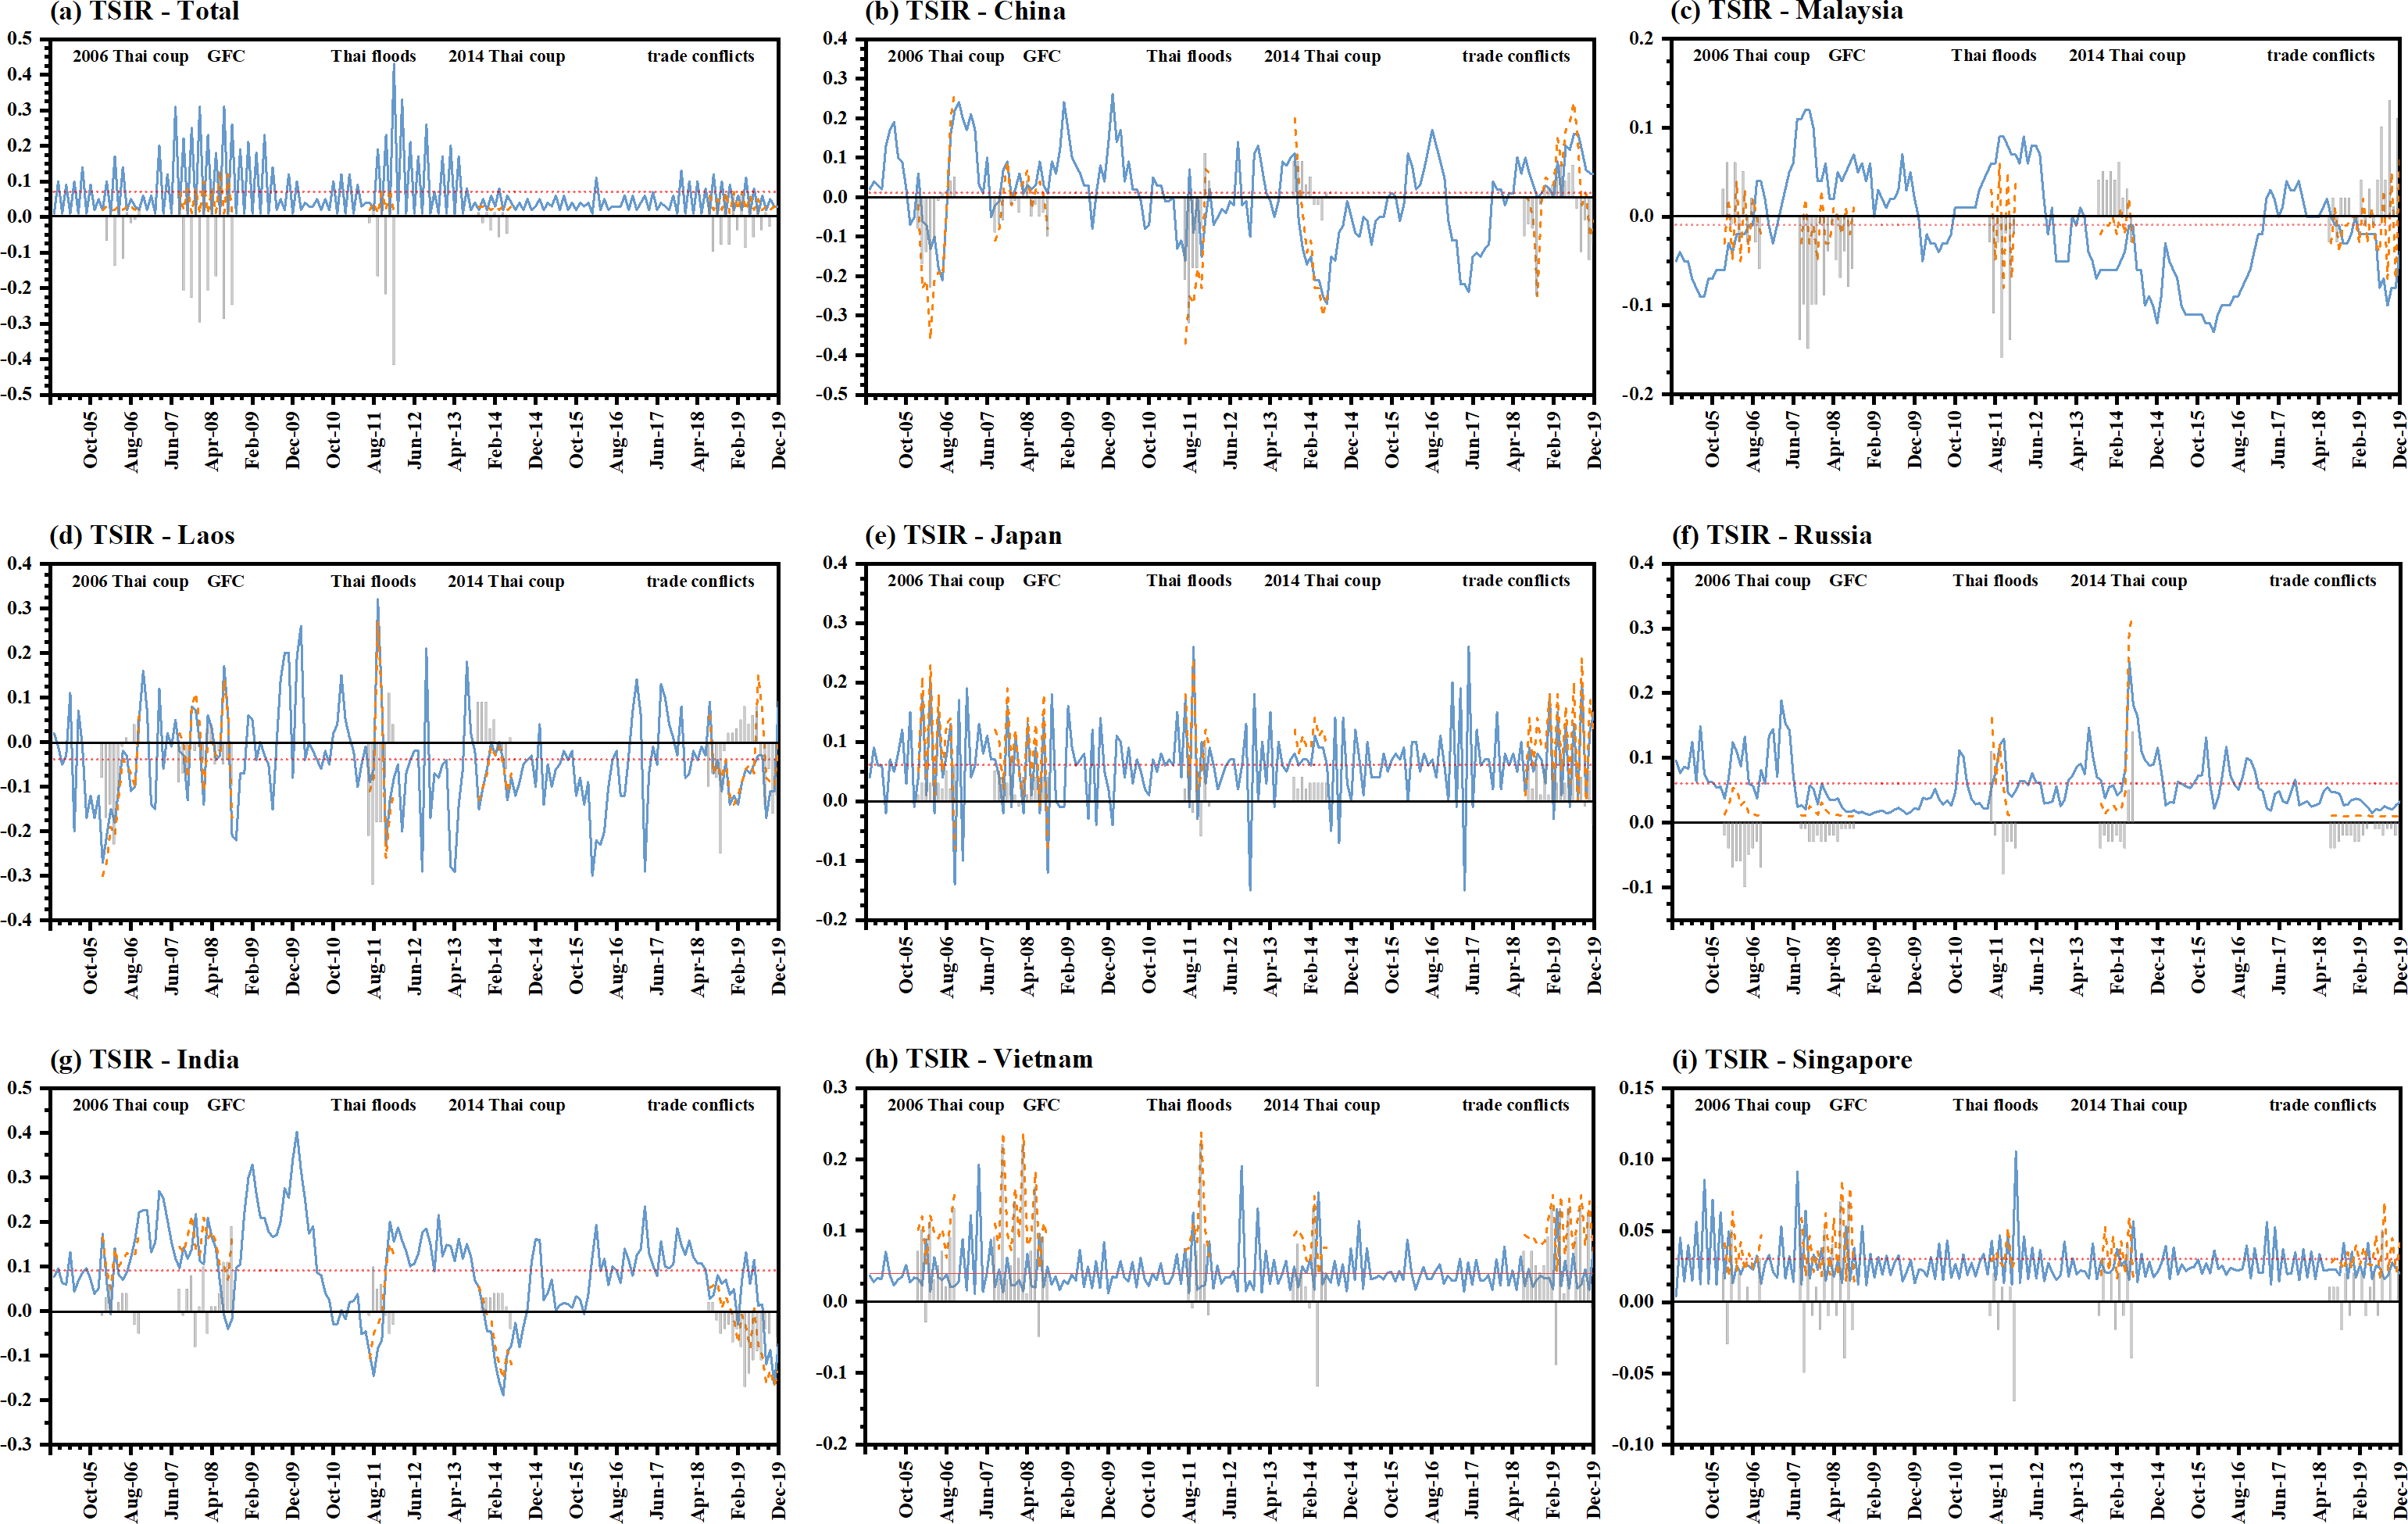
Figure 3(a) displays the time-varying positive dependence that characterizes the relation between Thailand’s TSIR and total inbound tourism. This finding shows that there is a consistent co-movement between these two series. The improvement (deterioration) of expected economic growth leads to the vigorous development (depression) of arrivals, and the tourism industry prosperity (depression) may also cause rapid (regressive) economic growth. The positive tourism-economic growth dependence reflects a benign development relationship between the tourism industry and economic development. Moreover, especially during the financial crisis and flood, the tourism-economic growth dependence is higher than for other periods. In these two periods, it is obvious that Thailand’s interest rate spread has narrowed, and its economic expectation has deteriorated. The income decline caused by the financial crisis, the tourism resources’ destruction, or the inconvenient transportation caused by the flood produced an inbound tourism decline (Song et al., 2012). During the coup, Thailand’s economic expectations were relatively poor, while the tourism industry still maintained a volatile growth momentum. This is the reason why the tourism-growth relationship becomes weaker at this stage.
Figure 3(b) shows the time-varying dependence of the TSIR-China pair. The dependence fluctuates between −0.25 and 0.25, but it is positive most of the time. In general, negative dependence appears in 2006, 2011–2012, 2014–2015 and 2017. During these periods, the expected economic growth declined, while Chinese tourist arrivals remain strong. In order to improve the expected economic downturn, the Thai government implemented exemption of tourist visa fee policies in 2010 (Royal Thai Embassy in London, 2009), e-visa and Visa upon Arrival in 2014 (Ministry of Foreign Affairs, 2014).
The dynamic relationship between Malaysia’s arrivals and Thailand’s economy is presented in Figure 3(c). These are neighbouring countries that belong to ASEAN. Therefore, tourism between them is very convenient. Generally speaking, in the three-time periods of 2005–2006, 2013–2016 and 2018–2019, the relationship is negative, while it is positive for the other periods. The reason for the negative dependence is that during these extreme events, Thailand’s economic prospect deteriorated significantly, while tourist arrivals from Malaysia maintain a good growth trend as a whole. This also implies that inbound tourism growth from Malaysia cannot significantly improve the Thai economy outlook. The relationship between Laos/India and TSIR is similar to that of Malaysia (see Figure 3(d) and 3(g)), especially the time period of negative correlation is consistent with that of Malaysia. Figure 3(e) indicates that the relationship between Japanese arrivals and Thailand’s economic growth is quite different from that of other source countries. It is characterized by higher volatility, and an unclear pattern.
Finally, Figure 3(f), 3(h) and 3(i) also shows a positive time-varying correlation between the expected economic growth of Thailand and inbound tourism growth from Russia, Vietnam and Singapore, and the dependence fluctuates between 0 and 0.2. It is not difficult to find that the dependence of three pairs (TSIR-Russia, TSIR-Vietnam and TSIR-Singapore) was higher during Thai coup. During this event, Thailand’s expected economic growth declined, and the uncertainty led to a rapid decline in arrivals, these facts explain that the dependence of three pairs became stronger during the Thai coup period. Due to the inordinate threat to Thailand’s tourism industry and economy from the Thai coup, the Tourism Authority of Thailand to issue a note on its website in 2015 for assurance of security upgrades in the capital of Thailand, just to win the confidence of foreign tourists (Beirman, 2015). Vietnam and Singapore, as neighbouring countries of Thailand, are more susceptible to the policy attraction and influence, and thus the rebound of tourist confidence in neighbouring countries is very obvious, while the impact of the shock on Russia is for a long time. To sum up, the impact period of Thai coup on Vietnam and Singapore is short-term, while the impact on Russia is relatively a longer period of time.
Extreme events’ influence and non-linear causality
The grey bars in Figure 3 show the impact of extreme events on the tourism-economic growth dependence, and represent the difference between dashed orange and solid blue lines. The longer the grey bars, the more influential are extreme events. We can conclude that the five events affected the tourism-economic growth co-movement, but the impact is different for each origin country and event. The grey bars in Figure 3(a) are negative and the values are quite big (in absolute terms) for the GFC and the Thai flood. This shows these extreme events have weakened the relationship between total tourism and TSIR. Considering the impact on the Chinese market displayed in Figure 3(b), the 2006 coup, the floods and the China-US trade conflicts, had greater impact on the arrivals-economy relationship. While the GFC and 2014 Thai coup did not have much effect. In Figure 3(c), the dashed orange line is around zero, which implies that the extreme events weakened the dependence between tourist arrivals from Malaysia and TSIR. As we mentioned, tourist arrivals from Malaysia were not much affected by these events, but expected Thailand’s expected economic growth obviously became worse. The short grey bars of Figure 3(d) and 3(e), indicate that the tourism-economic growth dependence from Japan and Laos, were not much affected by extreme events. In Figure 3(f), most grey bars are short and negative, indicating that the extreme events weakened the dependence between TSIR-Russian tourism, but arrivals were not greatly affected by the events. In contrast, most grey bars are positive and large (in absolute terms) during the 2006 Thai coup and GFC period in Figure 3(g), which indicate that these two events have a greater impact on the relation of TSIR-India, while the trade conflict weakened this relation. Finally, similar to Laos and Japan, the short grey bars suggest that the dependencies of TSIR-Vietnam and TSIR-Singapore were not severely affected by the extreme events.
Linear and nonlinear causality tests for inbound tourism demand and expected economic growth.
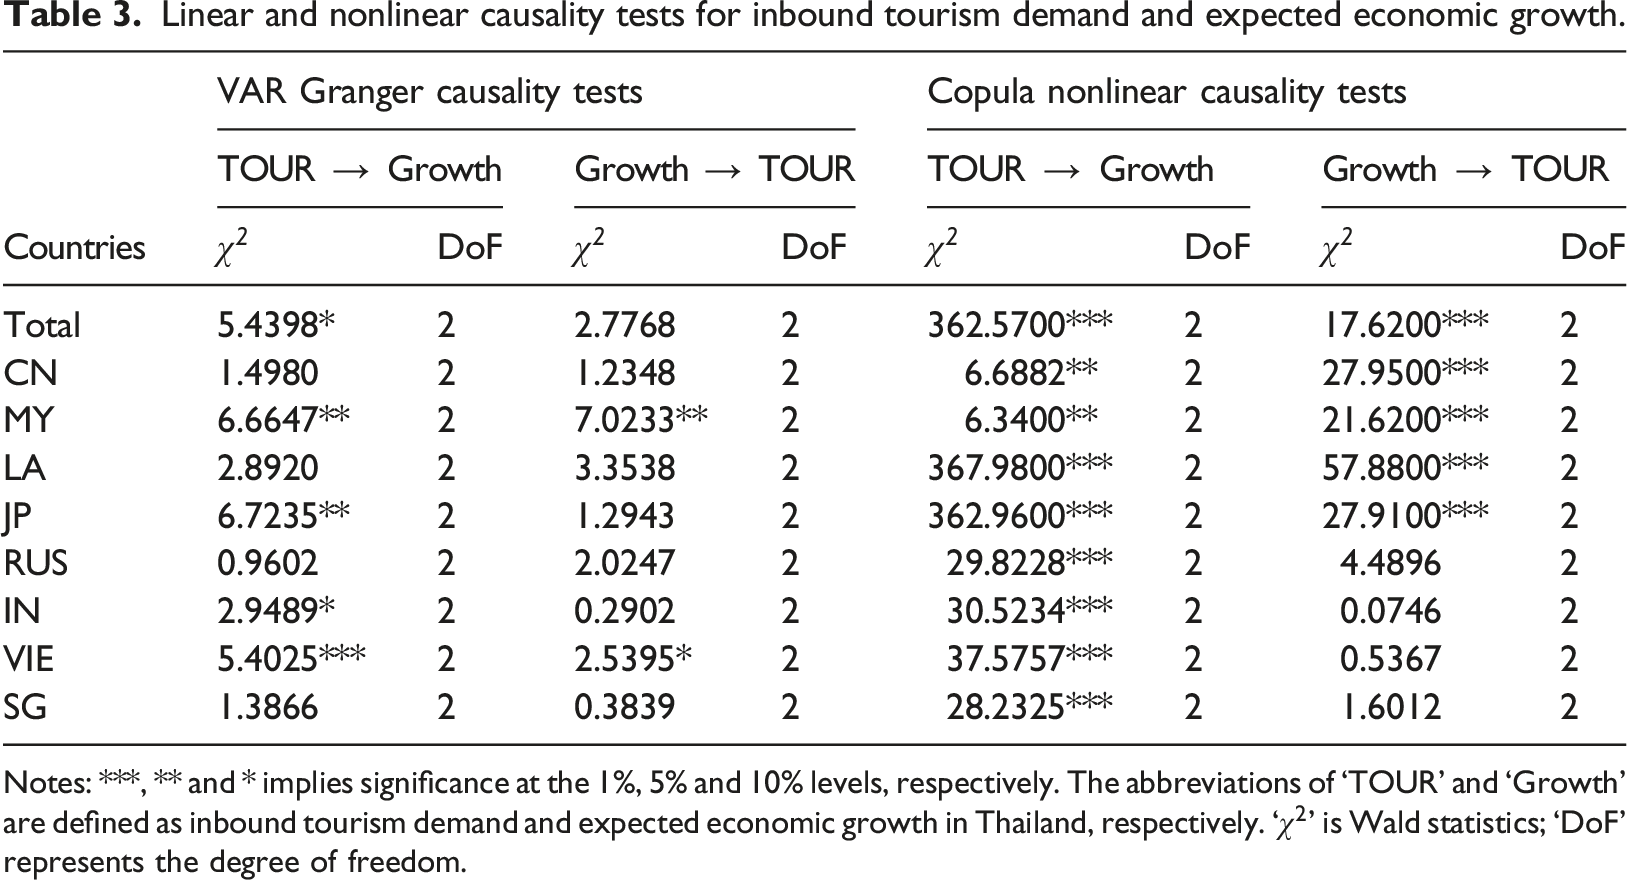
Notes: ***, ** and * implies significance at the 1%, 5% and 10% levels, respectively. The abbreviations of ‘TOUR’ and ‘Growth’ are defined as inbound tourism demand and expected economic growth in Thailand, respectively. ‘
From the methodological perspective, AIC is performed to select the optimal lag length in VAR and Gaussian copula Beta regression to guarantee the meaningful causality relationship. The causality is subjected to the Wald coefficient test and pairwise Granger causality test to establish if the causal relationship among the variables can be inferred and if any, to establish its direction.
The results of Table 3 (left part) indicate that there exists linear Granger-causality from arrivals to TSIR for total, Japanese, Indian arrivals, a bi-directional linear Granger-causality for Malaysia and Vietnam and no linear Granger-causality for China, Laos, Russia and Singapore. Our previous analysis proved that the relationship between tourism and economic growth is not stable. Therefore, it seems reasonable that the analysis does not reach a common agreement.
In this sense, depending on different dynamics, such as the economic structures, initial conditions, sectoral interrelations and historical background of the countries, the relationship may vary. Hence, causality studies could support different tourism-led growth hypotheses, even for the same sample (Tugcu, 2014).
The right part of Table 3 presents the result of the copula nonlinear Granger-causality tests. From our analysis, we can conclude that TSIR and inbound tourism growth from global, China, Malaysia, Laos and Japan have a bi-directional copula nonlinear Granger-causality relation. Therefore, the bi-directional nonlinear Granger-causality evidence supports the EDTG and TLEG hypotheses. And, the TSIR and inbound tourism growth from Russia, India, Vietnam and Singapore have a unidirectional copula nonlinear Granger-causality relation, which indicates that the unidirectional copula nonlinear Granger-causality relation provides empirical evidence to support the TLEG hypothesis.
Further analysis during COVID-19 pandemic
In the analysis of extreme events, we have found that financial crisis, political turmoil, floods and other events can weaken the relationship between tourism and economic growth. During the COVID-19 pandemic, the tourism-economic growth relationship is almost independent, as shown in Figure 4. Figure 4 presents Thailand term structure of interest rates versus tourist arrivals from all over the world and 10 main origin countries. The solid line indicates the number of tourist arrivals from January 2019 to December 2021, and the dashed line indicates Thailand term structure of interest rate. It is easily found that the number of tourist arrivals was zero for 6 months due to the border closure policy. Since October 2020, when Thailand reopened its borders, the trend of tourist arrivals has rebounded slowly. However, there are still restrictions on tourism, such as travel restrictions on international travel, a mandatory 14-days quarantine for international travellers and social distancing. The long-term convergence of the number of tourist arrivals to zero reflects the impact of COVID-19 outbreak on the operation of the tourism sector. During this period, the term structure of interest rate rose slowly and gradually reached the level in 2018. As tourist arrival virtually dropped to zero, there is no correlation between tourism and expected economic growth during the COVID-19 pandemic period. On the other hand, the figures show that people have better economic expectations after the COVID-19 pandemic. In view of the experience of other extreme events, formulating feasible economic policies can be considered as the most effective countermeasure to restart tourism and restore the economy. Henseler et al. (2022) points out that tourism expansion can be initiated by economic policies. The Thai government could consider supporting the tourism industry with financial assistance to enhance its recovery efforts with measures such as free vaccinations and tests for national citizens or tourists, thus increasing the confidence of foreign visitors to make travel decision. Thailand term structure of interest rate levels versus tourist arrivals from all over the world (Global) and 10 main origin countries (China, Malaysia, Korea (South), Laos, Japan, Russia, India, Vietnam, Singapore and United States of America).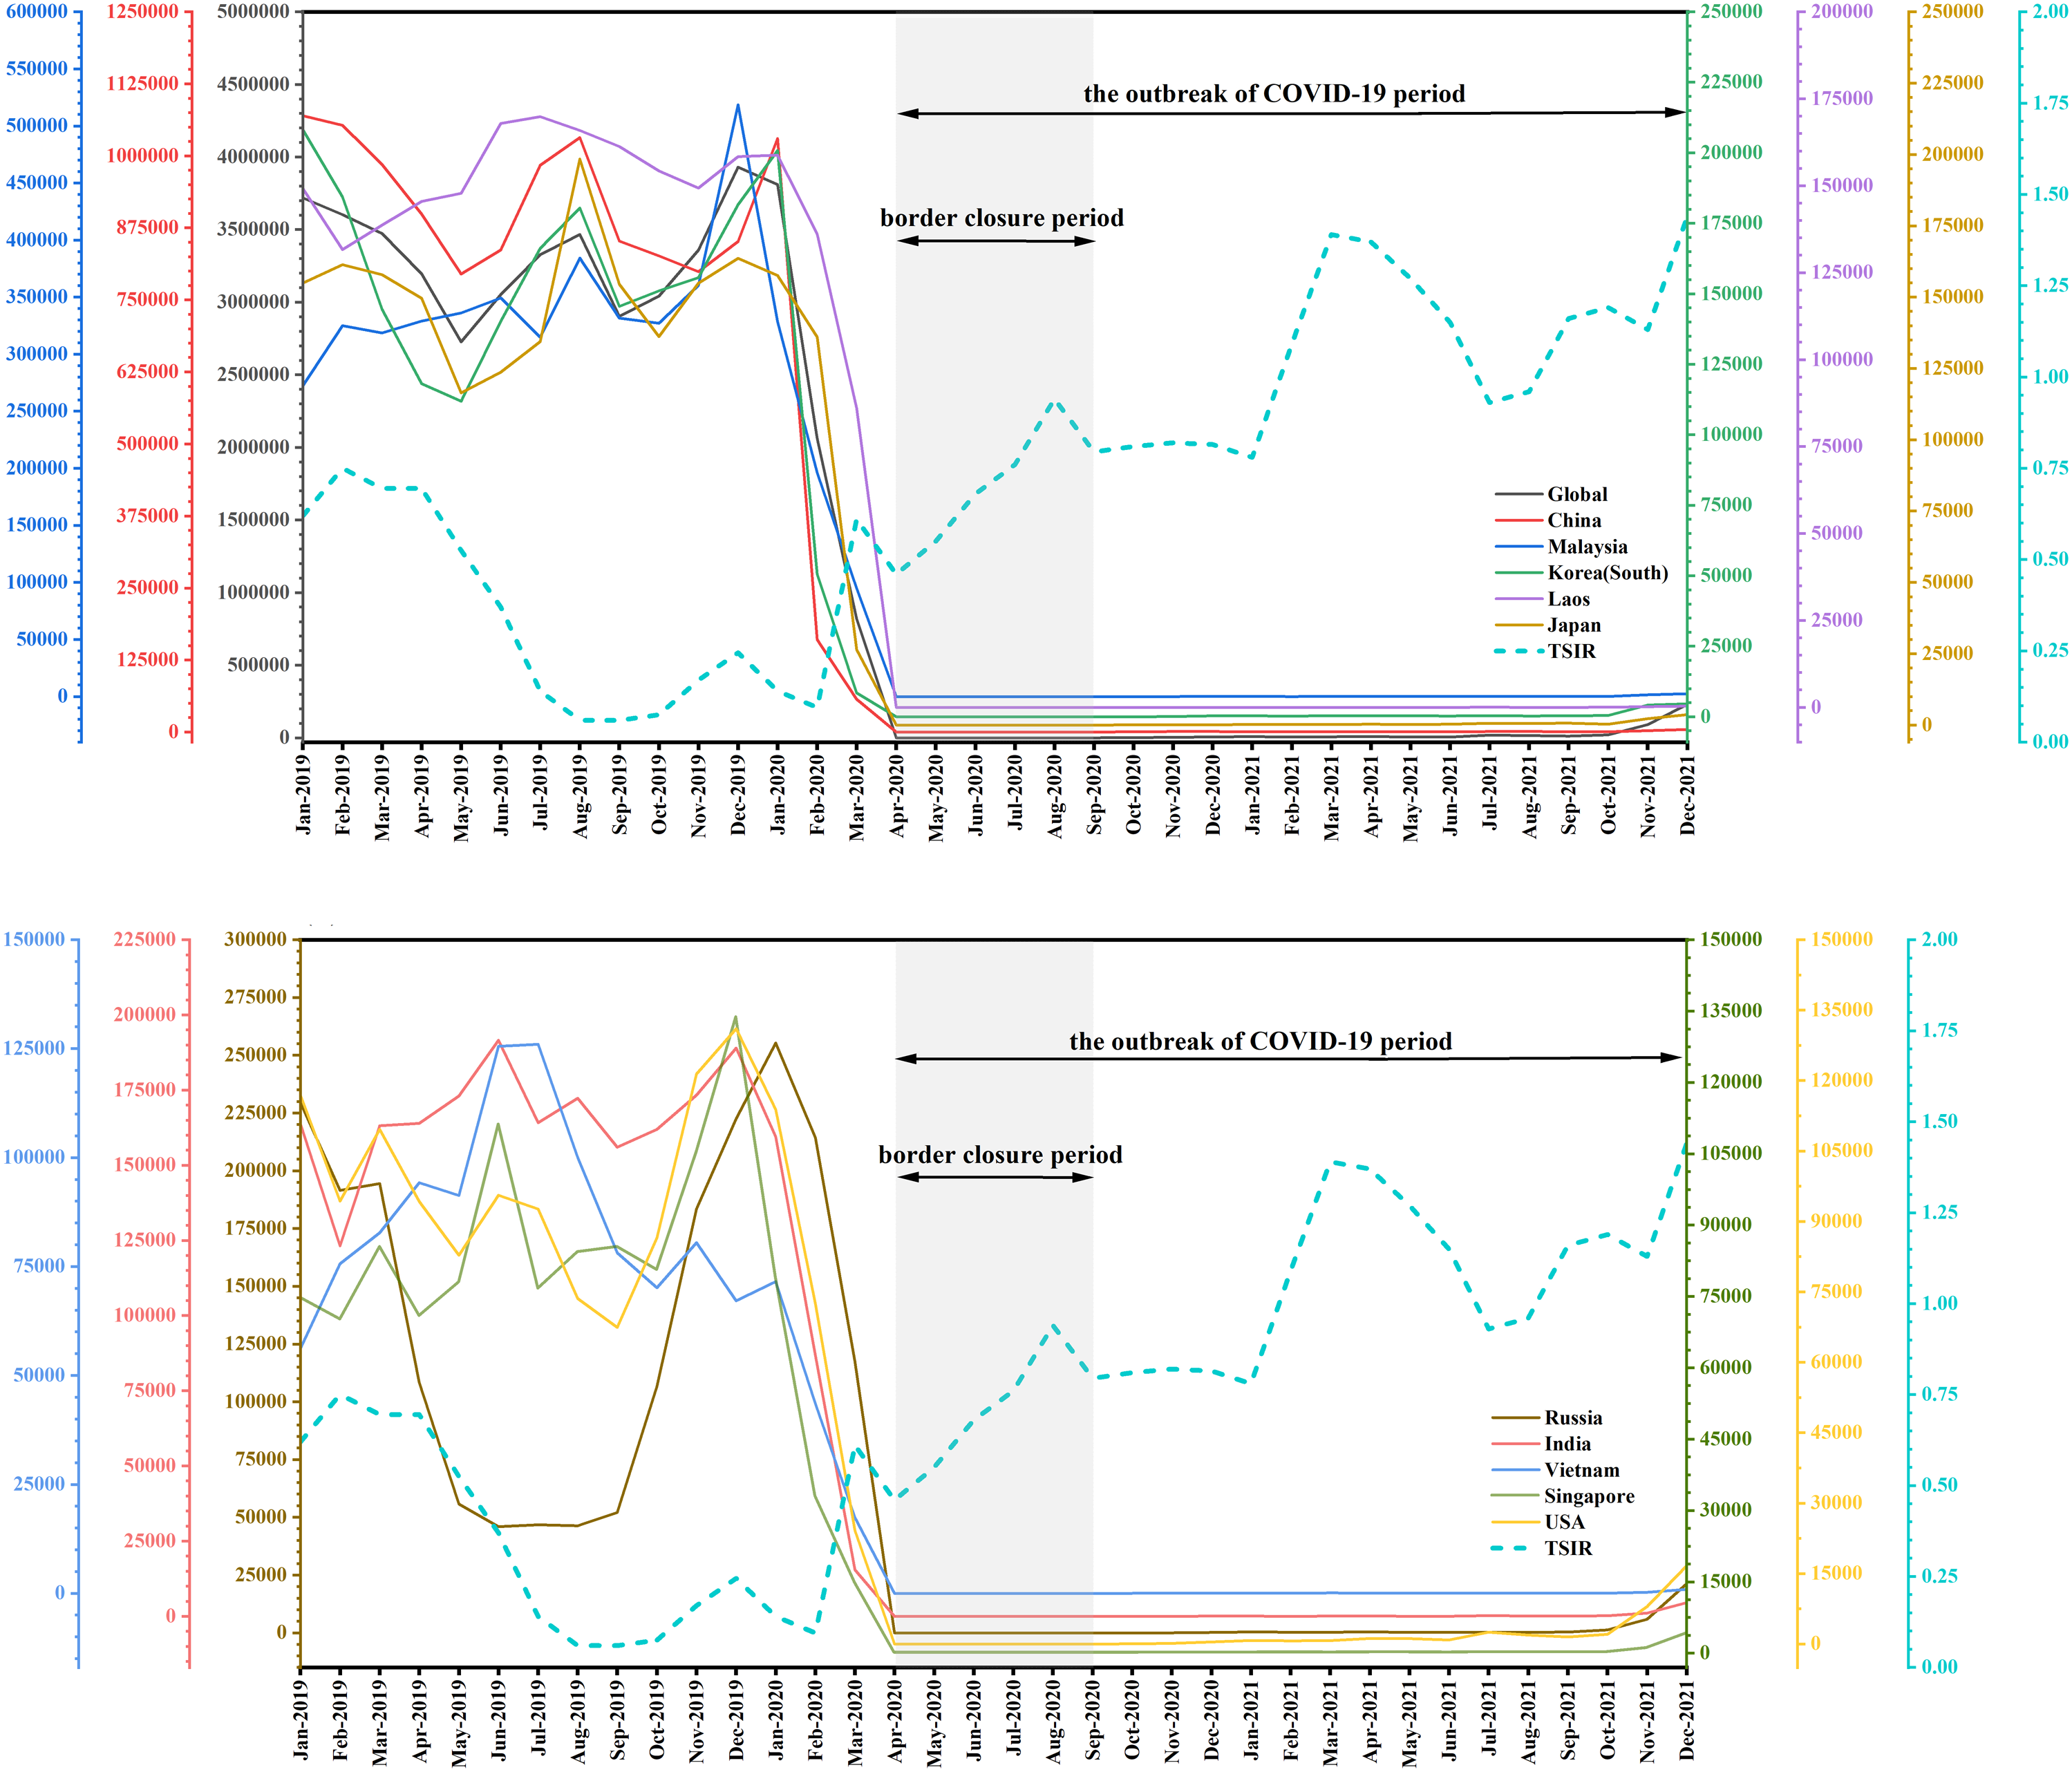
Conclusion and policy implication for economic recovery
This paper analyzed the nonlinear dynamic relationship between inbound tourism and expected economic growth using copula-based GARCH approaches. Following Santamaria and Filis (2019), we incorporated economic prospects using the term structure of interest rate. The empirical analysis considered total inbound tourism to Thailand, and also the arrivals from each of its 10 main origin markets. Finally, we also analyze the relation between tourism and economic growth through linear and nonlinear Granger causality tests.
Results reveal that the relationship between expected economic growth and tourist arrivals from different countries to Thailand except Korea (South) and United States of America is dynamic, nonlinear and significant. First, the time-varying relationship between total tourism arrivals and expected economic growth is systematically positive; this reflects a benign development relationship between tourism and economic growth in Thailand. However, this relation becomes unstable when we disaggregate arrivals by the main origin markets. The latter is characterized by alternative positive and negative values.
Second, in periods of turbulence, the co-movement between tourism and economic growth becomes stronger, while the relation weakens in periods of stability. One likely explanation is that in stable episodes, tourism is not a major determinant of economic growth, and other factors are more relevant, such as exchange rate appreciation. Whereas in turbulent times, the increase or decrease in inbound tourists can have significant impacts on the economy.
Third, there is a nonlinear bi-directional Granger-causality relationship for pairs of tourist arrivals from total, China, Malaysia, Laos and Japan and economic growth. These findings are related to the conceptual linkages stated in TLEG and EDTG hypotheses. And, the unidirectional copula Granger-causality relationships between TSIR and inbound tourism growth from Russia, India, Vietnam and Singapore provide empirical evidence to support the TLEG hypothesis. In addition, it is worth noting that there is no statistically significant relationship between tourism and expected economic growth for Korea (South) and United States of America. Hence, it is providing empirical insights for supporting the neutrality hypothesis.
Finally, extreme events, such as financial crisis, floods, political instability and international trade conflicts, are shown to affect the tourism-expected economic growth relationship. But the effects vary in sign, and magnitude for each country and event. In general, extreme events have weakened the degree of interdependence between inbound tourism and expected economic growth in Thailand.
In terms of theoretical contribution, we highlight the relevance of considering flexible variables’ distributions when analysing the co-movements among them. Specifically, the methods applied in this study proved to be suitable to capture the dynamic and nonlinear relationship between inbound tourism and expected economic growth. These methods can be applied to other country cases as well. Furthermore, the list of variables could be extended to capture extreme economic, political and natural disaster events in order to identify their specific influence on tourism.
In terms of policy implication, nowadays, the global tourism industry is suffering from what is so-called ‘economic super-shock’ (Dolnicar and Zare, 2020) due to the outbreak of COVID-19. Based on our findings, we offer the following practical recommendations for those countries in which tourism contributes significantly to their economy.
First, this paper justifies that the governments support the tourism industry. This is due to the positive dependence between inbound tourism and expected economic growth. Due to the pandemic, many governments have restricted the entry of foreigners, which has devastated their tourism industry and plunged the economy into a downturn. In the later stages of the pandemic, it is recommended that countries reopen their borders in order to normalized tourism, which will play an important positive role in economic recovery and rehabilitation. In this sense, the Thai government announced a ‘Phuket Sandbox’ plan to reopen Thailand’s tourism industry since June 2021, which is consistent with our findings that tourism is the driver of economic recovery. By opening up tourism in the surrounding islands on a small scale, and then gradually relaxing the restrictions on tourism areas, this plan aims to encourage more tourists to visit Thailand and thus save the declining economy. In addition, the finding of the bi-directional causality between tourism and economic growth also has implications for policy makers during the COVID-19 pandemic. During this period, the economy was sluggish, tourism nearly shut down and unemployment increased. The governments could have increased investment in tourist attractions and tourism infrastructure, which can not only stimulate economic growth and relieve employment pressure, but also lays a good foundation for the recovery of tourism in the post-pandemic period. Similarly, the findings support the appropriateness of introducing tourism subsidies and tourism consumption vouchers to promote the development of tourism and thus promote economic growth through consumption. This bidirectional causality implies that the improvement of tourism or economic growth will benefit both.
Second, the specific country effects indicate that the government should implement differentiated tourism policies for each origin market. This is justified by the heterogeneous development of the epidemic and policy reactions in different origin countries and the great variability in its contribution to the destinations’ economies. For example, governments may set specific entry policies for their main origin countries based on their epidemic levels. It is also relevant to strengthen communication with their origin markets’ governments to achieve safe tourism between them.
Third, the public authorities need to improve economic expectations and create vitality for tourism. According to the positive dependence between tourism and economic expectations, we realize that when the economic expectations deteriorate or weaken, the tourism economy also deteriorate to some extent. Therefore, it would be advisable that policy-makers formulate and implement strong macro policies during uncertain times as the COVID-19 period, and maintain effective communication with the market, thus forming a constant mutual feedback cycle.
Fourth, under the epidemic prevention and control measures, governments should pay more attention to the restoration of segments for which social distance can be easily guaranteed, as cultural or natural related tourism. Similarly, public authorities should focus on establishing a standardized prevention and control system, regularly disinfect facilities and equipment and provide crowd control to create a safe and reliable tourism environment. Finally, the governments should further increase the application of big data, artificial intelligence and other advanced digital technologies in tourism flow control, thereby contributing to the gradual recovery of tourism economy. It is worth noting that the impact of extreme events on the relationship between inbound tourism and expected economic growth cannot be ignored.
The results presented here are not free from limitations, which give suggestions for future studies. First, tourism and economic growth are related to other variables, such as foreign direct investment (Sokhanvar, 2019), exchange rate (Akadiri and Akadiri, 2021), air transport (Balsalobre-Lorente et al., 2021) etc. Nonlinear multivariate dependence and nonlinear causal relationship are recommended to further study. Second, inbound tourism has been severely affected by the COVID-19 pandemic within the short-term. Thus, domestic tourism for Thailand seems to be more important than inbound tourism in this period. We may further investigate nonlinear dependence and causal relationship between domestic tourism and economic growth thereby proposing some policy suggestions to make up for a loss from Thailand inbound tourism.
Footnotes
Acknowledgments
We acknowledge the Centre of Excellence in Econometrics at Chiang Mai University, the China–ASEAN High-Quality Development Research Center in Shandong University of Finance and Economics, and the “Theoretical Economics Research Innovation Team” of the Youth Innovation Talent Introduction and Education Plan of Colleges and Universities in Shandong Province for financial support. We also gratefully thank Professor Sanzidur Rahman for his valuable comments and suggestions.
Declaration of conflicting interests
The author(s) declared no potential conflicts of interest with respect to the research, authorship, and/or publication of this article.
Funding
The author(s) received no financial support for the research, authorship, and/or publication of this article.
Author biographies
Jianxu Liu is an Associate Professor at the Faculty of Economics, Shandong University of Finance and Economics, Jinan, China. He holds a PhD in Economics from Chiang Mai University, Thailand. His research interests are tourism demand and copula modelling. He published papers in a variety of journals including International Journal of Approximate Reasoning, Mathematics and Sustainability.
Vicente Ramos is Associate Professor at the Department of Applied Economics and the Faculty of Tourism at the University of the Balearic Islands. He holds a PhD in Economics. His research interests covered different topics in Tourism Economics, such as labour market, demand modelling, big data and Smart-destinations.
Bing Yang is a lecture at the School of Economics, Xihua University, Chengdu, China. She received a PhD in Economics from Chiang Mai University, Thailand. Her main research interest area includes international tourism, tourism development, tourism impacts, tourism economy, economic growth and econometrics.
Mengjiao Wang received her PhD in Economics from Chiang Mai University, Thailand. She is currently an assistant professor in The Institute for China’s Overseas Interests (ICOI), Shenzhen University, China. Her areas of specialization are international economics and econometrics. She has published several articles in international journals and books. The journals in which some of her articles have been published include ‘Mathematics’ and ‘Sustainability’.
Songsak Sriboonchitta is a Professor of Econometrics at Chiang Mai University, Thailand. He graduated from the University of Illinois, Urbana-Champaign, U.S.A. in 1983 with a PhD degree in Agricultural Economics. He has published 8 books and more than 200 articles in different languages. His recent research interests include econometrics and tourism economy.