This paper aims to enrich social network and managerial powers theories by examining the effects of board-CEO friendship ties in tourism firms. Specifically, we focus on the association between the board-CEO social network ties (e.g. serving external boards together or sharing memberships at social organisations) and performance and risk-taking behaviour among tourism firms. The findings show that friendship ties between CEO and board members result in higher risk-taking, lower profitability and market values. In addition, professional ties (i.e. current and past employment) significantly impact tourism firms’ outcomes, whereas non-professional ties (i.e. education and other social organisations) do not. The findings prevail after controlling for the Covid-19 pandemic. However, friendship ties lead to better information sharing, resulting in more effective decision-making by board members.
Studies that contribute to the understanding of factors that affect the survival of firms provide information towards making the tourism industry more resilient (Zheng et al. 2021). The tourism literature, however, has provided limited theoretical and empirical evidence (except Al-Najjar 2014; Ozdemir, 2020; Trinh and Seetaram 2022) to this effect. Therefore, the primary purpose of this article is to enrich the limited understanding governance within the tourism industry by examining the connections between CEO and board members of tourism firms and their potential effects on performance, including riskiness, profitability and market valuations. Board directors and executives may either serve together on the boards of other firms or have worked together in the past. They can be connected via their social networks, such as being golf club members, trustees for the same charitable organisations or through their educational background by having graduated from the same universities (Fracassi and Tate, 2012).
On the one hand, social capital theories postulate that CEOs and board directors develop ‘social capital’ through their social ties, and such abilities to access resources can benefit their firms (Sundaramurthy et al. 2014). Such connections can create conduits through which crucial information are acquired (Kilduff and Tsai, 2003). Board–CEO relationships may enhance trust and loyalty, by which the CEO and the board can interact more efficiently and create value by facilitating collective action (Schmidt, 2015). Therefore, these ties can add value because the relationships between the CEO and the board help reduce agency costs in tourism firms where ownership and management are separated.
In contrast, social network connections can undermine the independence of governance systems and negatively affect firms' riskiness and performance (Subrahmanyam, 2008). Social ties between top senior managers and other board directors may be detrimental to board effectiveness as they can lead to ‘chummy’ or ‘collusive’ behaviour (Wall Street Journal, 1993). Based on risk-sharing and agency theories, board-CEO networks can induce board directors to have more tolerance toward CEO failure and are less likely to dismiss the CEO because of poor performance (Hwang and Kim, 2009). As mutual trust is shared between CEOs and the connected directors, CEO power can be fostered under such an absence of board monitoring, leading to greater CEO risk-taking and empire-building behaviours (Adams and Ferreira, 2007; Fracassi and Tate, 2012).
Using a panel sample of 478 companies from the US tourism sector from 1999 to 2020, we find that the board-CEO friendship ties bear a higher risk of default and lower the firm's profitability and market value. Furthermore, we test whether external shocks such as the COVID-19 pandemic, which has increased firms’ vulnerability, influence the potential observable links. We consider both the breadth (i.e. the proportion of board members who have friendship ties with the CEO) and the depth (i.e. the number of friendship ties per board member) between the CEO and the board of directors. Our results are robust across different measures (i.e. breadth and depth) and endogeneity tests. Our extended analyses reveal that professional ties (i.e. current and past employment) have significant impacts on tourism firms’ outcomes, whereas non-professional ties (i.e. education and other relations) do not.
Our paper can make several considerable contributions by investigating and proving empirical evidence on issues related to the governance of firms in the tourism industry which has not been thoroughly looked into by the literature. It provides evidence on the impact of board-CEO ties on firms’ outcomes in the context of tourism and related firms. We also find that professional versus non-professional board-CEO ties have different impacts on tourism firms’ stability. Interestingly, only professional ties significantly impact firms’ performance and riskiness.
Theories and hypotheses
Existing corporate governance research in tourism is limited and focuses on the governance characteristics or the attributes of the board or the CEO. Very few have studied the links between governance, performance and survival. Yeh and Trejos (2015) find that board size negatively affects firms' performance. Li and Singal (2019) focus on the CEO's attributes and compensation and conclude that both are positively related to firms' performance. These findings echo those of Trinh and Seetaram (2022). Zheng et al. (2021) conclude that tourism firms are vulnerable to political risk, affecting both their survival and performance. However, their paper did not emphasise governance. Ozdemir (2020) examined the effect of board diversity on the performance of firms and that the effect is enhanced when institutional ownership is low. Al-Najjar (2014) is the only paper that has considered the board's independence when assessing the performance of tourism firms. However, he uses a dummy variable to quantify the effect of board independence, limiting the application of the findings obtained.
Given the lack of insight on the topic within the industry, the current research aims to study the role of the CEO's independence on the performance of tourism firms. We focus on the CEO because the latter is responsible for making the day-to-day decisions making of the firm. Our study advances knowledge by considering the number of links the CEO may have with the board and the depth of these links. We also examine different types of links and the effect of an external shock on them. The appointment of board members is often facilitated through networks shared by the board, which reduces the cost of search and information asymmetries (Adams and Ferreira, 2007). Consequently, board independence is compromised because CEOs and board members share professional, personal and educational ties (Fracassi and Tate, 2012).
Proposition 1: Board-CEO friendship ties and performance of firms
According to Adams and Ferreira (2007), these board-CEO friendship ties can foster mutual trust among board members and the CEO, facilitating information sharing. They purport that such relations are beneficial to firms. Hoitash (2011) further adds that such ties boost the performance and value of firms by promoting greater board involvement in making critical decisions but can result in lower monitoring levels, resulting in passive boards. Fracassi and Tate (2012) state that more powerful CEOs are likely to recruit within their network. This finding is detrimental to the firm's value because it undermines board monitoring roles and allows the CEO to engage in acquisitions more often, reducing its market value.
Similarly, Subrahmanyam (2008) claims that firms place a higher value on gaining information through a network at the cost of sloppy monitoring from the board of directors. This argument aligns with managerial power theory (e.g. Fracassi and Tate 2012; Finkelstein 1992; Schmidt 2015). Board-CEO friendship ties tend to enhance the control power or abilities of the CEO over the board by weakening the board monitoring intensity, disciplining or whistleblowing on wrongdoings. Furthermore, board-CEO friendship ties signal weak governance in the stock market. Fahlenbrach and Stulz (2011) and Fan et al. (2019) provide some critical evidence for this effect. They state that the ties are likely to exacerbate agency costs and conflicts within firms and are associated with a decline in profitability and market value. As seen above, the literature on the topic offers mixed results, and none of these papers considered tourism firms. Therefore, the current study tests for the links between CEO-Board ties and firms’ performance in the tourism context. We set the hypothesis as follows:
H1: Board–CEO social network ties are negatively related to the performance of tourism firms.
Proposition 2: Board–CEO friendship ties and risk-taking behaviour
The negative relationship hypothesised above can be the consequence of reckless risk-taking by CEOs encouraged by slack monitoring from the boards. The case is especially true when CEOs are pivotal in recruiting many board directors. The behaviour is reinforced because they may also receive a higher level of support and assistance for their decisions (Adams and Ferreira 2007; Schmidt 2015; Westphal 1999). Silver (1990) states that social networks foster mutual caring, trust and positive impression and increase leniency towards failure. McAdam and Paulsen (1993) discuss that individuals belonging to the same networks are likely to have similar beliefs, attitudes, traits and solid psychological bonds, which may result in a ‘heightened sense of trust and favourable interpretation of others’ action’ (Fan et al. 2019, pp. 3). This leads to familiarity bias and poorer quality of board monitoring and advisory effectiveness (Linck et al. 2008).
Importantly, socially connected CEOs are less likely to face negative consequences of their actions even when they fail to perform adequately (Hwang and Kim 2009). This high job security results in higher risk-taking (Smith and Stulz 1985). Fan et al. (2021) find that in the US, replacing an independent board member with someone who has a connection with the CEO increases the total risk of firms by 22.8%. Based on the arguments presented, the paper set out to test the power theory within the tourism context. We set the hypothesis as follows:
H2: Board–CEO social network ties are positively related to firm risk-taking behaviour.
Methodology
Sampling
We employ the database of Compustat – North America to identify tourism-related firms in the United States based on the North American Industry Classification System or Standard Industrial Classification. Initially, we identified a sample of 697 tourism firms between 1999 and 2020. These include hotels, airline companies, restaurants and casinos initially. Information on the CEOs of these companies is obtained from the BoardEx database1. After excluding missing data, 478 firms are retained, representing 1,828 firm-year observations from 1999 to 2020. In addition, firm-level accounting data is retrieved from Compustat.
Variable constructions
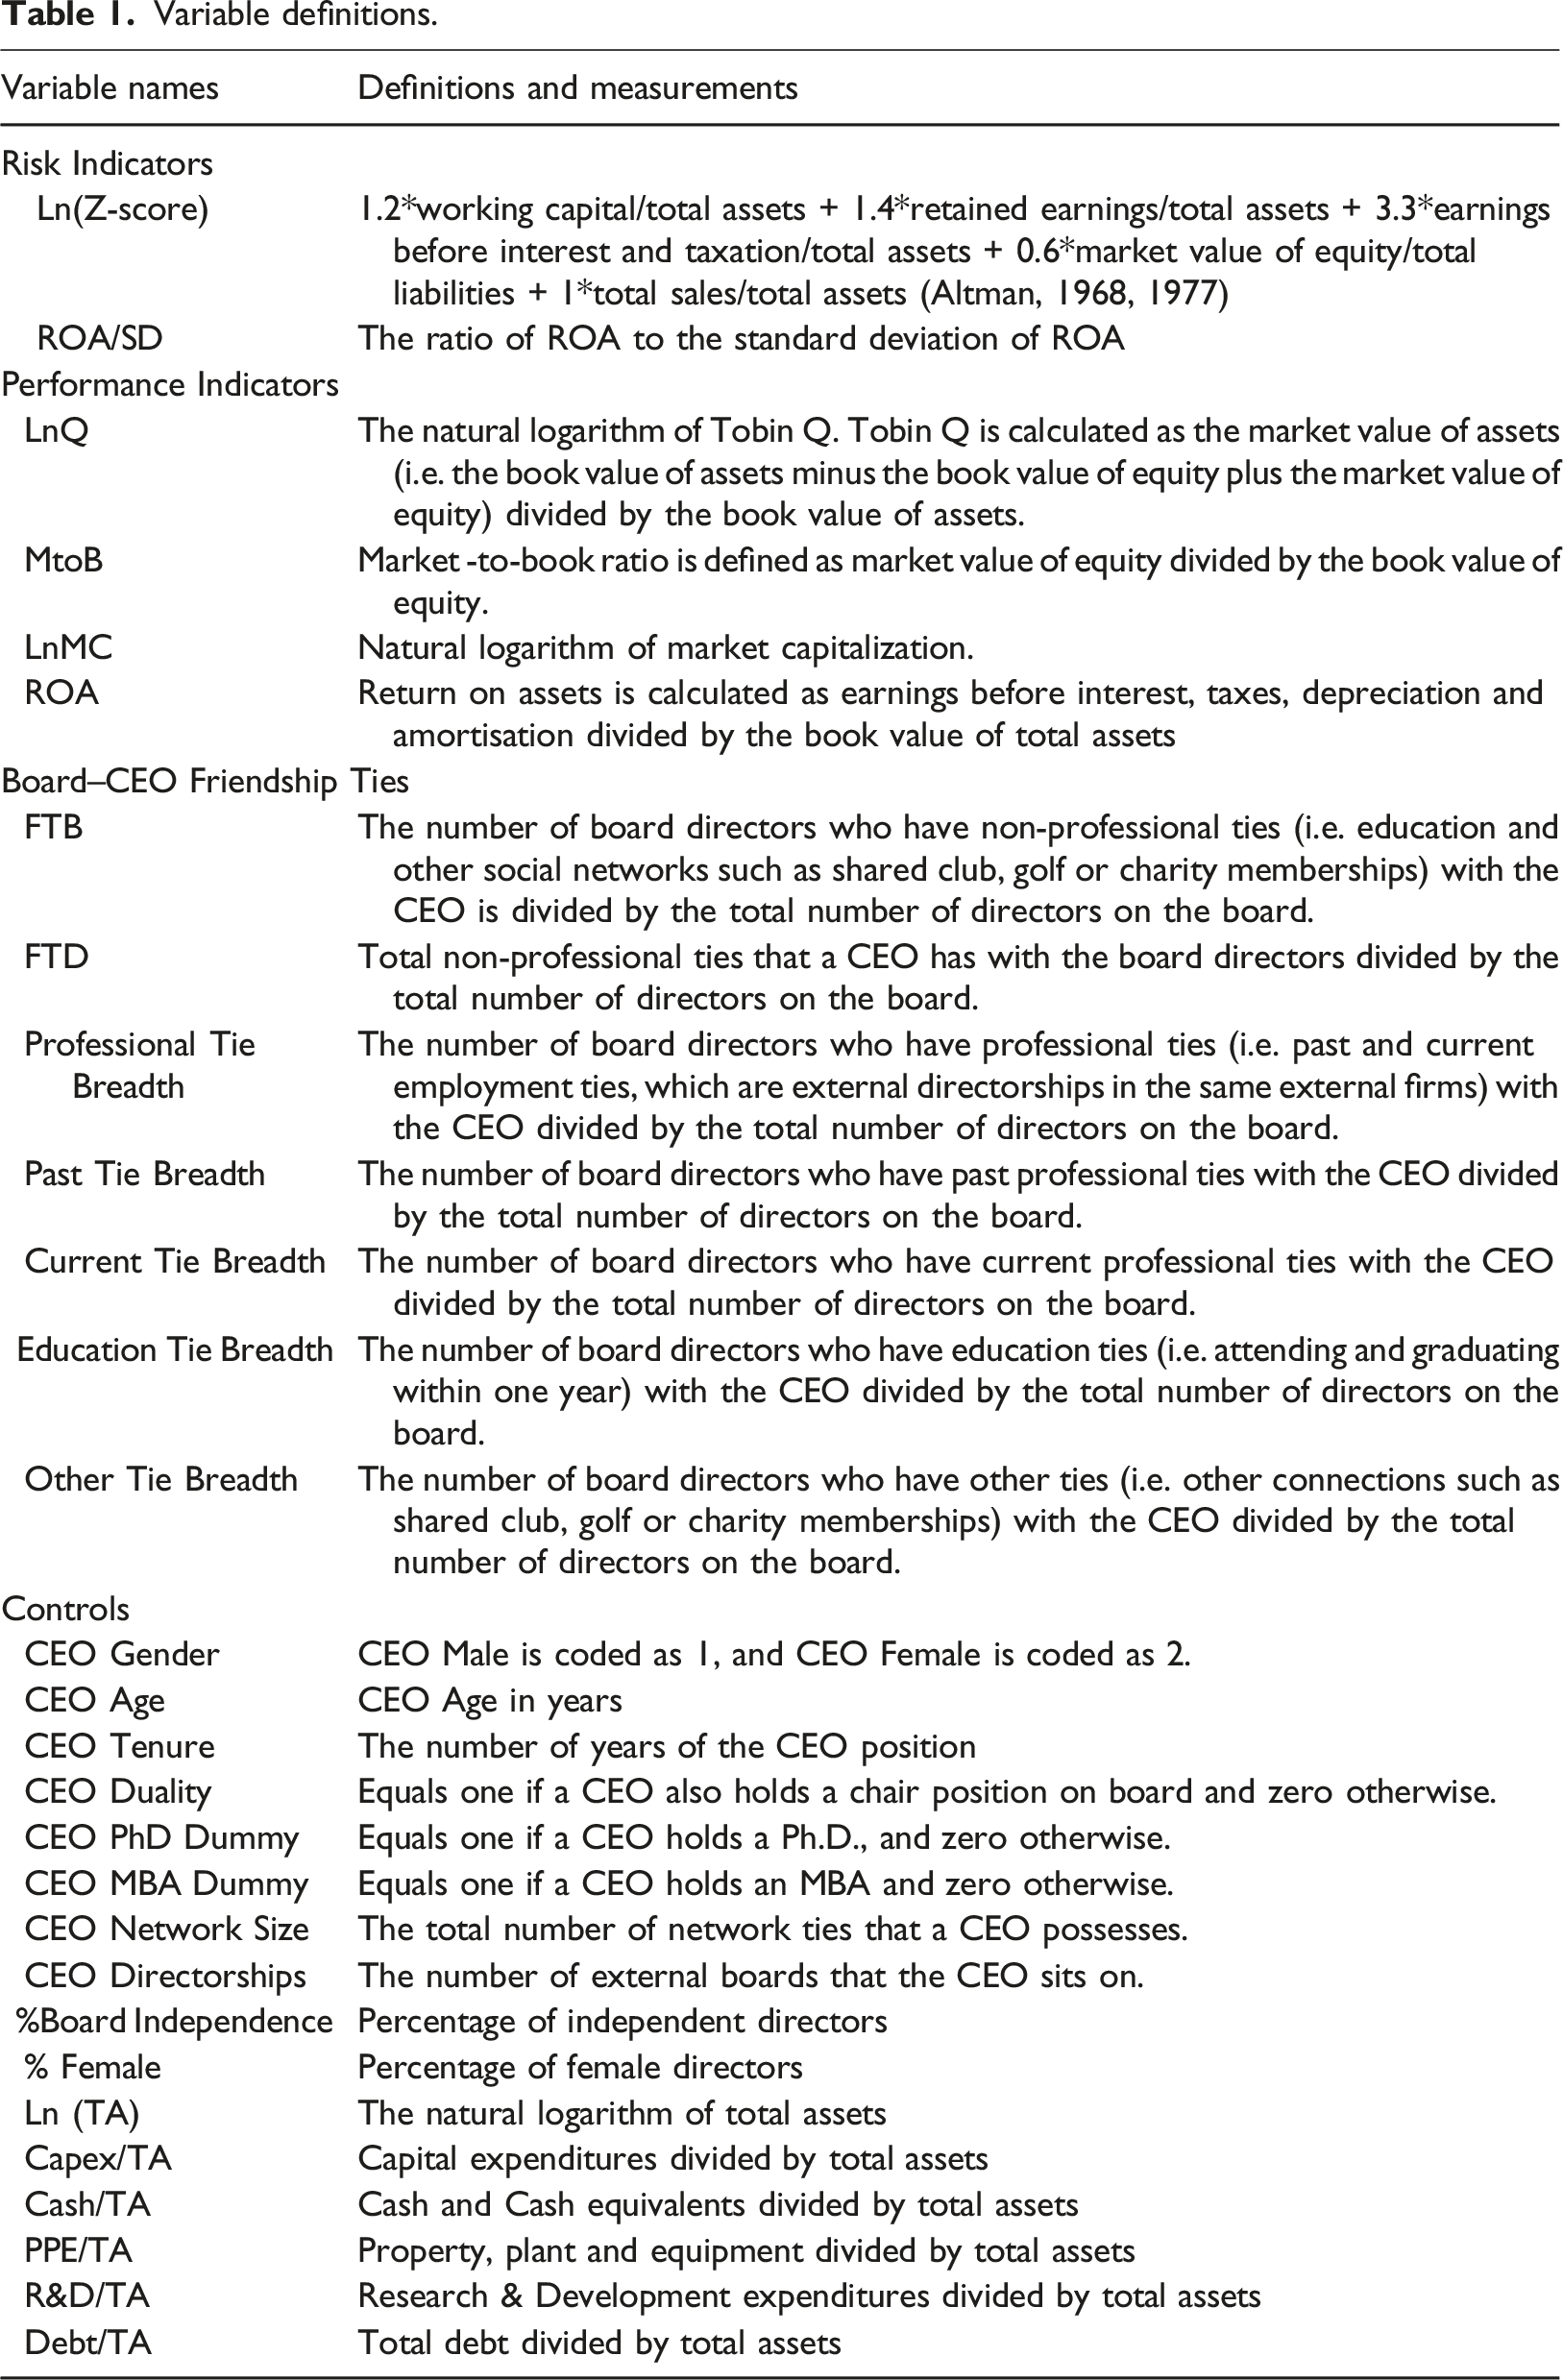
All definitions and measurements of variables used in the study are provided in Table 1. The indicators for a firm’s performance are made up of four key measures. The first (LnQ) is the natural logarithm of Tobin Q. Tobin Q is widely used as the proxy of firm value (Fracassi and Tate 2012; Khanna et al. 2015; Ozdemir, 2020). It is calculated as the asset's market value divided by the asset's book value. The market value of assets is calculated as the book value of assets minus the book value of equity plus the market value of equity. The second indicator for performance is the market to book ratio (MtoB), which equals the market value of equity divided by the book value of equity. The Market to Book ratio represents the growth opportunities of firm investments (Duong et al. 2021). The natural logarithm of market capitalisation is the third performance indicator. Lastly, return on assets (ROA) captures the firm's accounting profits.
Variable definitions.
Variable names
Definitions and measurements
Risk Indicators
Ln(Z-score)
1.2*working capital/total assets + 1.4*retained earnings/total assets + 3.3*earnings before interest and taxation/total assets + 0.6*market value of equity/total liabilities + 1*total sales/total assets (Altman, 1968, 1977)
ROA/SD
The ratio of ROA to the standard deviation of ROA
Performance Indicators
LnQ
The natural logarithm of Tobin Q. Tobin Q is calculated as the market value of assets (i.e. the book value of assets minus the book value of equity plus the market value of equity) divided by the book value of assets.
MtoB
Market -to-book ratio is defined as market value of equity divided by the book value of equity.
LnMC
Natural logarithm of market capitalization.
ROA
Return on assets is calculated as earnings before interest, taxes, depreciation and amortisation divided by the book value of total assets
Board–CEO Friendship Ties
FTB
The number of board directors who have non-professional ties (i.e. education and other social networks such as shared club, golf or charity memberships) with the CEO is divided by the total number of directors on the board.
FTD
Total non-professional ties that a CEO has with the board directors divided by the total number of directors on the board.
Professional Tie Breadth
The number of board directors who have professional ties (i.e. past and current employment ties, which are external directorships in the same external firms) with the CEO divided by the total number of directors on the board.
Past Tie Breadth
The number of board directors who have past professional ties with the CEO divided by the total number of directors on the board.
Current Tie Breadth
The number of board directors who have current professional ties with the CEO divided by the total number of directors on the board.
Education Tie Breadth
The number of board directors who have education ties (i.e. attending and graduating within one year) with the CEO divided by the total number of directors on the board.
Other Tie Breadth
The number of board directors who have other ties (i.e. other connections such as shared club, golf or charity memberships) with the CEO divided by the total number of directors on the board.
Controls
CEO Gender
CEO Male is coded as 1, and CEO Female is coded as 2.
CEO Age
CEO Age in years
CEO Tenure
The number of years of the CEO position
CEO Duality
Equals one if a CEO also holds a chair position on board and zero otherwise.
CEO PhD Dummy
Equals one if a CEO holds a Ph.D., and zero otherwise.
CEO MBA Dummy
Equals one if a CEO holds an MBA and zero otherwise.
CEO Network Size
The total number of network ties that a CEO possesses.
CEO Directorships
The number of external boards that the CEO sits on.
%Board Independence
Percentage of independent directors
% Female
Percentage of female directors
Ln (TA)
The natural logarithm of total assets
Capex/TA
Capital expenditures divided by total assets
Cash/TA
Cash and Cash equivalents divided by total assets
PPE/TA
Property, plant and equipment divided by total assets
R&D/TA
Research & Development expenditures divided by total assets
Debt/TA
Total debt divided by total assets
We use two measures for firm-level accounting risk: Z-score and the ratio of ROA (return on assets) to the standard deviation of ROA (ROA/SD). They capture that a firm with higher variation in profitability has a greater likelihood of bankruptcy, demonstrating a higher level of riskiness. A lower Z-score value represents a higher risk of bankruptcy risk. Following Altman (1968, 1977), the Z-Score is calculated as follows:
Z score = 1.2*working capital/total assets + 1.4*retained earnings/total assets
+ 3.3*earnings before interest and taxation/total assets
+ 0.6*market value of equity/total liabilities + 1*total sales/total assets.
A high value of ROA/SD indicates a lower firm asset risk (Zheng et al. 2021).
The paper assumes that both the breadth and the depth of social connections between a CEO and board directors influence firms' risk and performance. Non-professional ties are formed outside workplace settings through friendships and networking in social setups (Fracassi and Tate 2012; Fan et al. 2019; Schmidt 2015). The Friendship-Tie Breath (FTB) is defined as the number of board directors with non-professional ties with the CEO divided by the total number of directors on the board (Fan et al. 2019; Schmidt 2015). The value of FTB ranges from zero to one, with a value closer to one representing solid ties between a CEO and the directors. Friendship-Tie Depth (FTD) is the sum of a CEO's non-professional relations with the board of directors divided by the total number of directors (Fan et al. 2019; Schmidt 2015). The minimum value of FTD is zero, indicating no social connections between a CEO and board directors. However, the maximum value of FTD depends on the number of ties which can be higher than the number of directors on board.
Conforming to previous studies (e.g. Custódio and Metzger 2014; Duong et al. 2021; Fan et al. 2019; Fracassi and Tate 2012; Khanna et al. 2015; Schmidt 2015), several control variables are considered as seen in Table 1. Ln(TA) is used as a proxy for firm’s size. A larger firm has higher profitability and market capitalisation but lower investment opportunity growth as it is often long-established and in its mature business cycle (Custódio and Metzger 2014; Fan et al. 2019). Capex/TA and R&D/TA are the capital expenditures and R&D (Research & Development expenditures) scaled by total assets. Capex/TA and R&D/TA represent firm investment policies that can affect the firm market capitalisation, profitability and firm risk (Custódio and Metzger 2014; Duong et al. 2021). More significant tangible assets can reduce firm risks as intangible assets are often easily impaired in value. PPE/TA is used as a proxy for tangible assets, the property, plant and equipment scaled by total assets (Custódio and Metzger, 2014; Duong et al. 2021). Cash/TA and Debt/TA controls for asset liquidity and financing policy as the availability of finance and cash can foster firm operations and reduce firm risk. However, higher debt borrowing also increases the bankruptcy risk for the firms (Custódio and Metzger 2014; Duong et al. 2021).
Empirical models
The effect of board–CEO social ties on a firm’s performance and risk is modelled in Equations (1) and (2), respectively
Performance is measured by different proxies, including LnQ, MtoB, LnMC and ROA as discussed above, while Risk is measured by the Z Score and ROA/SD. ΦX represents a vector of firm-level control variables (See Table 2). Year-fixed effects are included to control for time variance. εi,t indicates the error term.
Descriptive statistics.
N
mean
sd
min
max
p1
p50
p99
Risk Indicators
Ln(Z-score)
1828
0.233
0.761
-5.841
2.431
-2.446
0.226
1.597
ROA/SD
1828
0.979
2.636
-51.283
17.047
-3.241
0.791
7.287
Performance Indicators
LnQ
1828
0.470
0.543
-0.918
3.460
-0.402
0.363
2.069
MtoB
1828
1.952
1.727
0
31.824
0
1.490
7.914
LnMC
1828
6.094
2.335
-1.397
11.983
0
6.265
10.989
ROA
1828
0.022
0.160
-2.442
0.902
-0.511
0.039
0.279
Board–CEO Friendship Ties
FTB
1828
0.144
0.220
0
1
0
0
0.857
FTD
1828
0.200
0.411
0
4.889
0
0
2
Controls
CEO Gender
1828
1.962
0.192
1
2
1
2
2
CEO Age
1828
54.647
8.374
30
86
36
55
75
CEO Tenure
1828
5.744
5.187
1
34.436
1.044
3.833
24.266
CEO Duality
1828
0.492
0.500
0
1
0
0
1
CEO PhD Dummy
1828
0.009
0.093
0
1
0
0
0
CEO MBA Dummy
1828
0.103
0.305
0
1
0
0
1
CEO Network Size
1828
6.059
1.518
2.079
9.280
2.565
6.288
8.861
CEO Directorships
1828
0.383
0.677
0
5
0
0
3
%Board Independence
1828
0.812
0.220
0
1
0
0.875
1
% Female
1828
0.013
0.044
0
0.333
0
0
0.2
Ln (TA)
1828
6.407
2.007
-0.591
11.184
1.973
6.331
10.715
Capex/TA
1828
0.087
0.074
-0.015
0.575
0.001
0.070
0.346
Cash/TA
1828
0.126
0.145
0
0.932
0.001
0.077
0.716
PPE/TA
1828
0.535
0.248
0
0.971
0.020
0.602
0.936
R&D/TA
1828
0.003
0.019
0
0.430
0
0
0.089
Debt/TA
1828
0.391
0.389
0
3.769
0
0.316
1.951
Descriptive statistics
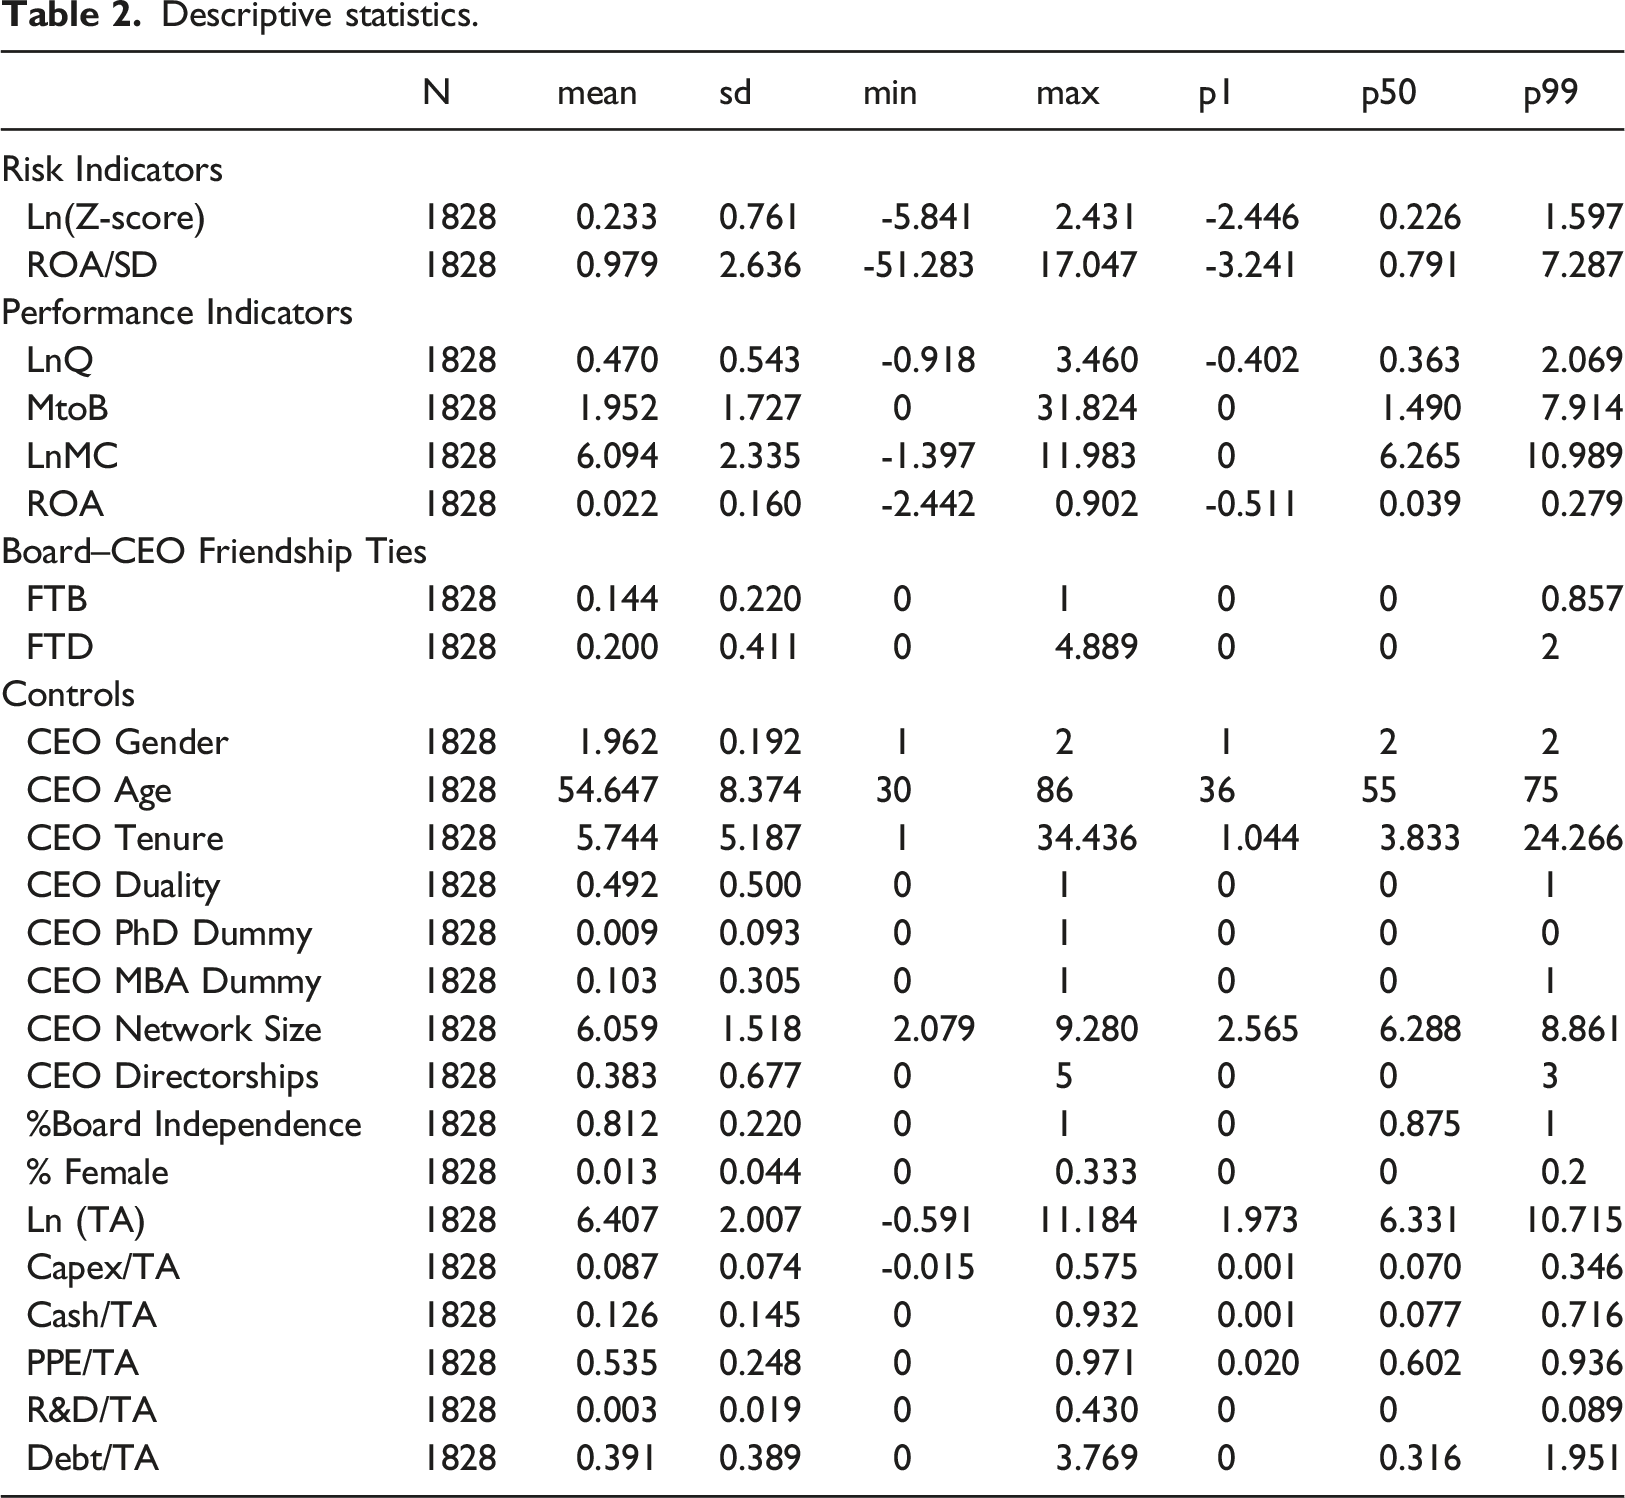
Table 2 reports descriptive statistics of all variables employed. Descriptive results of firm value and profitability reveal that the mean (median) of LnQ, MtoB, LnMC and ROA, respectively, are 0.470 (0.363), 1.952 (1.490), 6.094 (6.265) and 0.022 (0.039). The mean (median) of Ln(Z-score) and ROA/SD are 0.233 (0.226) and 0.979 (0.791), respectively, which imply the normal distribution of these variables.
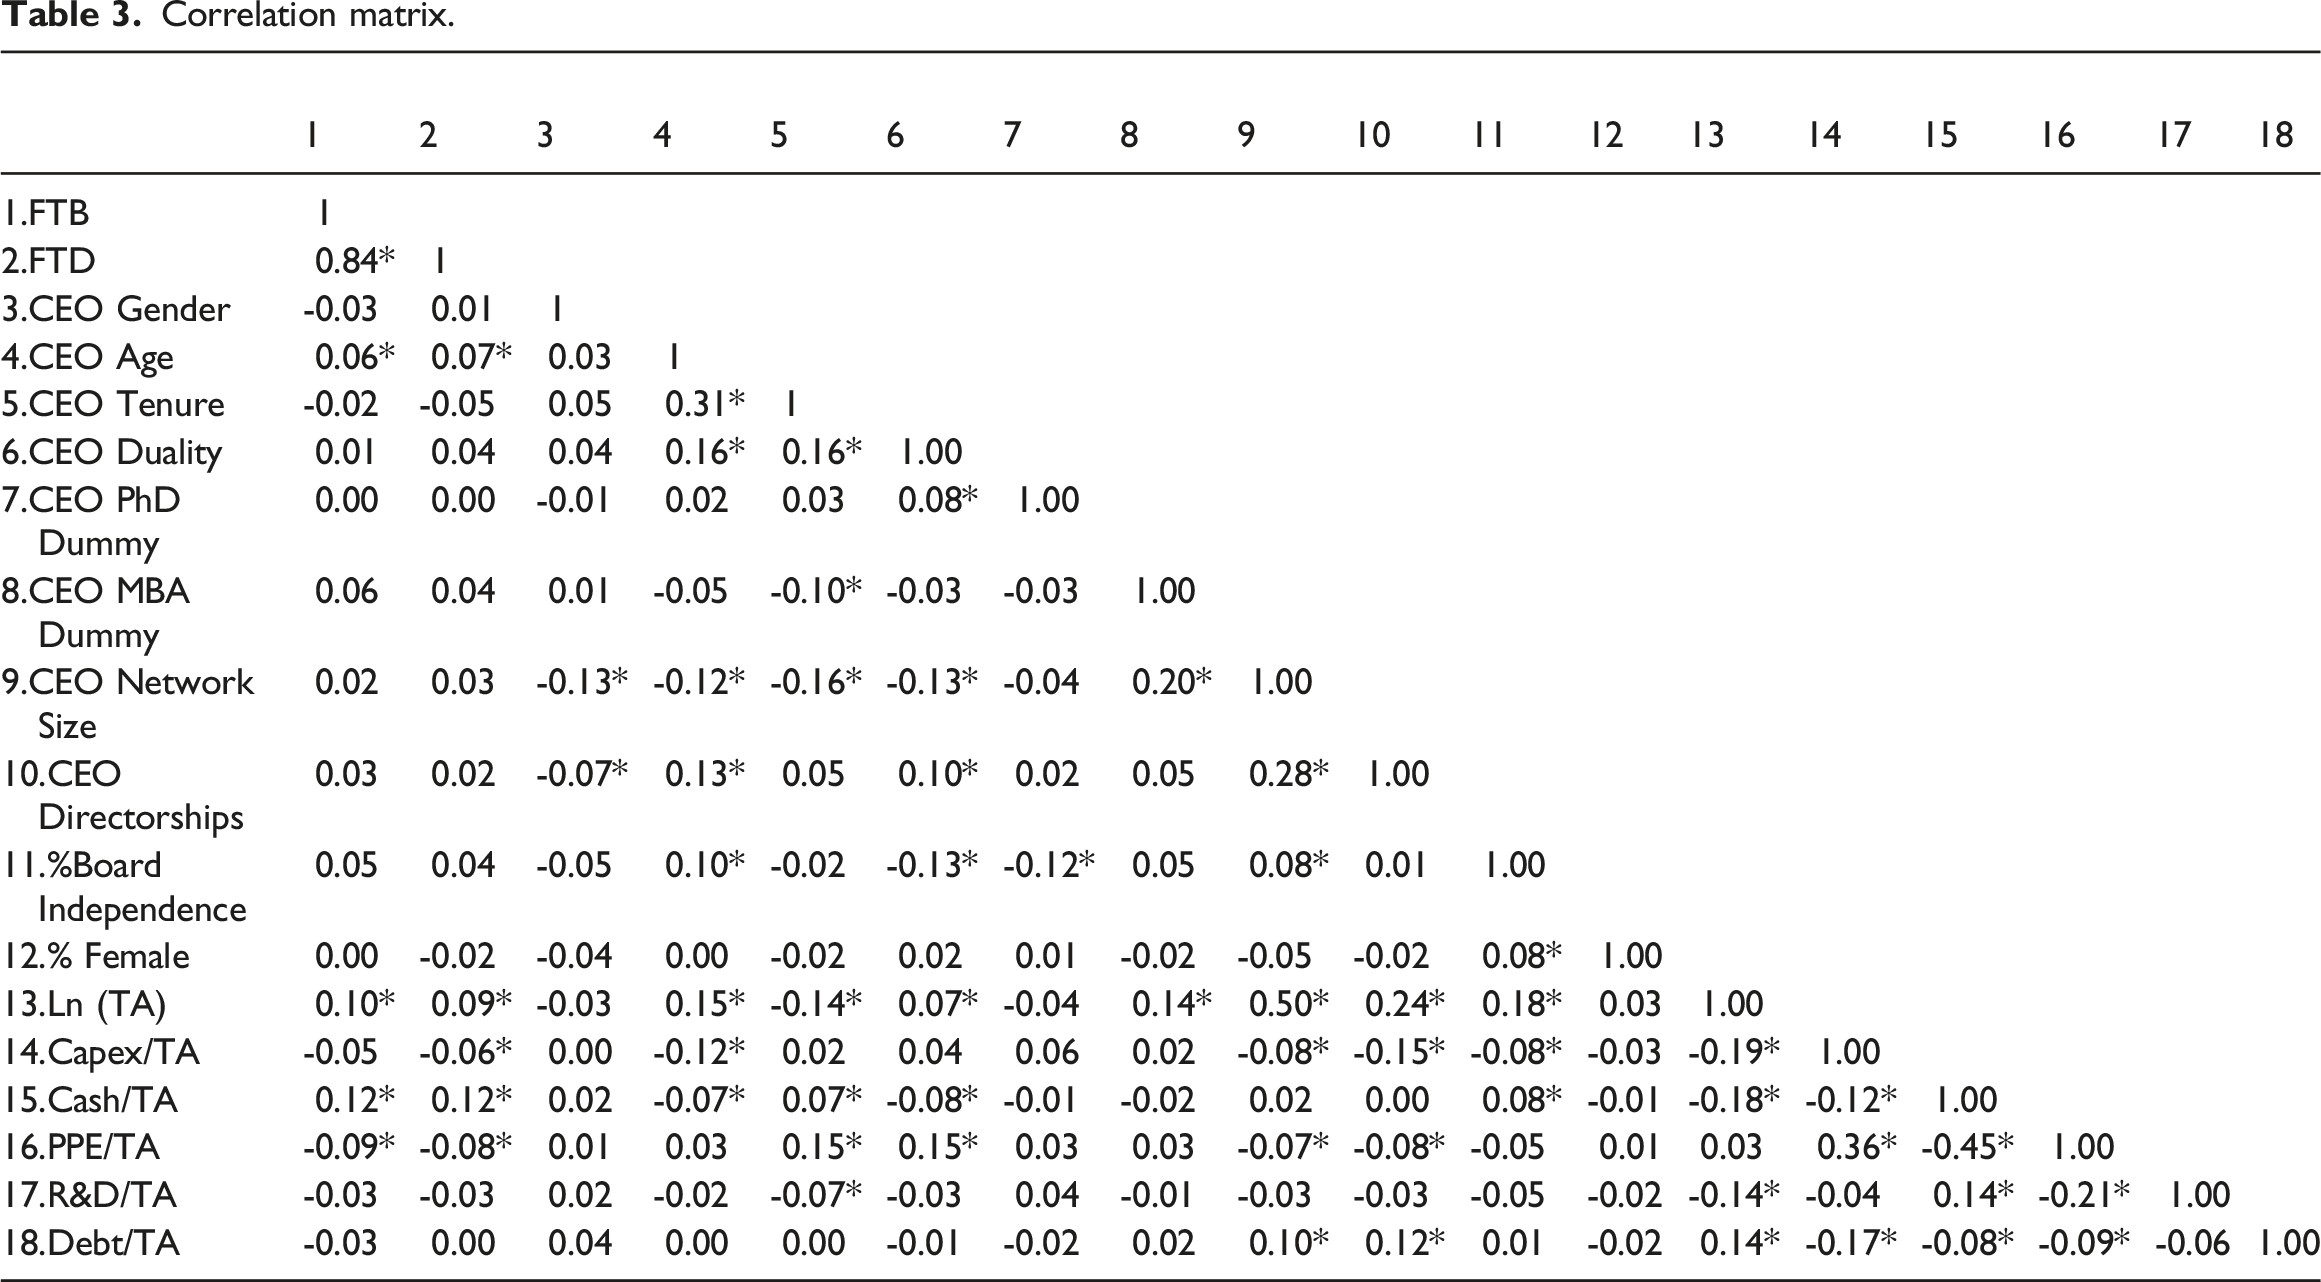
Table 3 shows that the correlations among the independent variables is low; therefore, the model is unlikely to suffer from issues related to multicollinearity.
Correlation matrix.
1
2
3
4
5
6
7
8
9
10
11
12
13
14
15
16
17
18
1.FTB
1
2.FTD
0.84*
1
3.CEO Gender
-0.03
0.01
1
4.CEO Age
0.06*
0.07*
0.03
1
5.CEO Tenure
-0.02
-0.05
0.05
0.31*
1
6.CEO Duality
0.01
0.04
0.04
0.16*
0.16*
1.00
7.CEO PhD Dummy
0.00
0.00
-0.01
0.02
0.03
0.08*
1.00
8.CEO MBA Dummy
0.06
0.04
0.01
-0.05
-0.10*
-0.03
-0.03
1.00
9.CEO Network Size
0.02
0.03
-0.13*
-0.12*
-0.16*
-0.13*
-0.04
0.20*
1.00
10.CEO Directorships
0.03
0.02
-0.07*
0.13*
0.05
0.10*
0.02
0.05
0.28*
1.00
11.%Board Independence
0.05
0.04
-0.05
0.10*
-0.02
-0.13*
-0.12*
0.05
0.08*
0.01
1.00
12.% Female
0.00
-0.02
-0.04
0.00
-0.02
0.02
0.01
-0.02
-0.05
-0.02
0.08*
1.00
13.Ln (TA)
0.10*
0.09*
-0.03
0.15*
-0.14*
0.07*
-0.04
0.14*
0.50*
0.24*
0.18*
0.03
1.00
14.Capex/TA
-0.05
-0.06*
0.00
-0.12*
0.02
0.04
0.06
0.02
-0.08*
-0.15*
-0.08*
-0.03
-0.19*
1.00
15.Cash/TA
0.12*
0.12*
0.02
-0.07*
0.07*
-0.08*
-0.01
-0.02
0.02
0.00
0.08*
-0.01
-0.18*
-0.12*
1.00
16.PPE/TA
-0.09*
-0.08*
0.01
0.03
0.15*
0.15*
0.03
0.03
-0.07*
-0.08*
-0.05
0.01
0.03
0.36*
-0.45*
1.00
17.R&D/TA
-0.03
-0.03
0.02
-0.02
-0.07*
-0.03
0.04
-0.01
-0.03
-0.03
-0.05
-0.02
-0.14*
-0.04
0.14*
-0.21*
1.00
18.Debt/TA
-0.03
0.00
0.04
0.00
0.00
-0.01
-0.02
0.02
0.10*
0.12*
0.01
-0.02
0.14*
-0.17*
-0.08*
-0.09*
-0.06
1.00
Findings
Investigating Proposition 1: Board–CEO Ties and Performance
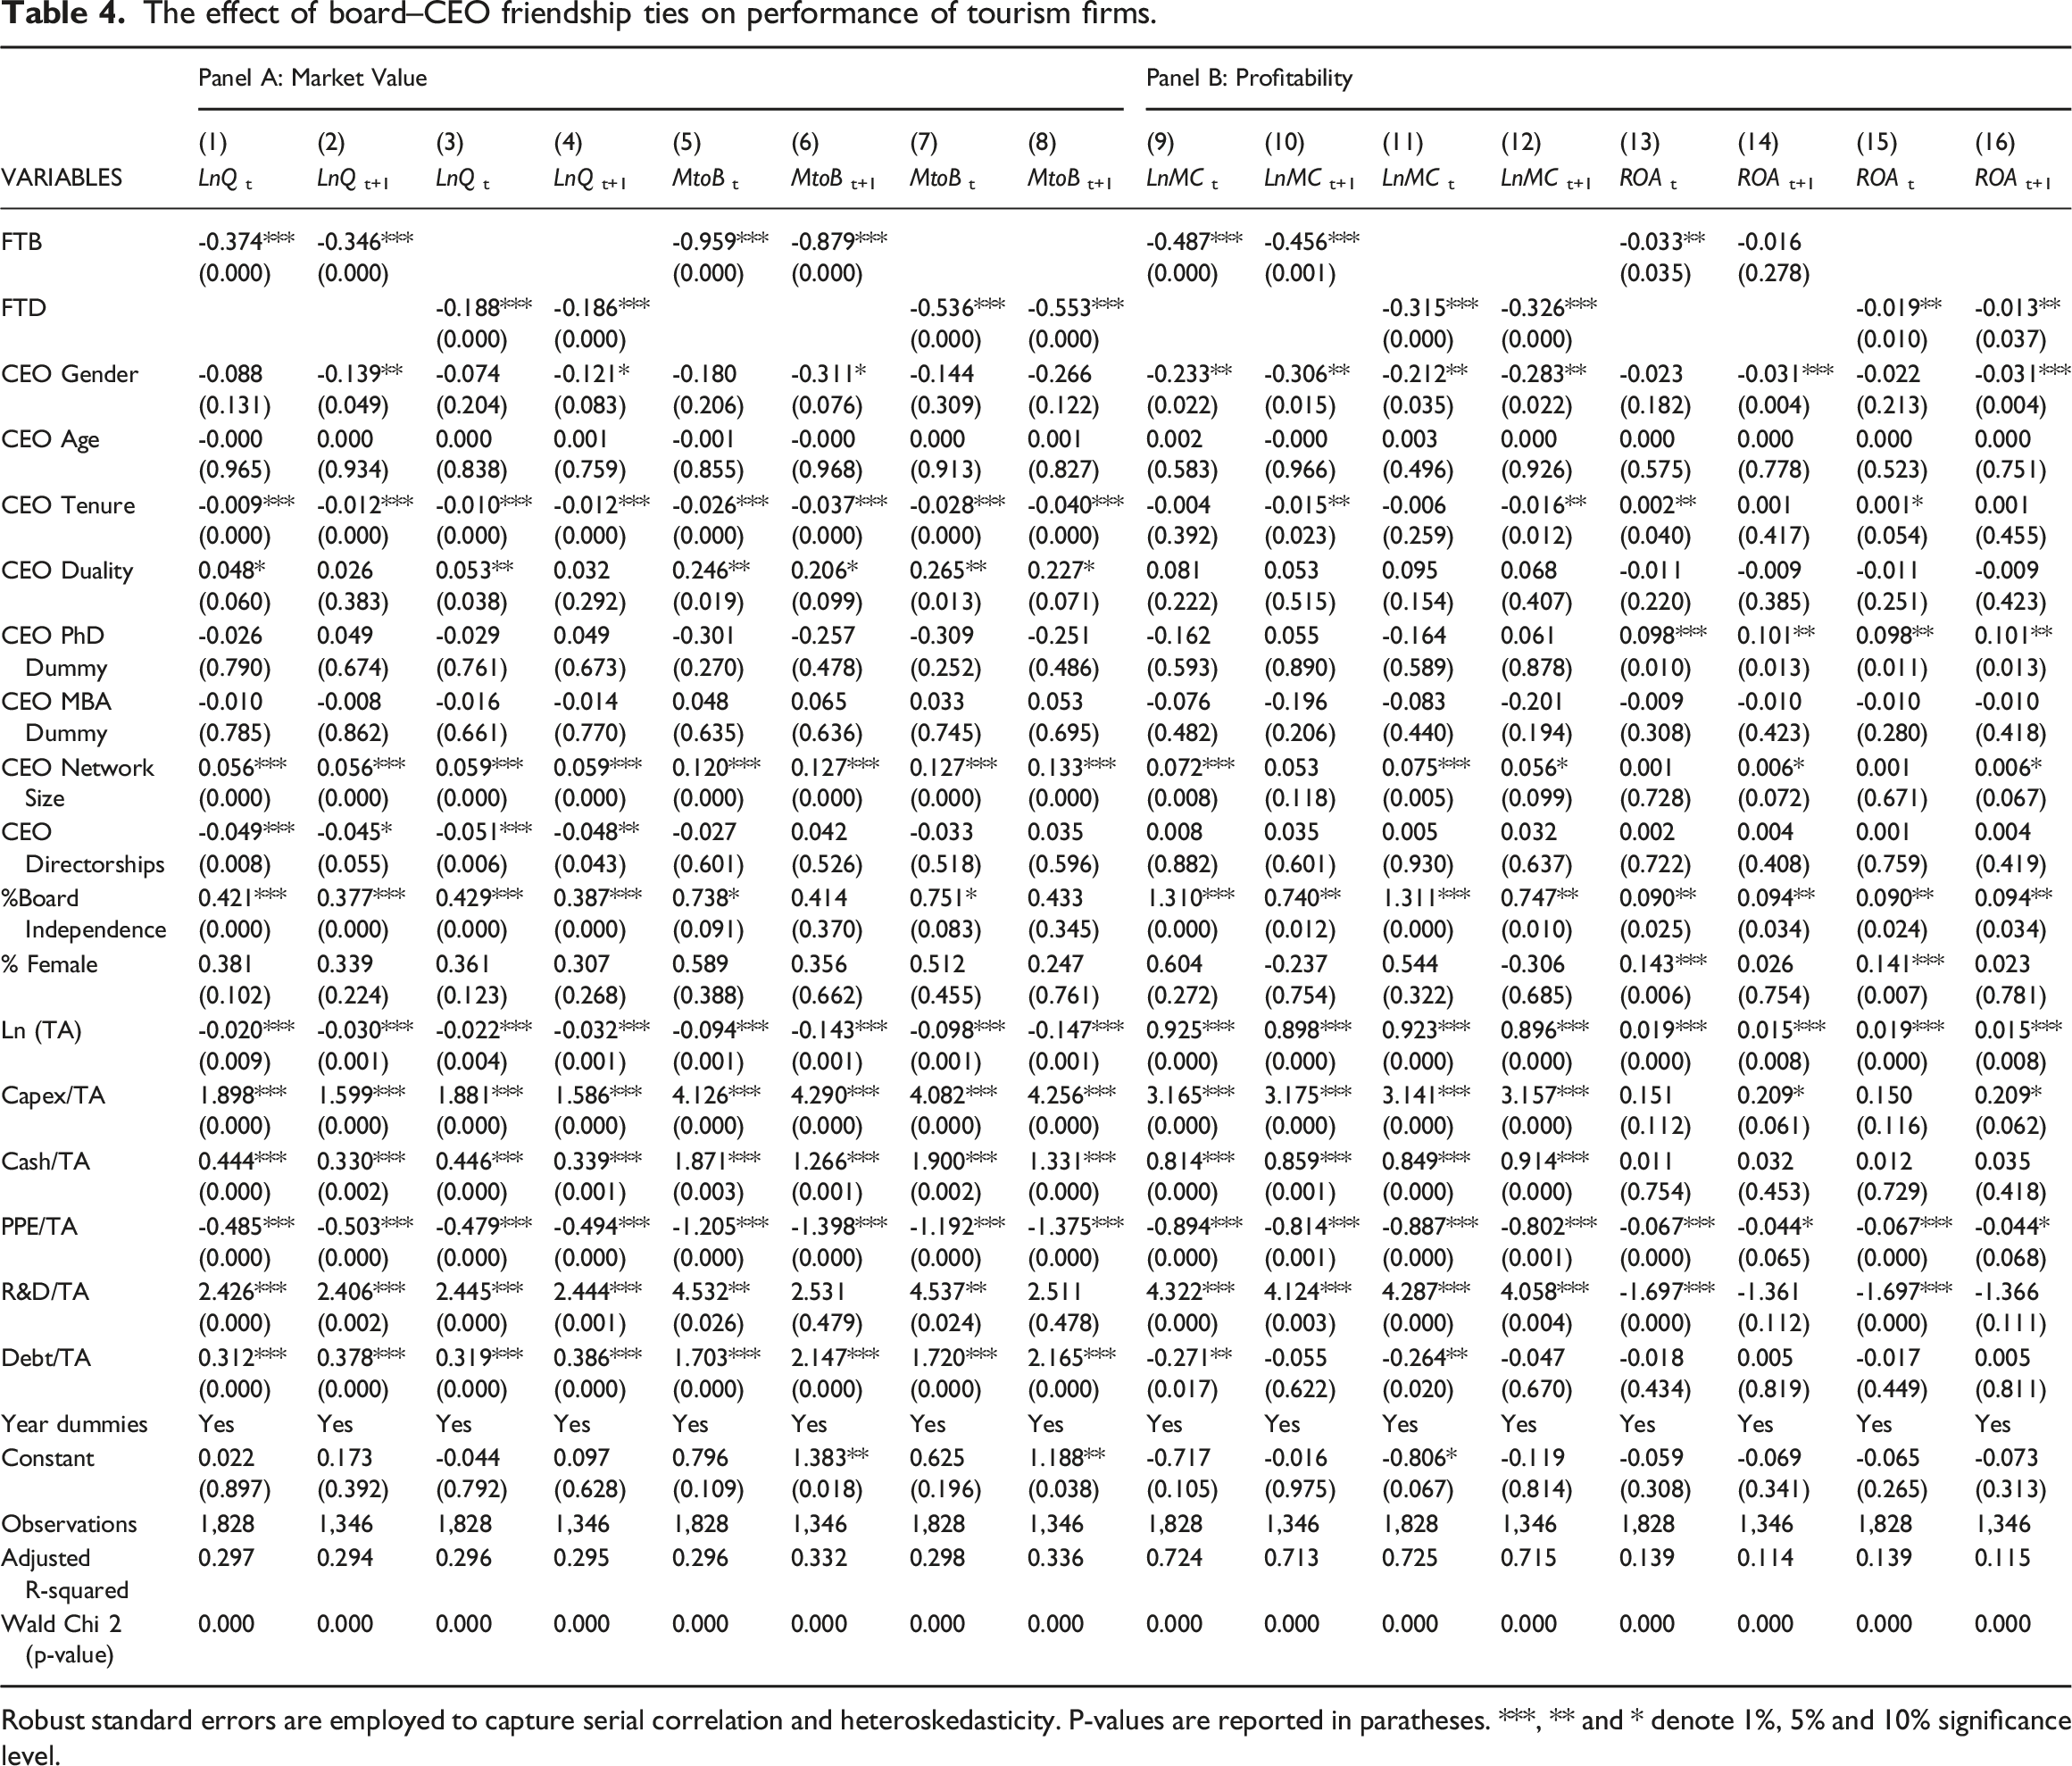
Table 4 reports the Ordinary Least Square regression results for the effect of board–CEO friendship ties on performance indicators of tourism companies. The results reveal that board–CEO social network ties are significant and negatively associated with firms' profitability and market valuation. This is evident in all models' negative and significant coefficients of FTB and FTD. The findings support Hypothesis 1, showing that board–CEO social network ties negatively affect firm profitability and market valuation. The resutls are consistent with the managerial power theory, which implies that board–CEO social network ties could increase the CEO’s control power over the boardroom through weakening the intensity of board monitoring and discipline (e.g. Fracassi & Tate, 2012; Finkelstein, 1992; Schmidt, 2015). In addition, such ties have an important implication on the fact that CEOs share same networks with other directors within the boardroom tend to have similar beliefs, attitudes, traits and strong psychological bond (Allan, 1979; Fan et al., 2019). Hence, they lead to a ‘heightened sense of trust and favourable interpretation of others’ action’ (Fan et al., 2019, p.3), which results in familiarity bias and lowers the quality of board monitoring and advisory effectiveness (Linck et al., 2008), and in turn, lowers the firm’s performance and market value. The coefficients of the control variables are consistent with prior research.
The effect of board–CEO friendship ties on performance of tourism firms.
Panel A: Market Value
Panel B: Profitability
(1)
(2)
(3)
(4)
(5)
(6)
(7)
(8)
(9)
(10)
(11)
(12)
(13)
(14)
(15)
(16)
VARIABLES
LnQt
LnQt+1
LnQt
LnQt+1
MtoBt
MtoBt+1
MtoBt
MtoBt+1
LnMCt
LnMCt+1
LnMCt
LnMCt+1
ROAt
ROAt+1
ROAt
ROAt+1
FTB
-0.374***
-0.346***
-0.959***
-0.879***
-0.487***
-0.456***
-0.033**
-0.016
(0.000)
(0.000)
(0.000)
(0.000)
(0.000)
(0.001)
(0.035)
(0.278)
FTD
-0.188***
-0.186***
-0.536***
-0.553***
-0.315***
-0.326***
-0.019**
-0.013**
(0.000)
(0.000)
(0.000)
(0.000)
(0.000)
(0.000)
(0.010)
(0.037)
CEO Gender
-0.088
-0.139**
-0.074
-0.121*
-0.180
-0.311*
-0.144
-0.266
-0.233**
-0.306**
-0.212**
-0.283**
-0.023
-0.031***
-0.022
-0.031***
(0.131)
(0.049)
(0.204)
(0.083)
(0.206)
(0.076)
(0.309)
(0.122)
(0.022)
(0.015)
(0.035)
(0.022)
(0.182)
(0.004)
(0.213)
(0.004)
CEO Age
-0.000
0.000
0.000
0.001
-0.001
-0.000
0.000
0.001
0.002
-0.000
0.003
0.000
0.000
0.000
0.000
0.000
(0.965)
(0.934)
(0.838)
(0.759)
(0.855)
(0.968)
(0.913)
(0.827)
(0.583)
(0.966)
(0.496)
(0.926)
(0.575)
(0.778)
(0.523)
(0.751)
CEO Tenure
-0.009***
-0.012***
-0.010***
-0.012***
-0.026***
-0.037***
-0.028***
-0.040***
-0.004
-0.015**
-0.006
-0.016**
0.002**
0.001
0.001*
0.001
(0.000)
(0.000)
(0.000)
(0.000)
(0.000)
(0.000)
(0.000)
(0.000)
(0.392)
(0.023)
(0.259)
(0.012)
(0.040)
(0.417)
(0.054)
(0.455)
CEO Duality
0.048*
0.026
0.053**
0.032
0.246**
0.206*
0.265**
0.227*
0.081
0.053
0.095
0.068
-0.011
-0.009
-0.011
-0.009
(0.060)
(0.383)
(0.038)
(0.292)
(0.019)
(0.099)
(0.013)
(0.071)
(0.222)
(0.515)
(0.154)
(0.407)
(0.220)
(0.385)
(0.251)
(0.423)
CEO PhD Dummy
-0.026
0.049
-0.029
0.049
-0.301
-0.257
-0.309
-0.251
-0.162
0.055
-0.164
0.061
0.098***
0.101**
0.098**
0.101**
(0.790)
(0.674)
(0.761)
(0.673)
(0.270)
(0.478)
(0.252)
(0.486)
(0.593)
(0.890)
(0.589)
(0.878)
(0.010)
(0.013)
(0.011)
(0.013)
CEO MBA Dummy
-0.010
-0.008
-0.016
-0.014
0.048
0.065
0.033
0.053
-0.076
-0.196
-0.083
-0.201
-0.009
-0.010
-0.010
-0.010
(0.785)
(0.862)
(0.661)
(0.770)
(0.635)
(0.636)
(0.745)
(0.695)
(0.482)
(0.206)
(0.440)
(0.194)
(0.308)
(0.423)
(0.280)
(0.418)
CEO Network Size
0.056***
0.056***
0.059***
0.059***
0.120***
0.127***
0.127***
0.133***
0.072***
0.053
0.075***
0.056*
0.001
0.006*
0.001
0.006*
(0.000)
(0.000)
(0.000)
(0.000)
(0.000)
(0.000)
(0.000)
(0.000)
(0.008)
(0.118)
(0.005)
(0.099)
(0.728)
(0.072)
(0.671)
(0.067)
CEO Directorships
-0.049***
-0.045*
-0.051***
-0.048**
-0.027
0.042
-0.033
0.035
0.008
0.035
0.005
0.032
0.002
0.004
0.001
0.004
(0.008)
(0.055)
(0.006)
(0.043)
(0.601)
(0.526)
(0.518)
(0.596)
(0.882)
(0.601)
(0.930)
(0.637)
(0.722)
(0.408)
(0.759)
(0.419)
%Board Independence
0.421***
0.377***
0.429***
0.387***
0.738*
0.414
0.751*
0.433
1.310***
0.740**
1.311***
0.747**
0.090**
0.094**
0.090**
0.094**
(0.000)
(0.000)
(0.000)
(0.000)
(0.091)
(0.370)
(0.083)
(0.345)
(0.000)
(0.012)
(0.000)
(0.010)
(0.025)
(0.034)
(0.024)
(0.034)
% Female
0.381
0.339
0.361
0.307
0.589
0.356
0.512
0.247
0.604
-0.237
0.544
-0.306
0.143***
0.026
0.141***
0.023
(0.102)
(0.224)
(0.123)
(0.268)
(0.388)
(0.662)
(0.455)
(0.761)
(0.272)
(0.754)
(0.322)
(0.685)
(0.006)
(0.754)
(0.007)
(0.781)
Ln (TA)
-0.020***
-0.030***
-0.022***
-0.032***
-0.094***
-0.143***
-0.098***
-0.147***
0.925***
0.898***
0.923***
0.896***
0.019***
0.015***
0.019***
0.015***
(0.009)
(0.001)
(0.004)
(0.001)
(0.001)
(0.001)
(0.001)
(0.001)
(0.000)
(0.000)
(0.000)
(0.000)
(0.000)
(0.008)
(0.000)
(0.008)
Capex/TA
1.898***
1.599***
1.881***
1.586***
4.126***
4.290***
4.082***
4.256***
3.165***
3.175***
3.141***
3.157***
0.151
0.209*
0.150
0.209*
(0.000)
(0.000)
(0.000)
(0.000)
(0.000)
(0.000)
(0.000)
(0.000)
(0.000)
(0.000)
(0.000)
(0.000)
(0.112)
(0.061)
(0.116)
(0.062)
Cash/TA
0.444***
0.330***
0.446***
0.339***
1.871***
1.266***
1.900***
1.331***
0.814***
0.859***
0.849***
0.914***
0.011
0.032
0.012
0.035
(0.000)
(0.002)
(0.000)
(0.001)
(0.003)
(0.001)
(0.002)
(0.000)
(0.000)
(0.001)
(0.000)
(0.000)
(0.754)
(0.453)
(0.729)
(0.418)
PPE/TA
-0.485***
-0.503***
-0.479***
-0.494***
-1.205***
-1.398***
-1.192***
-1.375***
-0.894***
-0.814***
-0.887***
-0.802***
-0.067***
-0.044*
-0.067***
-0.044*
(0.000)
(0.000)
(0.000)
(0.000)
(0.000)
(0.000)
(0.000)
(0.000)
(0.000)
(0.001)
(0.000)
(0.001)
(0.000)
(0.065)
(0.000)
(0.068)
R&D/TA
2.426***
2.406***
2.445***
2.444***
4.532**
2.531
4.537**
2.511
4.322***
4.124***
4.287***
4.058***
-1.697***
-1.361
-1.697***
-1.366
(0.000)
(0.002)
(0.000)
(0.001)
(0.026)
(0.479)
(0.024)
(0.478)
(0.000)
(0.003)
(0.000)
(0.004)
(0.000)
(0.112)
(0.000)
(0.111)
Debt/TA
0.312***
0.378***
0.319***
0.386***
1.703***
2.147***
1.720***
2.165***
-0.271**
-0.055
-0.264**
-0.047
-0.018
0.005
-0.017
0.005
(0.000)
(0.000)
(0.000)
(0.000)
(0.000)
(0.000)
(0.000)
(0.000)
(0.017)
(0.622)
(0.020)
(0.670)
(0.434)
(0.819)
(0.449)
(0.811)
Year dummies
Yes
Yes
Yes
Yes
Yes
Yes
Yes
Yes
Yes
Yes
Yes
Yes
Yes
Yes
Yes
Yes
Constant
0.022
0.173
-0.044
0.097
0.796
1.383**
0.625
1.188**
-0.717
-0.016
-0.806*
-0.119
-0.059
-0.069
-0.065
-0.073
(0.897)
(0.392)
(0.792)
(0.628)
(0.109)
(0.018)
(0.196)
(0.038)
(0.105)
(0.975)
(0.067)
(0.814)
(0.308)
(0.341)
(0.265)
(0.313)
Observations
1,828
1,346
1,828
1,346
1,828
1,346
1,828
1,346
1,828
1,346
1,828
1,346
1,828
1,346
1,828
1,346
Adjusted R-squared
0.297
0.294
0.296
0.295
0.296
0.332
0.298
0.336
0.724
0.713
0.725
0.715
0.139
0.114
0.139
0.115
Wald Chi 2 (p-value)
0.000
0.000
0.000
0.000
0.000
0.000
0.000
0.000
0.000
0.000
0.000
0.000
0.000
0.000
0.000
0.000
Robust standard errors are employed to capture serial correlation and heteroskedasticity. P-values are reported in paratheses. ***, ** and * denote 1%, 5% and 10% significance level.
The findings have important economic implications. Typically, a 1% increase in FTB leads to a decrease of 0.374% in LnQ, 0.959% in MtoB, 0.487% in LnMC, and 0.033% in ROA. They imply that the market value of a firm, its ability to raise capital and its performance are significantly negatively affected when the proportion of CEO with social ties with the board memners are higher. Similarly, a rise of 1% in FTD results in a fall of 0.188% in LnQ, 0.536% in MtoB, 0.315% in LnMC and 0.019% in ROA. Both these sets of results imply that the breadth and the depth of social connections have considerable implications for the firm’s performcance, with the former having much larger effects. They indicate that the lack of independence between CEO and board members can seriously inhibit the firm’s ability to achieve a reasonable return on assets and seriously affecting its capacity for raising capital and hence, investment and long-term growth. Keeping such ties to a minimum on the other hand, will improve the overall performance of the firm and increase its resilience and potential for long term survival.
Investigating Proposition 2: Board–CEO Ties and Risk
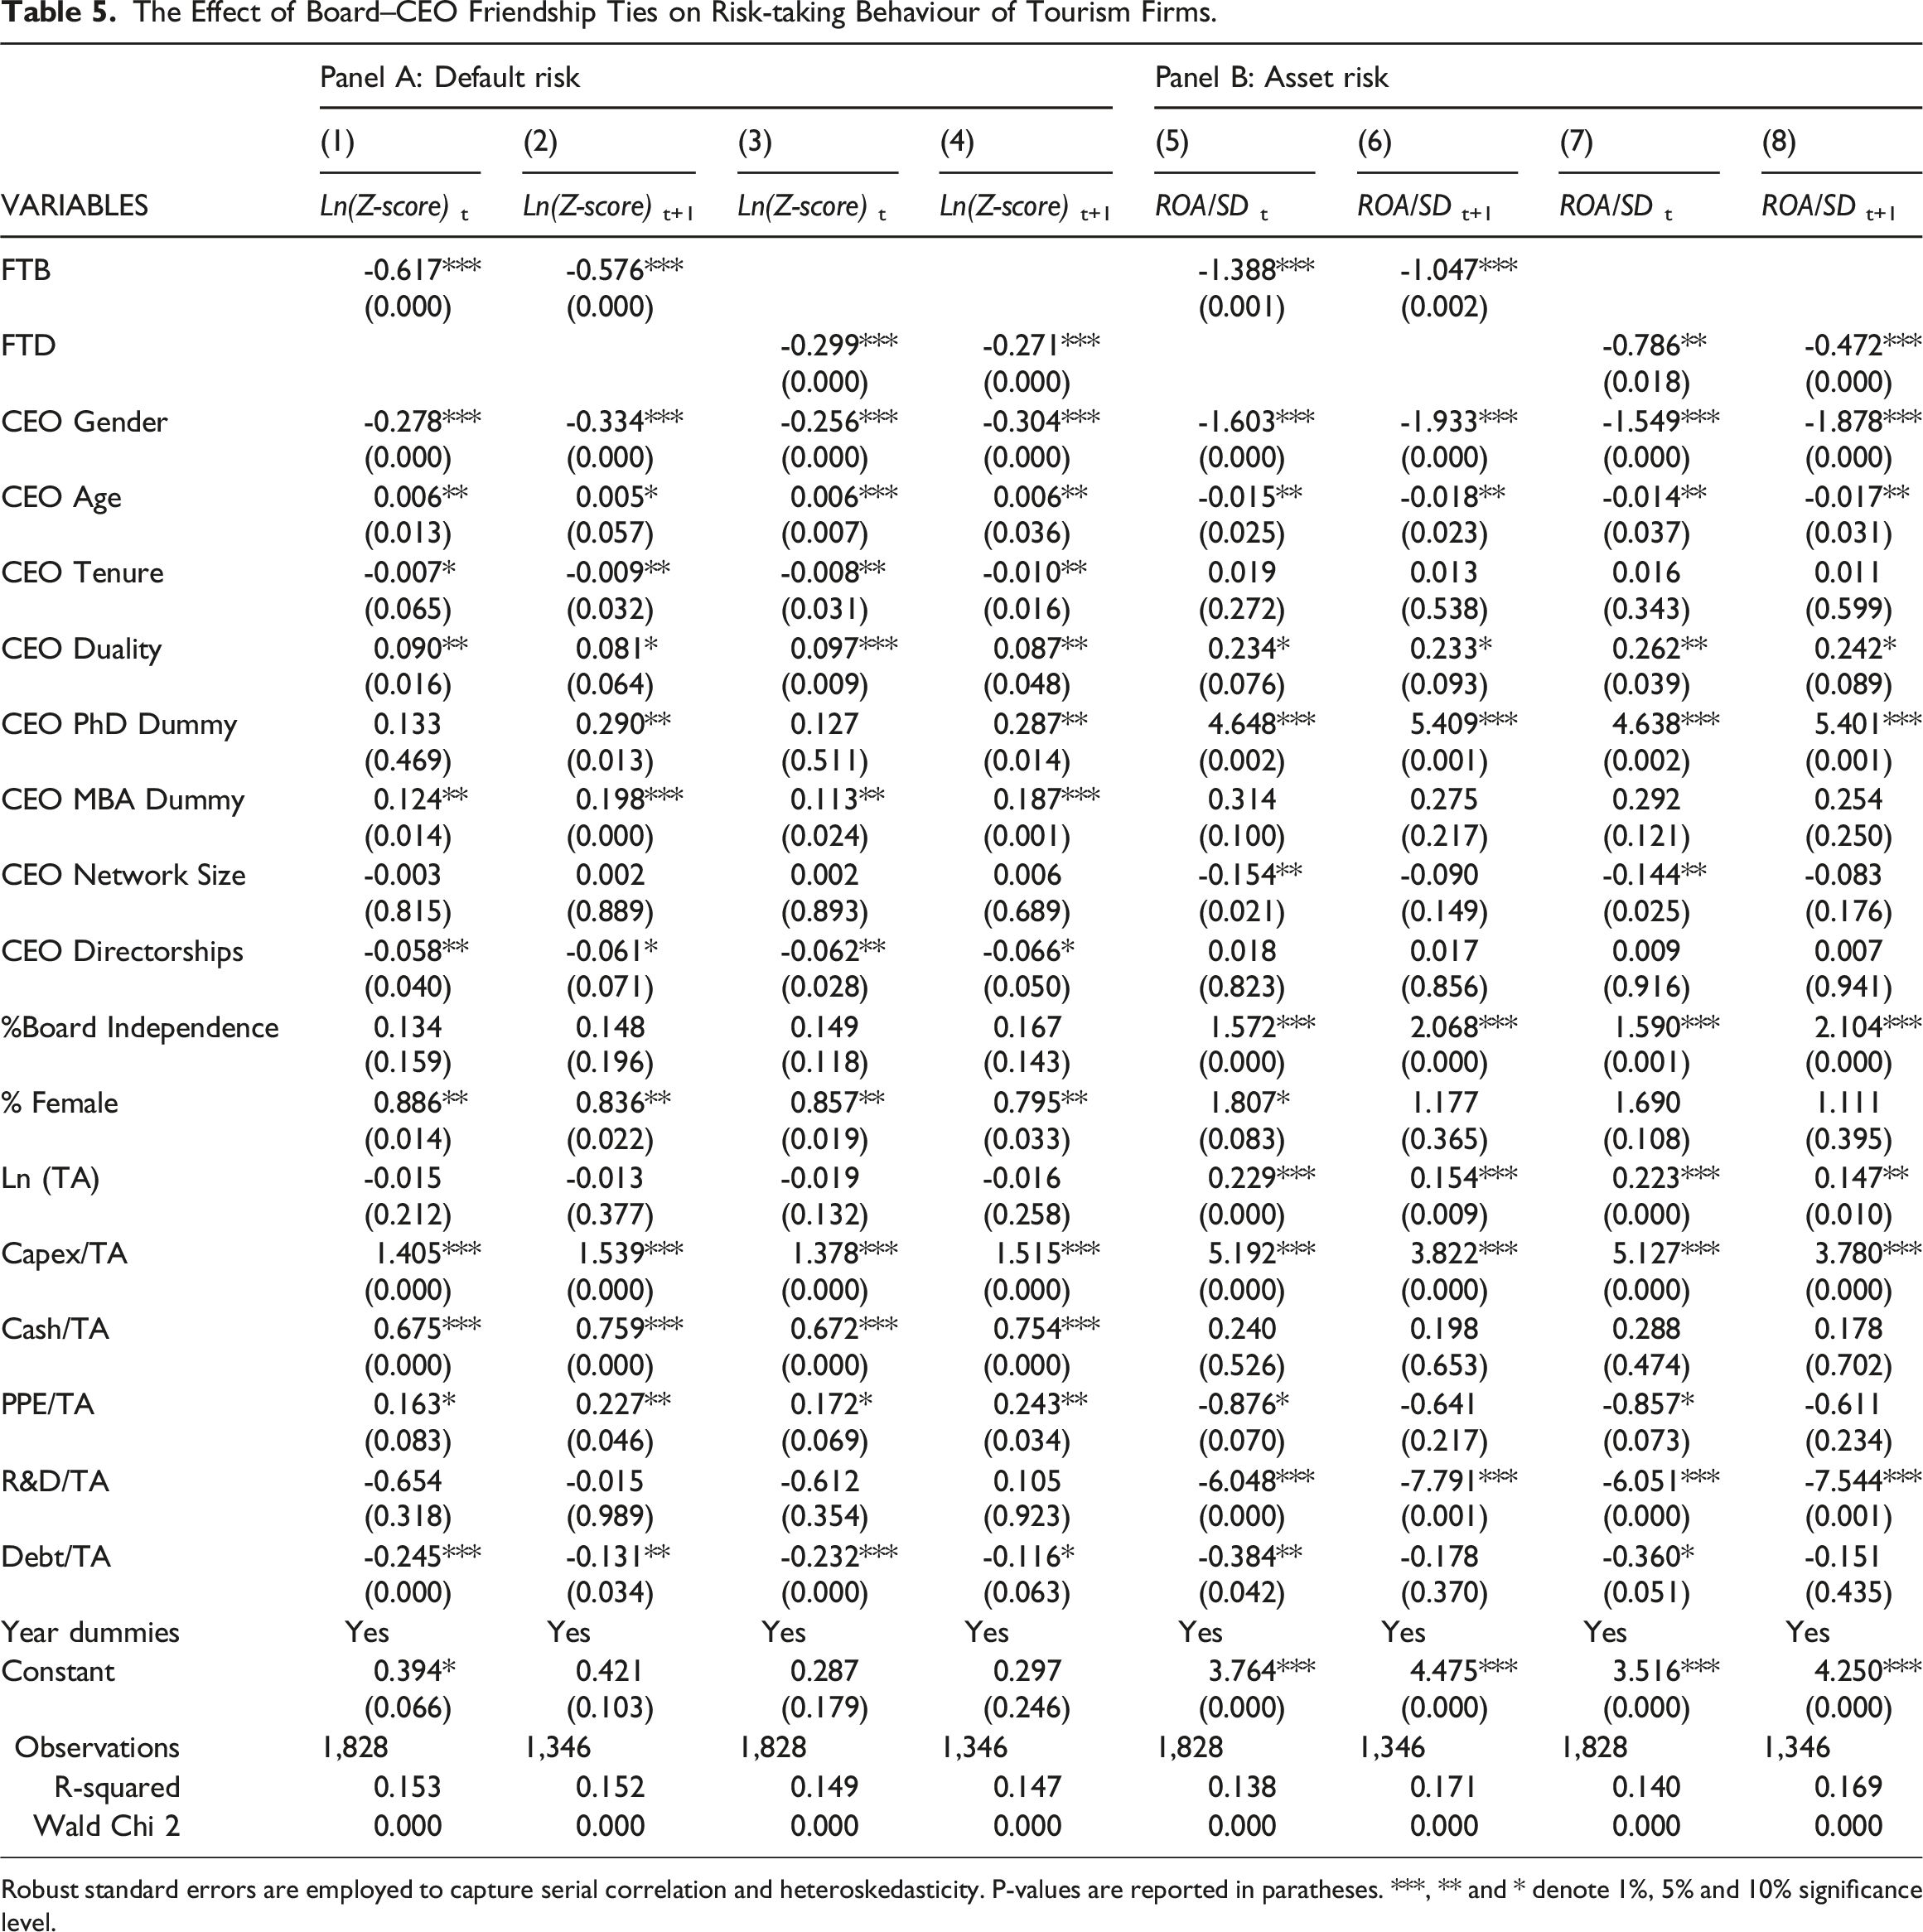
Table 5 reports the Ordinary Least Square results for Equation (1). The findings reveal that both measures of board–CEO friendship ties are related to higher default risk and asset risk. This is evident by the negative and significant coefficients of both FTB and FTD across all models. The results are not only consistent with the power theory mentioned earlier but also in line with the sociological perspective (e.g. Tsui et al., 1992; Silver, 1990). The latter suggests that friendship ties based on social networks between the CEOs and board directors can help the CEOs to increase their mutual caring, trust and positive impression, and the tolerance of risk for failure, simply because these CEOs can have lower career risk. This, in turn, leads to higher risk-taking behaviours. Regarding economic significance, we find considerable effects that a 1% increase in FTB leads to a decrease of 0.617% in Ln(Z-score) and 1.388% in ROA/SD. These effects are considerable and imply that a firm with a 1% higher proportion of directors having social and friendship ties with the CEO could be headed for bankruptcy by a higher chance. Similarly, a rise of 1% in FTD results in a fall of 0.229% in Ln(Z-score) and 0.789% in ROA/SD. These results imply that both the breadth and the depth of board–CEO ties have considerable economic implications. Yet, the negative effect of FTB on the market value and profibality of firms exceeds those of FTD.
The Effect of Board–CEO Friendship Ties on Risk-taking Behaviour of Tourism Firms.
Panel A: Default risk
Panel B: Asset risk
(1)
(2)
(3)
(4)
(5)
(6)
(7)
(8)
VARIABLES
Ln(Z-score)t
Ln(Z-score)t+1
Ln(Z-score)t
Ln(Z-score)t+1
ROA/SDt
ROA/SDt+1
ROA/SDt
ROA/SDt+1
FTB
-0.617***
-0.576***
-1.388***
-1.047***
(0.000)
(0.000)
(0.001)
(0.002)
FTD
-0.299***
-0.271***
-0.786**
-0.472***
(0.000)
(0.000)
(0.018)
(0.000)
CEO Gender
-0.278***
-0.334***
-0.256***
-0.304***
-1.603***
-1.933***
-1.549***
-1.878***
(0.000)
(0.000)
(0.000)
(0.000)
(0.000)
(0.000)
(0.000)
(0.000)
CEO Age
0.006**
0.005*
0.006***
0.006**
-0.015**
-0.018**
-0.014**
-0.017**
(0.013)
(0.057)
(0.007)
(0.036)
(0.025)
(0.023)
(0.037)
(0.031)
CEO Tenure
-0.007*
-0.009**
-0.008**
-0.010**
0.019
0.013
0.016
0.011
(0.065)
(0.032)
(0.031)
(0.016)
(0.272)
(0.538)
(0.343)
(0.599)
CEO Duality
0.090**
0.081*
0.097***
0.087**
0.234*
0.233*
0.262**
0.242*
(0.016)
(0.064)
(0.009)
(0.048)
(0.076)
(0.093)
(0.039)
(0.089)
CEO PhD Dummy
0.133
0.290**
0.127
0.287**
4.648***
5.409***
4.638***
5.401***
(0.469)
(0.013)
(0.511)
(0.014)
(0.002)
(0.001)
(0.002)
(0.001)
CEO MBA Dummy
0.124**
0.198***
0.113**
0.187***
0.314
0.275
0.292
0.254
(0.014)
(0.000)
(0.024)
(0.001)
(0.100)
(0.217)
(0.121)
(0.250)
CEO Network Size
-0.003
0.002
0.002
0.006
-0.154**
-0.090
-0.144**
-0.083
(0.815)
(0.889)
(0.893)
(0.689)
(0.021)
(0.149)
(0.025)
(0.176)
CEO Directorships
-0.058**
-0.061*
-0.062**
-0.066*
0.018
0.017
0.009
0.007
(0.040)
(0.071)
(0.028)
(0.050)
(0.823)
(0.856)
(0.916)
(0.941)
%Board Independence
0.134
0.148
0.149
0.167
1.572***
2.068***
1.590***
2.104***
(0.159)
(0.196)
(0.118)
(0.143)
(0.000)
(0.000)
(0.001)
(0.000)
% Female
0.886**
0.836**
0.857**
0.795**
1.807*
1.177
1.690
1.111
(0.014)
(0.022)
(0.019)
(0.033)
(0.083)
(0.365)
(0.108)
(0.395)
Ln (TA)
-0.015
-0.013
-0.019
-0.016
0.229***
0.154***
0.223***
0.147**
(0.212)
(0.377)
(0.132)
(0.258)
(0.000)
(0.009)
(0.000)
(0.010)
Capex/TA
1.405***
1.539***
1.378***
1.515***
5.192***
3.822***
5.127***
3.780***
(0.000)
(0.000)
(0.000)
(0.000)
(0.000)
(0.000)
(0.000)
(0.000)
Cash/TA
0.675***
0.759***
0.672***
0.754***
0.240
0.198
0.288
0.178
(0.000)
(0.000)
(0.000)
(0.000)
(0.526)
(0.653)
(0.474)
(0.702)
PPE/TA
0.163*
0.227**
0.172*
0.243**
-0.876*
-0.641
-0.857*
-0.611
(0.083)
(0.046)
(0.069)
(0.034)
(0.070)
(0.217)
(0.073)
(0.234)
R&D/TA
-0.654
-0.015
-0.612
0.105
-6.048***
-7.791***
-6.051***
-7.544***
(0.318)
(0.989)
(0.354)
(0.923)
(0.000)
(0.001)
(0.000)
(0.001)
Debt/TA
-0.245***
-0.131**
-0.232***
-0.116*
-0.384**
-0.178
-0.360*
-0.151
(0.000)
(0.034)
(0.000)
(0.063)
(0.042)
(0.370)
(0.051)
(0.435)
Year dummies
Yes
Yes
Yes
Yes
Yes
Yes
Yes
Yes
Constant
0.394*
0.421
0.287
0.297
3.764***
4.475***
3.516***
4.250***
(0.066)
(0.103)
(0.179)
(0.246)
(0.000)
(0.000)
(0.000)
(0.000)
Observations
1,828
1,346
1,828
1,346
1,828
1,346
1,828
1,346
R-squared
0.153
0.152
0.149
0.147
0.138
0.171
0.140
0.169
Wald Chi 2
0.000
0.000
0.000
0.000
0.000
0.000
0.000
0.000
Robust standard errors are employed to capture serial correlation and heteroskedasticity. P-values are reported in paratheses. ***, ** and * denote 1%, 5% and 10% significance level.
Regarding the control variables, it is found that firms with older CEOs tend to exhibit lower default risk, while those with longer tenures show higher risk. Furthermore, firms where the CEO served as the Chairman, showed an increase in default and asset risks. This is due to CEOs' having more power and control. Interestingly, CEOs with more directorships are likely to increase firms' default risk. Moreover, more independent boards tend to be related to lower asset risk.
Controlling for sub-sectors and states
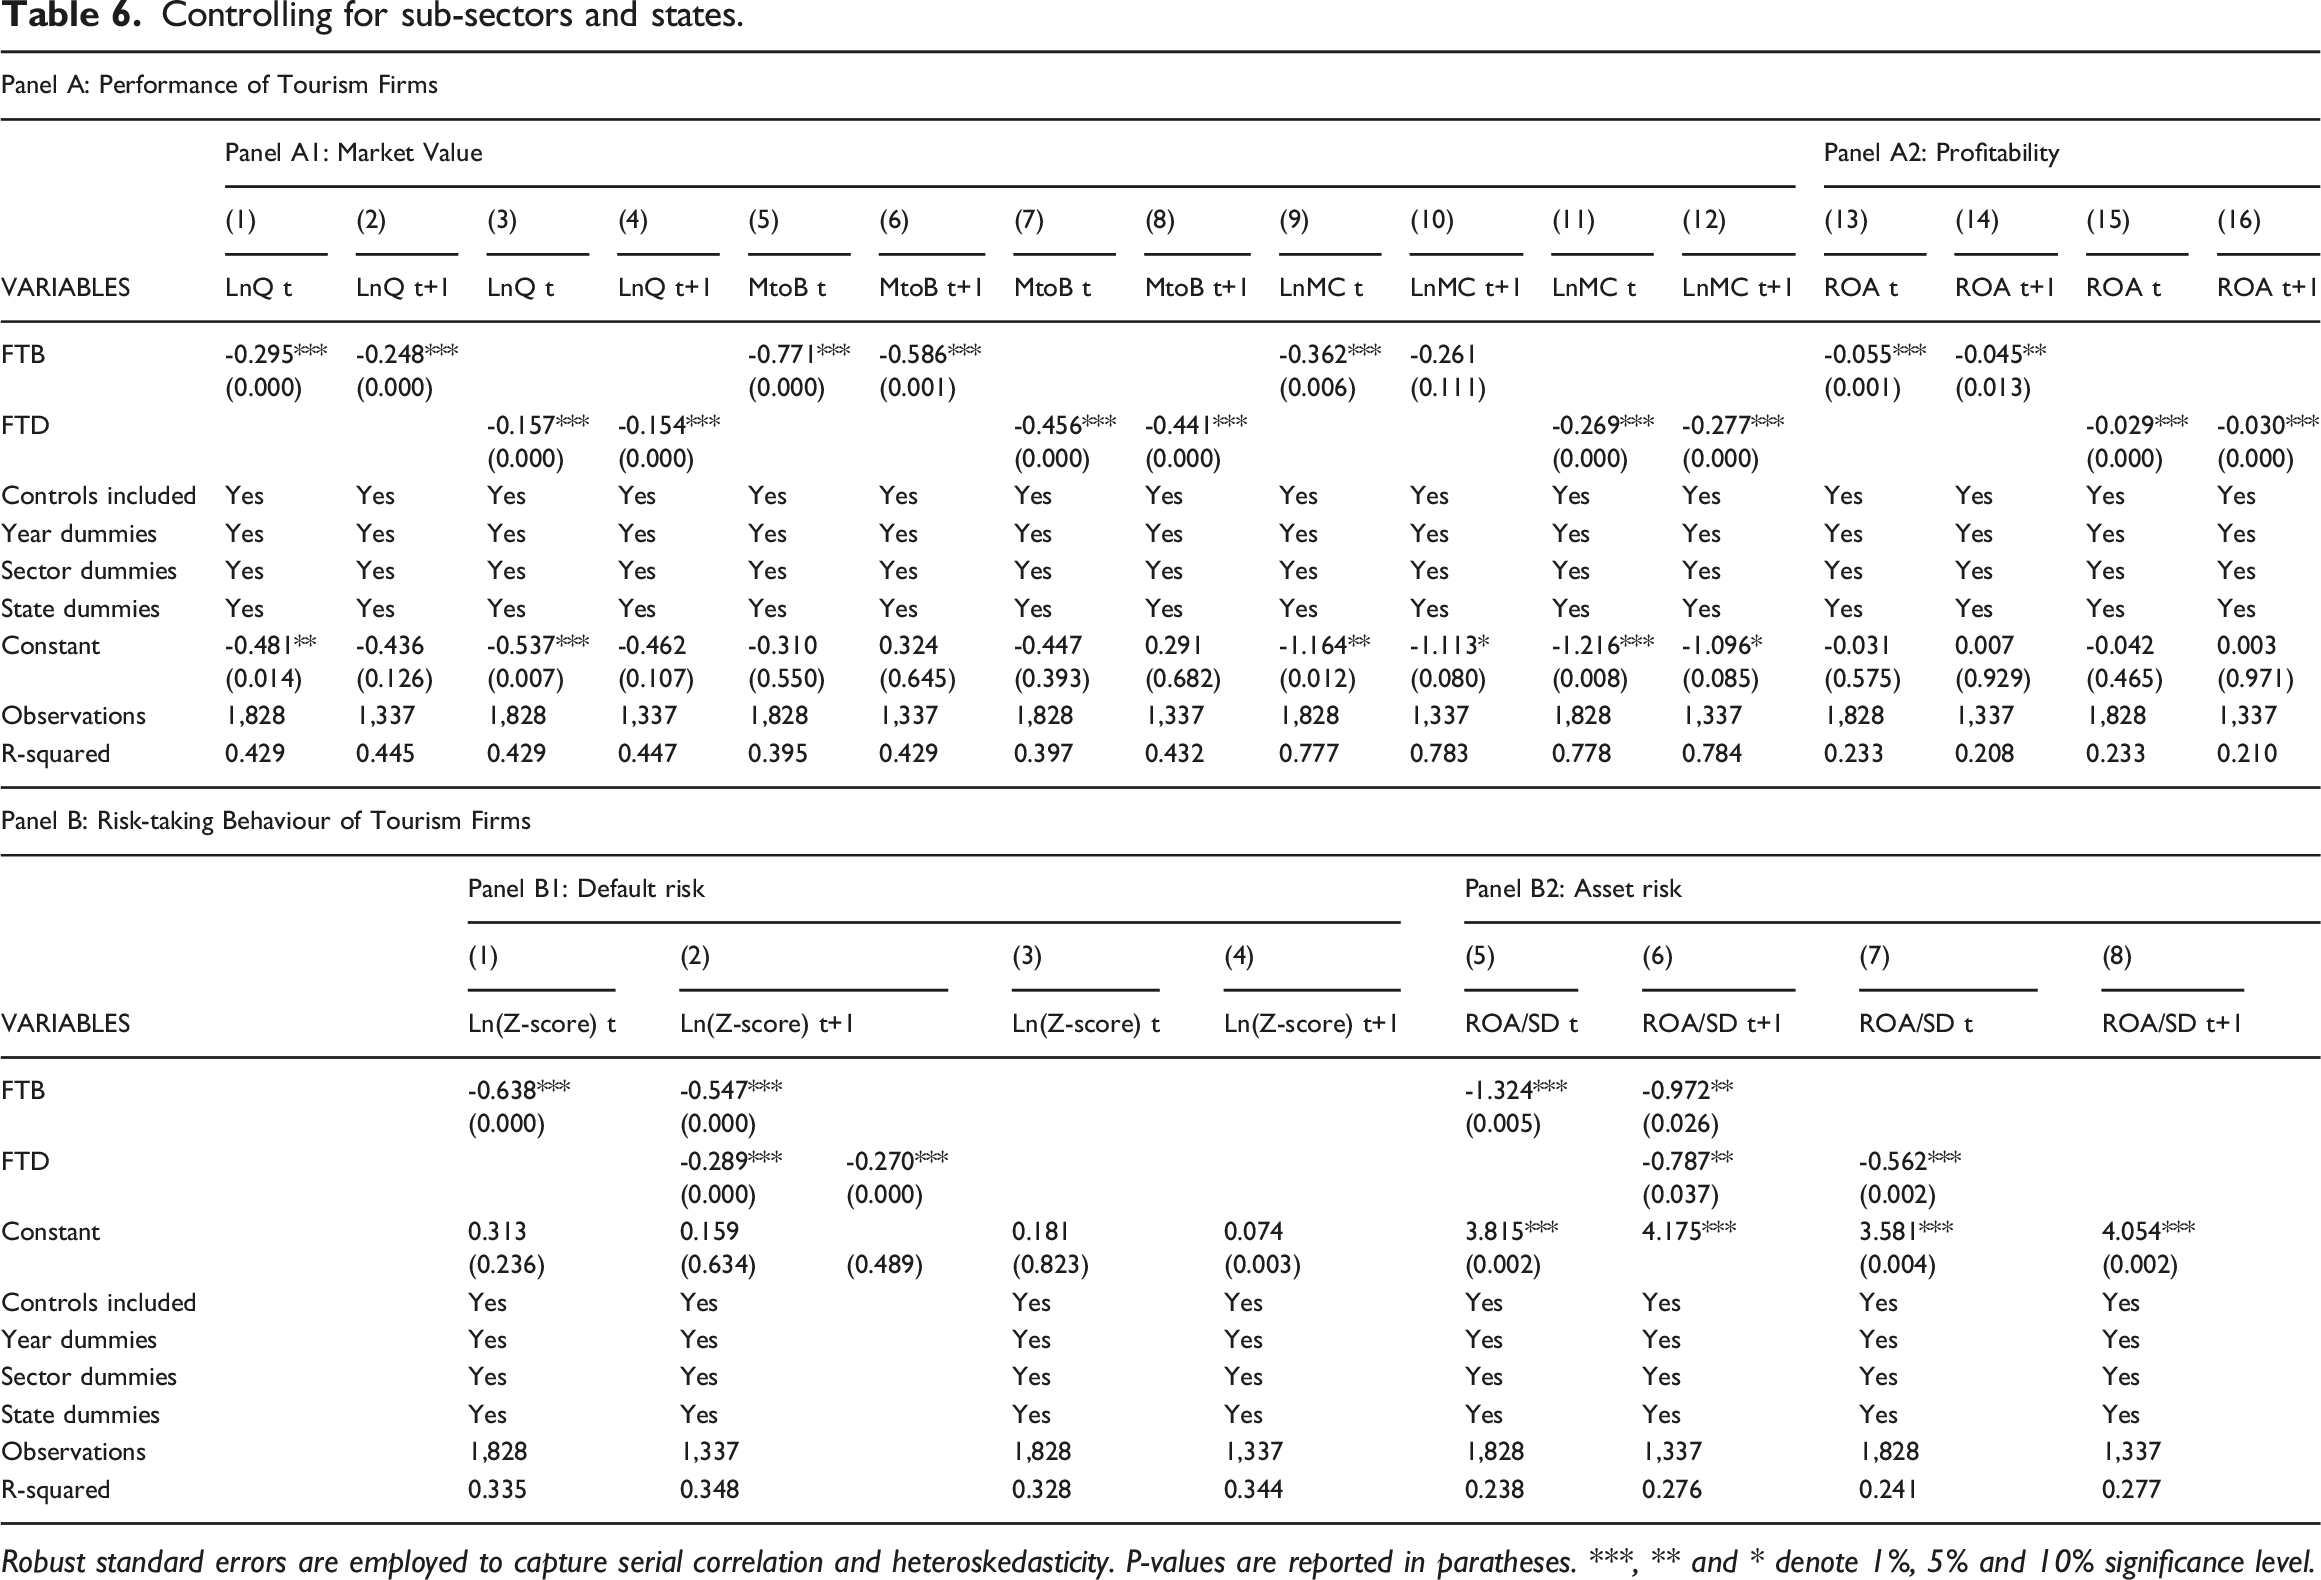
Next, we examine the relationship between board–CEO social network ties and performance/risk of tourism firms by adding dummies of sub-sectors (hotels, airlines, restaurants, etc.) and regions (i.e. states). Our sample's firms are located in 34 US states. They are Arizona, California, Colorado, Connecticut, Delaware, Florida, Georgia, Hawaii, Idaho, Indiana, Kentucky, Massachusetts, Maryland, Michigan, Minnesota, Missouri, North Carolina, New Hampshire, New Jersey, Nevada, New York, Ohio, Oklahoma, Oregon, Pennsylvania, Rhode Island, South Carolina, Tennessee, Texas, Utah, Virginia, Washington, Wisconsin and West Virginia. Results are reported in Table 6 (Panel A and B), showing that our main findings in Tables 4 and 5 keep relatively unchanged after controlling for sub-sectors and state fixed effects.
Controlling for sub-sectors and states.
Panel A: Performance of Tourism Firms
Panel A1: Market Value
Panel A2: Profitability
(1)
(2)
(3)
(4)
(5)
(6)
(7)
(8)
(9)
(10)
(11)
(12)
(13)
(14)
(15)
(16)
VARIABLES
LnQ t
LnQ t+1
LnQ t
LnQ t+1
MtoB t
MtoB t+1
MtoB t
MtoB t+1
LnMC t
LnMC t+1
LnMC t
LnMC t+1
ROA t
ROA t+1
ROA t
ROA t+1
FTB
-0.295***
-0.248***
-0.771***
-0.586***
-0.362***
-0.261
-0.055***
-0.045**
(0.000)
(0.000)
(0.000)
(0.001)
(0.006)
(0.111)
(0.001)
(0.013)
FTD
-0.157***
-0.154***
-0.456***
-0.441***
-0.269***
-0.277***
-0.029***
-0.030***
(0.000)
(0.000)
(0.000)
(0.000)
(0.000)
(0.000)
(0.000)
(0.000)
Controls included
Yes
Yes
Yes
Yes
Yes
Yes
Yes
Yes
Yes
Yes
Yes
Yes
Yes
Yes
Yes
Yes
Year dummies
Yes
Yes
Yes
Yes
Yes
Yes
Yes
Yes
Yes
Yes
Yes
Yes
Yes
Yes
Yes
Yes
Sector dummies
Yes
Yes
Yes
Yes
Yes
Yes
Yes
Yes
Yes
Yes
Yes
Yes
Yes
Yes
Yes
Yes
State dummies
Yes
Yes
Yes
Yes
Yes
Yes
Yes
Yes
Yes
Yes
Yes
Yes
Yes
Yes
Yes
Yes
Constant
-0.481**
-0.436
-0.537***
-0.462
-0.310
0.324
-0.447
0.291
-1.164**
-1.113*
-1.216***
-1.096*
-0.031
0.007
-0.042
0.003
(0.014)
(0.126)
(0.007)
(0.107)
(0.550)
(0.645)
(0.393)
(0.682)
(0.012)
(0.080)
(0.008)
(0.085)
(0.575)
(0.929)
(0.465)
(0.971)
Observations
1,828
1,337
1,828
1,337
1,828
1,337
1,828
1,337
1,828
1,337
1,828
1,337
1,828
1,337
1,828
1,337
R-squared
0.429
0.445
0.429
0.447
0.395
0.429
0.397
0.432
0.777
0.783
0.778
0.784
0.233
0.208
0.233
0.210
Panel B: Risk-taking Behaviour of Tourism Firms
Panel B1: Default risk
Panel B2: Asset risk
(1)
(2)
(3)
(4)
(5)
(6)
(7)
(8)
VARIABLES
Ln(Z-score) t
Ln(Z-score) t+1
Ln(Z-score) t
Ln(Z-score) t+1
ROA/SD t
ROA/SD t+1
ROA/SD t
ROA/SD t+1
FTB
-0.638***
-0.547***
-1.324***
-0.972**
(0.000)
(0.000)
(0.005)
(0.026)
FTD
-0.289***
-0.270***
-0.787**
-0.562***
(0.000)
(0.000)
(0.037)
(0.002)
Constant
0.313
0.159
0.181
0.074
3.815***
4.175***
3.581***
4.054***
(0.236)
(0.634)
(0.489)
(0.823)
(0.003)
(0.002)
(0.004)
(0.002)
Controls included
Yes
Yes
Yes
Yes
Yes
Yes
Yes
Yes
Year dummies
Yes
Yes
Yes
Yes
Yes
Yes
Yes
Yes
Sector dummies
Yes
Yes
Yes
Yes
Yes
Yes
Yes
Yes
State dummies
Yes
Yes
Yes
Yes
Yes
Yes
Yes
Yes
Observations
1,828
1,337
1,828
1,337
1,828
1,337
1,828
1,337
R-squared
0.335
0.348
0.328
0.344
0.238
0.276
0.241
0.277
Robust standard errors are employed to capture serial correlation and heteroskedasticity. P-values are reported in paratheses. ***, ** and * denote 1%, 5% and 10% significance level.
The Effect of external shocks (Covid-19 Pandemic)
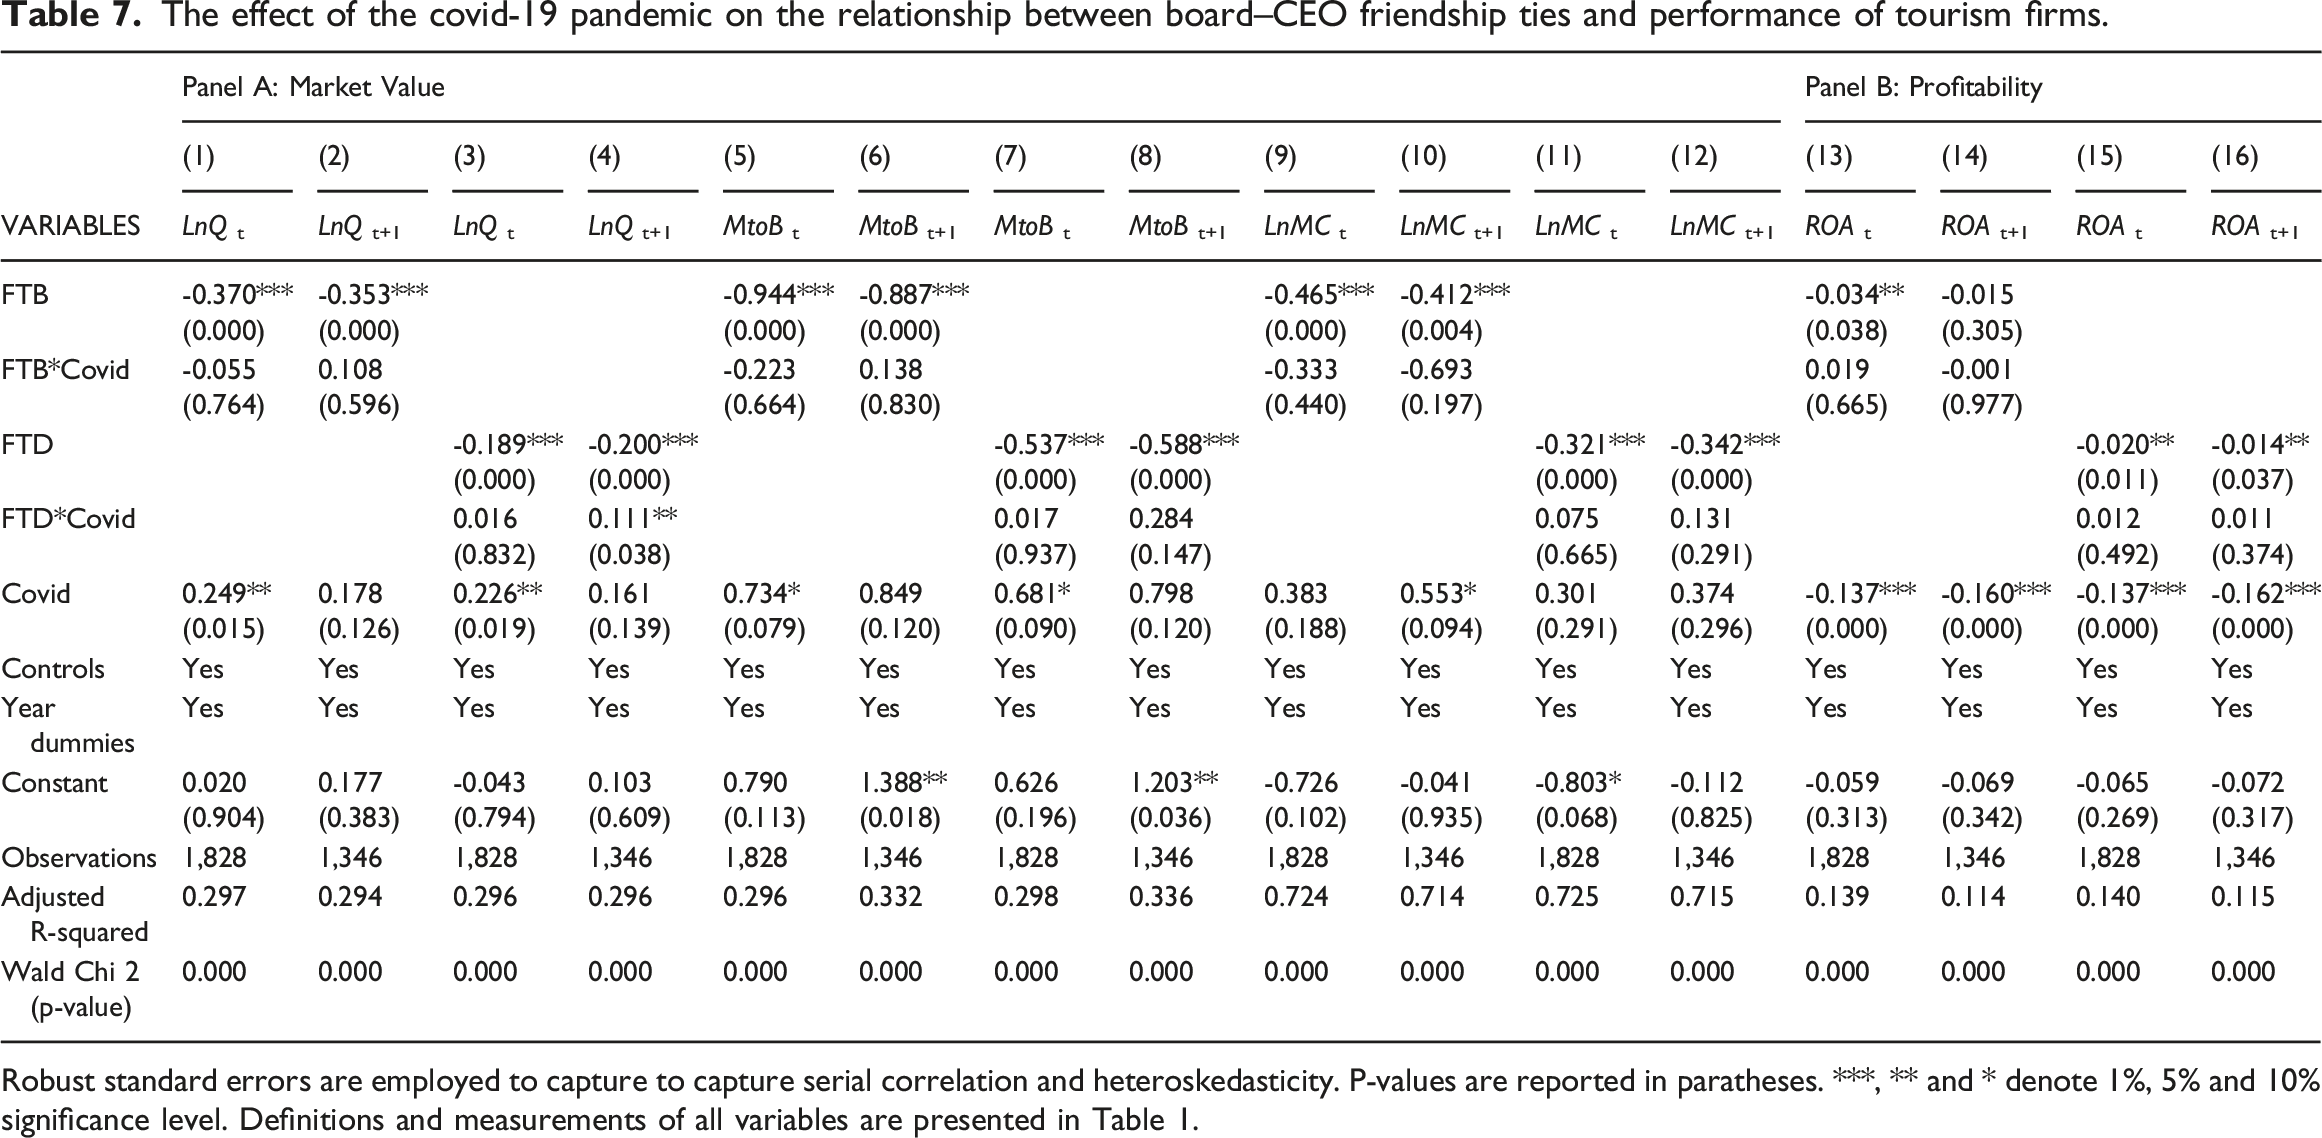
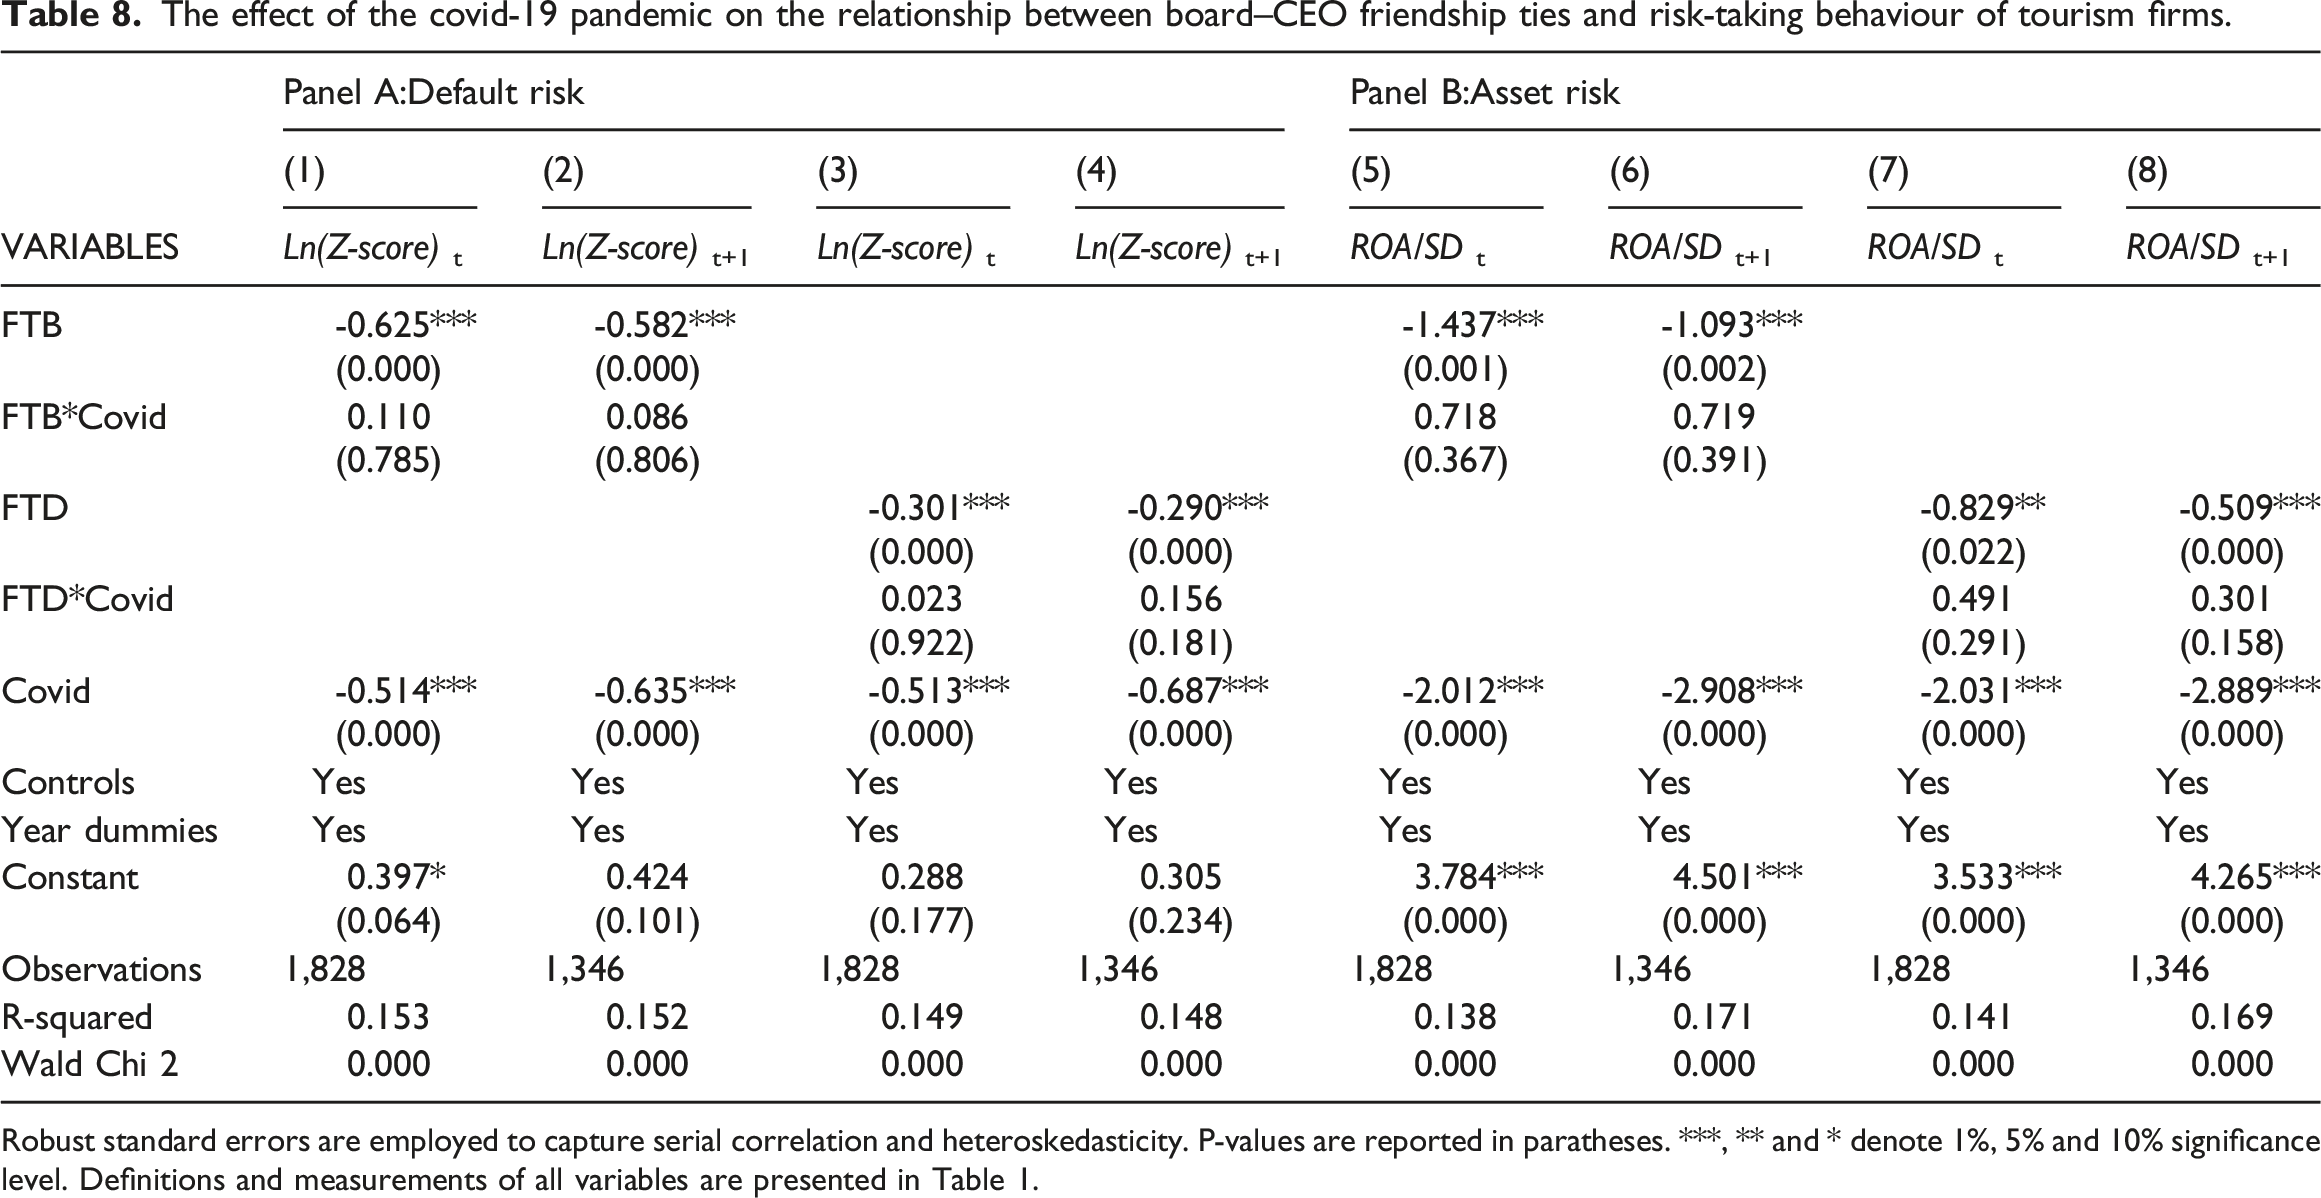
We next consider the potential effect of the Covid-19 pandemic on the link between board–CEO friendship ties and performance/risk indicators. These are reported in Tables 7 and Table 8, respectively. We create two new variables (FTB*Covid; FTD *Covid) by interacting the variables of interest with a COVID dummy factor (i.e. taking the value of 1 if the observed year is 2020 and 0 otherwise). We find that the effects of these new variables are insignificant. The current results imply that despite the increased vulnerability of firms during the pandemic, the negative effect of CEO–board ties continues to prevail on firms’ performances. However, it is worth with noting that the impact of COVID-19 may not occur instantly. Therefore, we suggest future studies revisit the tests to see the longer term effect of the pandemic.
The effect of the covid-19 pandemic on the relationship between board–CEO friendship ties and performance of tourism firms.
Panel A: Market Value
Panel B: Profitability
(1)
(2)
(3)
(4)
(5)
(6)
(7)
(8)
(9)
(10)
(11)
(12)
(13)
(14)
(15)
(16)
VARIABLES
LnQt
LnQt+1
LnQt
LnQt+1
MtoBt
MtoBt+1
MtoBt
MtoBt+1
LnMCt
LnMCt+1
LnMCt
LnMCt+1
ROAt
ROAt+1
ROAt
ROAt+1
FTB
-0.370***
-0.353***
-0.944***
-0.887***
-0.465***
-0.412***
-0.034**
-0.015
(0.000)
(0.000)
(0.000)
(0.000)
(0.000)
(0.004)
(0.038)
(0.305)
FTB*Covid
-0.055
0.108
-0.223
0.138
-0.333
-0.693
0.019
-0.001
(0.764)
(0.596)
(0.664)
(0.830)
(0.440)
(0.197)
(0.665)
(0.977)
FTD
-0.189***
-0.200***
-0.537***
-0.588***
-0.321***
-0.342***
-0.020**
-0.014**
(0.000)
(0.000)
(0.000)
(0.000)
(0.000)
(0.000)
(0.011)
(0.037)
FTD*Covid
0.016
0.111**
0.017
0.284
0.075
0.131
0.012
0.011
(0.832)
(0.038)
(0.937)
(0.147)
(0.665)
(0.291)
(0.492)
(0.374)
Covid
0.249**
0.178
0.226**
0.161
0.734*
0.849
0.681*
0.798
0.383
0.553*
0.301
0.374
-0.137***
-0.160***
-0.137***
-0.162***
(0.015)
(0.126)
(0.019)
(0.139)
(0.079)
(0.120)
(0.090)
(0.120)
(0.188)
(0.094)
(0.291)
(0.296)
(0.000)
(0.000)
(0.000)
(0.000)
Controls
Yes
Yes
Yes
Yes
Yes
Yes
Yes
Yes
Yes
Yes
Yes
Yes
Yes
Yes
Yes
Yes
Year dummies
Yes
Yes
Yes
Yes
Yes
Yes
Yes
Yes
Yes
Yes
Yes
Yes
Yes
Yes
Yes
Yes
Constant
0.020
0.177
-0.043
0.103
0.790
1.388**
0.626
1.203**
-0.726
-0.041
-0.803*
-0.112
-0.059
-0.069
-0.065
-0.072
(0.904)
(0.383)
(0.794)
(0.609)
(0.113)
(0.018)
(0.196)
(0.036)
(0.102)
(0.935)
(0.068)
(0.825)
(0.313)
(0.342)
(0.269)
(0.317)
Observations
1,828
1,346
1,828
1,346
1,828
1,346
1,828
1,346
1,828
1,346
1,828
1,346
1,828
1,346
1,828
1,346
Adjusted R-squared
0.297
0.294
0.296
0.296
0.296
0.332
0.298
0.336
0.724
0.714
0.725
0.715
0.139
0.114
0.140
0.115
Wald Chi 2 (p-value)
0.000
0.000
0.000
0.000
0.000
0.000
0.000
0.000
0.000
0.000
0.000
0.000
0.000
0.000
0.000
0.000
Robust standard errors are employed to capture to capture serial correlation and heteroskedasticity. P-values are reported in paratheses. ***, ** and * denote 1%, 5% and 10% significance level. Definitions and measurements of all variables are presented in Table 1.
The effect of the covid-19 pandemic on the relationship between board–CEO friendship ties and risk-taking behaviour of tourism firms.
Panel A:Default risk
Panel B:Asset risk
(1)
(2)
(3)
(4)
(5)
(6)
(7)
(8)
VARIABLES
Ln(Z-score)t
Ln(Z-score)t+1
Ln(Z-score)t
Ln(Z-score)t+1
ROA/SDt
ROA/SDt+1
ROA/SDt
ROA/SDt+1
FTB
-0.625***
-0.582***
-1.437***
-1.093***
(0.000)
(0.000)
(0.001)
(0.002)
FTB*Covid
0.110
0.086
0.718
0.719
(0.785)
(0.806)
(0.367)
(0.391)
FTD
-0.301***
-0.290***
-0.829**
-0.509***
(0.000)
(0.000)
(0.022)
(0.000)
FTD*Covid
0.023
0.156
0.491
0.301
(0.922)
(0.181)
(0.291)
(0.158)
Covid
-0.514***
-0.635***
-0.513***
-0.687***
-2.012***
-2.908***
-2.031***
-2.889***
(0.000)
(0.000)
(0.000)
(0.000)
(0.000)
(0.000)
(0.000)
(0.000)
Controls
Yes
Yes
Yes
Yes
Yes
Yes
Yes
Yes
Year dummies
Yes
Yes
Yes
Yes
Yes
Yes
Yes
Yes
Constant
0.397*
0.424
0.288
0.305
3.784***
4.501***
3.533***
4.265***
(0.064)
(0.101)
(0.177)
(0.234)
(0.000)
(0.000)
(0.000)
(0.000)
Observations
1,828
1,346
1,828
1,346
1,828
1,346
1,828
1,346
R-squared
0.153
0.152
0.149
0.148
0.138
0.171
0.141
0.169
Wald Chi 2
0.000
0.000
0.000
0.000
0.000
0.000
0.000
0.000
Robust standard errors are employed to capture serial correlation and heteroskedasticity. P-values are reported in paratheses. ***, ** and * denote 1%, 5% and 10% significance level. Definitions and measurements of all variables are presented in Table 1.
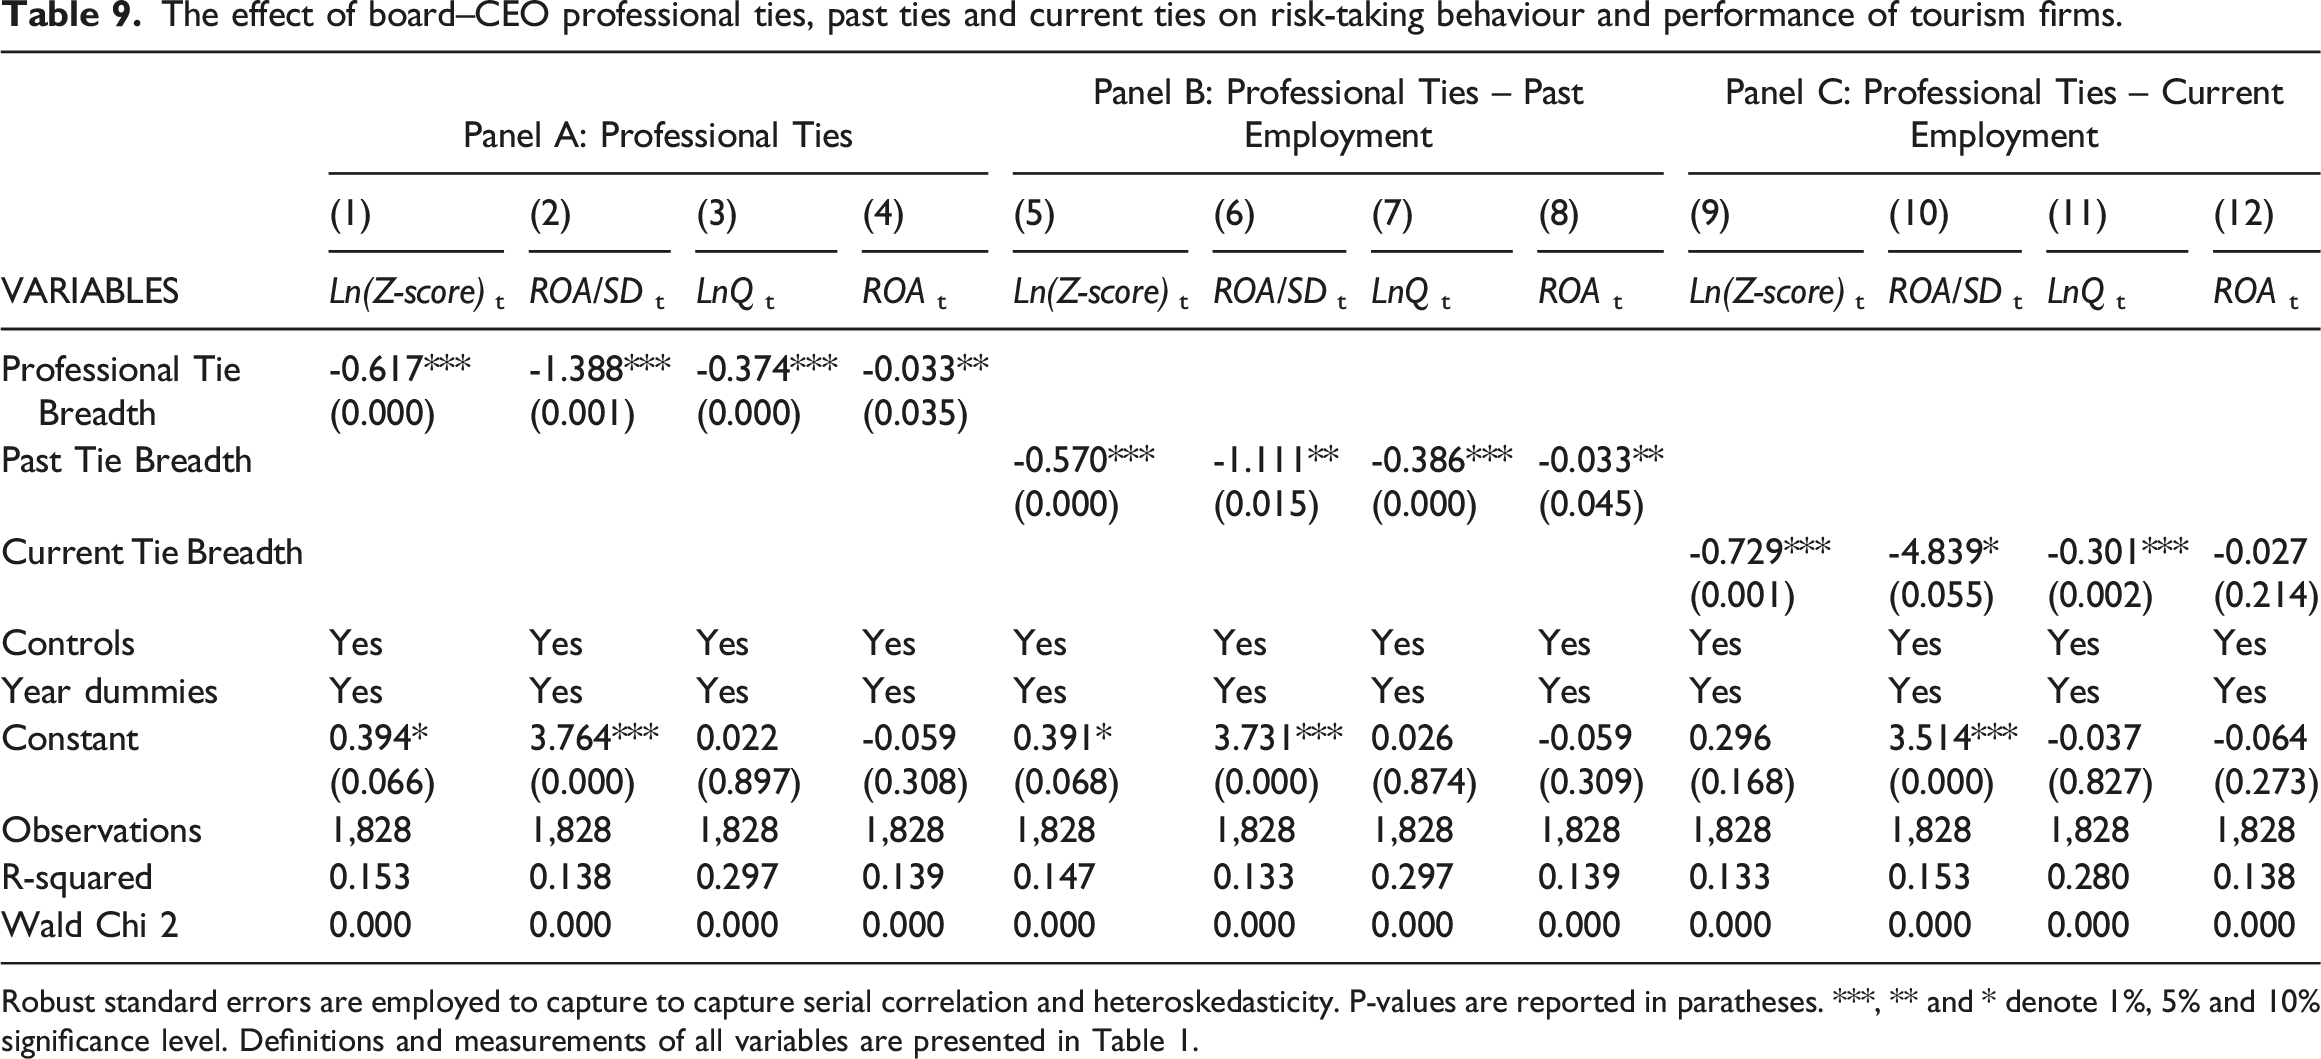
The effect of board–CEO professional ties, past ties and current ties
As suggested by Fan et al. (2019), Fracassi and Tate (2012) and Khanna et al. (2015), the connections between CEOs and directors can comprise professional ties (i.e. related to their directorships in the same external firms) and non-professional ties (i.e. related to education and other social connections such as shared memberships in charity, golf club or non-profit organisations). Therefore, additional sensitivity tests are conducted based on this section's professional board–CEO Ties. Table 9 reports the impact of professional board–CEO friendship ties on the Tourism firms' risk-taking behaviour and performance. Overall, the results hold across different professional board–CEO measures confirming previous findings.
The effect of board–CEO professional ties, past ties and current ties on risk-taking behaviour and performance of tourism firms.
Panel A: Professional Ties
Panel B: Professional Ties – Past Employment
Panel C: Professional Ties – Current Employment
(1)
(2)
(3)
(4)
(5)
(6)
(7)
(8)
(9)
(10)
(11)
(12)
VARIABLES
Ln(Z-score)t
ROA/SDt
LnQt
ROAt
Ln(Z-score)t
ROA/SDt
LnQt
ROAt
Ln(Z-score)t
ROA/SDt
LnQt
ROAt
Professional Tie Breadth
-0.617***
-1.388***
-0.374***
-0.033**
(0.000)
(0.001)
(0.000)
(0.035)
Past Tie Breadth
-0.570***
-1.111**
-0.386***
-0.033**
(0.000)
(0.015)
(0.000)
(0.045)
Current Tie Breadth
-0.729***
-4.839*
-0.301***
-0.027
(0.001)
(0.055)
(0.002)
(0.214)
Controls
Yes
Yes
Yes
Yes
Yes
Yes
Yes
Yes
Yes
Yes
Yes
Yes
Year dummies
Yes
Yes
Yes
Yes
Yes
Yes
Yes
Yes
Yes
Yes
Yes
Yes
Constant
0.394*
3.764***
0.022
-0.059
0.391*
3.731***
0.026
-0.059
0.296
3.514***
-0.037
-0.064
(0.066)
(0.000)
(0.897)
(0.308)
(0.068)
(0.000)
(0.874)
(0.309)
(0.168)
(0.000)
(0.827)
(0.273)
Observations
1,828
1,828
1,828
1,828
1,828
1,828
1,828
1,828
1,828
1,828
1,828
1,828
R-squared
0.153
0.138
0.297
0.139
0.147
0.133
0.297
0.139
0.133
0.153
0.280
0.138
Wald Chi 2
0.000
0.000
0.000
0.000
0.000
0.000
0.000
0.000
0.000
0.000
0.000
0.000
Robust standard errors are employed to capture to capture serial correlation and heteroskedasticity. P-values are reported in paratheses. ***, ** and * denote 1%, 5% and 10% significance level. Definitions and measurements of all variables are presented in Table 1.
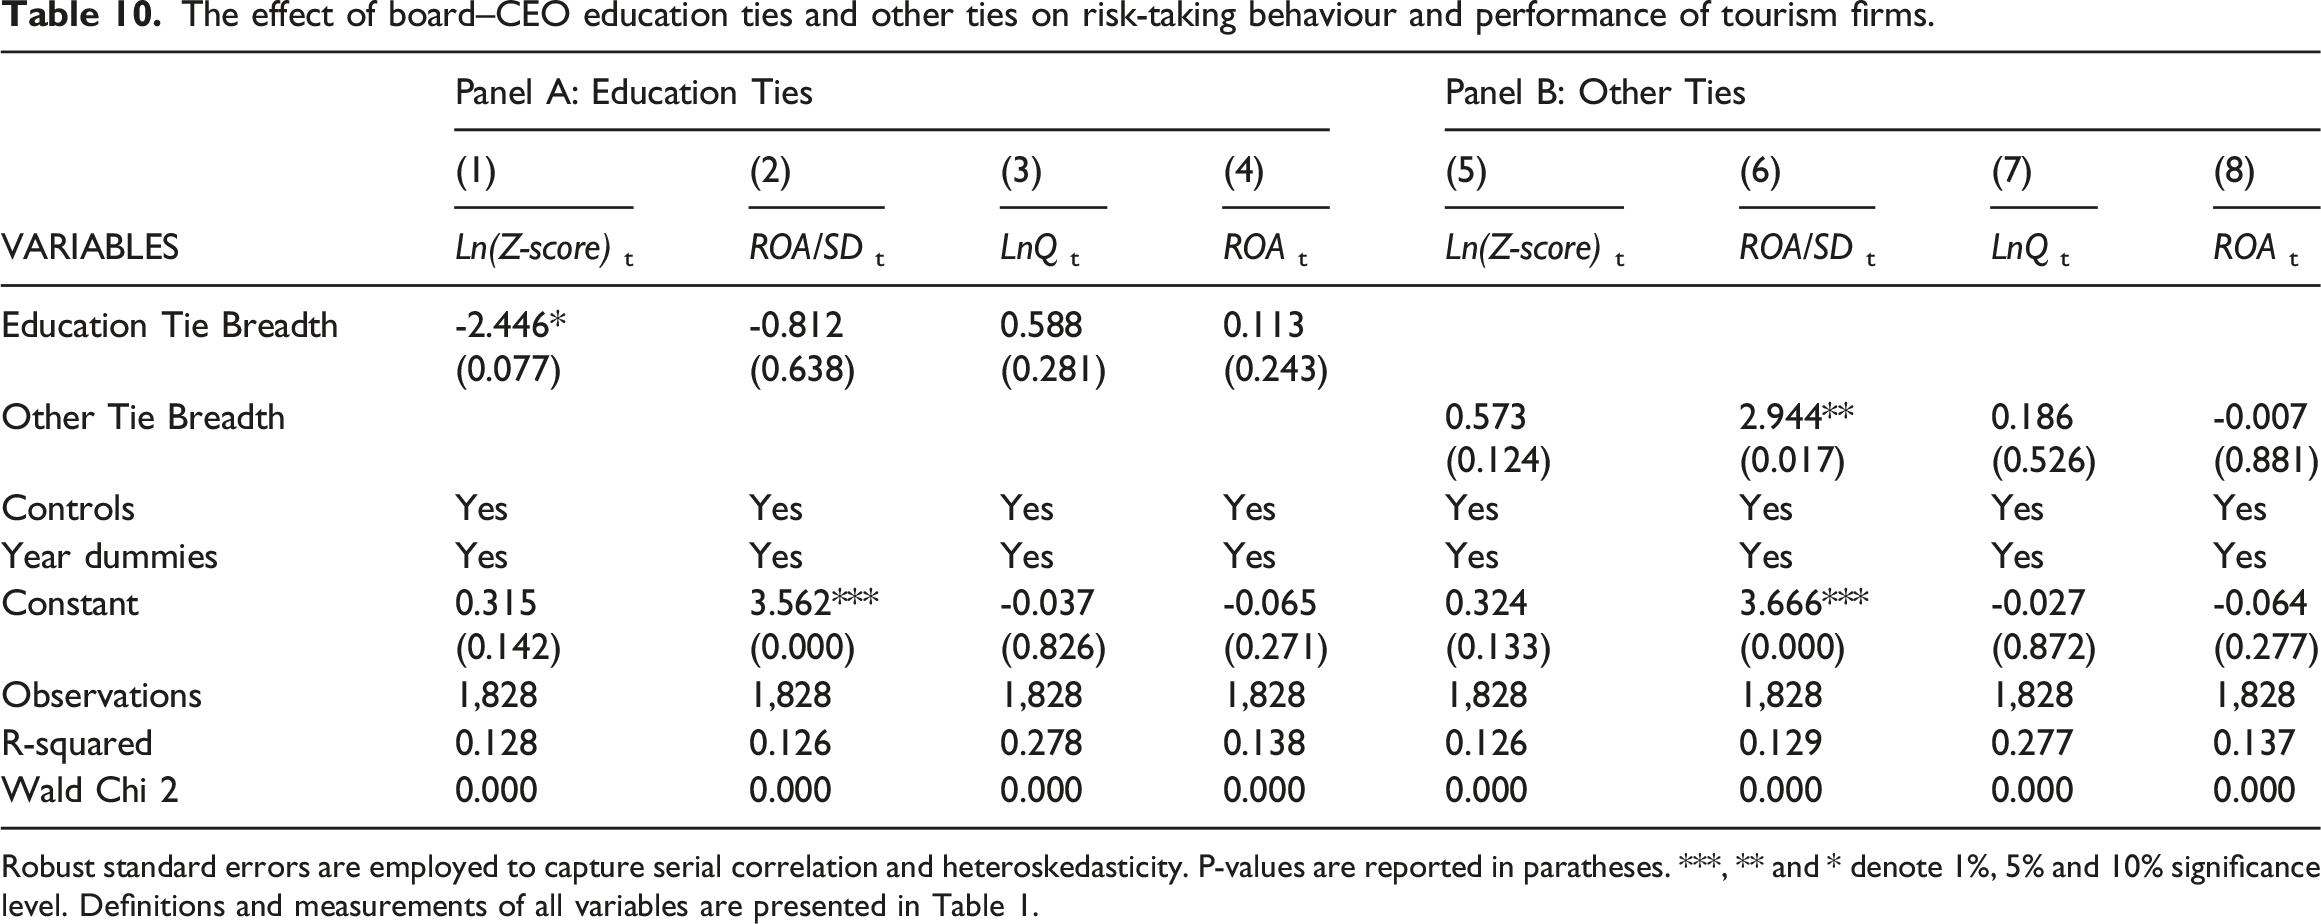
The effect of board–CEO education ties and other ties
Non-professional ties comprise educational ties and other activities. Education Tie Breath represents the connections by which CEOs and board directors attended and graduated within one year of each other in the same universities or educational institutions. Other activities’ ties (Other Tie Breath) represent the connections by which CEOs and board directors join the same clubs, golf and charity or non-profit organisations. The results (Table 10) show that professional ties affect firm outcomes more than non-professional ones.
The effect of board–CEO education ties and other ties on risk-taking behaviour and performance of tourism firms.
Panel A: Education Ties
Panel B: Other Ties
(1)
(2)
(3)
(4)
(5)
(6)
(7)
(8)
VARIABLES
Ln(Z-score)t
ROA/SDt
LnQt
ROAt
Ln(Z-score)t
ROA/SDt
LnQt
ROAt
Education Tie Breadth
-2.446*
-0.812
0.588
0.113
(0.077)
(0.638)
(0.281)
(0.243)
Other Tie Breadth
0.573
2.944**
0.186
-0.007
(0.124)
(0.017)
(0.526)
(0.881)
Controls
Yes
Yes
Yes
Yes
Yes
Yes
Yes
Yes
Year dummies
Yes
Yes
Yes
Yes
Yes
Yes
Yes
Yes
Constant
0.315
3.562***
-0.037
-0.065
0.324
3.666***
-0.027
-0.064
(0.142)
(0.000)
(0.826)
(0.271)
(0.133)
(0.000)
(0.872)
(0.277)
Observations
1,828
1,828
1,828
1,828
1,828
1,828
1,828
1,828
R-squared
0.128
0.126
0.278
0.138
0.126
0.129
0.277
0.137
Wald Chi 2
0.000
0.000
0.000
0.000
0.000
0.000
0.000
0.000
Robust standard errors are employed to capture serial correlation and heteroskedasticity. P-values are reported in paratheses. ***, ** and * denote 1%, 5% and 10% significance level. Definitions and measurements of all variables are presented in Table 1.
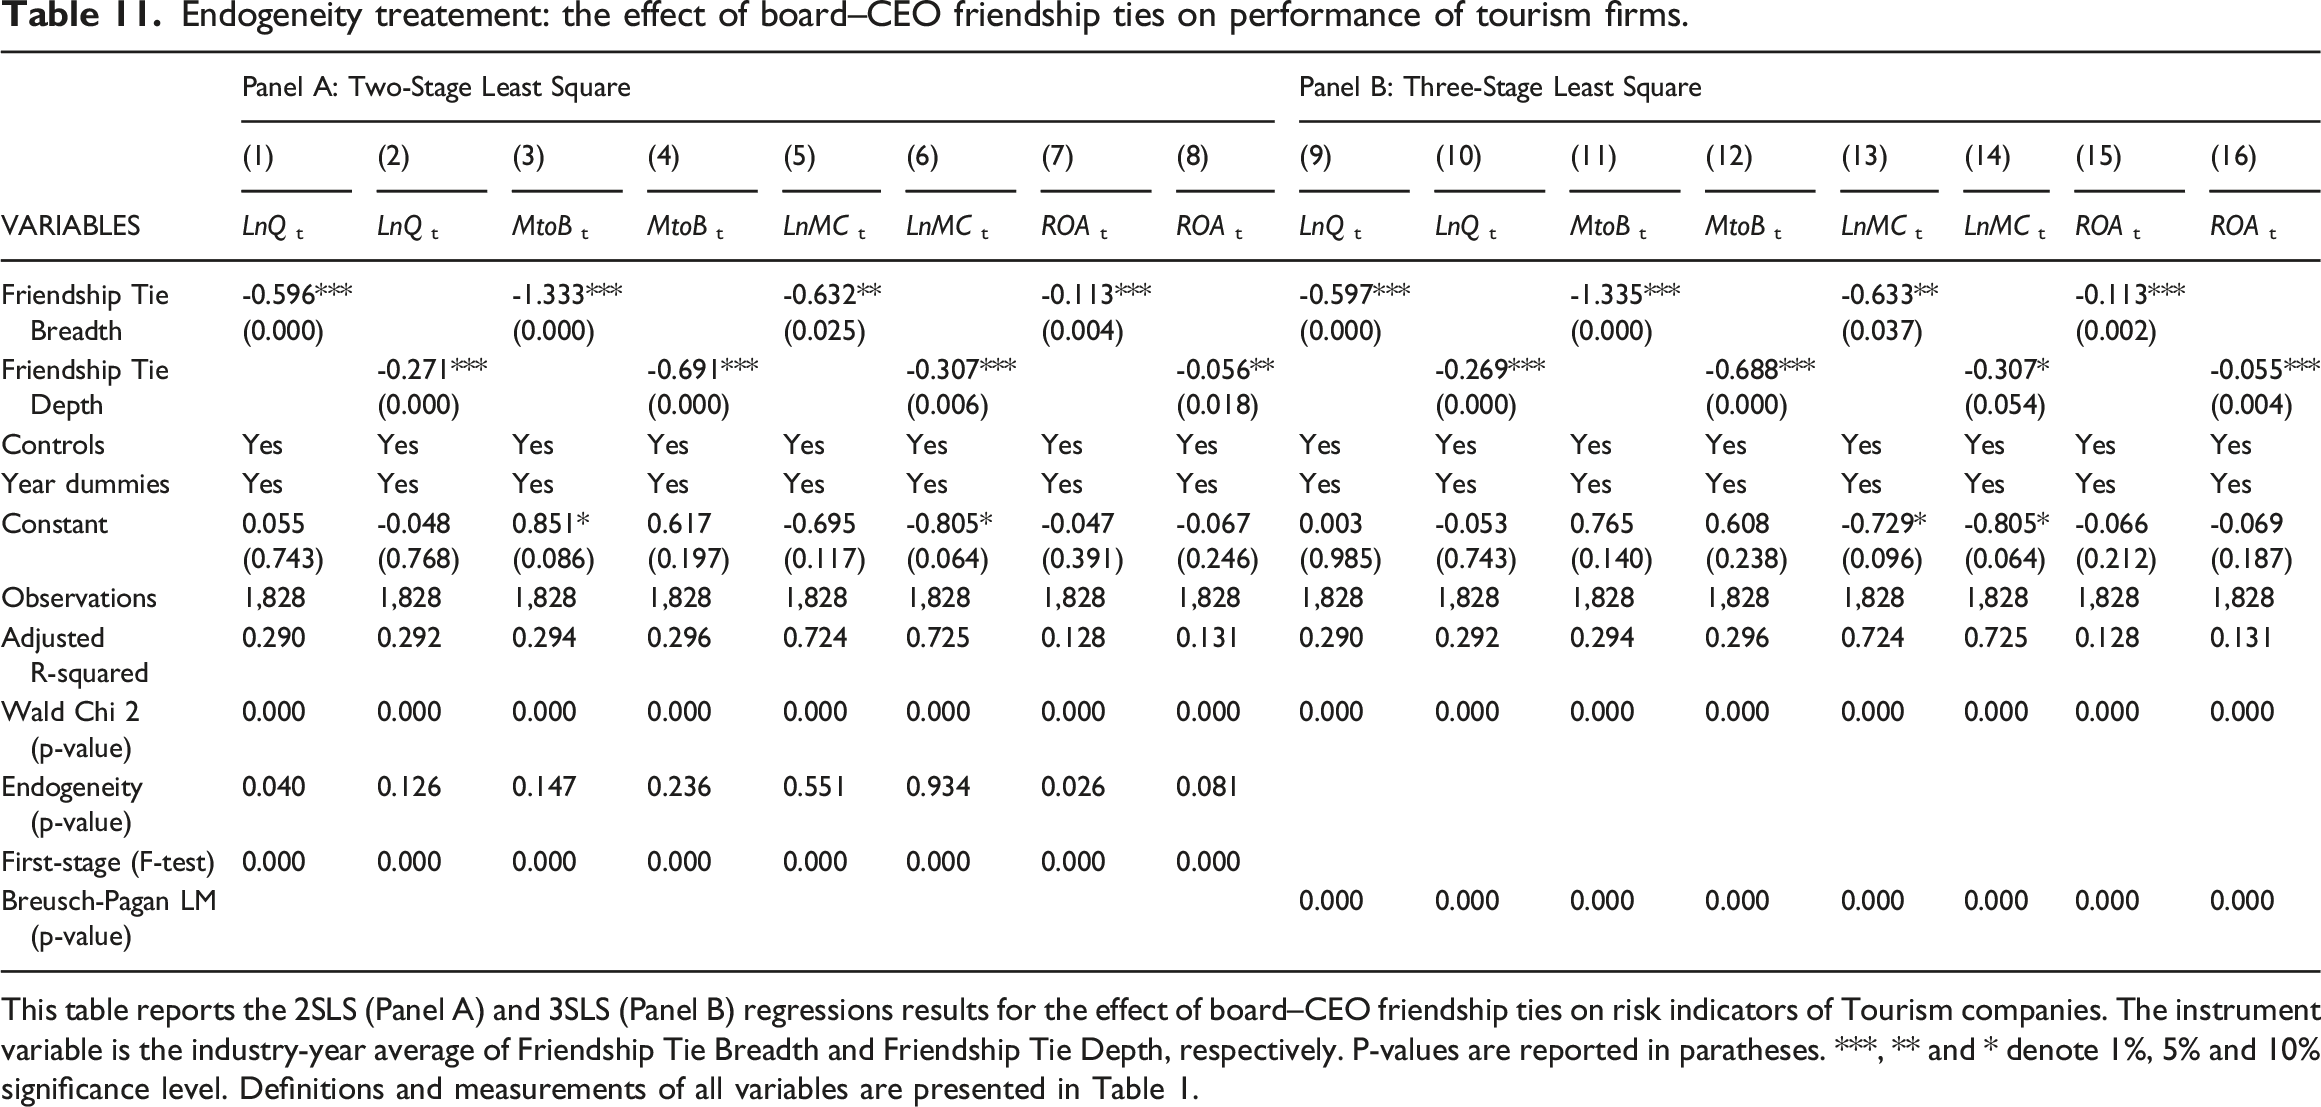
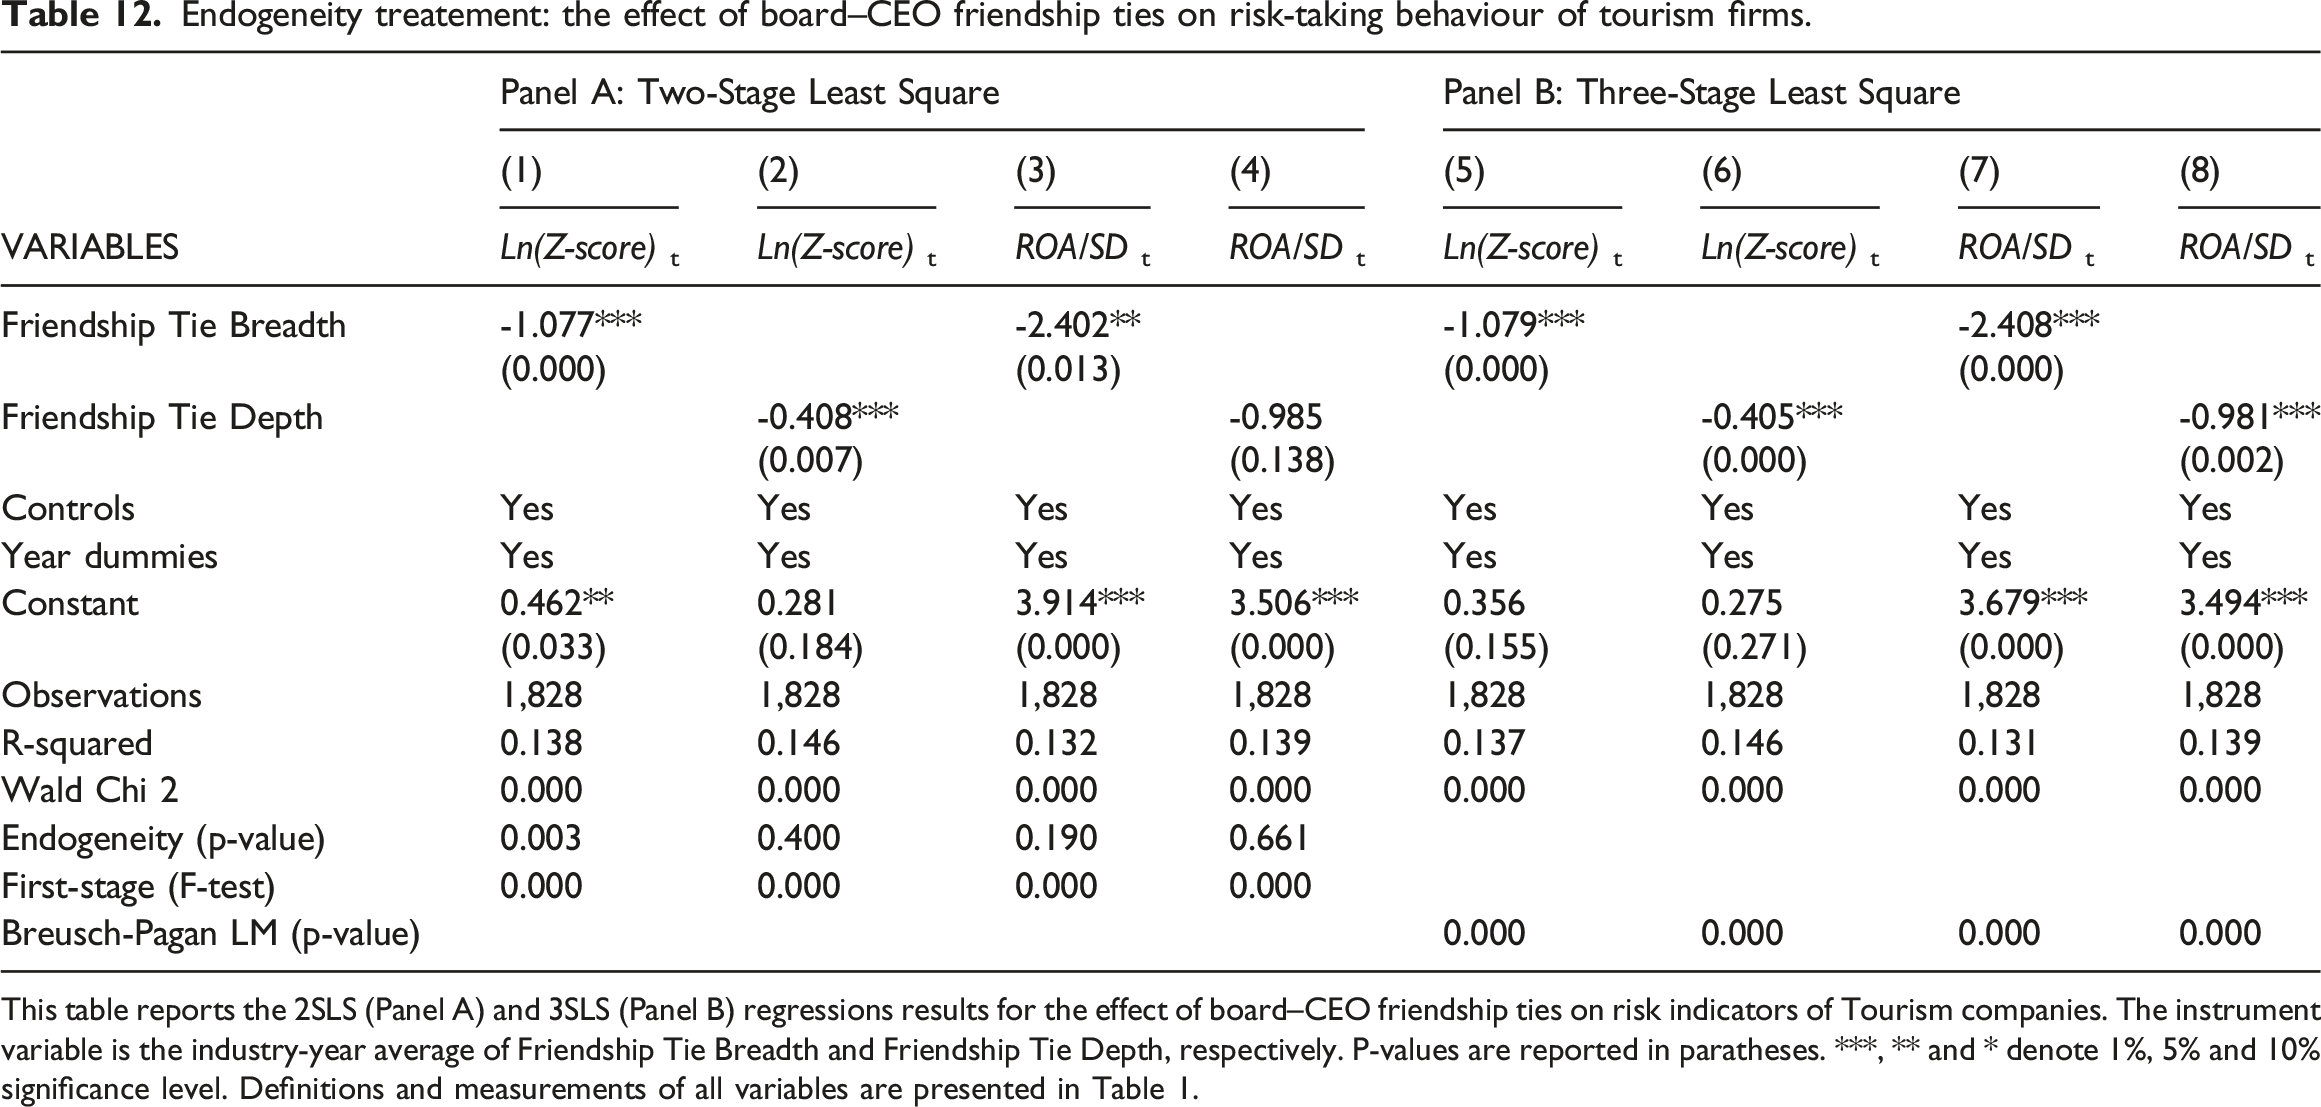
Endogeneity treatment – 2SLS vs. 3SLS
Board–CEO social network tie may be a function of past firm risk and performance, leading to reverse causality. Two-stage least square (2SLS) and three-stage least square (3SLS) are used to address potential endogeneity problems. The industry-year average of FTB or FTD is used as an instrument variable (IV) in the fixed-effect framework. This IV is commonly used in the literature to deal with issues related to endogeneity. Note that the Sargan–Hansen test verified the validity of this IV. The findings are reported in Table 11 and Table 12, which are consistent with those reported in Tables 4 and 5.
Endogeneity treatement: the effect of board–CEO friendship ties on performance of tourism firms.
Panel A: Two-Stage Least Square
Panel B: Three-Stage Least Square
(1)
(2)
(3)
(4)
(5)
(6)
(7)
(8)
(9)
(10)
(11)
(12)
(13)
(14)
(15)
(16)
VARIABLES
LnQt
LnQt
MtoBt
MtoBt
LnMCt
LnMCt
ROAt
ROAt
LnQt
LnQt
MtoBt
MtoBt
LnMCt
LnMCt
ROAt
ROAt
Friendship Tie Breadth
-0.596***
-1.333***
-0.632**
-0.113***
-0.597***
-1.335***
-0.633**
-0.113***
(0.000)
(0.000)
(0.025)
(0.004)
(0.000)
(0.000)
(0.037)
(0.002)
Friendship Tie Depth
-0.271***
-0.691***
-0.307***
-0.056**
-0.269***
-0.688***
-0.307*
-0.055***
(0.000)
(0.000)
(0.006)
(0.018)
(0.000)
(0.000)
(0.054)
(0.004)
Controls
Yes
Yes
Yes
Yes
Yes
Yes
Yes
Yes
Yes
Yes
Yes
Yes
Yes
Yes
Yes
Yes
Year dummies
Yes
Yes
Yes
Yes
Yes
Yes
Yes
Yes
Yes
Yes
Yes
Yes
Yes
Yes
Yes
Yes
Constant
0.055
-0.048
0.851*
0.617
-0.695
-0.805*
-0.047
-0.067
0.003
-0.053
0.765
0.608
-0.729*
-0.805*
-0.066
-0.069
(0.743)
(0.768)
(0.086)
(0.197)
(0.117)
(0.064)
(0.391)
(0.246)
(0.985)
(0.743)
(0.140)
(0.238)
(0.096)
(0.064)
(0.212)
(0.187)
Observations
1,828
1,828
1,828
1,828
1,828
1,828
1,828
1,828
1,828
1,828
1,828
1,828
1,828
1,828
1,828
1,828
Adjusted R-squared
0.290
0.292
0.294
0.296
0.724
0.725
0.128
0.131
0.290
0.292
0.294
0.296
0.724
0.725
0.128
0.131
Wald Chi 2 (p-value)
0.000
0.000
0.000
0.000
0.000
0.000
0.000
0.000
0.000
0.000
0.000
0.000
0.000
0.000
0.000
0.000
Endogeneity (p-value)
0.040
0.126
0.147
0.236
0.551
0.934
0.026
0.081
First-stage (F-test)
0.000
0.000
0.000
0.000
0.000
0.000
0.000
0.000
Breusch-Pagan LM (p-value)
0.000
0.000
0.000
0.000
0.000
0.000
0.000
0.000
This table reports the 2SLS (Panel A) and 3SLS (Panel B) regressions results for the effect of board–CEO friendship ties on risk indicators of Tourism companies. The instrument variable is the industry-year average of Friendship Tie Breadth and Friendship Tie Depth, respectively. P-values are reported in paratheses. ***, ** and * denote 1%, 5% and 10% significance level. Definitions and measurements of all variables are presented in Table 1.
Endogeneity treatement: the effect of board–CEO friendship ties on risk-taking behaviour of tourism firms.
Panel A: Two-Stage Least Square
Panel B: Three-Stage Least Square
(1)
(2)
(3)
(4)
(5)
(6)
(7)
(8)
VARIABLES
Ln(Z-score)t
Ln(Z-score)t
ROA/SDt
ROA/SDt
Ln(Z-score)t
Ln(Z-score)t
ROA/SDt
ROA/SDt
Friendship Tie Breadth
-1.077***
-2.402**
-1.079***
-2.408***
(0.000)
(0.013)
(0.000)
(0.000)
Friendship Tie Depth
-0.408***
-0.985
-0.405***
-0.981***
(0.007)
(0.138)
(0.000)
(0.002)
Controls
Yes
Yes
Yes
Yes
Yes
Yes
Yes
Yes
Year dummies
Yes
Yes
Yes
Yes
Yes
Yes
Yes
Yes
Constant
0.462**
0.281
3.914***
3.506***
0.356
0.275
3.679***
3.494***
(0.033)
(0.184)
(0.000)
(0.000)
(0.155)
(0.271)
(0.000)
(0.000)
Observations
1,828
1,828
1,828
1,828
1,828
1,828
1,828
1,828
R-squared
0.138
0.146
0.132
0.139
0.137
0.146
0.131
0.139
Wald Chi 2
0.000
0.000
0.000
0.000
0.000
0.000
0.000
0.000
Endogeneity (p-value)
0.003
0.400
0.190
0.661
First-stage (F-test)
0.000
0.000
0.000
0.000
Breusch-Pagan LM (p-value)
0.000
0.000
0.000
0.000
This table reports the 2SLS (Panel A) and 3SLS (Panel B) regressions results for the effect of board–CEO friendship ties on risk indicators of Tourism companies. The instrument variable is the industry-year average of Friendship Tie Breadth and Friendship Tie Depth, respectively. P-values are reported in paratheses. ***, ** and * denote 1%, 5% and 10% significance level. Definitions and measurements of all variables are presented in Table 1.
Discussion and conclusion
Our article enriches the theories by investigating the friendship ties between CEO and board members from the perspective of tourism firms. We find that because these ties encourage risk-taking behaviour in decision-making, it significantly increases the level of financial distress. This relation, in turn, reduces the profitability of the firms and their market value. These findings are consistent with the social network hypothesis (e.g. Silver 1990) and the theory of managerial powers (e.g. Fracassi and Tate 2012; Finkelstein 1992; Schmidt 2015). Both sets of theories advance that increasing social bonds between the CEOs and board directors lead to a higher level of trust and sympathetic attitudes toward decision-making and risk-taking of the former. The theory of managerial powers states that this leads to more reckless decision making because CEOs feel safe as their decisions entail low or no personal risk or even accountability, encouraging them to act more recklessly. The findings here support both theories. We find that a higher level of board–CEO network ties in the tourism industry exhibits higher riskiness. Higher riskiness is a problem for tourism firms, as reported in Zheng et al. (2021), because it is associated with lower profits. The board's effectiveness in safeguarding shareholders' interests is relatively lax, leading to sub-optimal performance outcomes for firms in the tourism industry.
We also find that these relationships prevailed when tested for an external exogenous shock which is likely to be of significant consequence for the business. The shock applied here is the Covid-19 pandemic. The findings show that the shock has no bearing on this relationship, demonstrating the strength of the ties, at least immidiately after the outbreak.
We also contribute to the theory by showing that the negative effect of the breadth of board–CEO friendship is statistically more robust than that of the depth of board–CEO friendship ties. This can be also demonstrated by the larger economic effects of the former compared to the latter. Therefore, tourism firms where the CEO is related to more board members as opposed to knowing only a few members but more deeply are likely to show poorer performance. In voting and monitoring, CEOs have more members on their side, making them more confident with taking risks. Knowing only a few members very well does not offer the same level of shielding to the CEO. One fundamental finding from this paper is that the market is not indifferent to CEO–board ties. Firms may seek to appoint board members on the recommendation of the CEO, who has insider information on the board member's capabilities expecting better board effectiveness, but this reduces the firm's market value. The board of directors can be trusted to monitor CEOs' behaviour and decision-making adequately and protect shareholders' interests. Another contribution of the paper is that it also addresses the differences in professional impact versus non-professional board–CEO friendship. Interestingly, the results show that professional ties have a more significant effect than non-professional ties.
The managerial implications of the findings are primarily related to the effectiveness of board governance. They show that to improve the performance of firms in the tourism industry; we should minimise the friendship and social ties between CEO and board members. This might be achieved through a system of relations disclosure at the hiring stage. According to Fan et al. (2021), the 2002 Sarbanes–Oxley Act was introduced in the U.S. to improve corporate governance following several scandals involving CEOs’ reckless behaviour, which escaped the monitoring of boards. The authors, however, postulate that this Act is unsuitable because it only restricts financial and family ties or links. Other relationships are not considered. One important implication of the findings of our research is that independence is desired when hiring new board members. It is, therefore, recommended that individual firms provide adequate internal monitoring mechanisms. Chief Executive Officers need to disclose additional ties with board members. It is recommended that companies be prepared to implement an independent mechanism for monitoring risky behaviour and creating accountability.
In practice, however, despite aiming for CEO–board independence initially at recruitment, it is not unlikely that friendship and social ties be formed with time. Companies need to be prepared to take action to avoid slackness in governance. Companies should, therefore, have a robust system in place for detecting risky behaviour and dealing with it at the onset. It is recommended that seeking board advice in projects that entail a higher level of risk leads to a sharing of responsibility, leading to more cautious decision-making and behaviours and is more likely to lead to more effective internal governance. Finally, the findings of this study are relevant because they provide information that allow firms to build inner resilience and take actions to reduce financial distress.
However, no research is without limitations. In this paper, we looked into the social and formal ties among CEOs and board members using information provided by the BoardEx database. There are other forms of ties such as political affilitions or membership of religious groups, cults or secret societies which may be relevant but we have not been able to study the effect of these due to lack of data.
Footnotes
Declaration of conflicting interests
The author(s) declared no potential conflicts of interest with respect to the research, authorship, and/or publication of this article.
Funding
This research is partly funded by University of Economics Ho Chi Minh City, Vietnam.
ORCID iDs
Vu Quang Trinh
Neelu Seetaram
Note
Author biography
Dr Trinh specialises in board network, CEO leadership, corporate governance and global financial management. Professor Seetaram is an expert in tourism demand analysis and assessing the economic impact of the tourism industry. Dr Duong publishes in prestigious research journals such as Journal of Corporate Finance. Professor Vo is an expert in banking and finance. His publications appear in several world-leading and internationally recognised journals.
References
1.
AdamsRBFerreiraD (2007) A theory of friendly boards. The journal of finance62(1): 217–250.
2.
AhnJSAssafAGJosiassenA, et al. (2020) Narcissistic CEOs and corporate social responsibility: Does the role of an outside board of directors matter?International Journal of Hospitality Management85: 102350.
3.
Al-NajjarB (2014) Corporate governance, tourism growth and firm performance: Evidence from publicly listed tourism firms in five Middle Eastern countries. Tourism Management42: 342–351.
4.
Al-NajjarB (2017) Corporate governance and CEO pay: Evidence from UK Travel and Leisure listed firms. Tourism Management60: 9–14.
5.
AltmanEI (1968) Financial ratios, discriminant analysis and the prediction of corporate bankruptcy. The journal of finance23(4): 589–609.
6.
AltmanEI (1977) The Z-Score bankruptcy model: past, present, and future. New York: Financial Crises, pp. 89–129.
7.
BalsamSKwackSYLeeJY (2017) Network connections, CEO compensation and involuntary turnover: The impact of a friend of a friend. Journal of Corporate Finance45: 220–244.
8.
BoekerW (1992) Power and managerial dismissal: Scapegoating at the top. Administrative science quarterly37: 400–421.
9.
ColesJLDanielNDNaveenL (2006) Managerial incentives and risk-taking. Journal of Financial Economics79(2): 431–468. DOI: 10.1016/j.jfineco.2004.09.004.
10.
ColesJLDanielNDNaveenL (2008) Boards: Does one size fit all?Journal of financial economics87(2): 329–356.
11.
ConnellyBLCertoSTIrelandRD, et al. (2011) Signaling theory: A review and assessment. Journal of management37(1): 39–67.
12.
CustódioCMetzgerD (2014) Financial expert CEOs: CEO׳ s work experience and firm׳ s financial policies. Journal of Financial Economics114(1): 125–154.
13.
DuongKTBantiCInstefjordN (2021) Managerial conservatism and corporate policies. Journal of Corporate Finance68: 101973.
14.
FahlenbrachRStulzRM (2011) Bank CEO incentives and the credit crisis. Journal of financial economics99(1): 11–26.
15.
FanYBoatengAKingT, et al. (2019) Board-CEO friendship ties and firm value: Evidence from US firms. International Review of Financial Analysis65: 101373.
16.
FanYBoatengALyKC, et al. (2021) Are bonds blind? Board-CEO social networks and firm risk. Journal of Corporate Finance68: 101922.
17.
FinkelsteinS (1992) Power in top management teams: Dimensions, measurement, and validation. Academy of Management journal35(3): 505–538.
18.
FracassiCTateG (2012) External networking and internal firm governance. the Journal of finance67(1): 153–194.
19.
HauserR (2018) Busy directors and firm performance: Evidence from mergers. Journal of Financial Economics128(1): 16–37.
20.
HoitashU (2011) Should independent board members with social ties to management disqualify themselves from serving on the board?Journal of Business Ethics99(3): 399–423.
21.
HwangB-HKimS (2009) It pays to have friends. Journal of financial economics93(1): 138–158.
22.
KempfARuenziSThieleT (2009) Employment risk, compensation incentives, and managerial risk taking: Evidence from the mutual fund industry. Journal of Financial Economics92(1): 92–108.
23.
KhannaVKimEHLuY (2015) CEO connectedness and corporate fraud. The Journal of Finance70(3): 1203–1252.
24.
KilduffMTsaiW (2003) ‘Is there social network theory? A critical examination of theoretical foundations’, Social networks and organizations, pp. 35–65.
25.
LiJFengYLiG, et al. (2020) Tourism companies’ risk exposures on text disclosure. Annals of tourism research84: 102986.
26.
LiYSingalM (2019) Firm performance in the hospitality industry: Do CEO attributes and compensation matter?Journal of Hospitality & Tourism Research43(2): 272–282.
27.
LinckJSNetterJMYangT (2008) The determinants of board structure. Journal of financial economics87(2): 308–328.
28.
McAdamDPaulsenR (1993) Specifying the relationship between social ties and activism. American journal of sociology99(3): 640–667.
29.
OzdemirO (2020) Board diversity and firm performance in the US tourism sector: The effect of institutional ownership. International Journal of Hospitality Management91: 102693.
30.
SchmidtB (2015) Costs and benefits of friendly boards during mergers and acquisitions. Journal of Financial Economics117(2): 424–447.
31.
SilverA (1990) Friendship in commercial society: Eighteenth-century social theory and modern sociology. American Journal of Sociology95(6): 1474–1504.
32.
SmithCWStulzRM (1985) The determinants of firms’ hedging policies. Journal of financial and quantitative analysis20(4): 391–405.
33.
SubrahmanyamA (2008) Social networks and corporate governance. European Financial Management14(4): 633–662.
34.
SundaramurthyCPukthuanthongKKorY (2014) Positive and negative synergies between the CEO’s and the corporate board’s human and social capital: A study of biotechnology firms. Strategic Management Journal35(6): 845–868.
35.
TorresPAugustoM (2021) Attention to social issues and CEO duality as enablers of resilience to exogenous shocks in the tourism industry. Tourism Management87: 104400.
36.
TrinhVQSeetaramN (2022) Top-management compensation and survival likelihood: the case of tourism and leisure firms in the US. Annals of Tourism Research92: 103323.
37.
TsuiASEganTDO’ReillyCAIII (1992) Being different: Relational demography and organizational attachment. Administrative science quarterly37: 549–579.
38.
Wall Street Journal (1993) Less-than-watchful eyes didn’t oversee expenses of a utility’s chairman, Wall Street Journal.
39.
WestphalJD (1999) Collaboration in the boardroom: Behavioral and performance consequences of CEO-board social ties. Academy of management Journal42(1): 7–24.
40.
YehCMTrejosB (2015) The influence of governance on tourism firm performance. Current Issues in Tourism18(4): 299–314.
41.
ZhengCLiZWuJ (2021) Tourism Firms’ Vulnerability to Risk: The Role of Organizational Slack in Performance and Failure. Journal of Travel Research61: 990–1005.