
Abstract
This article investigates the performance of the stock market and its volatility in the travel and leisure industry for three Nordic countries using daily data from June 2018 to June 2020, a period that includes the first wave of Covid-19 pandemic. The methodology is based on the Markov regime switching model that allows unobservable regime shifts in the stock return relationship between the travel and leisure industry and the overall market in the period before the outbreak of Covid-19 crisis and during the recovery period at the end of the first wave. The results provide strong evidence of regime switching behaviour in the form of idiosyncratic risk as measured by volatility. The period before Covid-19 corresponds to a low/medium idiosyncratic risk, while the period of the pandemic is characterized by a regime with high idiosyncratic risk. Overall, the timing, likelihood and duration of this crisis regime depend on the composition of the travel and leisure firms. Those with a large proportion of online gambling firms perform better, while those consisting of international transportation firms, hotels and restaurants perform negatively. This study shows that the high-frequency data and the model chosen here can provide timely information on the impact of the pandemic on various tourism and leisure businesses that could be useful for policymaking.
Keywords
Introduction
As opposed to the financial crisis 2008/2009, which mainly affected specific sectors (housing market and banking), the Covid-19 pandemic hits more broadly and heterogeneously within service industries. Travel restrictions, strong recommendations to stay at home, quarantine rules and containment of crowds bring global mobility, travel and tourism to a standstill (Gössling et al., 2021; Hall et al., 2020; Sigala, 2020). The airline industries are particularly affected with a decrease in capacity of roughly between 60% and 80% in March 2020 (Josephs, 2020, cited in Sobieralski, 2020) and a decrease in the number of flight searches ranging between 30% and 50% between May and September 2020 (Gallego and Font, 2020). The pandemic has also severely affected leisure activities around the world (Lashua et al., 2020; Lehman, 2020)). Several outdoor recreation areas and places (restaurants, pubs, bars and nightclubs, leisure centres and gyms, art centres, theatres, cinemas, museums and galleries) are faced with new regulations regarding the maximum number of visitors and hygiene, which are not always easy to fulfill. There are many cancelled sporting and entertainment events.
It is widely agreed that the Covid-19 pandemic affects different service sectors unequally. For instance, based on survey data for the United States by Bartik et al. (2020), it is shown that the impact of the pandemic varies by sector, with retail, arts and entertainment, personal services, food services and hospitality the most affected. The authors point out that sectors such as personal services or retail trade with a high degree of personal contacts have much lower chances of surviving the pandemic than professional services or other sectors with minimal need for personal contacts. Based on the S&P1500 stock indices, Mazur et al. (2020) show that hospitality and entertainment (e.g. cruise lines, casinos, restaurants) in the United States have lost more than 70% of their market capitalization in March 2020 with an increase in volatility, while software firms show an increase in market capitalization and a below average increase in volatility. In a similar line, Liu et al. (2020) find out, based on the stock market data for China, that transportation, warehousing and postal services, accommodation and catering are most negatively affected by the pandemic.
As an industry highly vulnerable to numerous environmental, political and socio-economic risks, tourism has recovered relatively quickly in the past from various political crises, wars, natural disasters and pandemics (Novelli et al., 2018; Sigala, 2020). One open question is whether and to what extent different travel and leisure firms have recovered several months after the first wave of Covid-19 pandemics.
The aim of this study is to examine the extent to which the shares of the travel and leisure sector in the Nordic countries systematically perform above or below the aggregate stock market following the effects of the Covid-19 pandemic. For this purpose, this study uses a Markov switching model for the daily stock market performance of the travel and leisure industry from June 2018 to June 2020. The analysis distinguishes between different regimes and focuses on the period after the gradual reopening of the economy for domestic travel and tourism in the end of first wave of Covid-19. We provide evidence of the stock market performance of three markets which are characterized by a different composition of leisure and tourism companies.
Travel and leisure stock market indices are widely used to study the impact of extraordinary events such as terrorism, war conflicts and political violence (Chen, 2011; Hadi et al., 2020; Lanouar and Goaied, 2019; Wang, 2013; Zopiatis et al., 2019), economic policy uncertainty (Demiralay, 2020; Ersan et al., 2019), geopolitical risks (Demiralay and Kilincarslan, 2019), earthquakes and other natural catastrophe (Chen, 2011; Zopiatis et al., 2019). Another strand of the literature investigates the impact of epidemic disease outbreaks on stock market performance and other financial indicators (Chen et al., 2007; Kim et al., 2020; Wang, 2013). More recently, Lee and Chen (2020) have investigated the relationship between Covid-19 deaths and the returns of travel and leisure industry using quantile regressions.
This study contributes the first application of the Markov switching model to the travel and leisure stock market performance in a group of countries (Denmark, Finland and Sweden) after the outbreak of the Covid-19 pandemic. Stock market indices hold advantages over data from official statistical offices for real-time analysis. Information is available on a daily basis, while official data appear with time lags.
The Markov switching model is applied to the stock market performance of three Nordic countries, which have several common features in the tourism and travel sector. Firstly, the share of domestic overnight stays in total overnight stays is very high, ranging from 71% in Finland in 2010–2019 to 75% in Stockholm and 50% in Denmark (Source: National Statistical Offices). Secondly, the travel account of the three countries is nearly balanced (Sweden) or slightly negative (Denmark and Finland) (Source: National Statistical Offices). Thirdly, after the outbreak of the pandemic domestic tourism has never completely stopped. Thus, firms that are dependent on domestic tourism and leisure activities could therefore benefit from restrictions on outbound tourism and travel. Fourthly, until the outbreak of the Covid-19 pandemic, tourism grew strongly across cities and rural areas of the Nordic countries. This has not been uncontroversial, and critical discussions addressed among others were city tourism, cruise tourism and visits to generally unspoilt places (Oklevik et al., 2019).
However, the three countries differ in the extent to which the economy is shut down. In contrast to Denmark and Finland, there has never been a strict lockdown in Sweden. Woodside (2020) calculates a shut-down index using a 10-category Likert-type scale and finds that Finland and Denmark (category 8 similar to the United States) have a much stronger regime than Sweden (category 3), with South Korea showing the lowest degree of foreclosure (1) and China (10) the most severe.
The structure of the article is as follows: The next section will provide the conceptual background and the empirical model. The third section presents the data, while the fourth and fifth sections report the results and conclusions, respectively.
Conceptual background and empirical model
The main research question here is to what extent the different types of tourism and leisure businesses in the three different markets are affected by the Covid-19 pandemic. Travel restrictions between and within countries, travel bans, border closures, quarantine and isolation of travellers have a negative impact on transport, including air transport and accommodation companies. Nicola et al. (2020) suggest that the tourism sector is currently one of the most affected by the outbreak of the first wave of Covid-19, affecting both the supply and the demand for travel. Given the recommendation by governments and national health authorities to minimize personal contact and restrictions on large gatherings, companies that organize events are also heavily affected. The implementation of minimum distance rules between people (worker–worker, worker–customer) has a negative impact on the demand for hotel rooms and restaurant visits. In addition, the replacement of face-to-face meetings by web meetings has a negative influence on the demand for business tourists.
In contrast, companies offering online entertainment and leisure activities could benefit from the crisis. The Covid-19 pandemic has led to an inevitable increase in the use of digital technologies such as acceleration of the digitalization of work processes and education as well as usage of online purchasing due to societal distance standards, travel and mobility restrictions (Pandey and Pal, 2020). For instance, Addo et al. (2020) show a sharp increase in the online purchase behaviour following the outbreak of the Covid-19 in Wuhan, China. People and organizations around the world have had to adapt to new forms of social interaction, work and lifestyles and to redesign educational and leisure activities. Bond et al. (2020) point out that the increase in leisure time and a reduction in leisure opportunities has forced people to use alternative means of consumption (and production), which has led to an increase in social media activities. Lashua et al. (2020) report that participation in digital games and other forms of virtual gaming has increased dramatically (see also Beaunoyer et al., 2020). This should benefit Internet gaming firms.
In recent decades, Internet-based gambling has led to new gambling opportunities and replaced the traditional forms of gambling in traditional land-based gaming establishments. Examples include virtually mediated casino games, slot machines, bingo, lotteries, sports betting, horse racing and games, all of which are at the same time developing into a more socially acceptable and legally available activity. Gainsbury (2012) documents that Internet gambling is one of the fastest growing forms of gambling, surpassing the worldwide box office revenues. Internet gambling is not prohibited in the countries considered in this study.
This study applies the Markov switching model to the stock performance of the travel and leisure industry in different markets. The model is conceptually attractive for modelling stock performance in the first wave of Covid-19 pandemic, as it allows for an abrupt change in the time series between a number of regimes over time with a certain probability (Krolzig, 2013). In this case, expansions (before the Covid-19 period) and contractions (during the first wave) could be distinguished as the two (or three) unobservable regimes, each of which has specific characteristics such as a unique mean and variance. In other words, stock price performance alternates between a high and a low growth regime. Thus, the model takes care of heterogeneities of mean and variance. An attractive feature is that no prior information is required about when a sector (here travel and leisure) was in each regime or how high the two growth rates were. In the case of the Markov switching model, the probability of being in a particular regime is derived from the data.
The Markov switching model characterizes the switching mechanism with a talent variable which follows the first-order Markov chain (Hamilton, 1989, 1990). The model has been applied in tourism research on the performance and volatility of stock market performance in travel and leisure in several markets (Chen et al., 2014, 2017; Gu et al, 2018; Hsu, 2017; Lanouar and Goaied, 2019).
The regression model is specified on the returns (the log difference multiplying 100) of stock market indices:

where
The approach (1) is similar to the Capital Asset Pricing Model (CAPM) (Lintner, 1965; Sharpe, 1964). The return of travel and leisure index is regressed on that of the market portfolio. The model provides information on the systematic risk, β, and idiosyncratic risk and volatility measured as the standard deviation, σ. However, the aim of the article is not to provide new estimates of the CAPM. First of all,
Thus, (1) provides the pure relationships of the returns of the travel and leisure sector as compared to that of the total economy. Nevertheless, the terminology of CAPM is employed in the interpretation of the results.
The beta coefficient, β, plays a crucial role in evaluating the performance of the travel and leisure industry as a risk measure of a portfolio in comparison to the benchmark portfolio. It refers the ‘systematic’ risk, in terms that the risk cannot be diversified (a general discussion can be found in Fama and French, 2004). In this study, however, it is more meaningful to interpret this coefficient as a coherent relation of sector return to the selected represented one. If beta coefficient, β is equal to 1, the sector indices fluctuate to the same extent as the ‘market’ return; if beta coefficient, β is less (larger) than 1, the sector returns fluctuate less (large) than the ‘market returns’. A special case is a negative beta coefficient, β. This means that the sector indices move in the opposite direction to the market. At the same time, a larger beta implies higher than average sectoral returns during the period of rising market returns. During periods of declining returns, a higher beta indicates even stronger deteriorating in sectoral returns. This interpretation is important for the analysis of crisis as sustained declines and recovery phases dominate in the first wave of the Covid-19 pandemic.
Furthermore, the specification of (1) provides the information of ‘idiosyncratic risk’ which is measured by the adjusted standard deviation, sigma coefficient, σ. From a financial perspective, this risk can be diversified by adding more individual assets to the portfolio (see discussions in Jalkh et al., 2020, for hedging the risk of travel and leisure stocks). However, in line with the purpose of this article, it measures the idiosyncratic risk of the travel and leisure sector. The Markov switching model is employed to take account for possible regime shifts in this parameter as well. In this study, regimes are arranged and ranked according to the size of the standard deviations. Indeed, regime 1 would have the smallest sigma coefficient, σ, while the regime M has the largest sigma coefficient, σ. The probabilities of the occurrence of each regime are time varying. It thus provides information on when the regimes are likely to change.
The main hypothesis is that the probability of the regime M would likely be higher during the crisis caused by the pandemic. In other words, the Covid-19 leads to higher idiosyncratic and/or systematic risks in the travel and leisure sector. In addition, the hypothesis is put forward that the returns in the travel and leisure sector are affected differently by the pandemics, depending on the composition of the different types of travel and leisure sectors as well as policy responses to the pandemic.
This article sets a three-regime Markov switching model (M = 3) for each country. The different regimes represent low, medium and high idiosyncratic risks measured by the standard deviations. The estimated probabilities for each regime are plotted with dates. As a matter of fact, the determination of M can be decided according to the Akaike information criterion, Schwarz information criterion and/or Hannan–Quinn information criterion. The decision of M = 3 is based on the idea that more options of regimes might be possible having a regime merely capturing the impacts due to the crisis caused by the Covid-19. The two-regime Markov switching model (M = 2) is also estimated as the robustness checks for the previous exercises.
The expected durations for each regime are internally determined. The uncertainty associated with a crisis can also be characterized by frequent switches of regimes. In other words, the duration of each individual regime is expected to be short during a crisis period. This can be an additional hypothesis that the regime corresponding to the Covid-19 should be short lasted. This reflects the fact that more frequent regime switches have occurred because of the uncertainty due to the first wave of Covid-19. Alternatively, the non-crisis regime which mainly occurred before the outbreak of Covid-19 should have a relatively long duration.
Data
The sector stock index of travel and leisure from Nasdaq is used for the empirical analysis. This index is available for several markets (Asia-Pacific, Europe and North America) and includes several sub-sectors such as airlines, other transport firms, (online) gambling, hotels, recreational services, entertainment and sports, restaurants and bars and other travel and tourism industries (Demiralay and Kilincarslan, 2019). In this study, the travel and leisure stock index for three markets is used: (i) OMX Copenhagen Travel & Leisure index (CX5700), (ii) OMX Helsinki Travel & Leisure index (HX5700) and (iii) OMX Stockholm Travel & Leisure index (SX5700), as well as OMX Nordic Travel & Leisure (NX5700). There is no corresponding index in Norway and Iceland. However, the OMX Nordic Travel & Leisure index does contain selected firms from Iceland.
The index of the travel and leisure sector comprises a wide range of travel and leisure firms including ski lift operators and hotel chains but also (online) betting and gambling firms. However, there are great differences in the composition of firms between the three stock exchanges (see Table 5 in Online Appendix). While the Stockholm Stock Exchange has a high proportion of online gambling firms, the Helsinki Stock Exchange hosts traditional transportation and restaurants and the Copenhagen Stock Exchange accommodates sports and entertainment firms. Norway is not included in the index. Thus, the OMX Nordic Travel & Leisure index can be viewed as an index for the Nordic countries excluding Norway.
The country-specific top-tier stock market indices used as the benchmark are OMX Copenhagen 25 (OMXC25), OMX Helsinki (OMXH25) and OMX Stockholm 30 (OMXS30), respectively. The Nordic market index is the index with selected 40 firms across Denmark, Finland, Iceland and Sweden (OMXN40).
Table 1 presents descriptive statistics for the main indices. The augmented Dickey–Fuller (ADF) tests and the ADF tests with breaks are employed for the unit-root tests. The results are reported in Table 1. All series in consideration are stationary even when a break is allowed. The interesting observation is that the breaks occurred in the beginning of March 2020 corresponding to the breakout of Covid-19 in Nordic countries.
Figure 1 displays the time evolution of the stock market performance, indicating the presence of an abrupt shift from March onwards. This already indicates that there is markedly distinct behaviour in different periods and the shifts between the regimes is not gradual. The presence of abrupt regime shifts for the stock market performance motivates the implantation of a Markov switching model.
Descriptive statistics of returns.
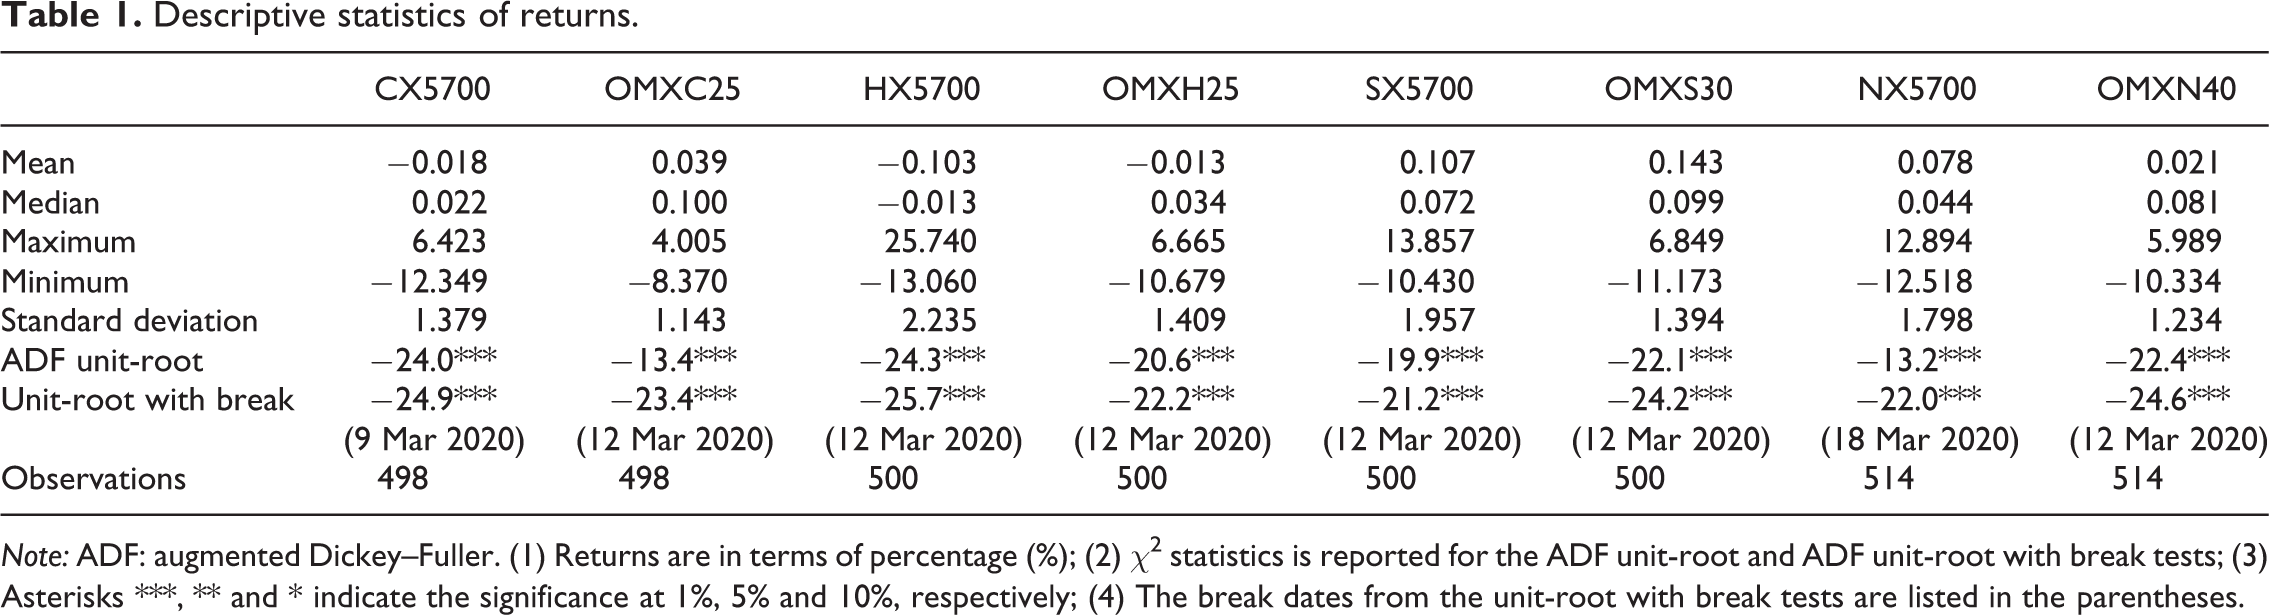
Note: ADF: augmented Dickey–Fuller. (1) Returns are in terms of percentage (%); (2) χ2 statistics is reported for the ADF unit-root and ADF unit-root with break tests; (3) Asterisks ***, ** and * indicate the significance at 1%, 5% and 10%, respectively; (4) The break dates from the unit-root with break tests are listed in the parentheses.
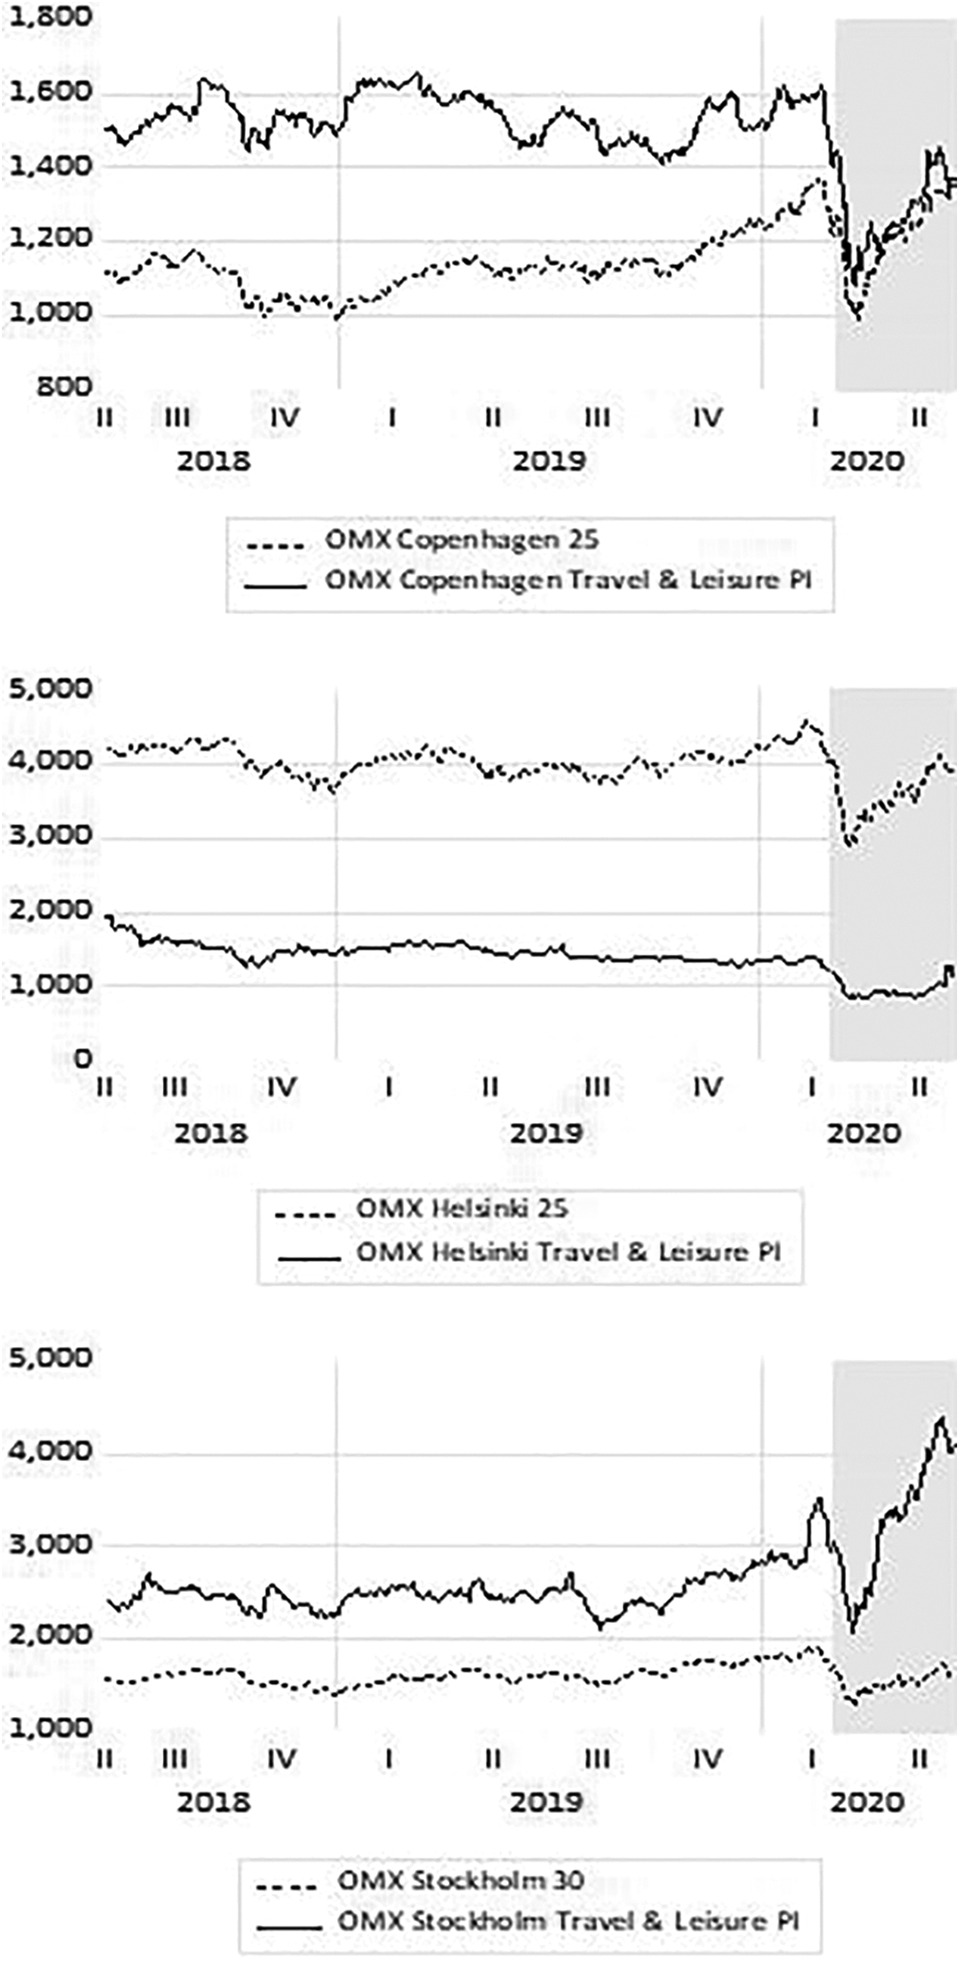
The sector indices of travel and leisure and the selected OMX country indices. 1. These are the price indices (PIs). The indices from the Copenhagen Stock Exchange is based on DKK. The indices from Helsinki Stock Exchange is based on EUR. The indices from the Stockholm Stock Exchange is based on SEK. The contents of indices can be found at the Nasdaq’s homepage. 2. These data are in the time interval from 18 June 2018 to 19 June 2020. The historical indices are available at http://www.nasdaqomxnordic.com/indexes/.
Empirical results
Table 2 presents the results of the three-regime Markov switching model. The regimes are organized according to the size of the sigma coefficient, σ, which are all significant at the 1% and 5% level. The point estimates of the regime-dependent sigma coefficients are all statistically different at the 5% level across the regimes as confirmed by the Wald tests. The beta coefficients are also significant at the 5% level, except the one in the regime 3 in Stockholm. This is largely because the standard errors in the regime 3 are generally larger. The regime-dependent beta coefficients across regimes 1 and 2 are not significantly different. Meanwhile, the beta coefficients between regime 2 and 3 are significantly different in Copenhagen and Helsinki. This reflects the fact that the coherent return relationships between the travel and leisure industry and selected stock indices are changed when the regime 3 occurred. The Durbin–Watson statistics, d and 4 − d are above the critical value given in Farebrother (1980) in all equations, indicating the absence of first-order autocorrelation in the residuals.
The results show significant evidence for the assumption that three different phases characterize the stock market performance of the travel and leisure industry. The probability plots in Figure 2 show that with the high probability the regime 3 mainly occurred during the crisis caused by the Covid-19. This holds true for all three markets. In comparison with the lowest sigma coefficient, the standard deviations in the regime 3 have increased to 5.7, 8.3 and 5.9 times, respectively. Hence, the industries in three markets were heavily affected by the crisis. Notice also that the durations for Helsinki and Stockholm were short-lived, and only lasted for 1 and 2 days, respectively (reported in Table 2). However, the duration for Copenhagen was 11 days. The regime with high sigma coefficients in Denmark lasts longer than the two other countries. Thus, the travel and leisure industry in the Copenhagen market is exposed to long and extensive volatility during the crisis. In addition, the crisis regime merely occurred in the early stage of the first wave of Covid-19 in Stockholm. Since the end of April, the shares of the Stockholm exchange have a low probability to switch to the crisis regime. Idiosyncratic risk has been returned to the low/medium levels. A high weighting of online gambling firms in this market implies a good hedging during the pandemic and therefore the idiosyncratic risks are lower. In contrast, the probabilities for having high idiosyncratic risks for Copenhagen and Helsinki are still high at the end of the sample.
Moreover, the differences in the structure of the industry can also be observed in the pre-pandemic period until June 2020. The Copenhagen market has more frequent shifts between the low and medium idiosyncratic risk regimes. Meanwhile, in Helsinki and Stockholm, the markets concentrate more on the low-volatility regime.
The estimated beta coefficients provide the information of co-movements related to the general market. Note again that beta coefficients were not significantly different across regimes 1 and 2 for all three markets. However, they vary substantially across markets in the regime 3. In Denmark, the beta coefficients increased from 0.28/0.33 to 1.09. This indicates that the co-movements between the travel and leisure sector and the market in general have been enhanced during the first wave of the crisis. In Finland, the opposite direction can be observed. The values of beta coefficient change from 0.57/0.78 to −3.67. This means that the travel and leisure sector in Finland not only fluctuates much more than the Finnish market index but also moves in the opposite direction and is declining compared to the overall trend. Such a decline could be explained by several factors, for example, the high proportion of traditional travel and transportation firms such as Finnair, the inclusion of the restaurant chain and the two sea transportation firms. On the other hand, there are no significant changes of beta coefficient in Sweden. A 1% rise in the OMX 30 for Sweden is expected to be accompanied by a 0.74% and 0.75% increase in the stock market performance of the travel and leisure industry in regimes 1 and 2, respectively, and 0.58 in regime 3. The impact of the pandemic of the travel and leisure shares in Sweden is modest which can be partly explained by the high share of the online betting and gambling firms in the index. This is because the stock market performance is well hedged with the high weighting of online gambling firms.
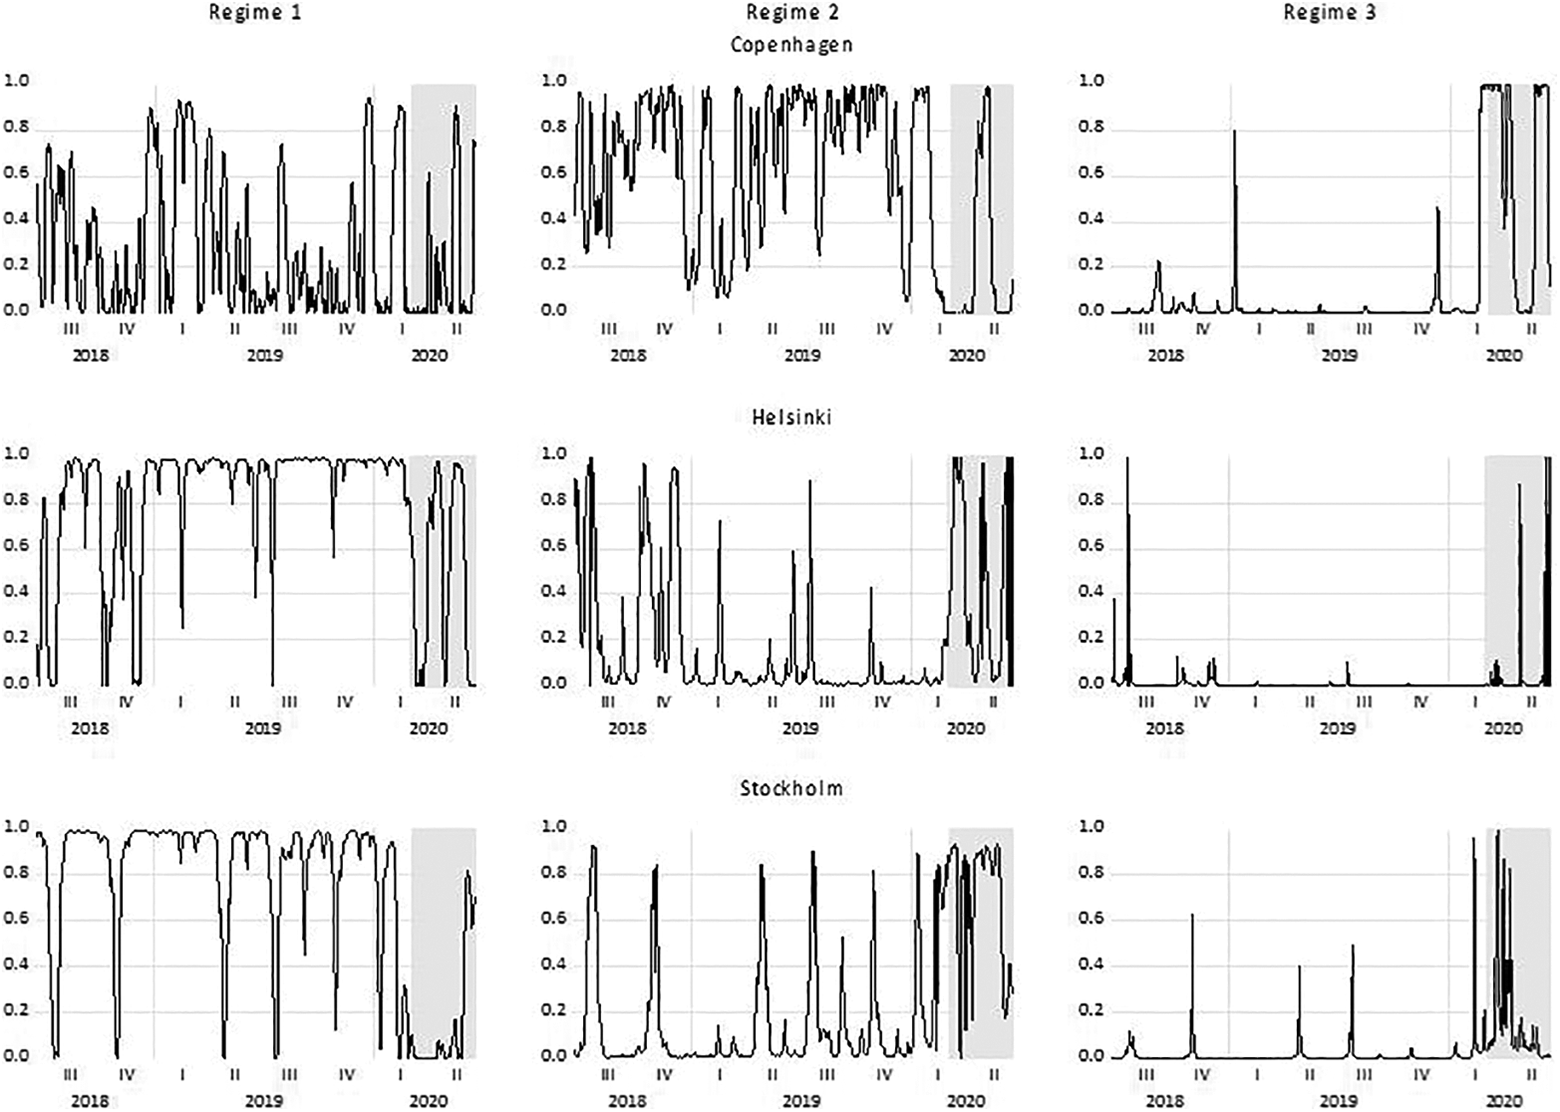
Markov switching smoothed three-regime probabilities. (1) The regimes are ordered according to the standard deviations. The lowest standard deviation is in the regime 1 and the highest is in regime 3. (2) Shaded areas indicate the period from 1 March 2020.
Estimation results for the three-regime Markov switching models.
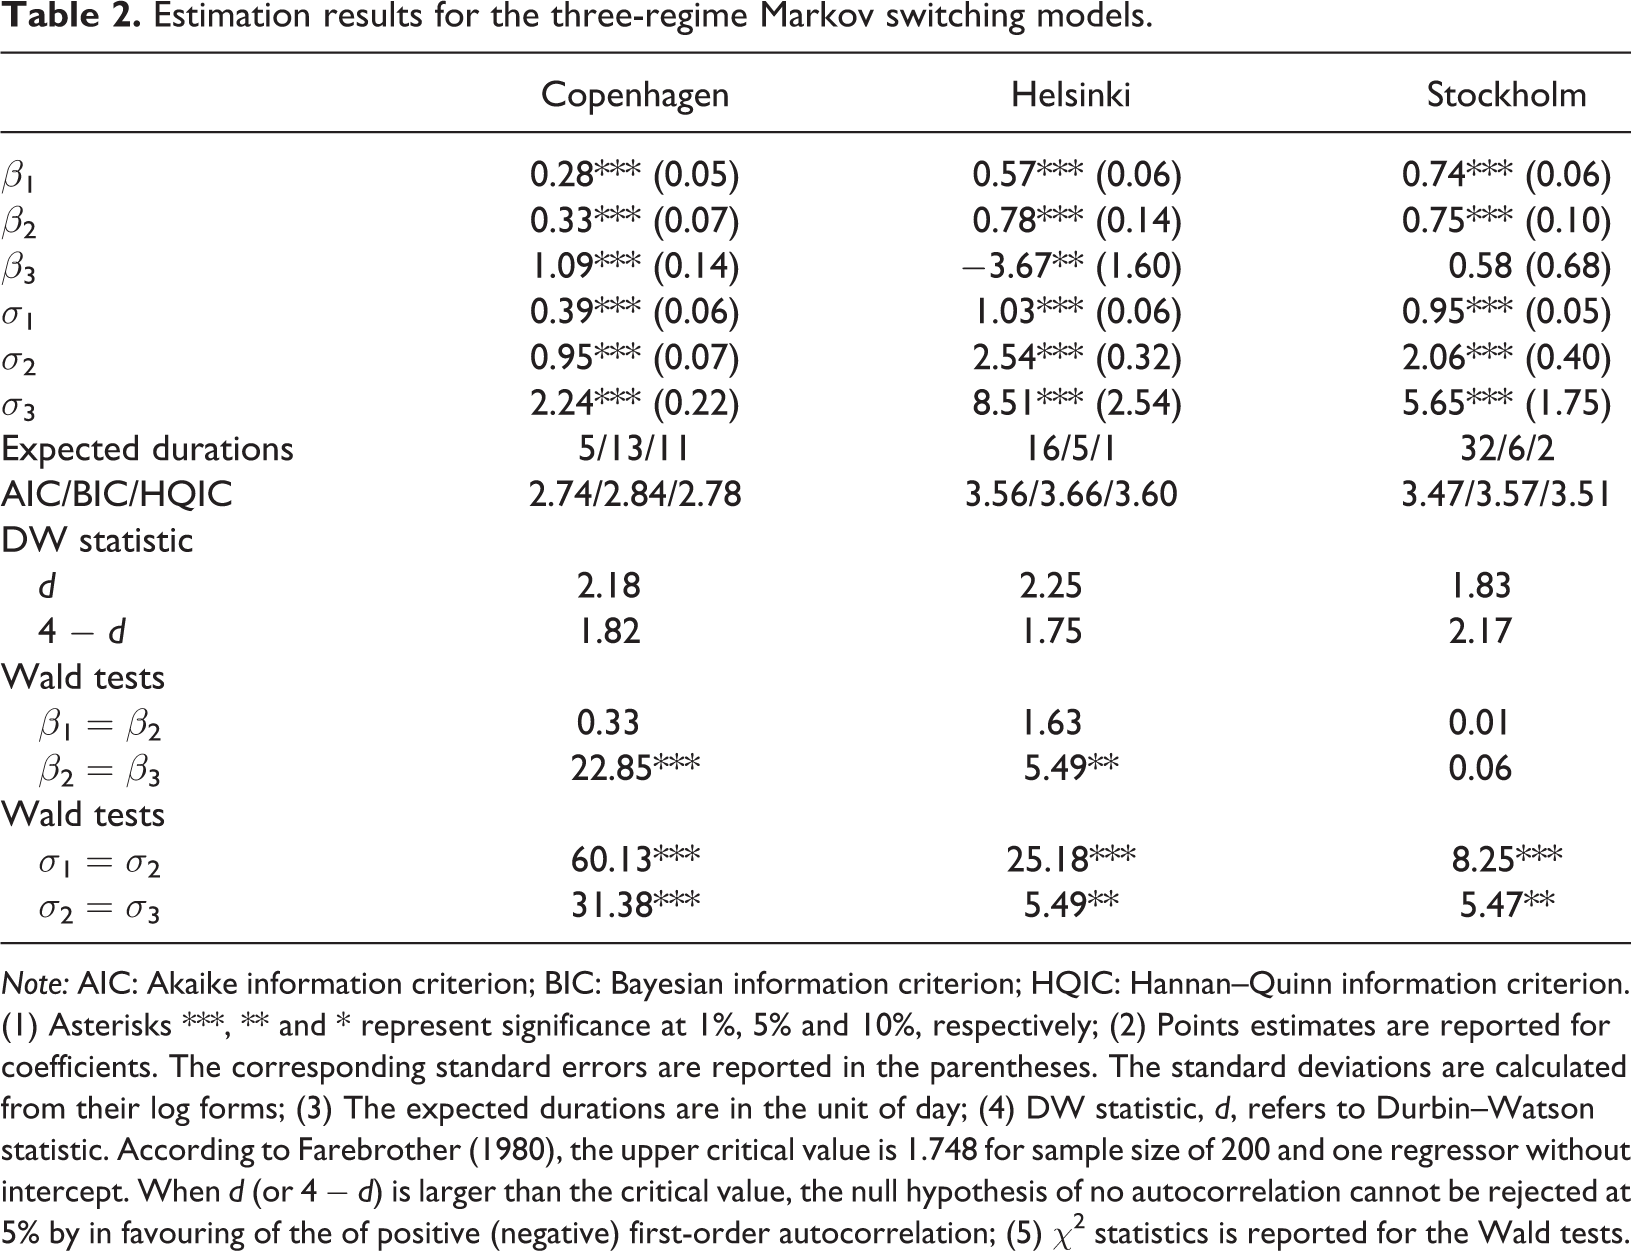
Note: AIC: Akaike information criterion; BIC: Bayesian information criterion; HQIC: Hannan–Quinn information criterion. (1) Asterisks ***, ** and * represent significance at 1%, 5% and 10%, respectively; (2) Points estimates are reported for coefficients. The corresponding standard errors are reported in the parentheses. The standard deviations are calculated from their log forms; (3) The expected durations are in the unit of day; (4) DW statistic, d, refers to Durbin–Watson statistic. According to Farebrother (1980), the upper critical value is 1.748 for sample size of 200 and one regressor without intercept. When d (or 4 − d) is larger than the critical value, the null hypothesis of no autocorrelation cannot be rejected at 5% by in favouring of the of positive (negative) first-order autocorrelation; (5) χ2 statistics is reported for the Wald tests.
As a robust validation of the above results, results for the Markov switching model with two regimes are presented (Table 3). First, by comparing the information criteria, the three-regime model for the Copenhagen market has far better information criteria. Nevertheless, there is no clear evidence to prefer the three-regime model for Helsinki and Stockholm. However, it can be noted that there is a disadvantage for adopting a two-regime model even for these two markets. The low–high volatility regime switching model may not be able to isolate the crisis period. The high-volatility regime can also be observed in the period other than the outbreak of Covid-19. Second, in case of Copenhagen, the lags of the sector return need to be added in order to improve the estimation, although the two-regime model cannot compete with the three-regime model according to all information criteria.
The main result (Figure 3) from this robust validation is that the changed regimes are characterized by low and high sigma coefficients and not by changes in the beta coefficients which remain statistically indifferent across the regimes. At the same time, during the crisis, it is more likely that the regime of high volatility would occur. These results are consistent with the main conclusion from the three-regime model.
Robustness check and estimation results for the two-regime Markov switching models.
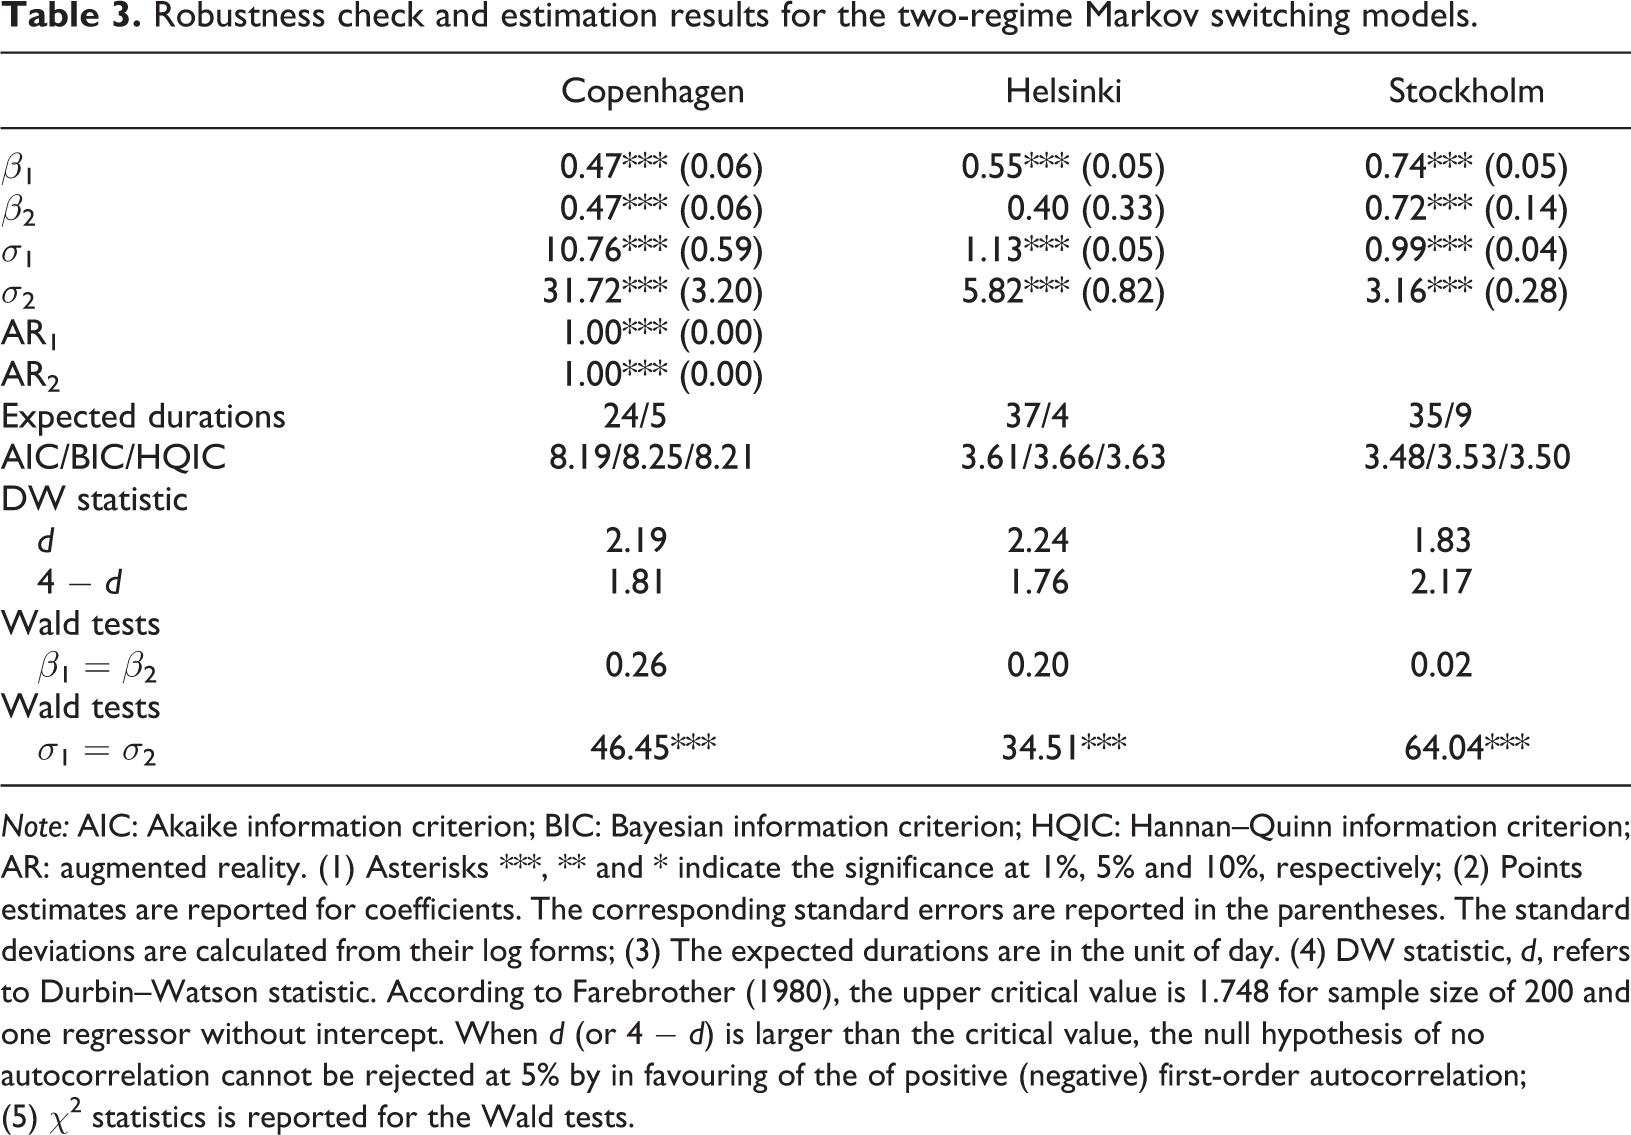
Note: AIC: Akaike information criterion; BIC: Bayesian information criterion; HQIC: Hannan–Quinn information criterion; AR: augmented reality. (1) Asterisks ***, ** and * indicate the significance at 1%, 5% and 10%, respectively; (2) Points estimates are reported for coefficients. The corresponding standard errors are reported in the parentheses. The standard deviations are calculated from their log forms; (3) The expected durations are in the unit of day. (4) DW statistic, d, refers to Durbin–Watson statistic. According to Farebrother (1980), the upper critical value is 1.748 for sample size of 200 and one regressor without intercept. When d (or 4 − d) is larger than the critical value, the null hypothesis of no autocorrelation cannot be rejected at 5% by in favouring of the of positive (negative) first-order autocorrelation; (5) χ2 statistics is reported for the Wald tests.
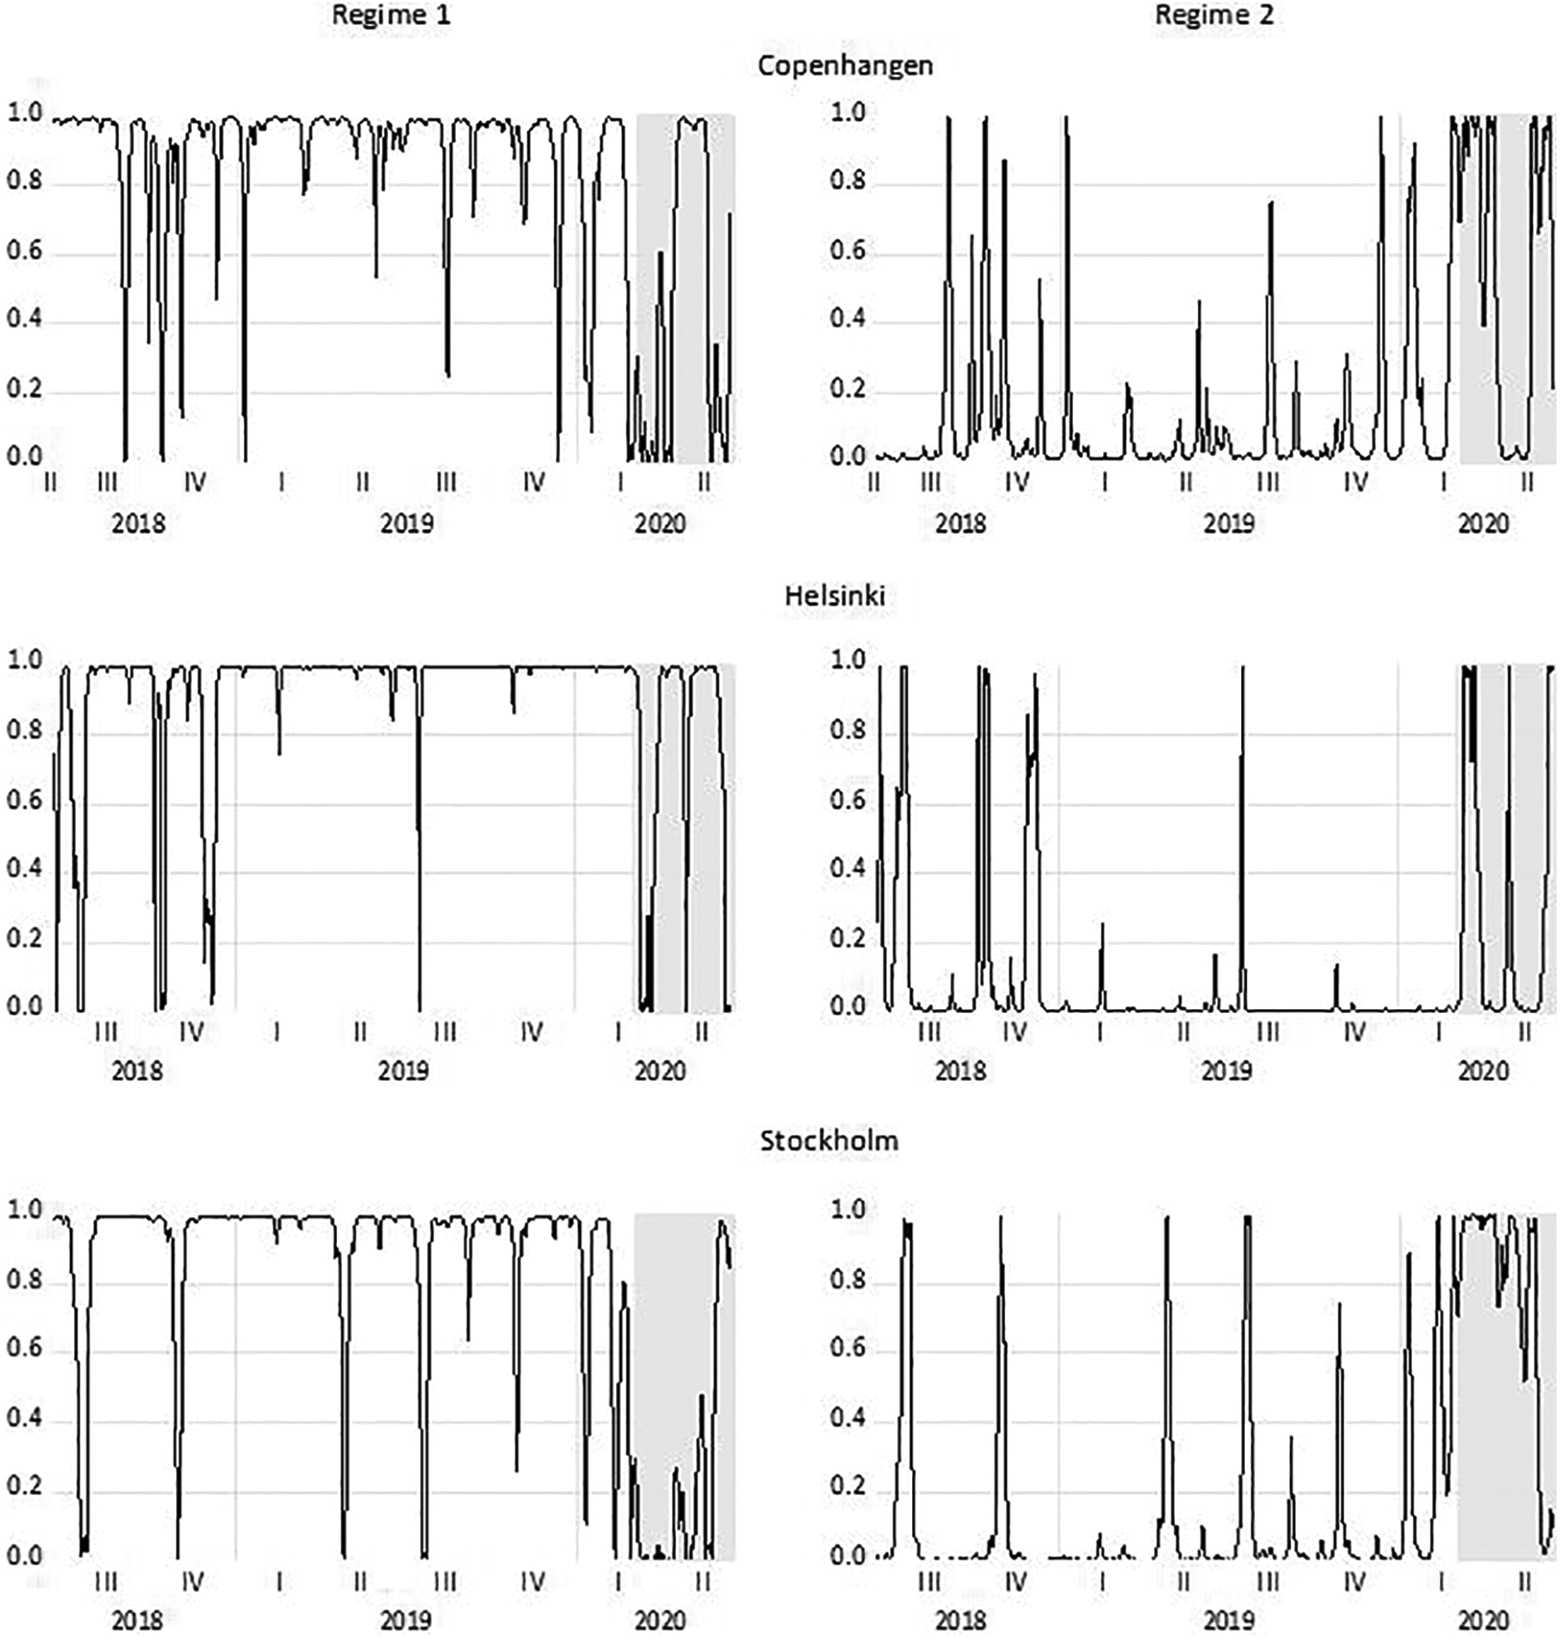
Robustness check: Markov switching smoothed two-regime probabilities. (1) The regime 1 has the low standard deviation and the regime 2 has a higher standard deviation. (2) Shaded areas indicate the period from 1 March 2020.
An additional robustness validation is based on the composite index for all Nordic countries (except Norway). The results are reported in Table 4. The three-regime model is consistent with the estimations for the individual countries, except that the beta coefficients are not statistically different.
Robustness check: Estimation results of Nordic indices.
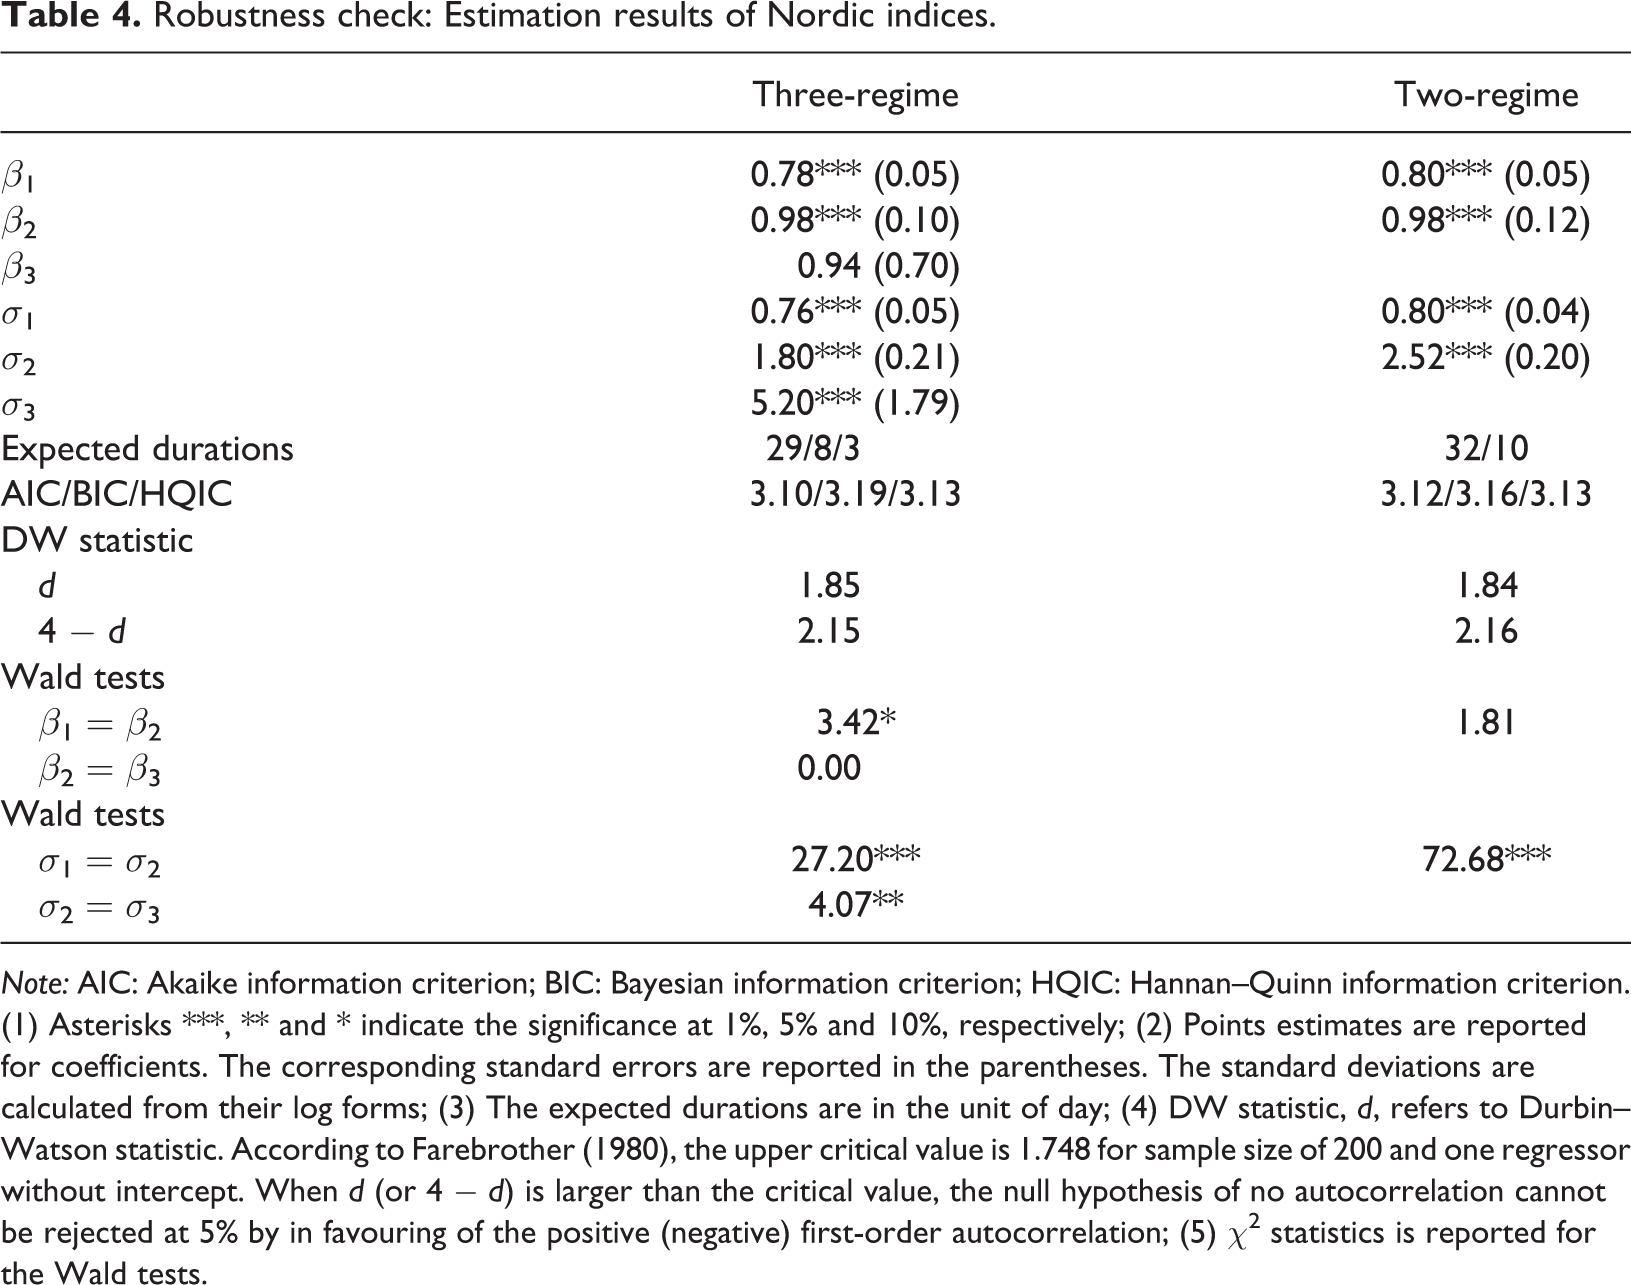
Note: AIC: Akaike information criterion; BIC: Bayesian information criterion; HQIC: Hannan–Quinn information criterion. (1) Asterisks ***, ** and * indicate the significance at 1%, 5% and 10%, respectively; (2) Points estimates are reported for coefficients. The corresponding standard errors are reported in the parentheses. The standard deviations are calculated from their log forms; (3) The expected durations are in the unit of day; (4) DW statistic, d, refers to Durbin–Watson statistic. According to Farebrother (1980), the upper critical value is 1.748 for sample size of 200 and one regressor without intercept. When d (or 4 − d) is larger than the critical value, the null hypothesis of no autocorrelation cannot be rejected at 5% by in favouring of the positive (negative) first-order autocorrelation; (5) χ2 statistics is reported for the Wald tests.
The main finding that the high-volatility regime in three markets mainly occurs during the first wave of the crisis period is robust. Nevertheless, this crisis period is characterized as a more frequent switching among the three regimes, reflecting the high level of uncertainty in the travel and leisure industry (Figure 4). The differences in the structure of the industry and the different strategies of measures to combat the Covid-19 outbreak mean that the outlook for the industry, investor confidence and consumer behaviour varies from country to country. The cross-country comparisons can provide useful information for policy in the second wave and post-crisis recovery period.
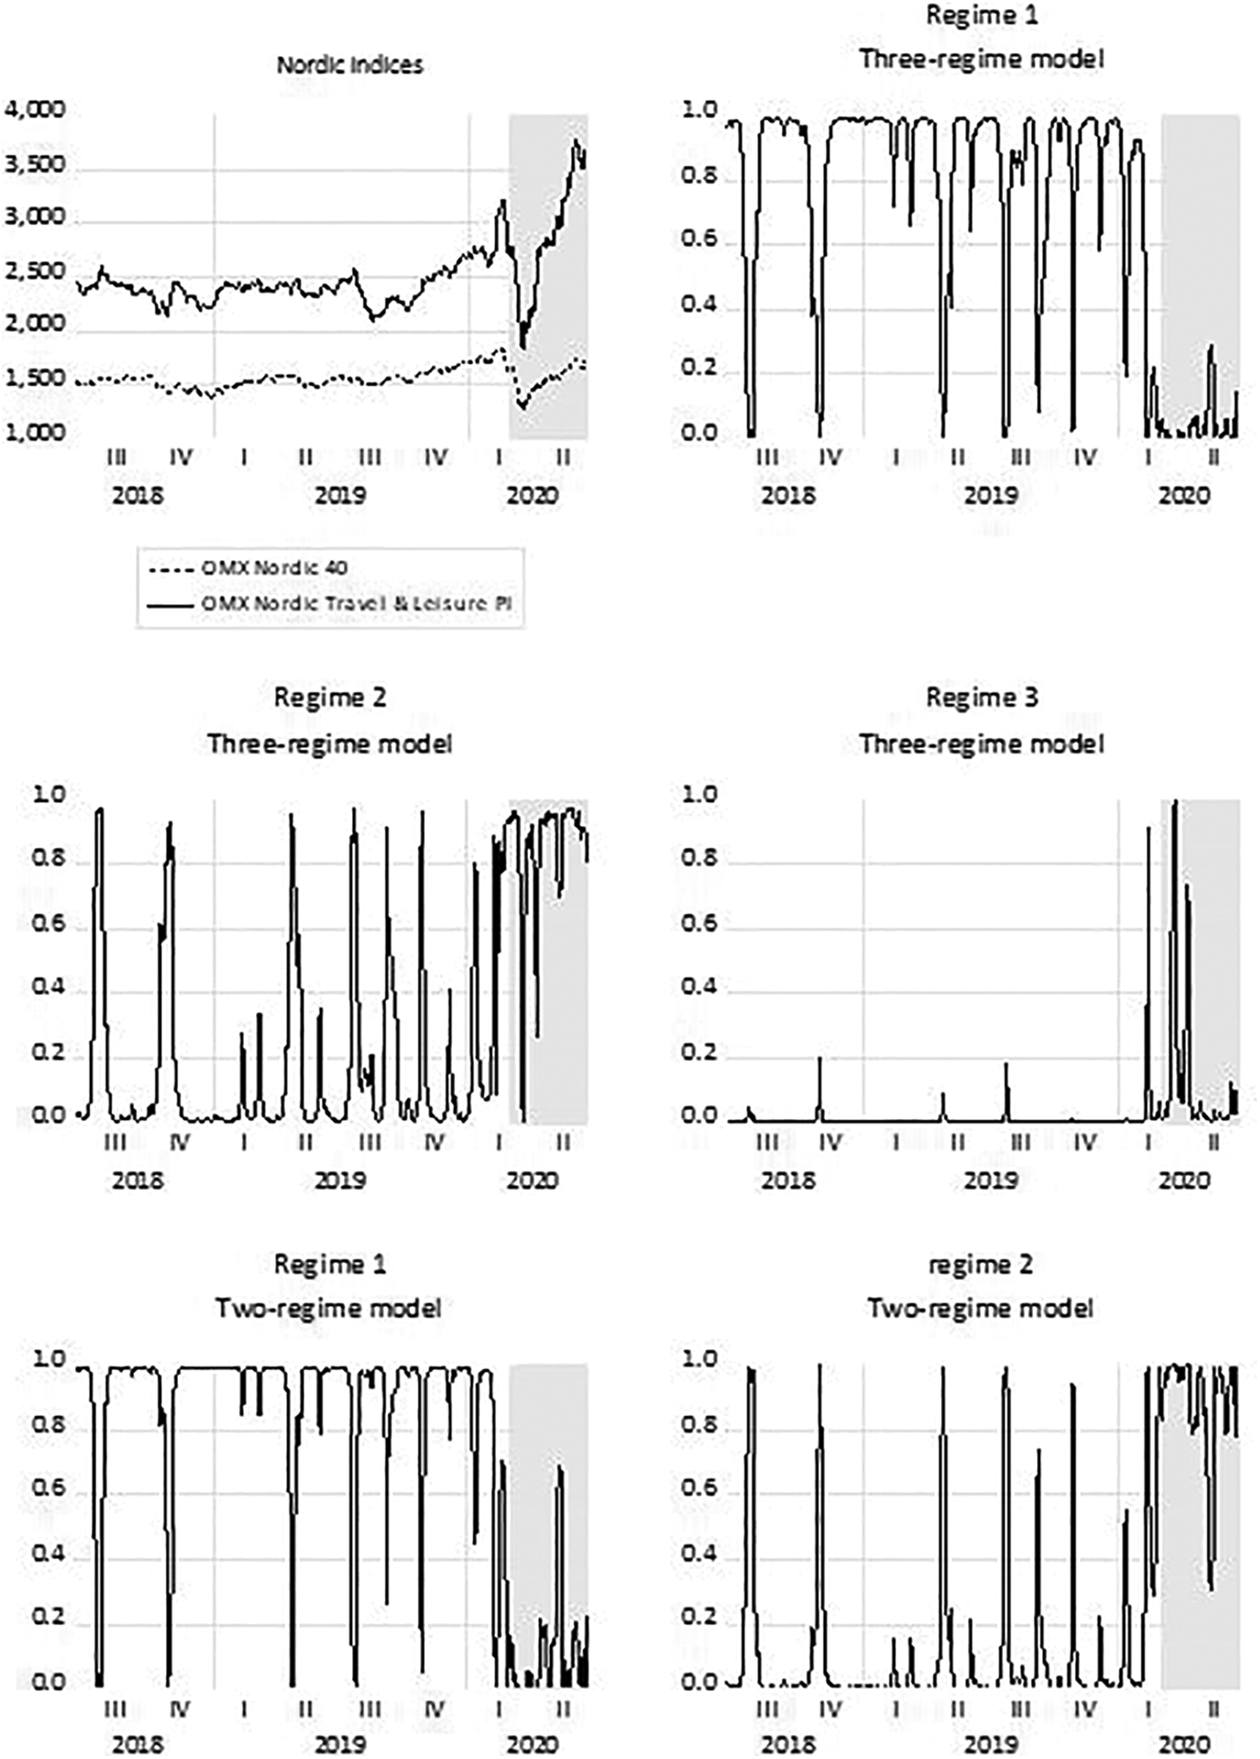
Robustness check. The regression is based on the Nordic indices. (1) Nordic indices contain the firms listed on Copenhagen, Helsinki, Iceland and Stockholm (but not Oslo) Stock Exchanges. The order of regimes is according to the size of standard deviations. Both indices are in terms of EUR. (2) Shaded areas indicate the period from 1 March 2020.
Conclusions
This study uses a Markov switching model to investigate returns to travel and leisure stocks in three Nordic countries during the initial phase of the Covid-19 pandemic. Results show that the crisis period is characterized by high probabilities for the highest idiosyncratic risks and frequently regime switching, as compared to that before the breakout of the pandemic when the variation was moderate. In addition, the crisis also leads to heterogenous changes in beta coefficients: long-lasting changes in Denmark, short-lasting but negative changes in Finland and no significant changes in Sweden. At the same time, the crisis regime in Denmark and Finland mainly occurred in the late part of the sample, while that regime in Sweden took place in the initial period of the first wave of pandemic.
The heterogeneity can be explained by the composition of the leisure and travel industry in each country. The beta coefficients are negative, with the highest sigma (idiosyncratic risks) among the three countries, in Finland during the first wave of pandemic, where this industry is dominated by traditional transport and hospitality firms. In Sweden, there is no significant change in beta coefficients, which means that the high proportion of online gambling included in this industry evens out the decline by traditional leisure and travel firms. Nevertheless, the crisis period is characterized by high/medium idiosyncratic risks. In Denmark, on the other hand, a long duration of increases in beta coefficients and high idiosyncratic risks can be explained by the fact that the firms considered are highly dependent on demand from domestic visitors and from firms in the local entertainment and sport events business. This may also explain that the high (at the medium level) idiosyncratic risks dominate even before the outbreak of Covid-19.
Overall, the empirical results based on high-frequency data can provide timely information on the extent to which the crisis has affected different travel and leisure firms, which is needed in the policymaking process. Travel and leisure companies are affected differently by the crisis. International transport companies are the hardest hit, while online gambling companies benefit. To cope with the shock, short-term support measures are needed for the affected companies. There are crucial implications in finance and investment arising from this study for diversification and asset allocation.
A major limitation of the study is the focus on listed firms. These firms tend to be large and do not necessarily reflect the structure within specific sectors such as the travel, tourism and leisure industry, where there are many small- or micro firms. However, the large firms are often dependent on the smaller ones through significant backwards, forward and indirect linkages, implying that the representativeness of the results are not overly weakened.
Another limitation is that the analysis only covers the stock market in three Nordic countries. These countries are not representative for Europe or other world regions because they are not heavily dependent on international tourism. The travel and leisure stock market also contains a large number of online gaming firms which are not present in other parts of Europe.
More sophisticated Markov models (Haas et al., 2004), which control the GARCH explicitly, and stock market data for the markets beyond Nordic countries can be used for future work. Another idea for future work is to include information on government measures on social distancing and reduced mobility.
Supplemental material
Supplemental Material, sj-docx-1-teu-10.1177_1354816621990937 - Nordic stock market performance of the travel and leisure industry during the first wave of Covid-19 pandemic
Supplemental Material, sj-docx-1-teu-10.1177_1354816621990937 for Nordic stock market performance of the travel and leisure industry during the first wave of Covid-19 pandemic by Xiang Lin and Martin Thomas Falk in Tourism Economics
Footnotes
Acknowledgements
The authors would like to thank Eva Hagsten for helpful comments on an earlier draft. Gail Ricksecker conducted a careful proofreading of the manuscript.
Declaration of conflicting interests
The author(s) declared no potential conflicts of interest with respect to the research, authorship, and/or publication of this article.
Funding
The author(s) received no financial support for the research, authorship, and/or publication of this article.
Supplemental material
Supplemental material for this article is available online.
References
Supplementary Material
Please find the following supplemental material available below.
For Open Access articles published under a Creative Commons License, all supplemental material carries the same license as the article it is associated with.
For non-Open Access articles published, all supplemental material carries a non-exclusive license, and permission requests for re-use of supplemental material or any part of supplemental material shall be sent directly to the copyright owner as specified in the copyright notice associated with the article.