
Abstract
As hospitality and tourism (H&T) businesses mature, they often seek institutional equity financing to support their growth. Capital intensive H&T firms, such as cruise operators, casinos and large restaurant and hotel chains, continuously rely on institutional capital to fund their operations. This study examines which corporate social responsibility dimensions affect H&T firms’ ability to attract institutional equity capital providers. We document that firms with better social and governance performance have higher institutional ownership, particularly by investors focused on long-term growth and value creation, such as dedicated institutional investors, domestic investors and blockholders. Community and environmental performance do not increase institutional holdings.
Keywords
Introduction
Corporate social responsibility (CSR) is a ‘concept whereby companies integrate social and environmental concerns in their business operations and in their interaction with their stakeholders on a voluntary basis’ (European Commission, 2001: p. 3). This study examines whether CSR affects hospitality and tourism (H&T) firms’ ability to attract and maintain the desired level of institutional capital to support and grow their operations and which CSR dimensions play key roles in driving this relation. These questions are important for three reasons. First, as H&T businesses mature and expand, their ability to attract external equity is essential to support growth as the owners’ resources are limited. Thus, H&T owners and managers need to know whether their CSR activities will influence their ability to attract and maintain the required levels of external equity capital. Institutional equity funding is important as (1) H&T businesses often struggle to secure bank lending or face steep borrowing costs and (2) the capital requirements to expand and grow H&T businesses typically exceed the resources of the founders. 1
Second, several H&T sectors, such as casinos, cruise operators and restaurant and hotel chains, are capital intensive and require substantial ongoing investments in infrastructure and services. Therefore, these businesses need to (1) frequently seek external equity capital and (2) maintain high levels of institutional funding. For example, the capital spending of Royal Caribbean Cruises was $3.6 billion in 2018, two times the reported income of $1.8 billion. The media routinely mention new stock issuances by companies such as Burger King Holdings, Bloomin’ Brands, Cinemark Holdings, Hilton Worldwide Holdings, Host Hotels and Resorts, MGM Resorts International, Starbucks and Wynn Resorts, which these firms use to finance their operations (Feng and Tseng, 2019). 2 Thus, the ability to continually attract institutional investors is essential for the survival and growth of large, capital intensive H&T businesses. High capital requirements mean that H&T firms are particularly sensitive to reductions in an already high level of institutional holdings and capital outflows can severely impair operations, potentially leading to bankruptcies. 3 High funding requirements in the H&T industry were laid bare during the coronavirus pandemic (COVID-19), as businesses had to continue covering high overheads (e.g. rent and maintenance of restaurants, hotels and cruise ships) when they were not earning any revenue to cover those costs. Thus, whether CSR can promote more institutional funding, particularly from long-term investors willing to support businesses over long periods of time, is an important question for managers in the H&T industry.
Third, we focus on institutional investors as they are the main equity capital providers in the market. For example, the 2017 Pensions and Investments report highlights that ‘[I]nstitutions own about 78% of the market value of the U.S. broad-market Russell 3000 index, and 80% of the large-cap S&P [Standard and Poor’s] 500 index’. Thus, when searching for external equity financing, H&T businesses typically seek financing from institutional investors. Understanding the CSR preferences of the latter can affect H&T firms’ ability to attract these investors. Further, an increasing proportion of investment funds considers CSR to be a criterion for their investments. Stevens (2018) estimates that investment funds explicitly accounting for firms’ CSR performance grew to $30 trillion in 2018 and could reach $50 trillion over the next two decades. Thus, as investors increasingly prioritise CSR among the factors influencing their capital allocation decisions, it is important for H&T firms’ managers to understand which CSR dimensions matter.
To explain why institutional investors would consider firms’ CSR performance in their investment decisions, we build on two literature streams. First, we build on the agency theory and propose that CSR aligns managers’ and shareholders’ interests, which in turn reduces the likelihood of managers misappropriating corporate funds (Kim et al., 2017). CSR commits firms to corporate behaviour that respects employees, the environment and the community in which they operate (Dare, 2016). Although there is no agreed-on set of rules or actions that a firm should take to be considered as meeting its CSR, investors and CSR rating agencies agree that a firm’s attitude towards its employees, environment, customers, community and corporate governance capture the key CSR dimensions. 4 A firm violating CSR norms, for example by repressing trade unions or damaging the environment, sends a signal that it is either unable or unwilling to meet its commitments. Investors can interpret this as a sign of poor managerial dedication to meet the goals of the firm’s stakeholders, including its shareholders (Flammer, 2012). We expect that institutional investors will be unwilling to commit funds to companies with a poor track record of meeting their CSR promises.
Second, we build on the corporate reputation theory and studies documenting the important role that CSR plays in building and maintaining corporate image (Nazir and Islam, 2020; Kim et al., 2021; Koseoglu et al., 2021; Ou et al., 2021). 5 RepTrak Company (2020) survey evidence suggests that CSR-related factors account for up to 41% of corporate reputation. Violating CSR commitments can lead to a reputational loss that can negatively affect a firm’s ability to attract external capital.
This study examines which CSR dimensions affect H&T firms’ ability to attract institutional equity capital providers. To date, the H&T literature has not addressed this research question, leaving a gap in the literature. Further, non-H&T literature provides mixed evidence on the association between a firm’s CSR performance and institutional ownership. 6 To answer the research question, we collect information on institutional holdings in H&T companies listed in the United States (U.S.) over the period 2010–2018. We focus on the H&T industry because of its prominence in the broader service industry in terms of employment and its significant contribution to gross domestic product (GDP): The World Travel and Tourism Council suggest a contribution of $8.8 trillion to the global economy in 2018, representing 10.4% of the world’s total GDP, with 319 million people employed in the H&T industry worldwide. 7 We purposefully use a recent sample period as CSR’s capital market impact can change over time and we want our result to be timely. 8
To capture CSR activity, we follow previous research, including Byrd et al. (2009), McGehee et al. (2009), Inoue and Lee (2011) and Feng and Tseng (2019) and identify four key CSR dimensions. The social dimension captures a firm’s relation with its employees, respect for the diversity of the corporate workforce and for human rights and citizenship within its local community. Environmental performance captures a firm’s support for the environment. Corporate governance performance measures the quality of a firm’s corporate governance mechanisms, such as its board structure, board independence and business ethics. Finally, product and service performance examines how firms respond to customer needs by providing quality, safe and innovative products and services.
Our main findings are as follows. We document that firms with better social and governance performance have higher institutional ownership. Community and environmental concerns do not increase institutional holdings. These results are consistent with those of Fernando et al. (2010), which show that the worst environmental performers have higher portfolio returns, which can motivate institutional investors to hold these stocks. Our conclusions are unchanged when we subject our results to robustness tests that include alternative estimation methods, controlling for unobservable firm characteristics, such as the performance of the managerial team, addressing endogeneity and reverse causality concerns.
We recognise that not all types of institutional investors may be desirable for H&T businesses. In particular, transient institutional investors hold stock to maximise short-term returns from stock trades, often at the expense of firms’ long-term value creation (Bushee, 2001). Such investors may not be desirable for H&T businesses focused on sustainable and long-term value creation. We document that better social and governance performance can attract dedicated investors that focus on long-term value creation, domestic investors, which are less likely to withdraw capital during market shocks, and blockholders, which tend to engage with managers to create long-term value (Edmans, 2014). Thus, the social and governance dimensions of CSR help attract investors more attuned to sustainable value creation in the H&T industry.
The rest of the paper is organised as follows. Literature review and hypothesis development discusses the relevant literature and develops the research hypotheses. We present the data and research methods in Data and research methods. Regression results reports the empirical results and the discussion and conclusions follow in Section 5.
Literature review and hypothesis development
CSR in the H&T industry
Dowling and Pfeffer’s (1975) organisation legitimacy theory highlights that CSR legitimises a firm in the eyes of customers, employees and local communities as the firm commits to respect and adhere to commonly accepted social values. Gray et al. (2010, p. 28) highlight that ‘organisations can only continue to exist if the society in which they are based perceives the organisation to be operating to a value system that is commensurate with the society’s own value system’. Deegan (2009) stresses that companies need to continuously assure stakeholders that they are functioning within the legal and social bonds and norms. Deegan and Samkin (2009) emphasise that companies do not operate in isolation but through establishing ‘social contracts’ with various stakeholders, such as employees, communities, regulators and shareholders. CSR helps to legitimise the social contract between a firm and the societies with which it interacts.
The need for legitimacy can explain the link between CSR activities in the H&T industry and employee engagement (Gürlek and Tuna, 2019), business reputation (Fu et al., 2014) and customer loyalty (Vassilikopoulou et al., 2005). The emerging hospitality economics literature has also explored the link between CSR and financial performance (Lee and Park, 2009; Kang et al., 2010; 2015; Theodoulidis et al., 2017; Ringham and Miles, 2018) and firm value (Lee et al., 2013). Feng, Wang and Huang (2014) report that tourism firms in Western countries with active CSR programmes have a lower cost of equity. Watts and Holme (1999) highlight that CSR reflects a business’s commitment to contribute to economic development through improving the quality of life of its workforce, local community and greater society. H&T firms devote significant resources to CSR activities. This reflects the increased attention to the sustainability of the H&T business model, which has been criticised for significant externalities, such as negative effects on employees and on the environments and communities in which the businesses operate. To illustrate, Cohen et al. (2014) highlight that by 2050, tourism will likely generate 40% of global carbon emissions. However, the literature has not yet examined how an H&T firm’s CSR activities affect its ability to attract institutional funding, which is the focus of this study.
Institutional investors and firms’ CSR activities
Institutional investors, such as insurance companies, pension and mutual funds, held between 78% and 80% of the total market value of stocks listed in the United States in 2017, compared to 34% in 1980 (The 2017 Pensions and Investments Report). Previous research documents a positive association between institutional ownership and firm value (Duggal and Millar, 1999; Woidtke, 2002). Institutional investors promote value creation by improving firms’ corporate governance, which includes changing executive compensation, removing underperforming managers and promoting performance though proxy proposals (Smith, 1996; Strickland et al., 1996; Wahal, 1996; Carleton et al., 1998). Dedicated institutional investors also allow managers to focus on long-term projects and value creation by promoting spending on innovation and investments (Aghion et al., 2009). In contrast to institutional investors, retail investors have limited capital and invest for short-term profit maximisation (Odean, 1999; Barber and Odean, 2000, 2008; Barber et al., 2009).
We expect that firms’ CSR activities will affect institutional investors’ choice of firms in which to invest. Institutional investors use a variety of signals to assess a firm’s investment risk and gauge the commitment of a firm’s managerial team to creating value. When deciding on their investments, institutional investors conduct detailed analyses of firms’ financial performance, follow analyst recommendations and participate in conference calls with managers (Davis and Steil, 2004). CSR sends a valuable signal concerning (1) the firm’s commitment to ethical and conscientious behaviour, and thus its ability and commitment to meet various stakeholders’ demands and expectations of the firm and (2) the firm’s ability to mitigate ‘legitimisation risk’ (Lindblom, 1994). Consistent with the signalling effect, Aggarwal et al. (2015) document that institutional investors reduce holdings in companies subjected to regulatory interventions related to accounting misstatements, which they interpret as a managerial lack of commitment to truthful disclosure. Legitimisation risk reflects the negative consequences of unexpected events, such as financial or environmental scandals. Firms’ CSR activities can build reputational capital that helps mitigate the negative consequences of such events. Consistent with this, Lins et al., (2017, 1785) report that ‘firms with high social capital, as measured by CSR intensity, had stock returns that were four to seven percentage points higher than firms with low social capital during the 2008–2009 financial crisis’. The authors state that the ‘evidence suggests that the trust between a firm and both its stakeholders and investors, built through investments in social capital, pays off when the overall level of trust in corporations and markets suffers a negative shock’. Thus, we expect that institutional investors will consider a firm’s CSR performance when deciding whether to invest in it and will hold more shares in companies with better CSR performance. Therefore, our first hypothesis is:
Better CSR performance is positively associated with institutional ownership. The literature recognises that different agendas and holding periods promote different types of institutional behaviour (Del Guercio, 1996; Woidtke, 2002). Transient investors have short investment horizons and favour short-term stock price gains over long-term value creation. Research shows that these investors often pressure managers to abandon long-term projects and investment in research and development (R&D) to maximise firms’ short-term income (Bushee, 1998, 2001; Edmans, 2007; Cherkes et al., 2009). Bushee (2001) documents that firms with a higher proportion of short-term institutional investors are associated with lower long-term value. In contrast, dedicated institutional investors – investors that have long investment horizons and turn their portfolios over less frequently – are willing to learn about firms and are more likely to promote long-term sustainable value creation (Chen et al., 2007). CSR legitimises a firm within its operating environment, promoting long-term value creation (Lee et al., 2013). Long-term value creation aligns with the investment horizon of dedicated investors. Therefore, we expect that dedicated investors will increase their holdings in firms with better CSR performance. Accordingly, our second hypothesis is:
Better CSR performance is associated with higher holdings by dedicated investors. Blockholders hold economically large positions in firms; thus, their wealth is more sensitive to the stock price performance of individual firms in their portfolios compared to highly diversified investors holding relatively small stakes in individual firms in their portfolios (Shleifer and Vishny, 1997; Gorton and Schmid 2000). Aoki (1984) highlights that because blockholders invest significant capital into individual firms, they perform more in-depth scrutiny and analysis of the firm. We expect that blockholders will consider a firm’s CSR performance as an indicator of potential risk, for example, the likelihood of a future regulatory action if a firm violates labour or environment regulation (Starks, 2009), and a signal of a firm’s commitment to long-term value creation (Kim et al., 2019). Highly diversified institutional investors have less incentive to spend resources on costly firm analysis and monitoring as even a large negative stock price shock to an individual firm will have a small effect on their overall portfolio performance. Consistently, Clark and Hebb (2005) highlight that investors with higher portfolio sensitivity to an individual stock’s price volatility consider the firm’s reputation, such as in terms of corporate governance quality and employee protection, when selecting firms to invest in. Lins, Servaes, and Tamayo (2017) report that firms with high CSR scores performed better than firms with low CSR scores during the 2008–2009 financial crisis as measured by the stock price performance. To safeguard their investments, blockholders often establish private communication channels with managers, actively monitor managerial performance and pressure managers to improve firm performance (Shleifer and Vishny, 1997). Blockholders are also more interested in long-term value creation as they tend to hold stock for longer. In line with this, Claessens et al. (2002) report a positive relation between firm value and concentrated ownership by the largest shareholders. Based on the above discussion, we expect that blockholders will increase their holdings in companies with better CSR performance, which leads to our third hypothesis:
Better CSR performance is associated with higher ownership by blockholders.
Data and research methods
The data on H&T companies listed in the U.S. between 2010 and 2018 were collected from the Compustat database. We start in 2010 to prevent the 2007–2009 financial crisis from affecting our analysis. Ending in 2018 ensures a gap between the end of the sample period and the COVID-19 pandemic. 9 We use Thomson Reuters Institutional Holdings 13F data to calculate quarterly institutional holdings. Institutional investment managers who exercise investment discretion over $100 million or more in Section 13(f) securities are required to report their quarterly holdings on Form 13F to the Securities and Exchange Commission within 45 days of each quarter’s end. Compustat Quarterly is the source of the quarterly financial data required to calculate the control variables. The sample is 2064 firm-quarter-years with non-missing information.
Sample distribution over time and by sector.
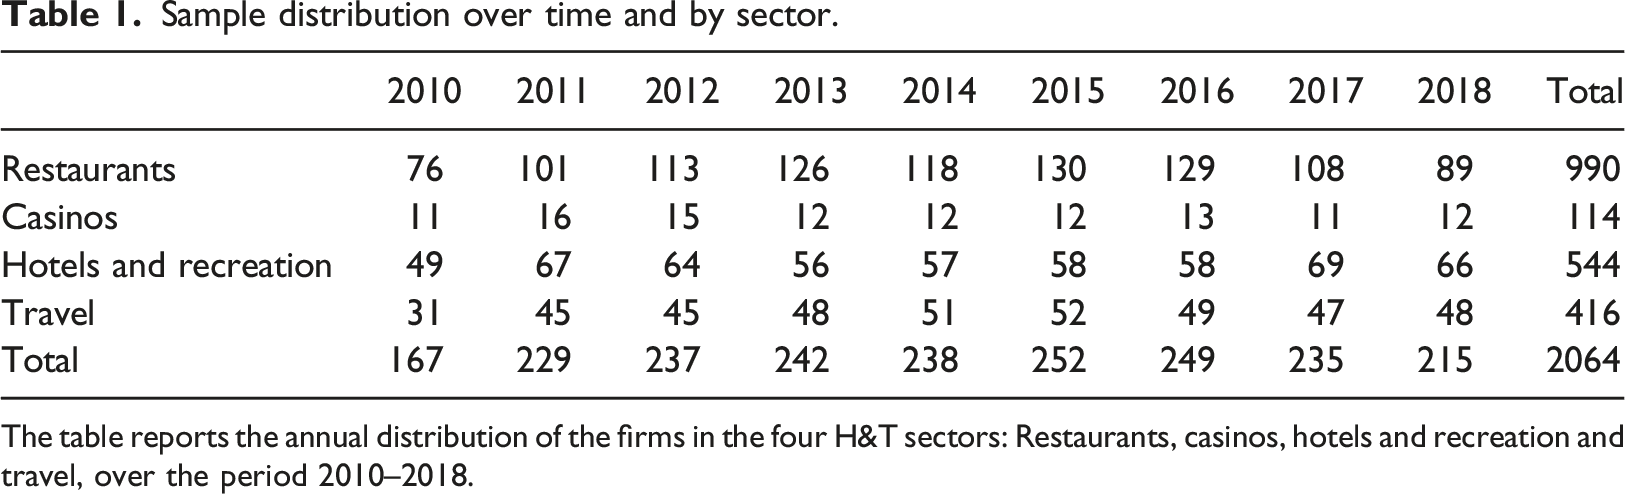
The table reports the annual distribution of the firms in the four H&T sectors: Restaurants, casinos, hotels and recreation and travel, over the period 2010–2018.
Measures of CSR
Following Clarkson (1995), Inoue and Lee (2011) and Feng and Tseng (2019), we use the Kinder, Lydenberg and Domini (KLD) data, which reflect corporate attention to key issues of interest to stakeholders to capture firms’ CSR performance. The data are collected by MSCI, an investment research company which evaluates U.S. firms that are part of the S&P 500 and Russell 3000 indexes in terms of their social, environmental, governance and product performance. MSCI collects CSR information from various sources, including the media, non-governmental organisations, governments, public documents and annual reports. Inoue and Lee (2011, p. 795) highlight that the ‘KLD database is considered the most comprehensive multidimensional CSR measures available to the public’.
There are several benefits of using KLD. First, the scores are company-specific and are based on a company’s interactions with its stakeholders. This allows us to directly measure a firm’s performance in relation to its primary stakeholders as defined by Clarkson (1995). 10 Second, by looking at each dimension independently, we avoid using a firm’s aggregate CSR score. This allows us to understand which dimensions institutional investors care about. For example, Berman et al. (1999) document that among the KLD dimensions, only employee relations show a positive association with a firm’s profitability. Third, the KLD dimensions have been firmly established in the tourism literature. Several studies have used the data, including those of Byrd et al. (2009), McGehee et al. (2009), Inoue and Lee (2011) and Feng and Tseng (2019), which builds confidence in the validity of the measures.
The KLD database identifies four key CSR dimensions. The social dimension captures four groups. The employee relations score is based on a company’s performance in ensuring employees’ health and safety, providing retirement benefits and maintaining favourable union relations. The diversity score measures how a firm integrates diversity into its management and operations, for example, through the appointment of women and minority executives. The human rights variables score a firm on the initiatives that benefit human rights, including indigenous peoples’ relations, labour and human rights policies. The community score is based on whether a company supports communities through education, charity and volunteer programmes.
The second CSR dimension is environmental performance, which is concerned with a firm’s support for the environment. This includes the use of clean energy and the provision of environmentally friendly products and services. The third dimension is corporate governance, which measures the quality of a firm’s corporate governance mechanisms, such as its board structure, board independence and business ethics. The fourth dimension is product and service performance, which scores whether a firm responds to customer needs by providing quality, safe and innovative products and services.
We follow previous studies (e.g. Turban and Greening, 1996) in measuring firms’ CSR scores in the four areas – social, environmental, corporate governance and product and service – by subtracting the total number of concerns from the total number of strengths. This generates a net score for each area. Appendix B lists definitions of the strengths and concerns in each dimension. A firm can receive a score ranging from 0 (no strength) to 2 (strong strength) in a strength area and a score ranging from 0 (no concern) to 2 (strong concern) for concerns. We then use the composite scores in the analysis. 11 In robustness tests, we show that our results are the same when we create ratios of (1 + strengths)/(1 + strengths + concerns). KLD scores are measured annually over the sample period.
Relative rankings of industries on each CSR dimension.
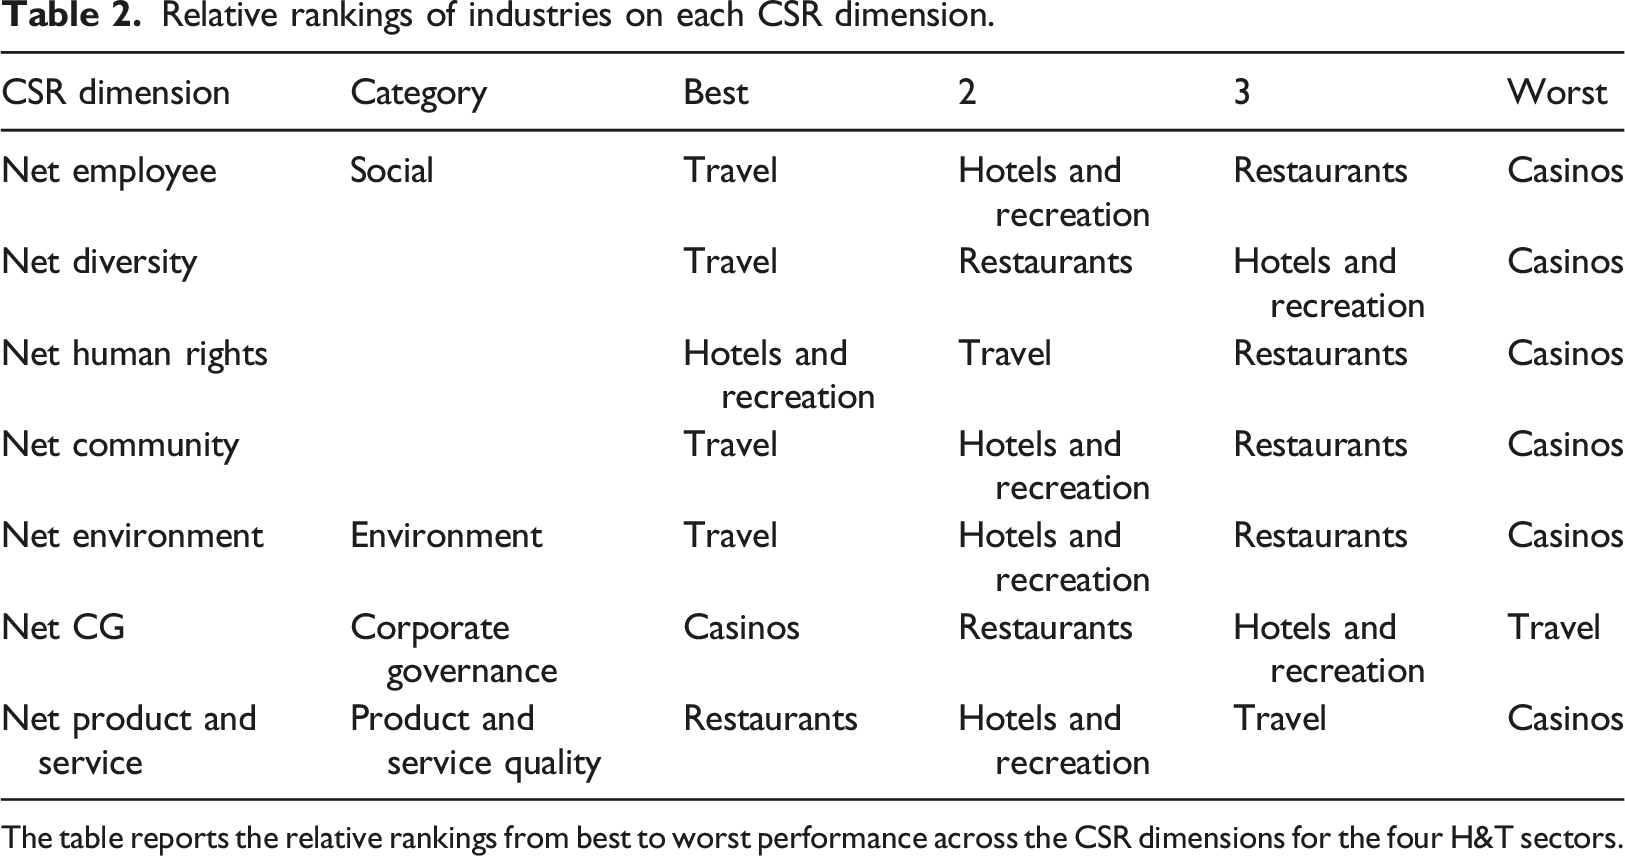
The table reports the relative rankings from best to worst performance across the CSR dimensions for the four H&T sectors.
Measures of institutional ownership
We measure institutional ownership, Institutional Ownership, as the sum of the holdings of all institutions in a firm’s stock divided by the stock’s total market capitalisation at the end of each calendar quarter. To sharpen the analysis, we also disaggregate institutional ownership into shareholding by domestic investors, Domestic IO, which is the sum of the holdings of all institutions domiciled in the U.S. divided by the firm’s market capitalisation. 12 Because institutional investors differ in their investment strategies and holding periods, we also separate holdings by investment style, using the classification from Bushee (2001). Specifically, Dedicated IO sums up the percentage of holdings by dedicated institutions, which provide stable ownership and take large shares in individual firms, and holdings by quasi-indexers, which trade infrequently and own small stakes, similar to an index strategy. Bushee (2001) documents that holdings by quasi and dedicated investors are associated with higher firm performance. Finally, we calculate holdings by blockholders, defined as investors who hold at least 5% of a company’s stock. We then measure the percentage of holdings by the top five blockholders, Top five IO. We measure institutional holdings for firm i at the end of each fiscal quarter q for year t.
The regression model we use has the form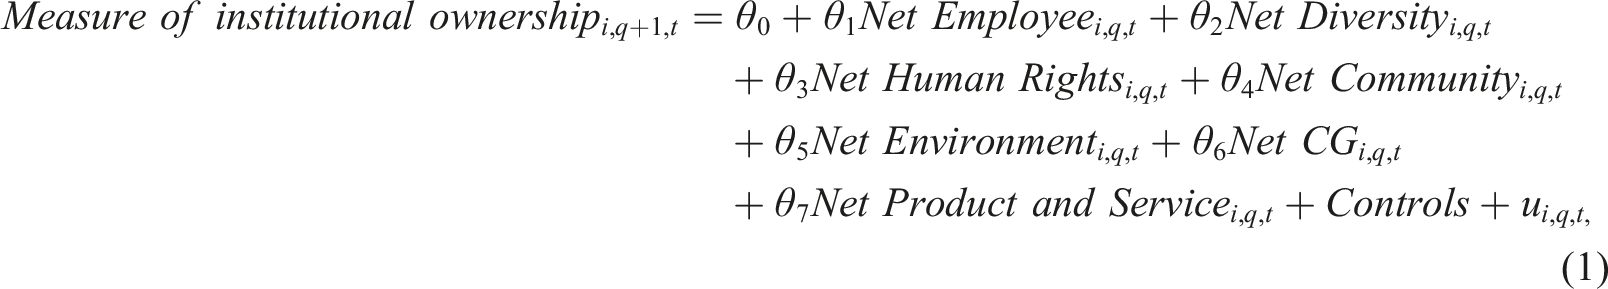
The controls include variables that previous studies associate with institutional ownership, such as firm size, measured as a firm’s market capitalisation, MV, as institutional investors tend to invest in larger firms (Edison and Warnock, 2003) and larger firms tend to have more liquid stock that facilitates institutional trade (Cooper et al., 1985). We control for firm profitability, measured by return on assets, ROA, as institutional investors may be attracted to more profitable firms (Gompers et al., 2003) and low profitability is associated with higher stock risk (Hou et al., 2015). We include the price-to-sales ratio, P/S, the book-to-market ratio, B/M and the R&D spending scaled by sales, R&D, to capture a firm’s risk and growth opportunities as institutional investors prefer growth firms (Black et al., 2006). Several studies show that firms with high B/M ratios and low investment rates are associated with higher risk (Fama and French, 1992; Bolton et al., 2011). We capture firms’ visibility using their advertising spending scaled by sales, Advertising, as institutional investors may be attracted to firms that are more visible in the market (Lang et al., 2003). Finally, we control for firms’ financial leverage, Leverage, as debt financing can act as a substitute for equity financing (Jensen and Murphy, 1990). Control variables are measured at the end of the fiscal quarter prior to the quarter where we measure institutional holdings to reduce the likelihood of reverse causality. We estimate the model using OLS with standard errors adjusted for serial correlation and heteroskedasticity.
Descriptive statistics for regression variables.
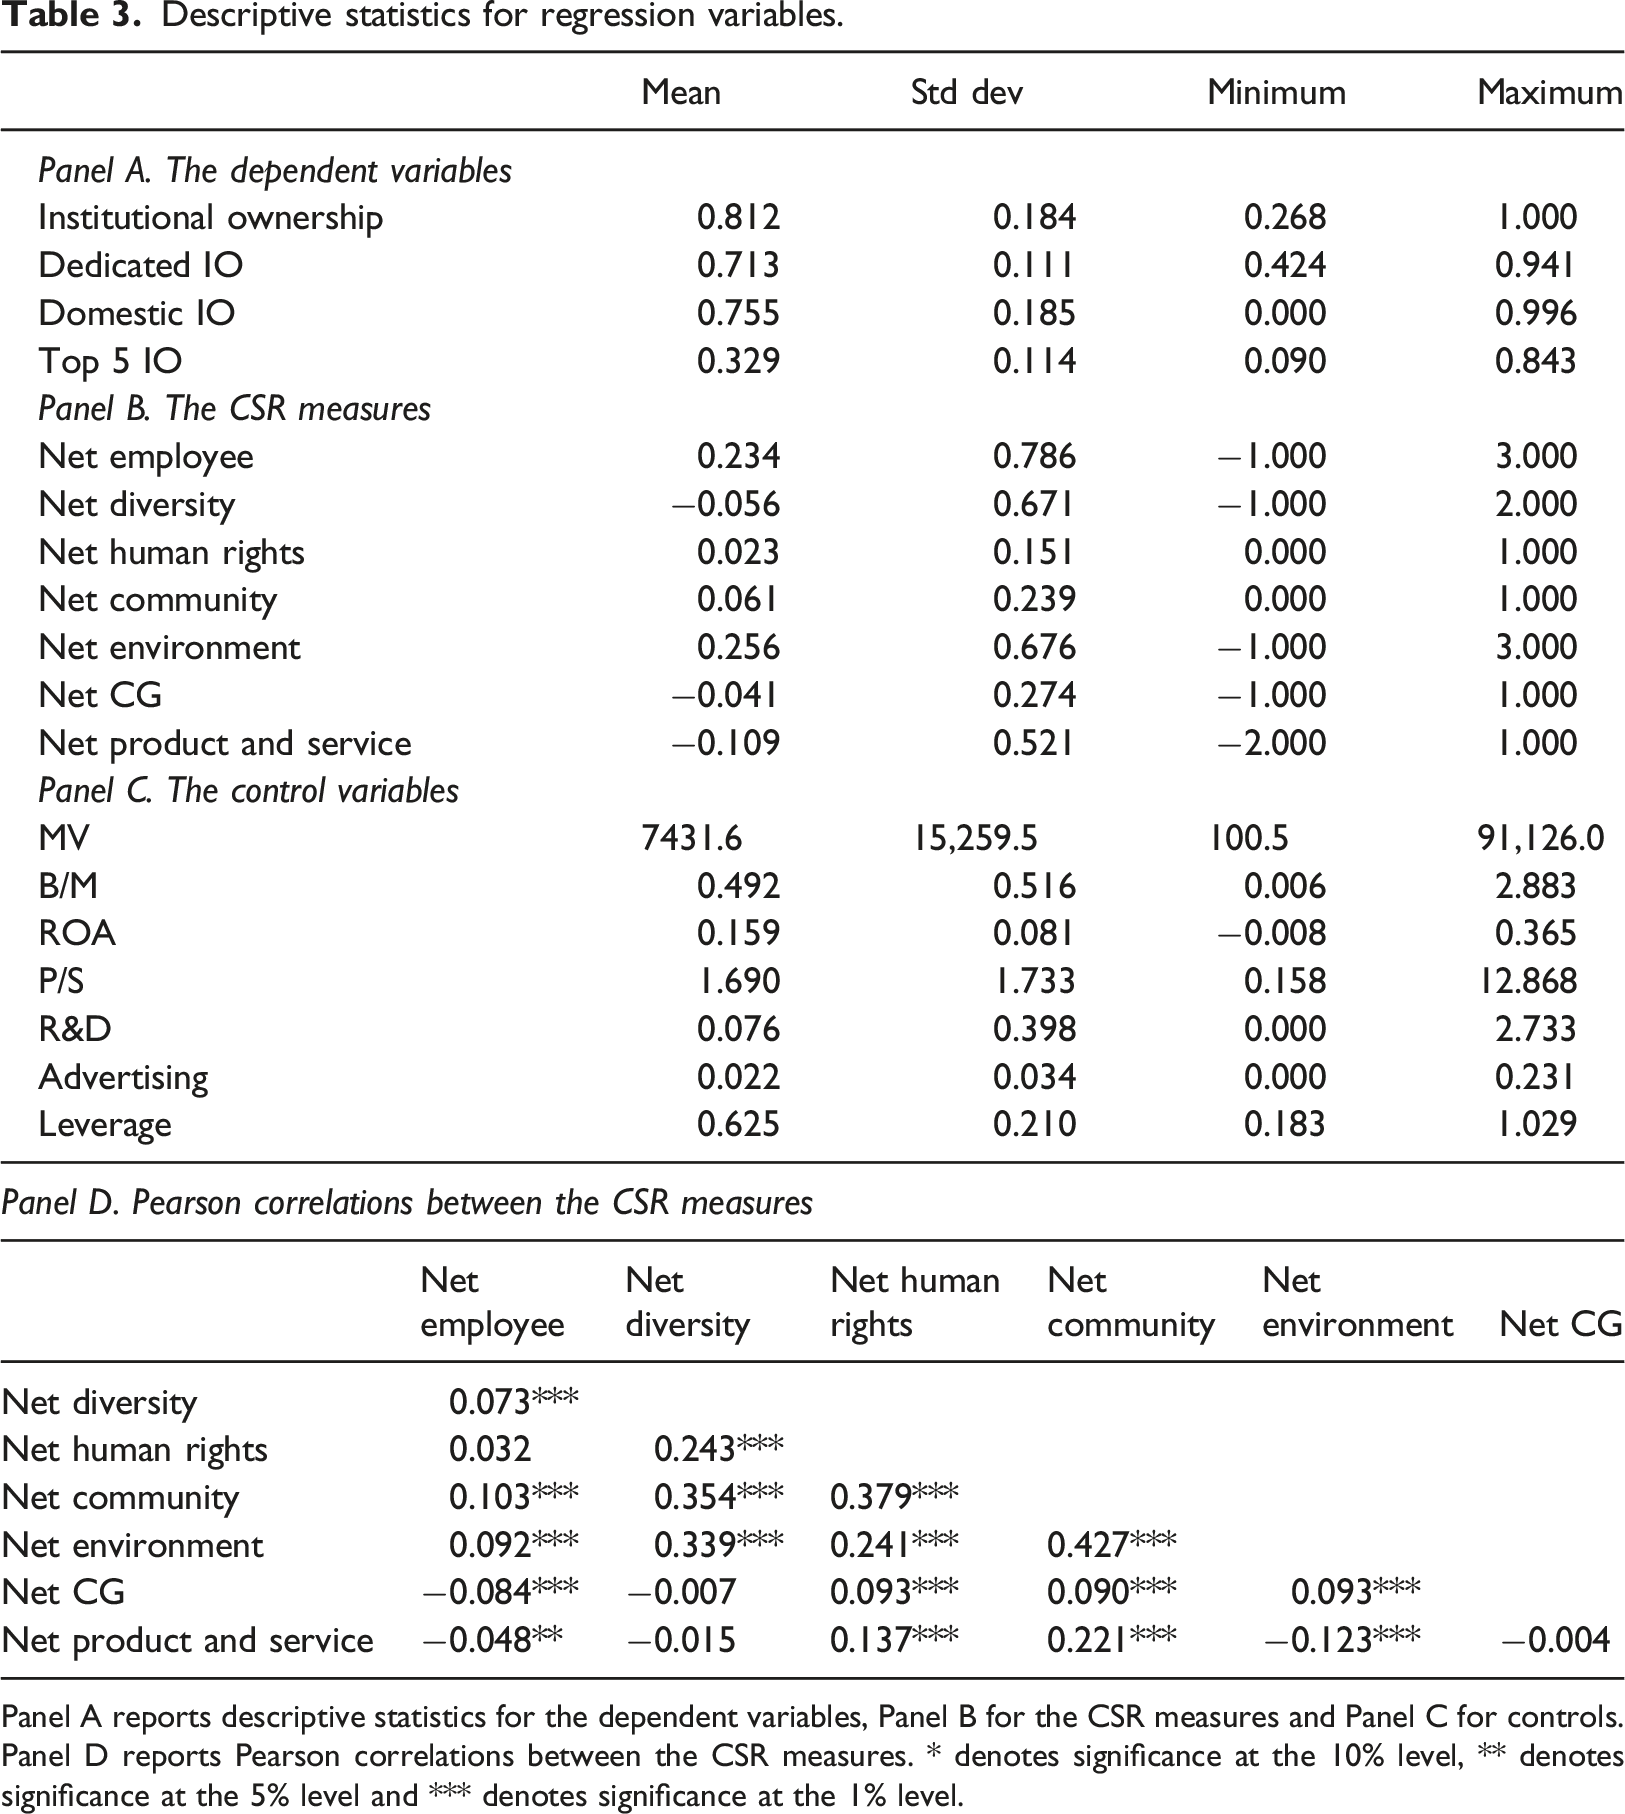
Panel A reports descriptive statistics for the dependent variables, Panel B for the CSR measures and Panel C for controls. Panel D reports Pearson correlations between the CSR measures. * denotes significance at the 10% level, ** denotes significance at the 5% level and *** denotes significance at the 1% level.
Regression results
Regression results: the relation between CSR and institutional ownership.
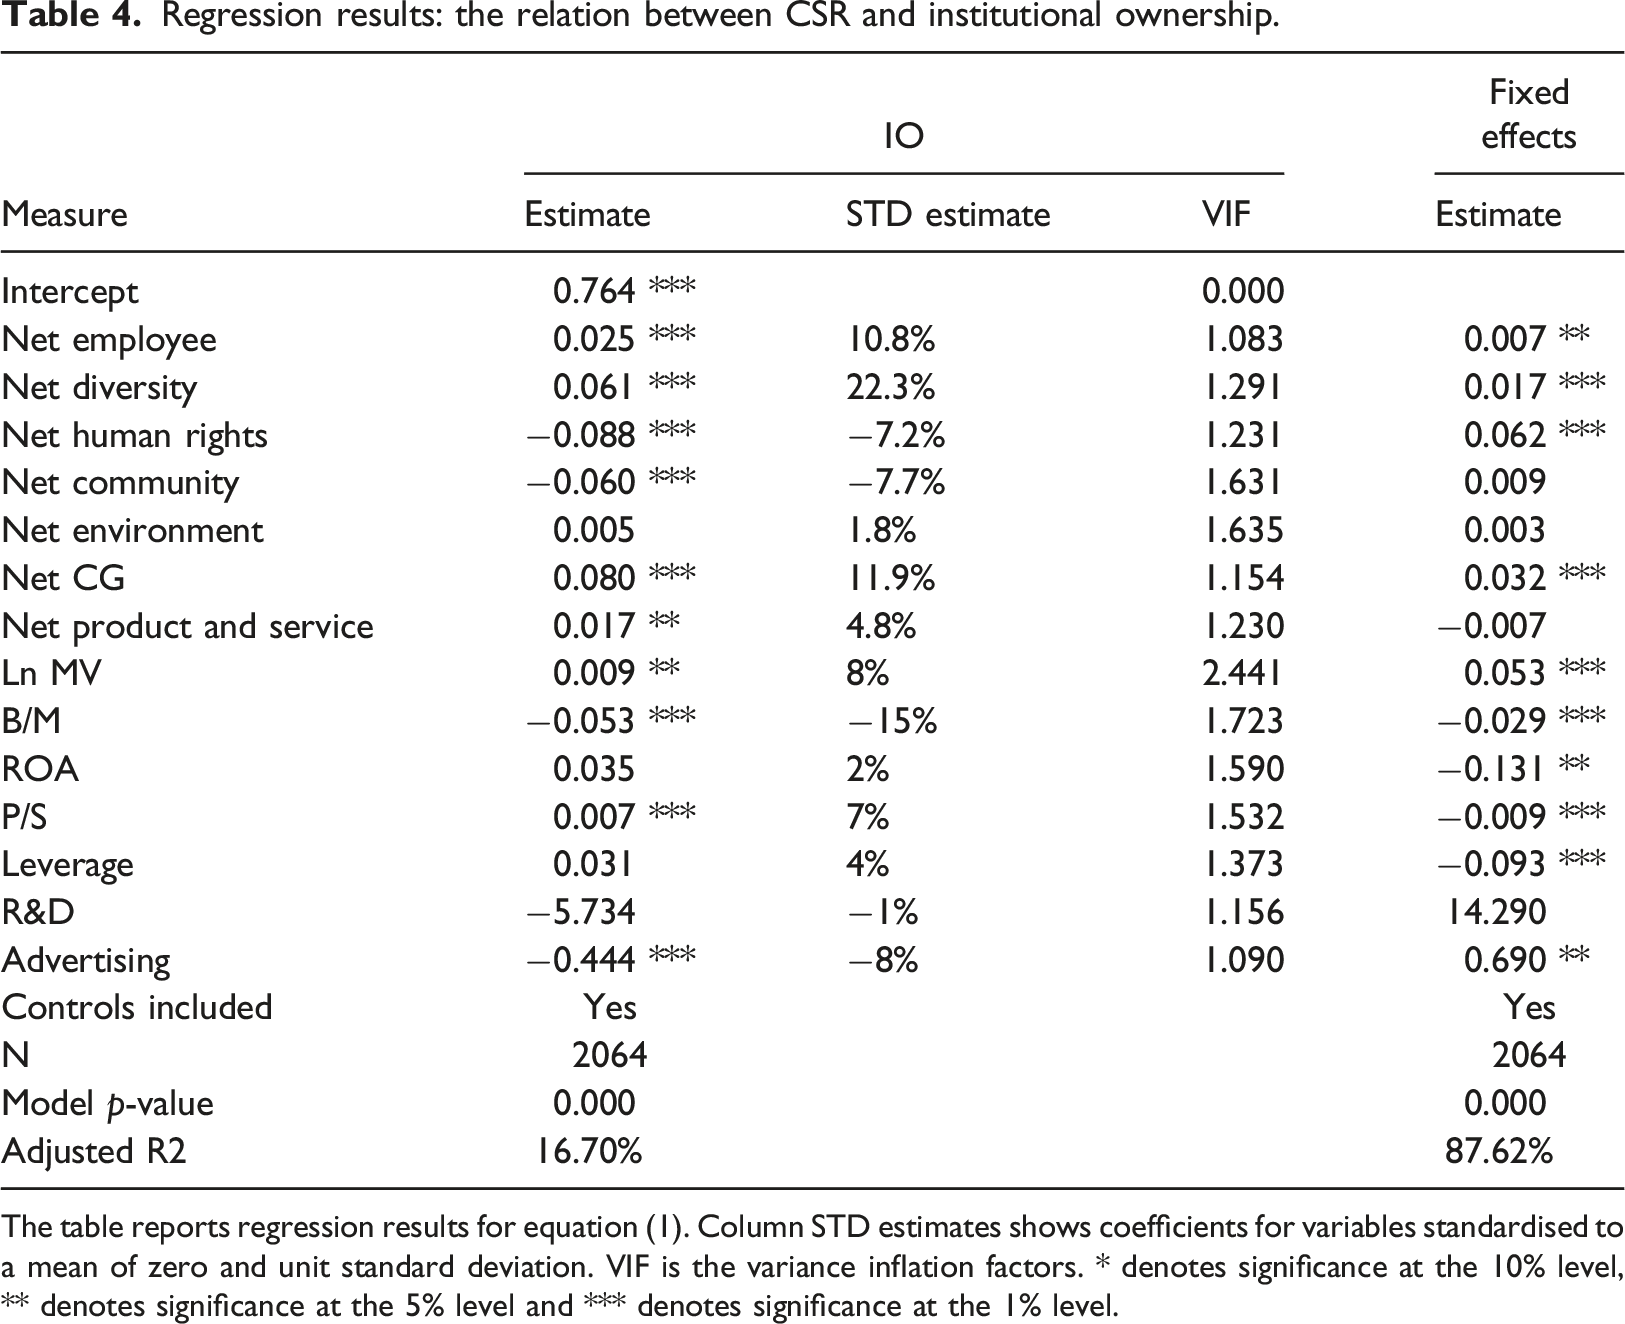
The table reports regression results for equation (1). Column STD estimates shows coefficients for variables standardised to a mean of zero and unit standard deviation. VIF is the variance inflation factors. * denotes significance at the 10% level, ** denotes significance at the 5% level and *** denotes significance at the 1% level.
We first focus on the OLS regression results in Table 4. None of the values for the variance inflation factors in column ‘VIF’ is higher than 10, a rule of thumb for potential multicollinearity. This result suggests that all CSR dimensions capture slightly different aspects of CSR, a conclusion similar to the Table 3 evidence of the correlations between the CSR dimensions. We find that companies with higher Net Employee and Net Diversity scores tend to have higher institutional ownership. Further, the Net Corporate Governance and Net Product and Service dimensions also have a positive effect on institutional holdings. Jointly, the results suggest that (1) how firms build relations with their employees and respect the diversity of their workforce; (2) the quality of internal corporate governance mechanisms which ensure that managers act in the interest of shareholders; and (3) the quality of firms’ products are the dimensions that institutional investors care about. The Net Human and Net Community dimensions have a negative effect on institutional ownership. It is plausible that investors perceive that local and federal governments are responsible for supporting the local community, rather than private enterprises through corporate donations. Further, direct corporate involvement in social issues can expose a company to potential customer and legal backlash. For example, the Starbucks CEO’s challenge of policies promoted by former U.S. president Trump resulted in backlash from Trump supporters; #boycottStarbucks became a top trending hashtag on Twitter. 14
To gauge the relative economic magnitude of the effects of each CSR dimension, we report standardised coefficients where all variables are standardised to a mean of zero and a unit standard deviation. These coefficients show how institutional ownership would change for the same magnitude of change in each independent variable. 15 The ‘STD estimate’ column shows that Net Diversity has the largest economic effect on institutional ownership: A one standard deviation increase in Net Diversity would increase institutional ownership by 22.3% standard deviations, four times greater than the effect of Net Product and Service. The model’s adjusted R2 suggests that the variables jointly explain 16.7% of the quarterly variation in institutional ownership. In untabulated results, we find that estimating equation (1) without the CSR measures produces an adjusted R2 of 10.9%, which suggests that the CSR measures can improve the model’s explanatory power by 53%.
The last columns of Table 4 report the results for regressions with firm-fixed effects. We find that the Net Employee, Net Diversity and Net Corporate Governance variables are positively associated with institutional holdings. Interestingly, controlling for firm-fixed effects shows that Net Human Rights has a positive effect on institutional holdings. The adjusted R2 in the model increases to 87.62%, which suggests that a substantial proportion of the variation in institutional holdings is firm-specific.
Based on the results in Table 4, we conclude that a firm’s performance for the social dimension of CSR together with its corporate governance performance are positively associated with institutional holdings in the firm, a result consistent with Hypothesis 1.
Further tests
Dedicated ownership, domestic institutional investors and blockholdings.
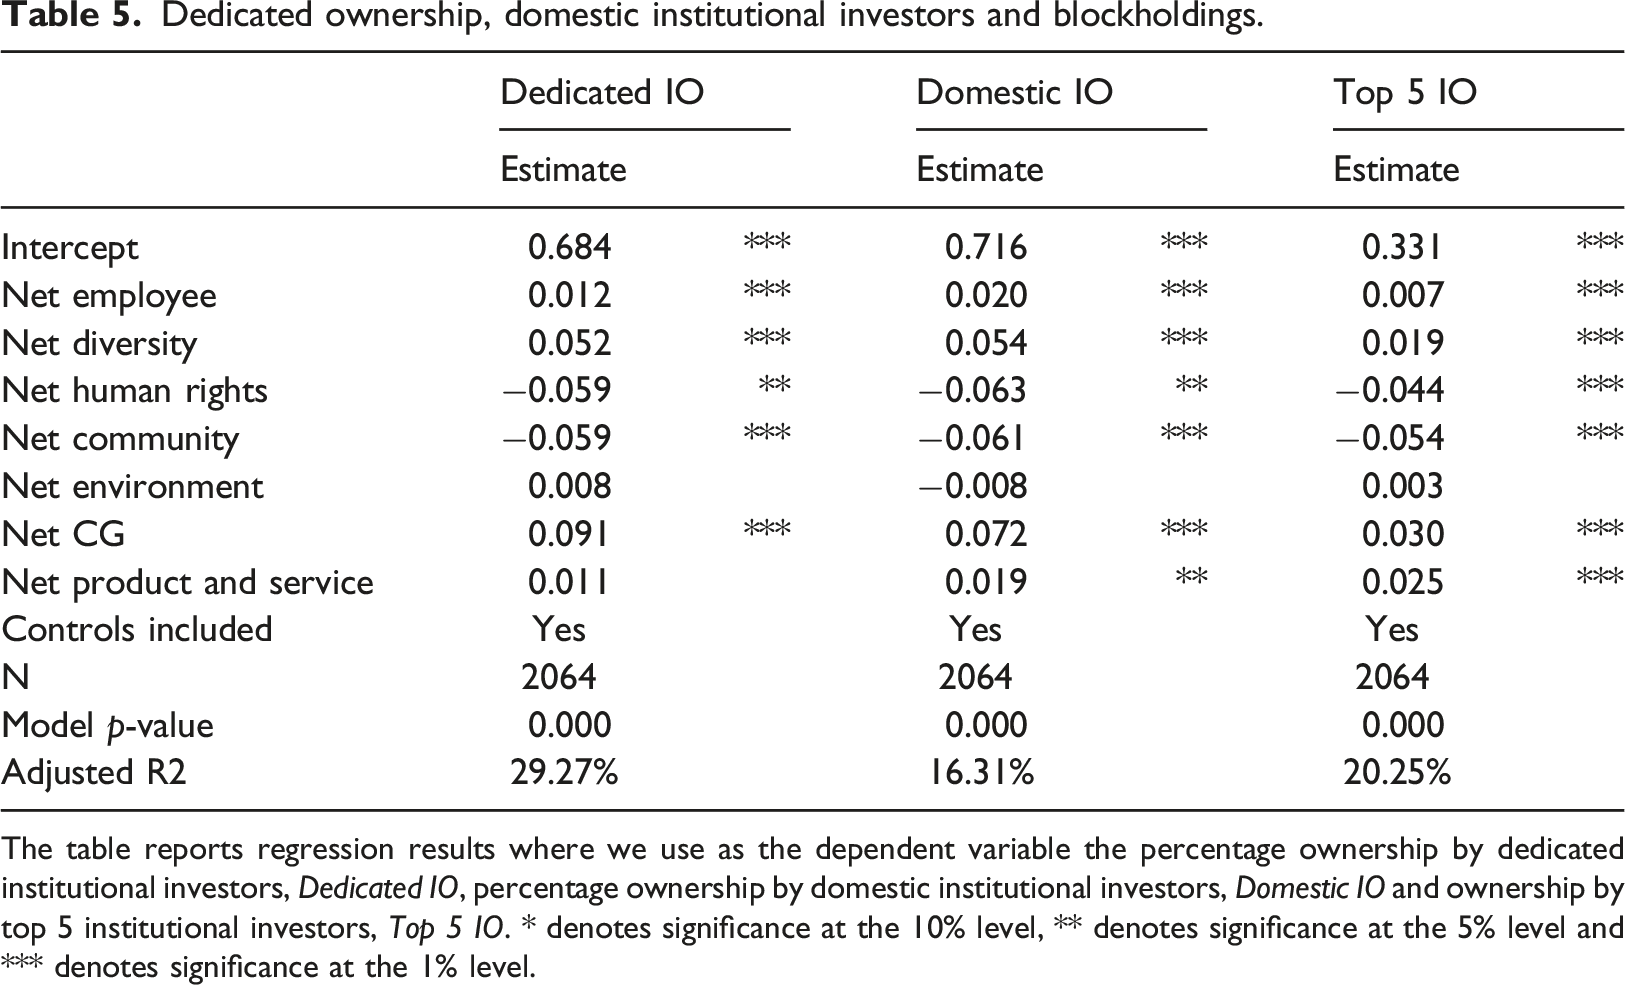
The table reports regression results where we use as the dependent variable the percentage ownership by dedicated institutional investors, Dedicated IO, percentage ownership by domestic institutional investors, Domestic IO and ownership by top 5 institutional investors, Top 5 IO. * denotes significance at the 10% level, ** denotes significance at the 5% level and *** denotes significance at the 1% level.
Robustness tests
Sensitivity tests for the relation between CSR and institutional ownership.
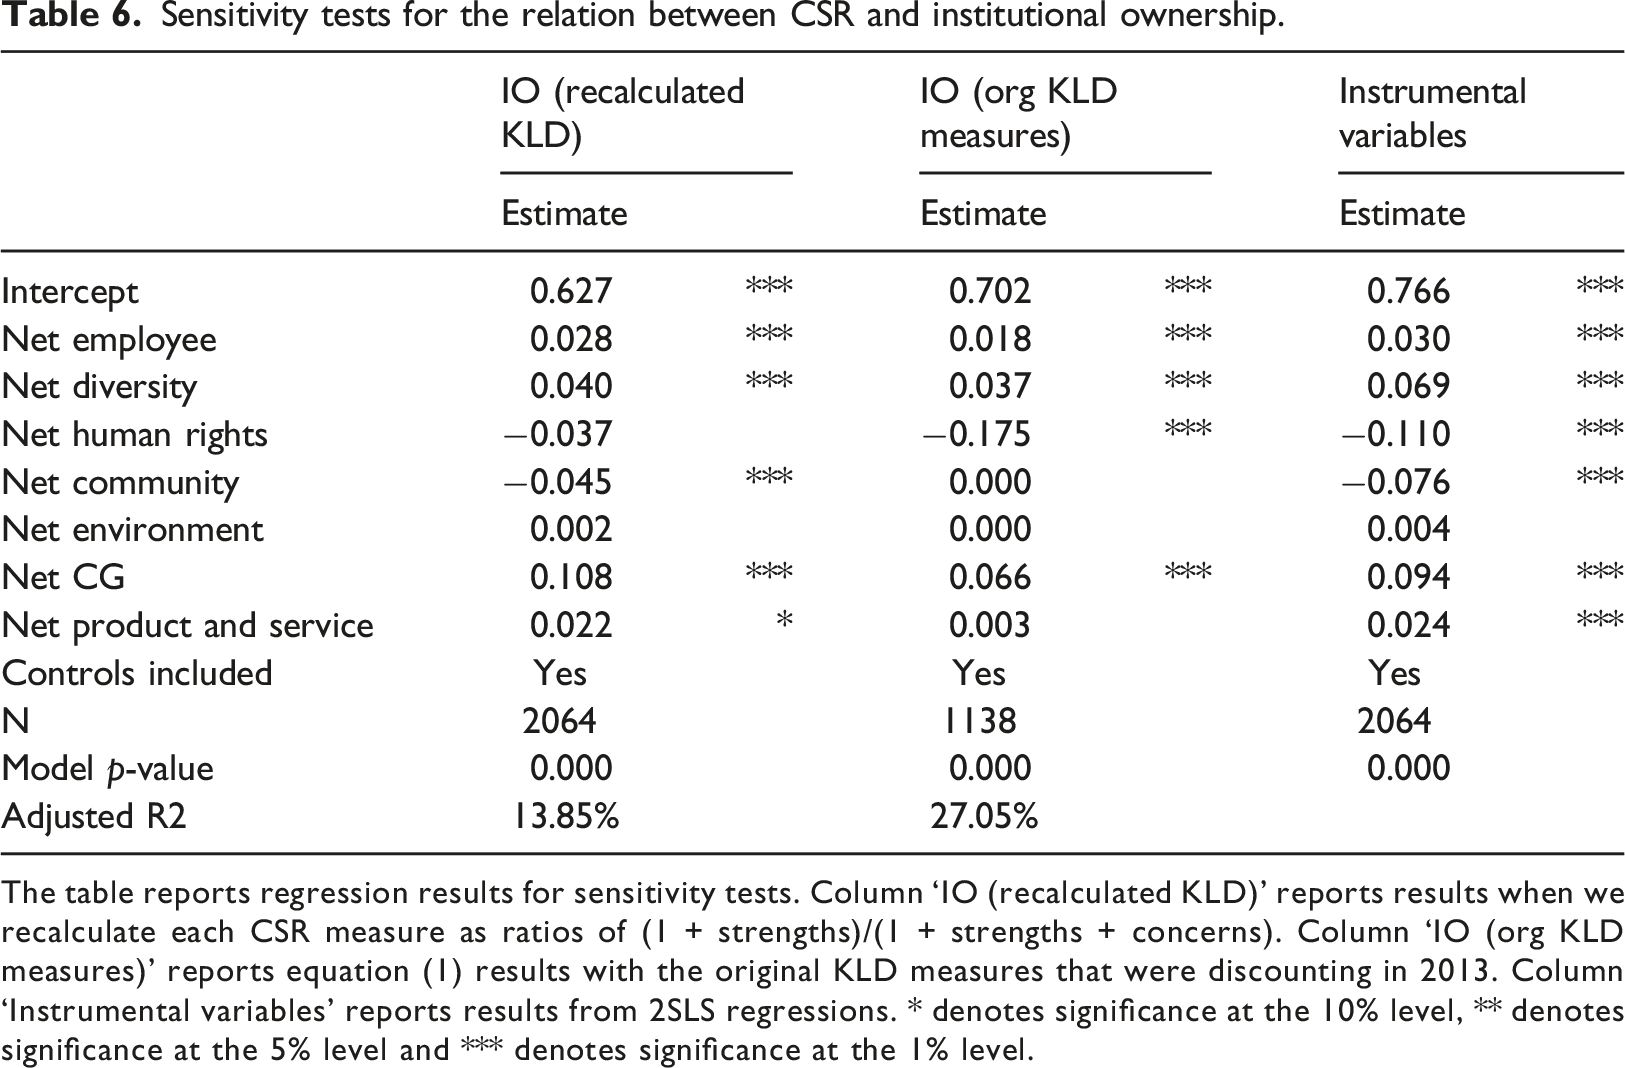
The table reports regression results for sensitivity tests. Column ‘IO (recalculated KLD)’ reports results when we recalculate each CSR measure as ratios of (1 + strengths)/(1 + strengths + concerns). Column ‘IO (org KLD measures)’ reports equation (1) results with the original KLD measures that were discounting in 2013. Column ‘Instrumental variables’ reports results from 2SLS regressions. * denotes significance at the 10% level, ** denotes significance at the 5% level and *** denotes significance at the 1% level.
Because previous studies frequently use total strengths and total concerns as reported by KLD to capture CSR dimensions (e.g. Inoue and Lee, 2011), in the ‘IO (org KLD measures)’ column, we report equation (1) results with these original measures that were discontinued in 2013. Using the original measures produces results similar to our main conclusions. Thus, our conclusions are not driven by the way that we define the CSR measures.
Endogeneity and reverse causality
We recognise that firms decide whether to implement CSR measures; thus, our conclusions may reflect these endogenous decisions. We believe that our tests that use lead-lag relations in equation (1) jointly with firm-fixed effects significantly reduce the likelihood of endogeneity affecting our conclusions. This is also reflected in the Hausman test, which suggests no evidence of endogeneity. However, for extra robustness, we also use instrumental variables analysis to ensure that our conclusions are robust. As the instrument, we use the average CSR performance of a company’s industry, captured by the NAICS code, excluding the focal firm. Industry CSR activities should not affect institutional ownership in a focal firm; however, we would expect industry CSR activities to correlate with a firm’s CSR decisions. Thus, the instrument meets both the exclusion and relevance criteria. The ‘instrumental variables’ column in Table 6 reports regression results for the 2SLS model and the conclusions are similar to our main results.
To address the reverse causality issue, Appendix E reports the results from regressing each CSR dimension on (1) past institutional ownership and (2) the six CSR dimensions measured in the previous year. We control for past CSR scores because of significant persistence in the measures. This means that the regressions are effectively capturing the incremental effect of past institutional ownership on past CSR performance. We do not find that past institutional ownership affects a firm’s current CSR score, controlling for the firm’s past CSR performance. These results reduce the likelihood of reverse causality, although we acknowledge that we cannot rule out this alternative explanation.
Our research design measures institutional ownership one quarter after we observe firm CSR scores to reduce the likelihood of the results being driven by reverse causality. To further reduce the likelihood that institutional ownership drives changes in CSR, we run a Granger-type lead-lag test where we include lagged institutional holdings among the explanatory variables. Our conclusions from this test are identical to our main findings (result untabulated).
Finally, we conduct a Google search for any indications of shareholder activism focused on the sample firms’ CSR activities. We do not find news or other sources suggesting proposals or pressure from shareholders to change firms’ CSR activities. We acknowledge that such pressures may be applied through private channels; however, we believe that investments funds would make such attempts public to showcase their proactive approach to firms’ CSR activities. The fact that we find no evidence of such actions suggests that those private channels are unlikely to drive our results.
Discussion and conclusions
Ensuring that businesses have sufficient capital to support their existing operations, including enough to make ongoing investments in infrastructure, expand their operations and develop staff and new services for customers, is essential for the sound development of the H&T industry. The World Travel and Tourism Council estimates that the capital spending of the global travel and tourism industry amounted to $948 billion in 2019, supporting 330 million jobs (1 in 10 jobs around world). This study examines the relation between H&T firms’ CSR activities and institutional ownership, an important source of equity capital for these firms. We document that businesses with better social and governance performance have higher institutional ownership, particularly by dedicated institutional investors, domestic investors and blockholders, which are more focused on long-term value creation. To ensure the robustness of our conclusions, we subject the results to several sensitivity tests that include alternative estimation methods, controlling for unobservable firm characteristics and endogeneity. Our use of recent data ending in 2018 also helps build confidence that the results are timely and of relevance to H&T businesses.
Interestingly, we find that community and environmental concerns do not increase institutional holdings. These results may capture appealing investment returns offered by some companies with poor track records of community and environment performance. Fabozzi et al., (2008, p. 82) document that ‘sin stocks’ – companies associated with activities that are perceived negatively in light of social norms (e.g. alcohol, tobacco, gambling and weapons manufacturers) – ‘produced an annual return of 19% over the study period, unambiguously outperforming common benchmarks in terms of both magnitude and frequency’. Gray (2015) states that environmental regulations impose costs on manufacturing plants, resulting in lower productivity. Pham et al., (2020, p. 3280) highlight the possibility that the ‘adoption of costly environmental policies and practices by a firm may be perceived [by investors] to be an unnecessary burden that will have a negative effect on the firm’s financial indicators. According to this view, environmental regulation exerts a negative effect on the bottom line of the regulated firms, and hence, the return on assets or shareholders’ equity, at least because regulation triggers extensive compliance costs’. Veith et al. (2009) find that European electricity manufacturers pass on costs arising from the increasing prices of emission allowances to consumers. Ramiah, Martin and Moosa (2013) report that the returns of heavy Australian polluters were unaffected by environmental regulation as these firms passed on the costs to consumers, while the returns of low polluters, such as beverage firms, were affected by rising costs. Although our results suggest that firms’ community and environment-related actions do not have a positive effect on institutional ownership, we recommend that managers take a holistic view and consider how poor performance in these dimensions reduces a firm’s legitimacy in the eyes of customers, employees and regulators.
This paper has several theoretical and practical implications. First, we contribute to the growing CSR literature on the service industry (Vassilikopoulou et al., 2005; Lee and Park, 2009; Kang et al., 2010; Lee et al., 2013; Feng et al., 2014; Fu et al., 2014; Theodoulidis et al., 2017; Ringham and Miles, 2018; Gürlek and Tuna, 2019) by identifying a positive relation between H&T firms’ CSR activities and ownership by institutional investors, particularly by investors more interested in promoting companies’ long-term growth. The study enhances our understanding of how CSR affects an important group of external stakeholders – institutional investors – which complements previous research that examined the relation between CSR and another external stakeholder group: customers (Boccia, et al. 2019).
Second, our findings provide empirical support for the multidimensional conceptualisation of CSR, where various dimensions play different roles for diverse audiences (Carroll, 1999). Our study identifies which dimensions influence institutional ownership and quantifies their respective importance. Further, our focus on the H&T industry responds to the call in Rhou and Singal’s (2020) research. These authors argue that hospitality research needs to explore the importance of CSR at the industry level to better understand the industry-specific relevance of CSR.
Third, the study results are of direct relevance to H&T industry business owners seeking institutional capital; the results can guide their decisions on which CSR dimensions to promote. Critics of CSR highlight the substantial costs of implementing and managing CSR. A report from the Institute of Economic Affairs highlights that ‘far from being harmless, its [CSR] adoption threatens prosperity in poor countries as well as rich. It is likely to reduce competition and economic freedom and to undermine the market economy’ (Henderson, 2001). We show that external equity capital providers consider CSR in their investment decisions. Better performance in the social and governance dimensions makes H&T companies more attractive to long-term institutional investors. The fact that not all CSR dimensions are relevant to institutional investors indicates that owners and managers of H&T businesses should carefully decide which policies to adopt.
Fourth, we add to the broader literature on the links between CSR and institutional ownership. Previous research documents mixed evidence on the association between CSR performance and institutional holdings (Teoh and Shiu, 1990; Coffey and Fryxell, 1990; Graves and Waddock, 1994; Fernando et al., 2010; Chava, 2014; Gillan et al., 2012; Dhaliwal et al., 2011).
Finally, our evidence is also important for policymakers as large H&T businesses are frequently key employers in economically deprived areas. Therefore, their ability to access financing to maintain and grow their existing operations is important in policy setting. 16 For example, David Henderson, the former Head of Economics and Statistics at the Organisation for Economic Co-operation and Development, claims that the ‘CSR movement will increase business costs, reduce welfare and undermine the market economy’ and that ‘[t]he greatest potential for harm arises from government attempts to regulate the world as a whole in the name of CSR’. 17 Our results suggest that despite regulators’ concerns that CSR may increase business costs, there are important externalities to policies promoting CSR, such as the ability to attract institutional funding. Capital flows into H&T firms in the private sector can reduce the need for government loans and funding, which can then be deployed in other areas, such as to reduce poverty, a concern for developing countries. Regulators could promote CSR activities focused on improving employee relations, diversity among workforce and the quality of corporate governance. This could include policies that promote stronger trade unions, employee health and safety and professional employee development. Governments could also promote campaigns raising awareness of the benefits of CSR activities, including by establishing recognition awards that increase the visibility of the best performing firms. Finally, governments could provide funds to support the development of CSR programmes.
We identify three main limitations of this study. First, our research focuses on the H&T industry, which limits the generalisability of the conclusions beyond that sector. Second, we cannot rule out that our evidence is sample-period specific, which limits the generalisability of the study’s results to a more recent period. Finally, previous research documents a positive association between institutional holdings and firms’ CSR performance (e.g. Smith, 1996; Duggal and Millar, 1999; Woidtke, 2002). Although we do our best to address reverse causality, it is possible that (1) our results capture this alternative explanation or (2) there is a simultaneous relation between CSR and institutional holdings (i.e. institutional investors buy shares in companies with higher CSR performance, which in turn prompts these firms to improve their CSR scores).
Future research could examine the relation between CSR dimensions and institutional holdings at the industry level. The relative effects on the environment, communities, employees and other stakeholders differ between H&T industries (e.g. an airline has a greater environmental impact than a museum). Further, institutional investors may attach different CSR priorities to various industries (e.g. they may consider environmental impact to be more important for a transportation company and community impact as more relevant for a casino). Focussing on individual industries could uncover potential heterogeneity that is lost at the aggregate level. Future research could also examine whether our conclusions apply to other periods, including periods of market turbulence such as during the COVID-19 pandemic. We also recommend that future studies examine the channels through which CSR could attract institutional investors. For example, the structure of the corporate team responsible for implementing a CSR strategy can facilitate efficient communication with institutional investors, increasing the likelihood of these investors investing in the company.
Footnotes
Declaration of conflicting interests
The author(s) declared no potential conflicts of interest with respect to the research, authorship, and/or publication of this article.
Funding
The author(s) received no financial support for the research, authorship, and/or publication of this article.
Notes
NAICS codes for each of the four H&T sectors
The table shows NAICS code for companies classified broadly into four groups: Travel, hotels and recreation, casinos and restaurants.
NAICS code
Description
1. Travel
481,111
Scheduled passenger air transportation
481,211
Nonscheduled chartered passenger air transportation
481,212
Nonscheduled chartered freight air transportation
481,219
Other nonscheduled air transportation
483,112
Deep sea passenger transportation
483,114
Coastal and Great Lakes passenger transportation
483,212
Inland water passenger transportation
485,999
All other transit and ground passenger transportation
487,110
Scenic and sightseeing transportation, land
487,210
Scenic and sightseeing transportation, water
487,990
Scenic and sightseeing transportation, other
488,119
Other airport operations
488,999
All other support activities for transportation
561,510
Travel agencies
561,520
Tour operators
561,599
All other travel arrangement and reservation services
2. Hotels and recreation
561591
Convention and visitors bureaus
561990
All other support services
711190
Other performing arts companies
711212
Racetracks
711219
Other spectator sports (racing stables and horse)
711310
Promoters of performing arts, sports and similar events with facilities
711320
Promoters of performing arts, sports and similar events without facilities
712110
Museum
712130
Zoos and botanical gardens
713110
Amusement and theme parks
713120
Amusement arcades
713910
Golf courses and country clubs
713920
Skiing facilities
713930
Marinas
713940
Fitness and recreational sports centres
713950
Bowling centres
713990
All other amusement and recreation industries
721110
Hotels (except casino hotels) and motels
721120
Casino hotels
721191
Bed-and-breakfast inns
721199
All other traveller accommodation
721211
RV (recreational vehicle) parks and campgrounds
721214
Recreational and vacation camps (except campgrounds)
3. Casinos
713210
Casinos (except casino hotels)
713290
Other gambling industries
4. Restaurant
722,310
Food service contractors
722,320
Caterers
722,330
Mobile food services
722,511
Full-service restaurants
722,513
Limited-service restaurants
722,514
Cafeterias, grill buffets and buffets
722,515
Snack and nonalcoholic beverage bars
Definitions of CSR measures
The table reports how we calculate the six CSR measures Net Employee, Net Diversity, Net Human Rights, Net Community, Net Environment, Net CG and Net Product and service.
Strength
Concern
Panel A.
Union relations
Union relations
Cash profit sharing
Employee health and safety
Employee involvement
Supply chain
Employee health and safety
Child labour
Supply chain labour standards
Labour-management relations
Compensation and benefits
Employee relations
Professional development
Human capital management
Labour management (EMP-STR-M)
Panel B.
Board of directors – Gender
Workforce diversity
Women and minority contracting
Board of directors – Gender
Employment of underrepresented groups
Board of directors – minorities
Other strengths
Panel C.
Humanity
Indigenous peoples relations strength
Support for controversial regimes
Human rights policies and initiatives
Freedom of expression and censorship
Human rights violations
Other concerns
Panel D.
Innovative giving
Community impact
Community engagement
Panel E.
Environmental opportunities
Regulatory compliance
Waste management
Toxic spills and releases
Packaging materials and waste
Climate change
Climate change
Impact of products and services
Environmental management systems
Biodiversity and land use
Water stress
Operational waste
Biodiversity and land use
Supply chain management
Raw material sourcing
Water management
Other strengths
Other concerns
Panel F.
Corruption and political instability
Governance structures
Financial system instability
Controversial investments
Business ethics
Panel G.
Quality
Product quality and safety
Social opportunities
Marketing and advertising
Access to finance
Anticompetitive practices
Customer relations
Other concerns
Definitions of the dependent and control variables used in the study
The table reports definitions of the dependent and control variables used in the study.
Abbreviation
Definition
Panel A. The dependent variables
Institutional ownership
Percentage institutional ownership measured as the sum of the holdings of all institutions in a firm’s stock divided by the stock’s total market capitalisation at the end of each calendar quarter
Dedicated IO
Dedicates institutional ownership (IO) defined as percentage holdings by dedicate investors measured as the sum of percentage holdings by dedicated institutions, which provide stable ownership and take large positions in individual firms, and holdings by quasi-indexers, which trade infrequently. The measure is calculated at the end of each fiscal quarter
Domestic IO
Domestic institutional ownership (IO) defined as percentage holdings by domestic institutional investors measured as the sum of the holdings of all institutions domiciled in the United States divided by the firm’s market capitalisation. The measure is calculated at the end of each fiscal quarter
Top 5 IO
Percentage holdings by top five blockholders. Blockholders are defined as investors who hold at least 5% of company’s stock. The measure is calculated at the end of each fiscal quarter
Panel B. The control variables
MV
Stock’s market capitalisation measured at the end of the fiscal quarter prior to the quarter where we measure institution holdings
B/M
The book-to-market ratio measured as the ratio of book value of equity scaled by the firm’s market capitalisation
ROA
Return on assets, measured as net income scaled by total assets
P/S
Price-to-sales ratio measured as the market capitalisation to total revenue
R&D
Research and development expense scaled by total sales
Advertising
Advertising expenses scaled by total sales
Leverage
Financial leverage measured as the ratio of total debt scaled by total assets
Average institutional ownership by H&T sector
The table reports institutional ownership for each H&T industry.
Restaurant
Casino
Hotels and recreation
Travel
Institutional ownership
0.843
0.634
0.745
0.877
Dedicated IO
0.724
0.637
0.700
0.724
Domestic IO
0.784
0.609
0.684
0.821
Top 5 IO
0.340
0.264
0.312
0.342
Appendix E
The table reports results from regressing the CSR dimensions on institutional ownership and CSR dimensions measured in the previous year. * denotes significance at the 10% level, ** denotes significance at the 5% level and *** denotes significance at the 1% level.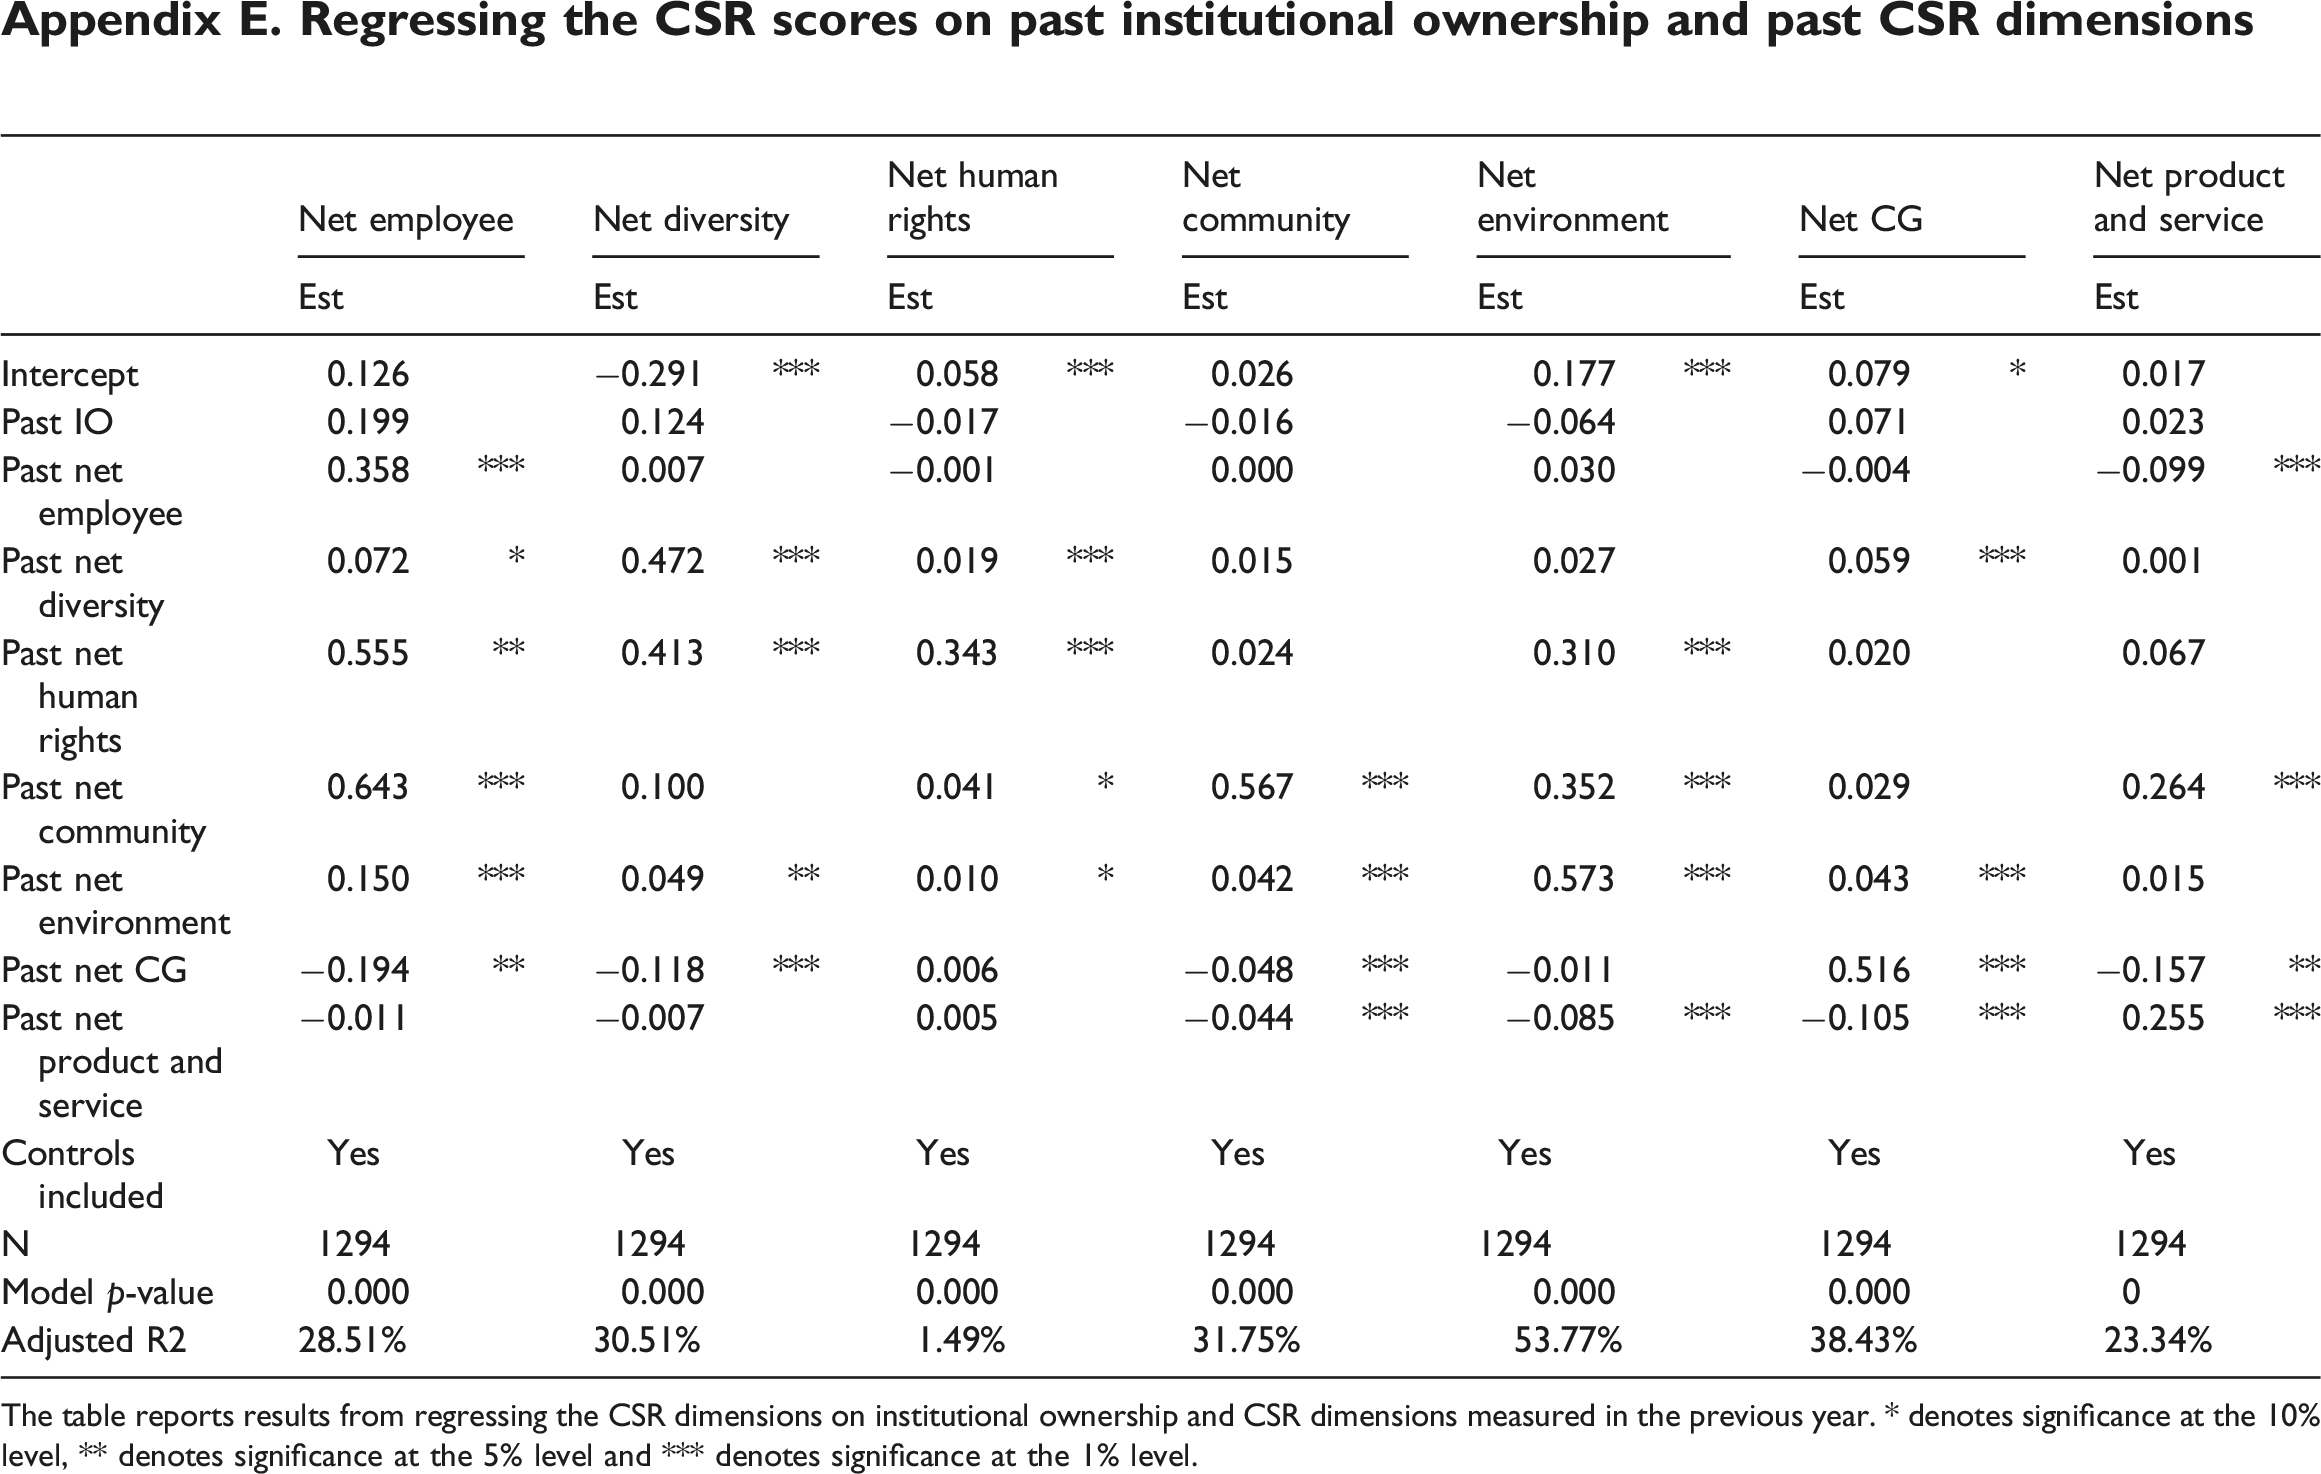
Net employee
Net diversity
Net human rights
Net community
Net environment
Net CG
Net product and service
Est
Est
Est
Est
Est
Est
Est
Intercept
0.126
−0.291
***
0.058
***
0.026
0.177
***
0.079
*
0.017
Past IO
0.199
0.124
−0.017
−0.016
−0.064
0.071
0.023
Past net employee
0.358
***
0.007
−0.001
0.000
0.030
−0.004
−0.099
***
Past net diversity
0.072
*
0.472
***
0.019
***
0.015
0.027
0.059
***
0.001
Past net human rights
0.555
**
0.413
***
0.343
***
0.024
0.310
***
0.020
0.067
Past net community
0.643
***
0.100
0.041
*
0.567
***
0.352
***
0.029
0.264
***
Past net environment
0.150
***
0.049
**
0.010
*
0.042
***
0.573
***
0.043
***
0.015
Past net CG
−0.194
**
−0.118
***
0.006
−0.048
***
−0.011
0.516
***
−0.157
**
Past net product and service
−0.011
−0.007
0.005
−0.044
***
−0.085
***
−0.105
***
0.255
***
Controls included
Yes
Yes
Yes
Yes
Yes
Yes
Yes
N
1294
1294
1294
1294
1294
1294
1294
Model p-value
0.000
0.000
0.000
0.000
0.000
0.000
0
Adjusted R2
28.51%
30.51%
1.49%
31.75%
53.77%
38.43%
23.34%