
Abstract
This study investigates the short-run impact of the COVID-19 pandemic on the number of domestic overnight stays at the regional level in the summer season 2020. Official data for 65 regions in four countries are used for the analysis (Austria, the Czech Republic, Germany and Switzerland). Dynamic panel data models are employed to estimate a tourism demand equation (real GDP and price fluctuations) augmented by average temperatures. Estimation results reveal that domestic overnight stays evolve unevenly in the first summer after the outbreak of the COVID-19 pandemic. The short-run effects show that the number of domestic overnight stays in densely populated regions decreases by 27% in July as well as in August 2020, in comparison with the same months in previous years, ceteris paribus. To the contrary, there is a surge of 27 and 10%, respectively, for sparsely populated areas in the same months.
JEL: Z3, R11 and R12.
Keywords
Introduction
The outbreak of the COVID-19 pandemic has spurred the interest in modelling the relationship between infectious diseases and tourism demand. While international demand experiences a worldwide collapse, domestic tourism has to some extent been possible during certain phases of the pandemic. Several studies investigate the association between international tourism flows and dangerous infectious diseases (Cevik, 2021; Choe et al., 2021; Karabulut et al., 2020; McAleer et al., 2010; Rosselló et al., 2017). However, studies exploring the links between the incidence of infections and domestic tourism at the regional level are relatively rare.
There are indications that the pandemic renews the interest in domestic tourism, something that may help to offset losses from the absence of international visitors (Arbulú et al., 2021). A possible substitution effect between international and domestic tourism flows is not a new phenomenon. Huybers (2003) mentions that changes in geopolitical stability and the spread of dangerous diseases such as the earlier outbreaks of the severe acute respiratory syndrome (SARS) may well lead to an increase in domestic tourism. This suggests that the game plan for domestic destinations is changed, at least temporarily, although it is not clear which regions potentially benefit the most from this, the sparsely or the more densely populated ones.
The aim of this study is to investigate empirically the short-run impact of the COVID-19 pandemic on domestic tourism flows during the summer of 2020, when general tourism demand determinants are controlled for (Song et al., 2008). Dynamic panel data models are used to estimate the determinants of domestic overnight stays based on official regional data for 65 regions in four countries (Austria, the Czech Republic, Germany and Switzerland). This group of countries is chosen because they are all located in inland Middle Europe and normally have a high number of residents that travel to sun and beach destinations around the Mediterranean Sea during their summer holidays. 1 Focus is put on the two months July and August 2020, since these coincide with summer holidays from school for the group of countries included in the analysis (European Commission, 2019). During these summer months, the spread of the virus is relatively low, allowing individuals to move more freely at least domestically (www.coronavirus.jhu.edu).
The rapid second wave of the pandemic appears at different times in the four countries, late August in the Czech Republic to late September in Germany (www.coronavirus.jhu.edu), as did the measures taken. This means that regional overnight stay data for September is less comparable than those for July and August, even if the countries are not yet in the lockdowns introduced later in Autumn 2020. 2 Cities that normally attract many international and event visitors are particularly negatively affected by the pandemic due to social distancing rules and lack of events (Anguera-Torrell et al., 2021). Instead, some sparsely populated areas seem to be gaining in attractiveness (Li et al., 2021; Seraphin and Dosquet, 2020; Vaishar and Šťastná, 2022).
Based on internationally comparable data, this study contributes a first quantitative analysis of the impacts of the COVID-19 pandemic on domestic overnight stays, when standard determinants of tourism demand are controlled for. The empirical model is developed in a way that also takes the divergent progress of regional tourism flows as well as possible cross-regional dependencies into account. Methodologically, the study verifies the robustness of results by the use of different panel data models and estimation methods.
The structure of the study is as follows: Conceptual background outlines the conceptual background and Empirical approach introduces the empirical model. Descriptive statistics and the data used for the study are provided in Data and descriptive statistics. The empirical results are presented in Empirical results and Conclusions concludes.
Conceptual background
A spread of diseases with epidemic or pandemic potential can have a strong negative impact on tourism flows. Such outbreaks are often accompanied by international travel restrictions that lead to cancellations and re-bookings to other destinations. Examples of studies examining the impact of diseases on international tourism flows include the avian flu, cholera, Ebola, malaria, SARS, Middle East respiratory syndrome (MERS) and COVID-19 (see for instance Choe et al., 2021 for MERS, Karabulut et al., 2020 using the composite pandemic index and Rosselló et al., 2017 as well as Cevik, 2021 for several infectious diseases).
There are different ways to estimate the role of infectious diseases on tourism demand. One approach is to relate the number of infected cases to tourism flows and another is to use dummy variables for the destination countries affected. Kuo et al. (2009) use the number of outbreaks of avian influenza in poultry, while both Kuo et al. (2008) and McAleer et al. (2010) explore the number of SARS infections. The actual number of confirmed infectious disease cases (Ebola, malaria, SARS and yellow fever) is also employed by Cevik (2021). Examples of studies using dummy variables for affected countries include Wang (2009) and Rosselló et al. (2017). An alternative approach to capture uncertainty related to different infectious diseases is the use of various kinds of indexes, such as the World Economic Uncertainty Index (Ahir et al., 2020; Karabulut et al., 2020) or the COVID-19 Government Response Tracker3. Cevik (2021) finds that the number of SARS and Ebola cases in both destination and source countries leads to a decrease in international tourist arrivals, while other infectious diseases (yellow fever and malaria) are unrelated. By use of dummy variables for four infectious diseases (malaria, yellow fever, dengue and Ebola) Rosselló et al. (2017) demonstrate that all diseases are significantly negatively related to international tourist arrivals.
A common feature of available studies is that they mainly employ cross-country data on international tourism, thus neglecting the important aspect of domestic tourism demand. Country-level data risks masking divergences in the development of domestic tourism flows. Before 2020, urban areas experience a huge increase in tourists and visitors, both domestic and foreign ones (source: Czech Statistical Office, Destatis, Germany, Federal Statistical Office, Switzerland and Statistics Austria). There are many reasons for this. Romão et al. (2018), for instance, find that the urban tourism demand is driven by presence of cultural facilities and good transportation links. Another aspect of the attractiveness of cities for tourists and travellers is shopping opportunities. The densely populated regions in the dataset include a group of cities (Vienna, Berlin, Hamburg and Prague) that are among the 20 most attractive shopping destinations in Europe (Economist Intelligence Unit European Globe Shopper City Index EIU, 2011).
Various factors may lie behind an uneven development of domestic tourism demand during the COVID-19 pandemic. Population density and close contact among individuals are aspects believed to drive the spread of the COVID-19 virus (Rader et al., 2020; Sharifi and Khavarian-Garmsir, 2020). There are suggestions that the contact rate is proportional to population density (Rocklöv and Sjödin, 2020). This means that avoiding situations and areas with large amounts of people is a necessary condition for limiting the spread of a virus like the COVID-19. Lai et al. (2020) mention that cities with high population density are synonymous with low per capita living space, heavily used local transportation and more general overcrowding. Sharifi and Khavarian-Garmsir (2020) conclude that the high concentration of people and activities in cities makes the former vulnerable to various stressors such as natural and man-made disasters. Consequently, densely populated and well-connected areas could become hotspots for a rapid spread of viruses because of the high level of personal interactions (Sharifi and Khavarian-Garmsir, 2020) which prevent social distancing.
Numerous studies confirm that population density or population in urban agglomeration is positively correlated with the number of COVID-19 cases, or its growth rate based on regional data (see Cartenì et al., 2020; Coccia, 2020 for Italian regions, 2020; Copiello and Grillenzoni, 2020; Lin et al., 2020, Rader et al., 2020 all for Chinese regions). An explanation is that maintaining a safe distance between individuals can be challenging in areas with a high population density. However, the reported evidence of the relationship between population density and COVID-19 is contradictory and inconclusive. Other studies find that the spread of virus or its mortality is independent of population density (see Sun et al., 2020 for regional data for China, Boterman, 2020 based on regional data for the Netherlands and Perone, 2020 for Italian regions). Another set of analyses examines the association between population density and death rates in the context of COVID-19. Hamidi et al. (2020), for instance, explore both the direct and indirect effects on death rates in 913 United States metropolitan areas and find that dense population is significantly associated with higher mortality rates.
Given recent literature, it can be argued that the higher risks of contracting the COVID-19 virus in large crowds of people, together with measures to press down the spread of the virus such as social distancing rules make densely populated destinations less attractive to visit. Another explanation behind a decrease in demand is the pandemic induced recession as well as the lack of large events, meetings, conferences, and business travellers in the densely populated urban areas (Sharifi and Khavarian-Garmsir, 2020). Business travel, face-to-face meetings and conferences are replaced by virtual meetings since the outbreak of the pandemic. Caligiuri et al. (2020) mention that during the pandemic, life changes dramatically for many international business travellers and globally mobile employees in multinational companies and no that longer includes frequent travel, hotel nights or business lunches. This leads to a decline in demand for hotel beds and other amenities in major conference cities and regions. In the data examined, densely populated regions include Berlin, Vienna and Prague, cities that are among the top ten conference locations in Europe, while Hamburg, Zürich and Geneva are found on the top 50 list (ICCA, 2019).
Sudden unexpected large-scale events such as natural disasters, civil unrests or pandemics may have an overall impact on societies and their economic activities far beyond tourism demand (Strobl, 2012). In an analysis of microdata, Eugenio-Martin and Campos-Soria (2014) show that households respond to crises by cutting back on their tourism spending, although domestic tourism is less affected by this than demand for trips abroad. This means that the presumptive effects of the pandemic on domestic tourism demand need to be distilled out from the overall economic impacts. There might be individuals who still want to travel domestically but no longer have a budget for this because the pandemic has cost them their jobs, for instance.
Another factor that influences domestic tourism demand, and thus needs to be controlled for, is climate variability or weather factors. Several studies show that weather, in the origin as well as in the destination areas or at an earlier point in time have a significant impact on tourism flows (Bausch et al., 2021; Becken and Wilson, 2013; Eugenio-Martin and Campos-Soria, 2014; Kulendran and Dwyer, 2012; Li et al., 2017; Muñoz et al., 2021; Otero-Giráldez et al., 2012; Priego et al., 2015; Serquet and Rebetez, 2011; Taylor and Ortiz, 2009). Tourism demand is dynamic to its nature, influenced by habits, intentions and as well as words-of-mouth (Dogru et al., 2021; Garín-Muñoz, 2009; Liu, 2020; Song et al., 2008). This emphasises the importance of paying attention to earlier tourism behaviour. Subsequently, based on recent events and literature, the main hypothesis of this study is that domestic tourism demand in the summer of 2020 exhibits a different pattern than in earlier years even when the possible effects of the economic context, persistence and weather conditions are considered.
Empirical approach
The starting point for the empirical specification is the theory of travel and tourism demand including real income and prices as main explanatory variables (Song et al., 2008). Several studies examine the determinants of domestic tourism demand at the regional level (Yang et al., 2014 for China; Massidda and Etzo, 2012 and Cafiso et al., 2018 for Italy; Tsui, 2017 for New Zealand; Garín-Muñoz, 2009; Gálvez, Romero and Devesa, 2014; Priego et al., 2015, Alvarez-Diaz et al., 2020 all for Spain and Taylor and Ortiz, 2009 for the United Kingdom). Common estimation methods are static or dynamic panel data models. In this case, the short-run impact of the COVID-19 pandemic on domestic tourism flows during the summer of 2020 is investigated by use of a panel data model where the time dummy variables are made region-specific and are allowed to vary across the 57 sparsely and 8 densely populated regions.
To account for the possible persistence in tourism demand, which for instance appears when tourists repeatedly return to a destination they like, the lagged dependent variable is included in the equation. This leads to the following dynamic tourism demand equation, where each summer month will be estimated separately
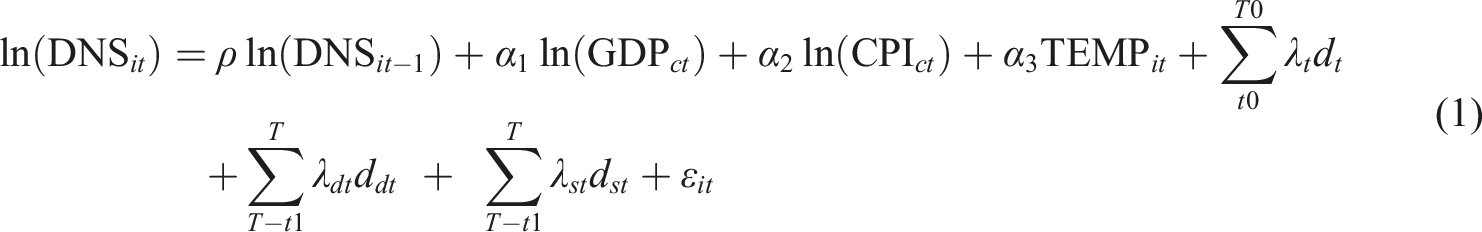
Suffixes i, c and t denote region, country and month in a given year, respectively, while ln() is the natural logarithm. DNS represents monthly domestic overnight stays in hotels and related accommodations. The dynamic feature of domestic overnight stays is captured by
Variables of particular importance for the analysis are the regional dummies d d and d s representing densely and sparsely populated areas. To capture the density effect for each year, the dummy variables are modelled as time-dependent in equation (1). This means that the coefficients λd2020 and λs2020 associated with the dummy variables reveal the impacts of the extraordinary chain of events in 2000. Similar dummy variables for other years are introduced to verify the results of the key parameters of interest. In addition to this, the year dummies d t can be introduced to overcome presumptive cross-sectional dependence (CSD), although they cannot be modelled simultaneously with regional dummy variables because of collinearity. The number of year dummy variables may be moderated to guarantee that the null hypothesis of the cross-sectional independence of the residuals is not rejected by the CSD test (Pesaran, 2021). This test is specifically designed for datasets with small or medium-sized time periods T and a large number of observations N. An alternative robustness check can be performed by using the lag of temperature in the same month of the previous year, TEMPt-1 in (1) to account for the possibility of time-delayed reactions to weather conditions.
The choice of panel data method depends on the nature of the dataset. Since there are eight years and 65 cross-sectional units available (N>T) a partial adjustment model with a Fixed Effects Quasi Maximum Likelihood estimator (QML-FE) is suitable (Hsiao et al., 2002; Kripfganz, 2016). This estimator is consistent with cross-sectional heterogeneity and robust standard errors, which means that it also controls for serial correlation. As it is common in panel data estimations, the specification is transformed into first differences
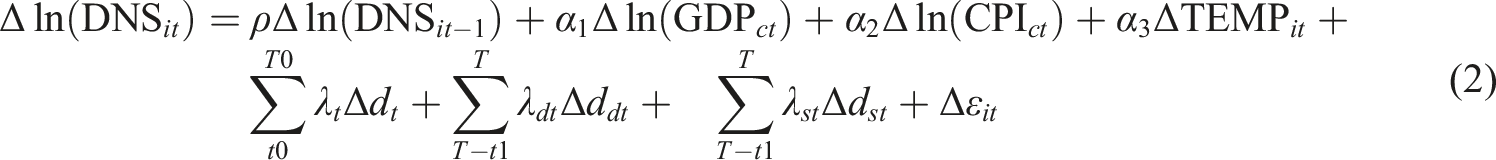
The well-known bias arising from the correlation between the lagged dependent variable and the error term (Nickell, 1981) is resolved by modelling the initial (first year) observations of the dependent variable as a function of changes in the future values of the exogenous variables for which the coefficients πs are to be estimated

In the first step, the Arellano-Bond (1991) GMM estimator is employed for equation (1). The QML-FE estimator (Hsiao et al., 2002) is based on the log-likelihood function of equation (2) in the case of a balanced panel for periods t ≥ 2 and (3) for t = 1. The likelihood function can be maximized with an iterative procedure. This method is particularly suitable for dynamic panels with highly persistent variables and less than ten years, as is the case in this analysis. Since the estimation technique is based on the first differences of the data, it is assumed that all differences are stationary. This assumption can be validated by the cross-sectionally augmented Im-Pesaran-Shin (CIPS) test (Pesaran, 2007). In addition, domestic overnight stays in a single region are assumed to have no impact on GDP or aggregate consumer prices and thus the COVID-19 pandemic can be regarded as an exogenous demand shock. This means that the regressors are expected to be fully exogenous, as required by the model.
As an alternative, the bias corrected least squares dummy variable (BC-LSDV) dynamic panel data estimator developed by Kiviet (1995) and refined by Bun and Kiviet (2003) and Bruno (2005a) is employed. This estimator is designed to overcome inconsistencies, such as a finite T in equation (1). The initial parameter values are achieved by Arellano-Bond linear dynamic panel data estimations (Arellano and Bond, 1991) and the robust standard errors are obtained from a bootstrap variance–covariance matrix with a repetition of 50 times.
Data and descriptive statistics
For the purpose of the analysis, a balanced panel of data is put together covering eight years and 65 regions in four European countries. The number of domestic overnight stays in hotels and related accommodation establishments by month and region originates from the statistical offices in each of the four countries included in the analysis: Czech Statistical Office, Destatis, Germany, Federal Statistical Office, Switzerland and Statistics Austria (Supplementary Table A1, Appendix). The level of aggregation for which data are available varies by country: Germany at NUTS 1 level, Austria at NUTS 2 level, Switzerland and the Czech Republic each at NUTS 3 level. Monthly values for CPI and quarterly real GDP data are retrieved from OECDSTAT (VOBARSA: National currency, volume estimates, OECD reference year, annual levels and seasonally adjusted; https://stats.oecd.org/). Data on average monthly temperatures for July and August can be found in various sources (Table A1, Appendix).
There are several ways to characterise a region, urban versus rural or metropolitan versus non-metropolitan, for instance, where not only population density but also proximity to a larger agglomeration is taken into account (Brezzi et al., 2011; Fadic et al., 2019). Still, these measures are not always applicable, especially not when larger countries are analysed together with smaller ones. The research question in this study most clearly fits with the metropolitan versus non-metropolitan typology as identified by the OECD (Fadic et al., 2019). Unfortunately, the distribution and granularity of regions (as well as the data available) are not fully consistent across the four countries included in the study implying that this scale is less suitable to employ. Typically, Switzerland would then have to be excluded from the estimations due to the lack of a large metropolitan area. Because of this, present study retreats to a measure solely relating to population density. Densely populated regions are identified as those with more than 800 inhabitants per square kilometre, spanning from 880 in Zürich to 5271 in Basel-Stadt (Supplementary Table A2, Appendix). Regions Vienna and Berlin are also densely populated, with 4607 and 4090 inhabitants per square kilometre, respectively. The average population density of the most inhabited regions is 2915, which is a factor 16 higher than in the sparsely populated ones. Additional descriptive statistics are found in Supplementary Table A4, Appendix.
Before the outbreak of the pandemic, six of the densely populated regions included in the study experience an increase in domestic overnight stays by three percent or more per summer during the period 2014–2019 (Supplementary Table A3, Appendix). Zürich and Prague stand out with annual growth rates of nine or ten percent on average. This reflects the situation with an ongoing city tourism boom before the pandemic. In the summer of 2020, the pattern changes, all densely populated regions except Prague experience a marked drop in domestic overnight stays, ranging from 52% in Zürich to 25% in Bremen as compared to the same period in the previous year. Only three out of the 57 sparsely populated regions suffer a similar decline in domestic tourism demand (Supplementary Table A3, Appendix).
After the steep decline due to lockdowns and other mobility restrictions during spring 2020, domestic tourism to densely populated areas recovers slightly in the summer months of 2020, but it does not come close to the level of earlier years except for the region encompassing the city of Prague (Figure 1). On the other hand, data for the sparsely populated regions show that the domestic tourism demand occurs on a similar level as in earlier years (source: Czech Statistical Office, Destatis, Germany, Federal Statistical Office, Switzerland and Statistics Austria). Monthly evolution number of domestic overnight stays in densely and sparsely populated regions (million). Notes: Geneva and Basel are not included because of the small number of overnight stays.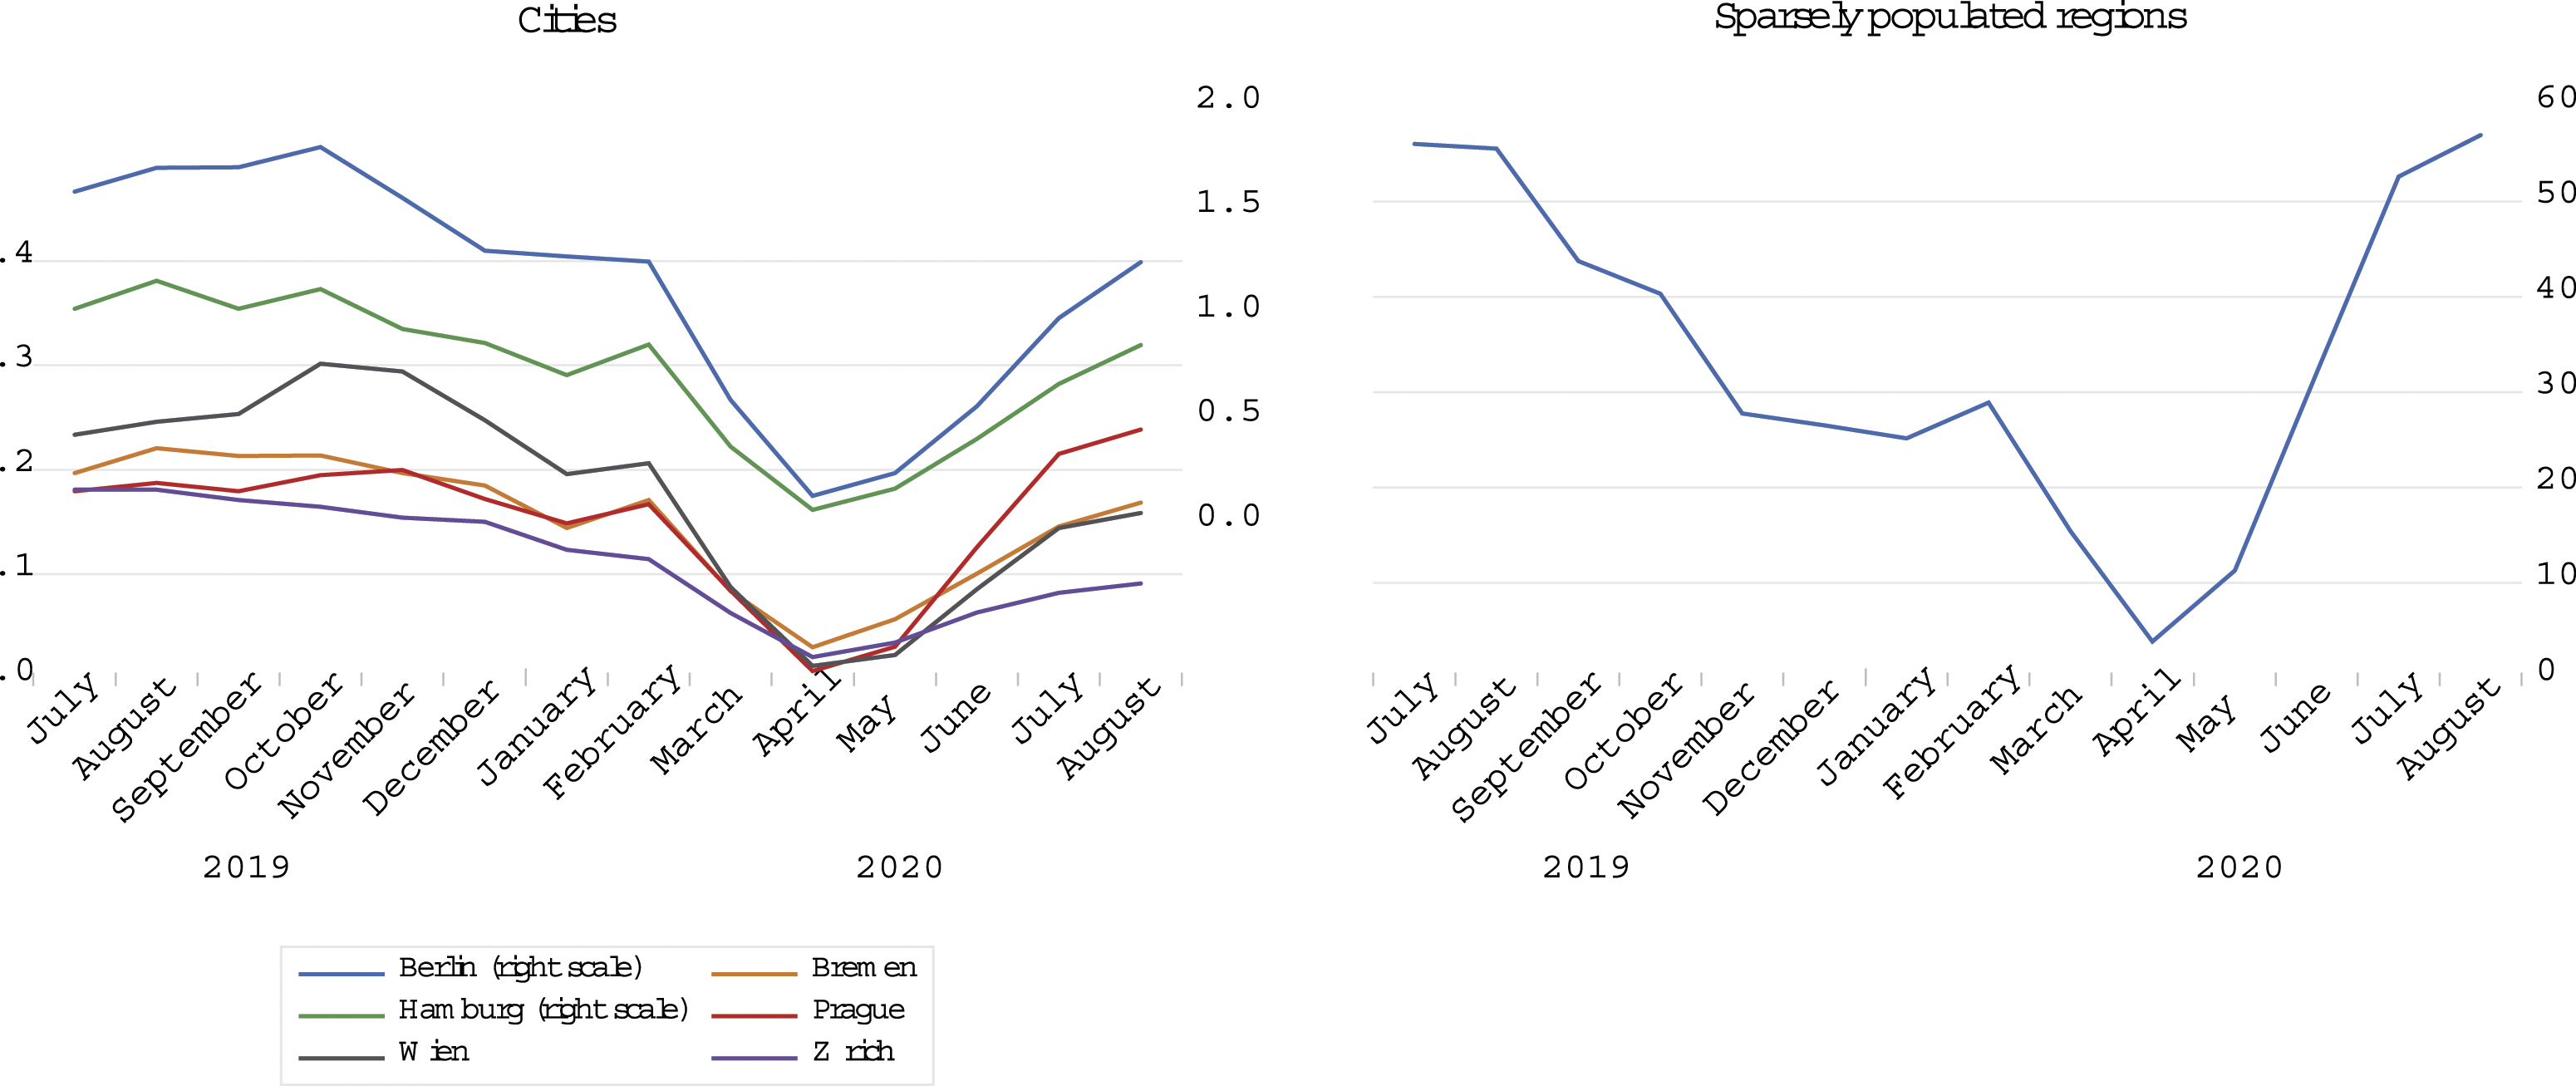
Empirical results
Determinants of demand for domestic tourism, July months 2013–2020 (Dynamic QML-FE estimations).
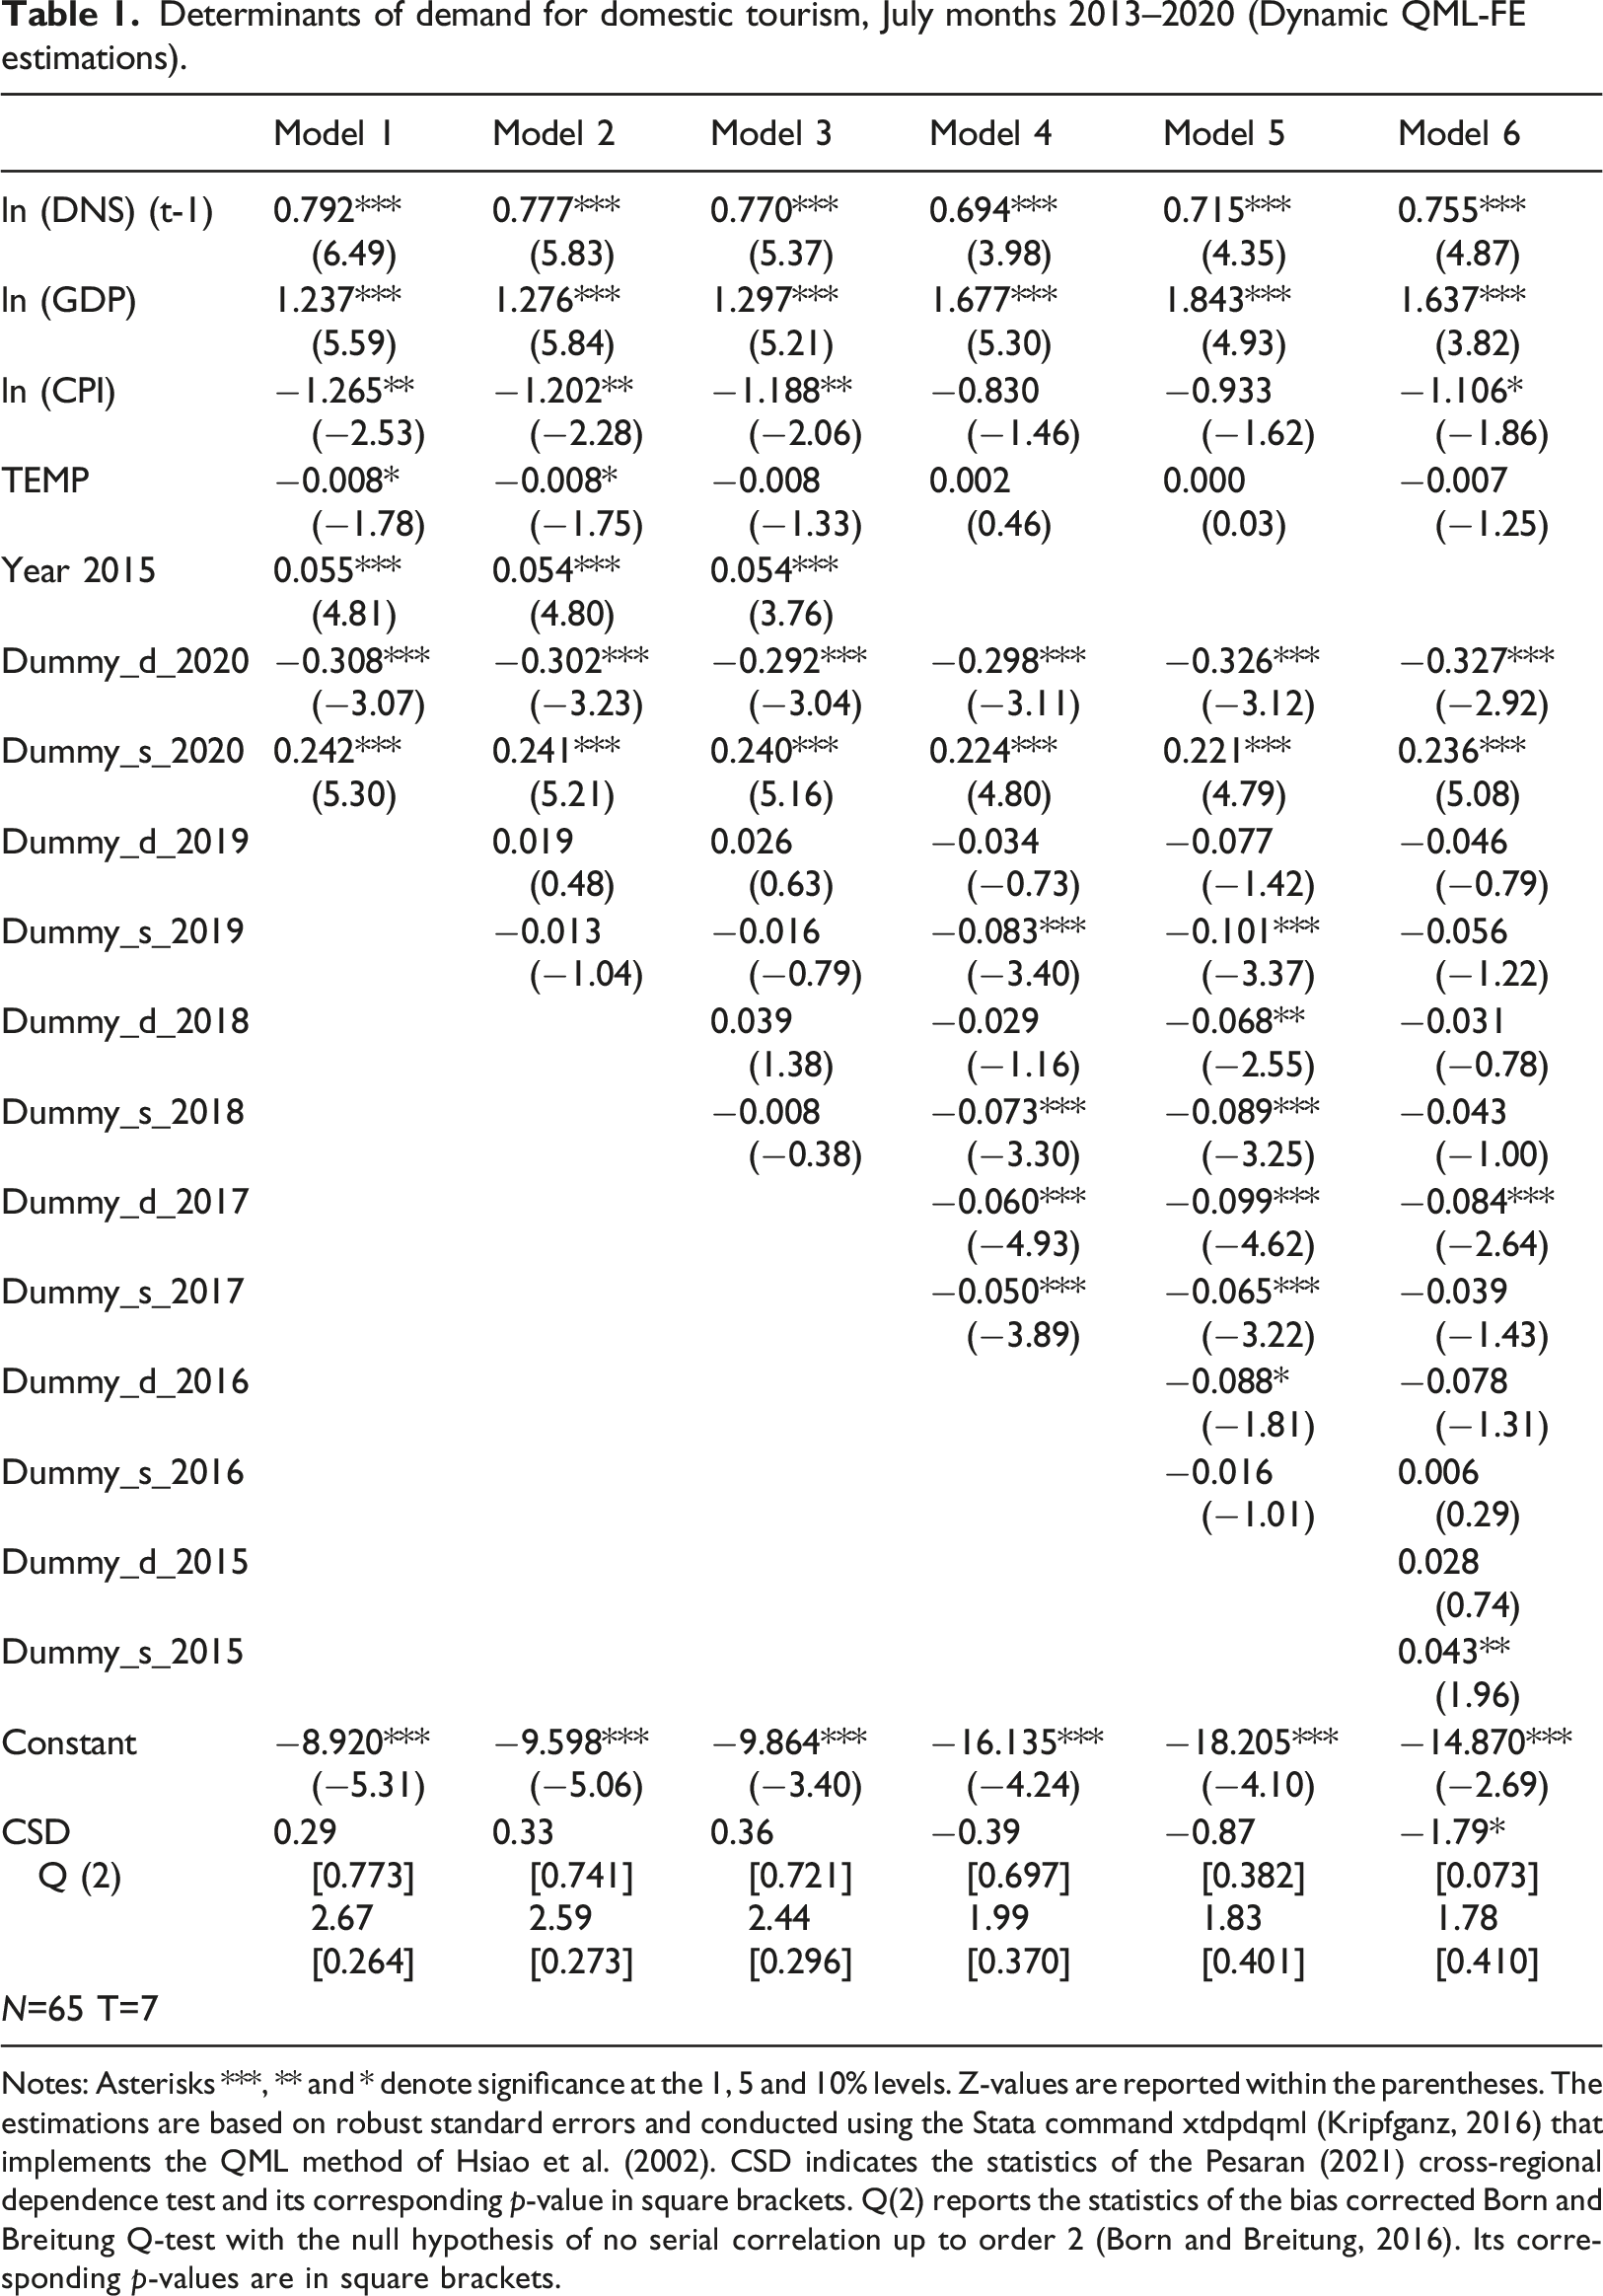
Notes: Asterisks ***, ** and * denote significance at the 1, 5 and 10% levels. Z-values are reported within the parentheses. The estimations are based on robust standard errors and conducted using the Stata command xtdpdqml (Kripfganz, 2016) that implements the QML method of Hsiao et al. (2002). CSD indicates the statistics of the Pesaran (2021) cross-regional dependence test and its corresponding p-value in square brackets. Q(2) reports the statistics of the bias corrected Born and Breitung Q-test with the null hypothesis of no serial correlation up to order 2 (Born and Breitung, 2016). Its corresponding p-values are in square brackets.
There is a possibility that the levels and their first-order differences of the logarithmic number of domestic overnight stays and temperatures in July and August are all cross-regionally dependent. Because of this, the cross-sectional dependence tests based on Pesaran (2021) are performed, and the results show that there is indeed a dependency (Supplementary Table A5, Appendix). This dependency is controlled for by customising the number of year dummy variables included in each specification.
By a stepwise build-up of the number of dummy variables for densely and sparsely populated regions, the robust effect of the pandemic is identified (Table 1, Models 2–6). Independent of this exercise, the results for the summer months of 2020 are consistent with significant increases in densely populated regions and declines in sparsely populated regions.
The income elasticity is significant, indicating that a one per cent rise in real GDP at the country level would lead to a 1.2% surge in domestic overnight stays in the short-run (Table 1, Model 1). Noteworthy, though, is that the price elasticity and the impacts of temperature are both not significantly separated from zero. The coefficient for the lagged dependent variable is 0.79, indicating a high persistence in the number of domestic overnight stays.
Determinants of demand for domestic tourism, August months 2013–2020 (Dynamic QML-FE estimations).
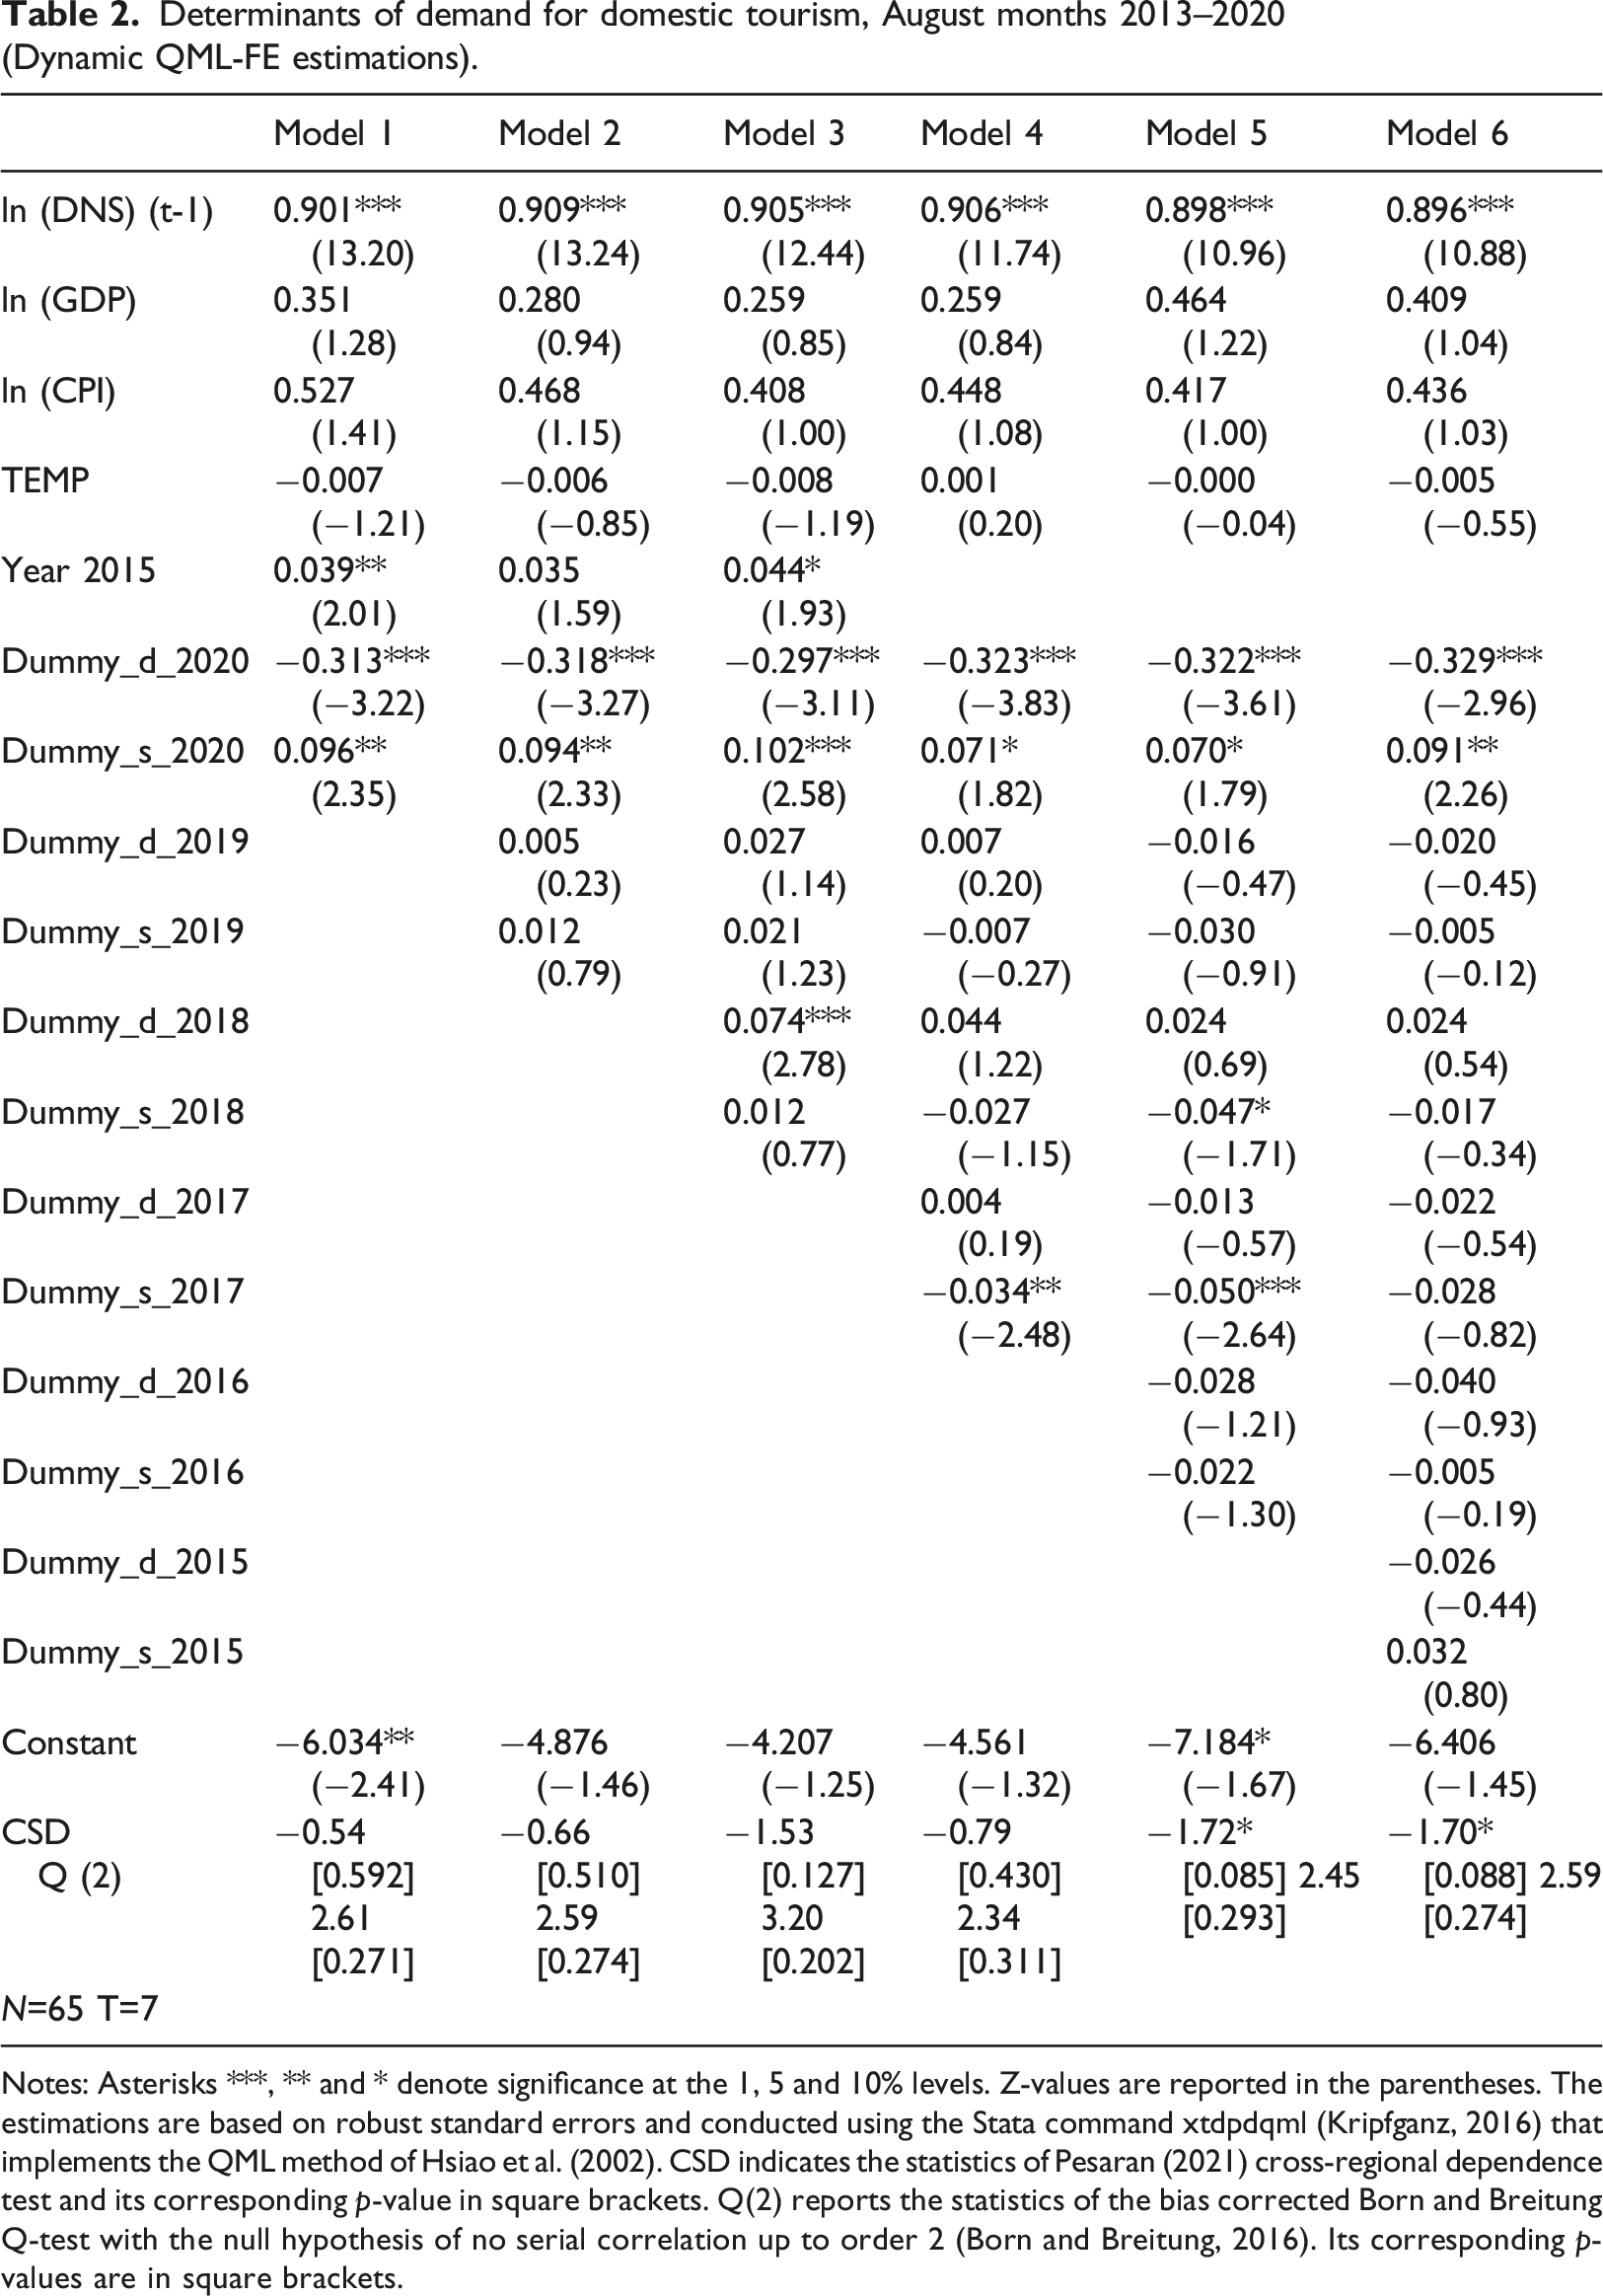
Notes: Asterisks ***, ** and * denote significance at the 1, 5 and 10% levels. Z-values are reported in the parentheses. The estimations are based on robust standard errors and conducted using the Stata command xtdpdqml (Kripfganz, 2016) that implements the QML method of Hsiao et al. (2002). CSD indicates the statistics of Pesaran (2021) cross-regional dependence test and its corresponding p-value in square brackets. Q(2) reports the statistics of the bias corrected Born and Breitung Q-test with the null hypothesis of no serial correlation up to order 2 (Born and Breitung, 2016). Its corresponding p-values are in square brackets.
Results coincide with recent literature in that rural areas experience an increase in domestic overnight stays (Seraphin and Dosquet, 2020 for France; Vaishar and Šťastná, 2022 for the Czech Republic). The finding of the high degree of persistence in domestic tourism demand is consistent with previous studies (Massidda and Etzo, 2012; Tsui, 2017).
Several robustness checks are performed, encompassing alternative regional classifications, specifications (lagged temperatures), dynamic panel data methods, aggregation levels (July and August) and time periods (including September). Results obtained from QML-FE estimation of alternative specifications show that lagged temperatures are significant in July, while the estimates are otherwise consistent with the standard specification (Supplementary Table A6, Appendix). However, for August the coefficient of the lagged temperature is not significant. The BC-LSDV estimator (Bruno, 2005b) also gives consistent results, although the magnitudes vary. Coefficients for the densely populated regions are smaller in absolute terms for July and larger for the sparsely populated areas, while the opposite pattern is observed for August (Supplementary Table A6). The short-run income elasticities are larger than those obtained from the dynamic QML-FE estimations and the price elasticities are significant.
Additional verifications of the results encompass estimations on data for September 2020. These estimates coincide well with those for July and August taken together (Supplementary Tables A7 and A8 Appendix), implying that the decline in domestic tourism demand in densely populated regions continues in late summer, while sparsely populated regions still experience an increase.
Since large metropolitan areas are not available in all countries, an alternative estimation is also performed where focus is put on the non-metro remote regions, as specified by the OECD (Fadic et al., 2019). Results show that remote regions experience a significant increase in domestic tourism flows in the summer of 2020 (Supplementary Table A9, appendix). As shown by the coefficients (which range from 0.13 to 0.18 and are all significant at the 5% significance level), the increase is between 13 and 20% in the short term. Thus, the results are consistent with the main findings based on the preferred definition of population density. Overall, the robustness analysis shows that the main result is robust to the estimation method, regional division, specification, aggregation level and definitions (densely populated versus remote regions).
Conclusions
In this study, the impact of the COVID-19 pandemic on domestic tourism demand, approximated by the number of domestic overnight stays at the regional level for four European countries in the summer of 2020 is investigated. The medical literature highlights that the risk of spreading the virus is related to the contact rate and population density, something that together with cancelled events and business meetings as well as home offices motivate the appearance of an uneven domestic tourism demand across regions. An empirical framework is provided to estimate the development of domestic tourism demand for densely as well as sparsely populated regions. The model also controls for the COVID-19-induced recession, persistence of tourism demand and weather conditions.
Evidence based on dynamic panel data estimations shows significant negative short-run effects of the COVID-19 pandemic on domestic tourism demand for densely populated areas. The impacts are large for both July and August with a reduction in the number of overnight stays of almost 30% as compared with the previous 5 years. Thus, the absence of events as well as the spread of the virus and measures taken to combat it clearly negatively affects the wish to visit more densely populated areas. In contrast, areas with a low population density experience an increase in the number of domestic overnight stays by approximately 15%, the summer months taken together, although the underlying association is larger for July than for August. There may be various reasons behind this. Hypothetically, it could relate to accumulated demand triggered in July, while travel in August has other characteristics with people again being more alert about the spread of the virus.
The findings imply that there are certain policy implications. The COVID-19 pandemic largely affects domestic travel and tourism demand for densely populated regions. With an unprecedented magnitude of the decline, the pattern of domestic tourism flows contributes to the halt of the earlier ongoing city tourism boom. Sparsely populated areas experience a strong (July) or moderate increase (August). As the proportion of domestic overnight stays in sparsely populated regions accounts for more than 90%, the increase in domestic overnight stays more than compensates for the decline in the densely populated regions. This over-compensation could relate to the possible substitution effects not only between domestic regions but also in relation to international travel. Presently, there is no data available that can inform on where those people go, who normally spend their holidays abroad, but the results indicate that some of them are holidaying domestically. There is also a risk that events and places where people cannot properly distance themselves from each other will be considered frightening even when the pandemic is under control. Thus, low demand for densely populated regions by domestic travellers may persist. The surge in domestic tourism demand for sparsely populated areas is not large enough to justify concerns of over-visitation.
Several limitations must be noted. The results refer to four countries in Central and Middle Europe and cannot be generalised for other regions with completely different features. Another limitation is that the study on the determinants of domestic travel and tourism demand at the regional level is restricted to the summer months of 2020. This partly depends on the travel bans incurred due to the pandemic, which were only lifted during a short period of time with low levels of infected persons. These summer months also coincide with the periods for school holidays when families typically go on the main holiday of the year. Other seasons cannot be included due to limitations on domestic tourism from October 2020 onwards.
The study focuses on the short-run effects of the pandemic; medium and long-term implications cannot yet be answered. Hence, the long-term analysis covering different seasons is left to future studies. Nevertheless, the panel data allows the trends running up to the outbreak to be clearly identified for comparisons. Another limitation is the definition of sparsely and densely populated areas and the different aggregation levels of regional data in the four countries. Some of the regions in the sparsely populated group are characterised by medium-high population density. Future work can fine-tune these definitions or use other splits. An additional area for future work is the use of regional data at a finer level of aggregation. This will allow a more precise classification of regions with low, medium and high population densities. Future travel surveys by the national statistical offices will also be beneficial since they hold information on travel flows and motivations (mountains, lakes, cities et cetera).
Supplemental Material
sj-pdf-1-teu-10.1177_13548166211059409 – Supplemental Material for Uneven domestic tourism demand in times of pandemic
Supplemental Material, sj-pdf-1-teu-10.1177_13548166211059409 for Uneven domestic tourism demand in times of pandemic by Martin Falk and Eva Hagsten in Tourism Economics
Footnotes
Declaration of conflicting interests
The author(s) declared no potential conflicts of interest with respect to the research, authorship, and/or publication of this article.
Funding
The author(s) received no financial support for the research, authorship, and/or publication of this article.
Supplemental Material
Supplementary Material for this article is available online.
Notes
Author biographies
References
Supplementary Material
Please find the following supplemental material available below.
For Open Access articles published under a Creative Commons License, all supplemental material carries the same license as the article it is associated with.
For non-Open Access articles published, all supplemental material carries a non-exclusive license, and permission requests for re-use of supplemental material or any part of supplemental material shall be sent directly to the copyright owner as specified in the copyright notice associated with the article.