
Abstract
This study evaluated the efficiency of Japanese ryokans during the period 2005–2012. The number of ryokans has been decreasing due to the inability of operators to respond to structural changes in demand. Thus, we investigated the cause of that decrease. Based on literature examining efficiency and productivity applied to tourism and hospitality, ryokans are analyzed both at the size and regional levels. The findings confirmed quantitatively the empirical literature and showed that large-scale ryokans are relatively more efficient than smaller operations, which is commonly observed in the accommodation industry. Managerial recommendations were derived from the results for small ryokans.
The Japanese tourism sector is growing. In 2014, international tourist arrivals in Japan represented more than 13 million. After the earthquake in 2011, the annual average growth rate of international tourist arrivals from 2012 to 2014 was 30.2% (source: Japan National Tourist Organization). These findings underline the attractiveness of Japan, including traditional Japanese style accommodations, among international tourism destinations. At the supply level, Japan offers a particular and unique kind of accommodation, which is called “ryokan,” and it can be viewed as a tourism attraction.
Despite this growing number of tourist arrivals, ryokans face many challenges, and more efficient management is required to cope with demand changes (Kiriyama, 2008; Ministry of Welfare and Labor, 2014). The deficiency in management capability is a common issue quite often observed in the accommodation sector in every part of the world. In this context, this issue for ryokans is more likely to come to the fore due to the traditional style of management than for modern hotels. Thus, this study on ryokan performance will contribute to considerations of what aspects of efficiency are needed to improve not only the ryokan sector in Japan but also the sector comprised of small-sized accommodations in general. To explore effective countermeasures to revitalize the management of ryokans, it is crucial to conduct an empirical evaluation of the efficiency of ryokans and to clarify what are the features of ryokan efficiency, how ryokan efficiency has changed or not changed, and what caused the changes that have occurred. To our knowledge, however, tourism studies on evaluation of the efficiency of Japanese accommodations published in English or even in Japanese have been scarce, except for those on rural tourism such as productivity measurements by Ohe (2014) or descriptive consultancy work (Nambara, 2014). Therefore, this article tries to fill the research vacuum in the Japanese accommodations sector by evaluating the efficiency of Japanese accommodations to reveal clues for developing the traditional type of accommodations while modernizing their operation so that they will serve as a resource for traditional Japanese tourism.
The purpose of this article is to contribute to the literature from the following aspect. The present contribution is innovative because it is the first empirical application to the Japanese tourism sector and more precisely to ryokans. Given the challenges the ryokans face, we propose a benchmarking and efficiency analysis to identify the best practices within this competitive sector. Indeed, it is necessary to determine what kind of ryokans perform better in order to derive managerial recommendations for decision makers. To tackle this issue effectively, we used the Window data envelopment analysis (DEA) approach. The main advantage of such an approach is that small data samples can be dealt with, which is particularly convenient in our case where ryokans data are aggregated on a size and regional basis. It also allows for the examination of trends in efficiency over different time periods. Window DEA has been applied to measure efficiency in different economic sectors such as energy and environment (Halkos and Tzeremes, 2009; Sueyoshi et al., 2013; Wang et al., 2013; Zhang et al., 2011), banking (Webb, 2003), transportation (Yu et al., 2008), semiconductor market (Chung et al., 2008), telecommunications (Yang and Chang, 2009), and health (Kazley and Ozcan, 2009). However, except for the work of Pulina et al. (2010), we are not aware of any published contribution applicable to the tourism industry.
Following this introductory section, section “Japanese hospitality and ryokans” describes the Japanese hospitality sector with a specific emphasis on ryokans, section “Methodology” explains the methodology, and “Results” section presents the data and results. The final section summarizes the conclusions that can be drawn from this analysis.
Japanese hospitality and ryokans
Characteristics and uniqueness of the Japanese sector
There are two types of accommodation facilities in Japan: Western style hotels and Japanese style accommodations, that is, ryokans. The way of providing services to tourists who stay in Japanese style accommodations is quite different from that in hotels because services provided by ryokans are based on the traditional Japanese manner. The manner of Japanese hospitality is termed as “Omotenashi,” which is not officially defined, but is commonly perceived as a way of offering hospitality to guests among people in Japan. Currently, the Tourism Agency in Japan uses this word as a keyword for promotion of inbound tourism to Japan despite no clear definition of its meaning and distinctiveness. In our view, although the essence of Omotenashi is the same as Western hospitality, which aims to maximize the satisfaction of guests, the way of expression of hospitality is different. Omotenashi puts more weight on politeness and kindness in contact with guests in comparison with the Western counterpart, which places a greater emphasis on friendliness, especially in North America. Ryokans are the most suitable accommodations in which to experience Omotenashi. Unique services in ryokans that are not offered in hotels are as follows. Basically, rooms are not Western style, but have tatami mat flooring that accommodates at least two people. Tatami mats are composed of traditional flooring material made of special grass for the tatami, called “igusa.” Because of this structure, everyone removes shoes when entering ordinary houses in this country, including ryokans. In this housing style, guests do not sleep in a bed but on a futon mat wearing a yukata, a type of kimono for sleeping. The futon mat is usually placed directly on the tatami mat. Normally, dinner and breakfast, basically comprised of Japanese food, are included in the charges. Another important service is bath service. Normally in ryokans, guests bathe together with other tourists in a large bath. It is a Japanese tradition that people spend time soaking themselves in hot springs, public baths, or large bathtubs mingling for relaxation and social occasions. In reality, a combination of traditional and Western services is offered in addition to these basic types of services and facilities. For instance, it has become increasingly common to have bedrooms in addition to tatami mat rooms especially in large-scale ryokans and to serve Western-style food as well. Large hotels also provide tatami mat rooms and serve Japanese food. However, authentic Japanese ryokan services are only available in ryokans. Nevertheless, it is another issue as to whether authentic services can result in efficient business management. We examine this aspect below in comparison with hotels.
Trends in ryokans and hotels in Japan
Figure 1 shows trends in the number of facilities and number of rooms in ryokans and hotels in Japan. Although in 1997 the number of ryokans was much greater than that of hotels, the trends for the two types of accommodations are quite different, with an increase in the number of hotels and decrease in the number of ryokans. Why did this trend occur? The reason might be that operators of traditional ryokans tend to have low-level managerial skills and failed to respond to demand changes especially among small-scale family business entities (Ohe, 2014). In the high-growth economic period during the 1960s, large tourist groups were their main customers, such as for autumn or year-end trips by company employees. These trips were often subsidized by the company as a series of employee benefits. After this high economic growth period, tourism within Japan changed to that by family/couple units and/or small groups of close friends due to the orientation toward more individual preferences. Ryokans have the advantage of accommodating large groups because their large tatami mat rooms can accommodate large numbers of tourists. These large rooms can be used for parties and also for sleeping because futon mats are portable, which means that ryokans are much more flexible in providing sleeping accommodations than hotels because beds are not generally portable. Many family-run ryokans could not take advantage of these changing trends in demand due to the lack of managerial skills and aging of operators without successors. This is because mass hospitality services for large groups must be adapted to providing more careful and sophisticated services targeted at families and couples. Thus, many ryokans remain at a low level of profitability and must eventually go out of business. The rapid decrease in the number of ryokans indicates a lack of innovation in the business operation due to deficiencies in the capability to cope with these structural demand changes (Ministry of Welfare and Labor, 2014).
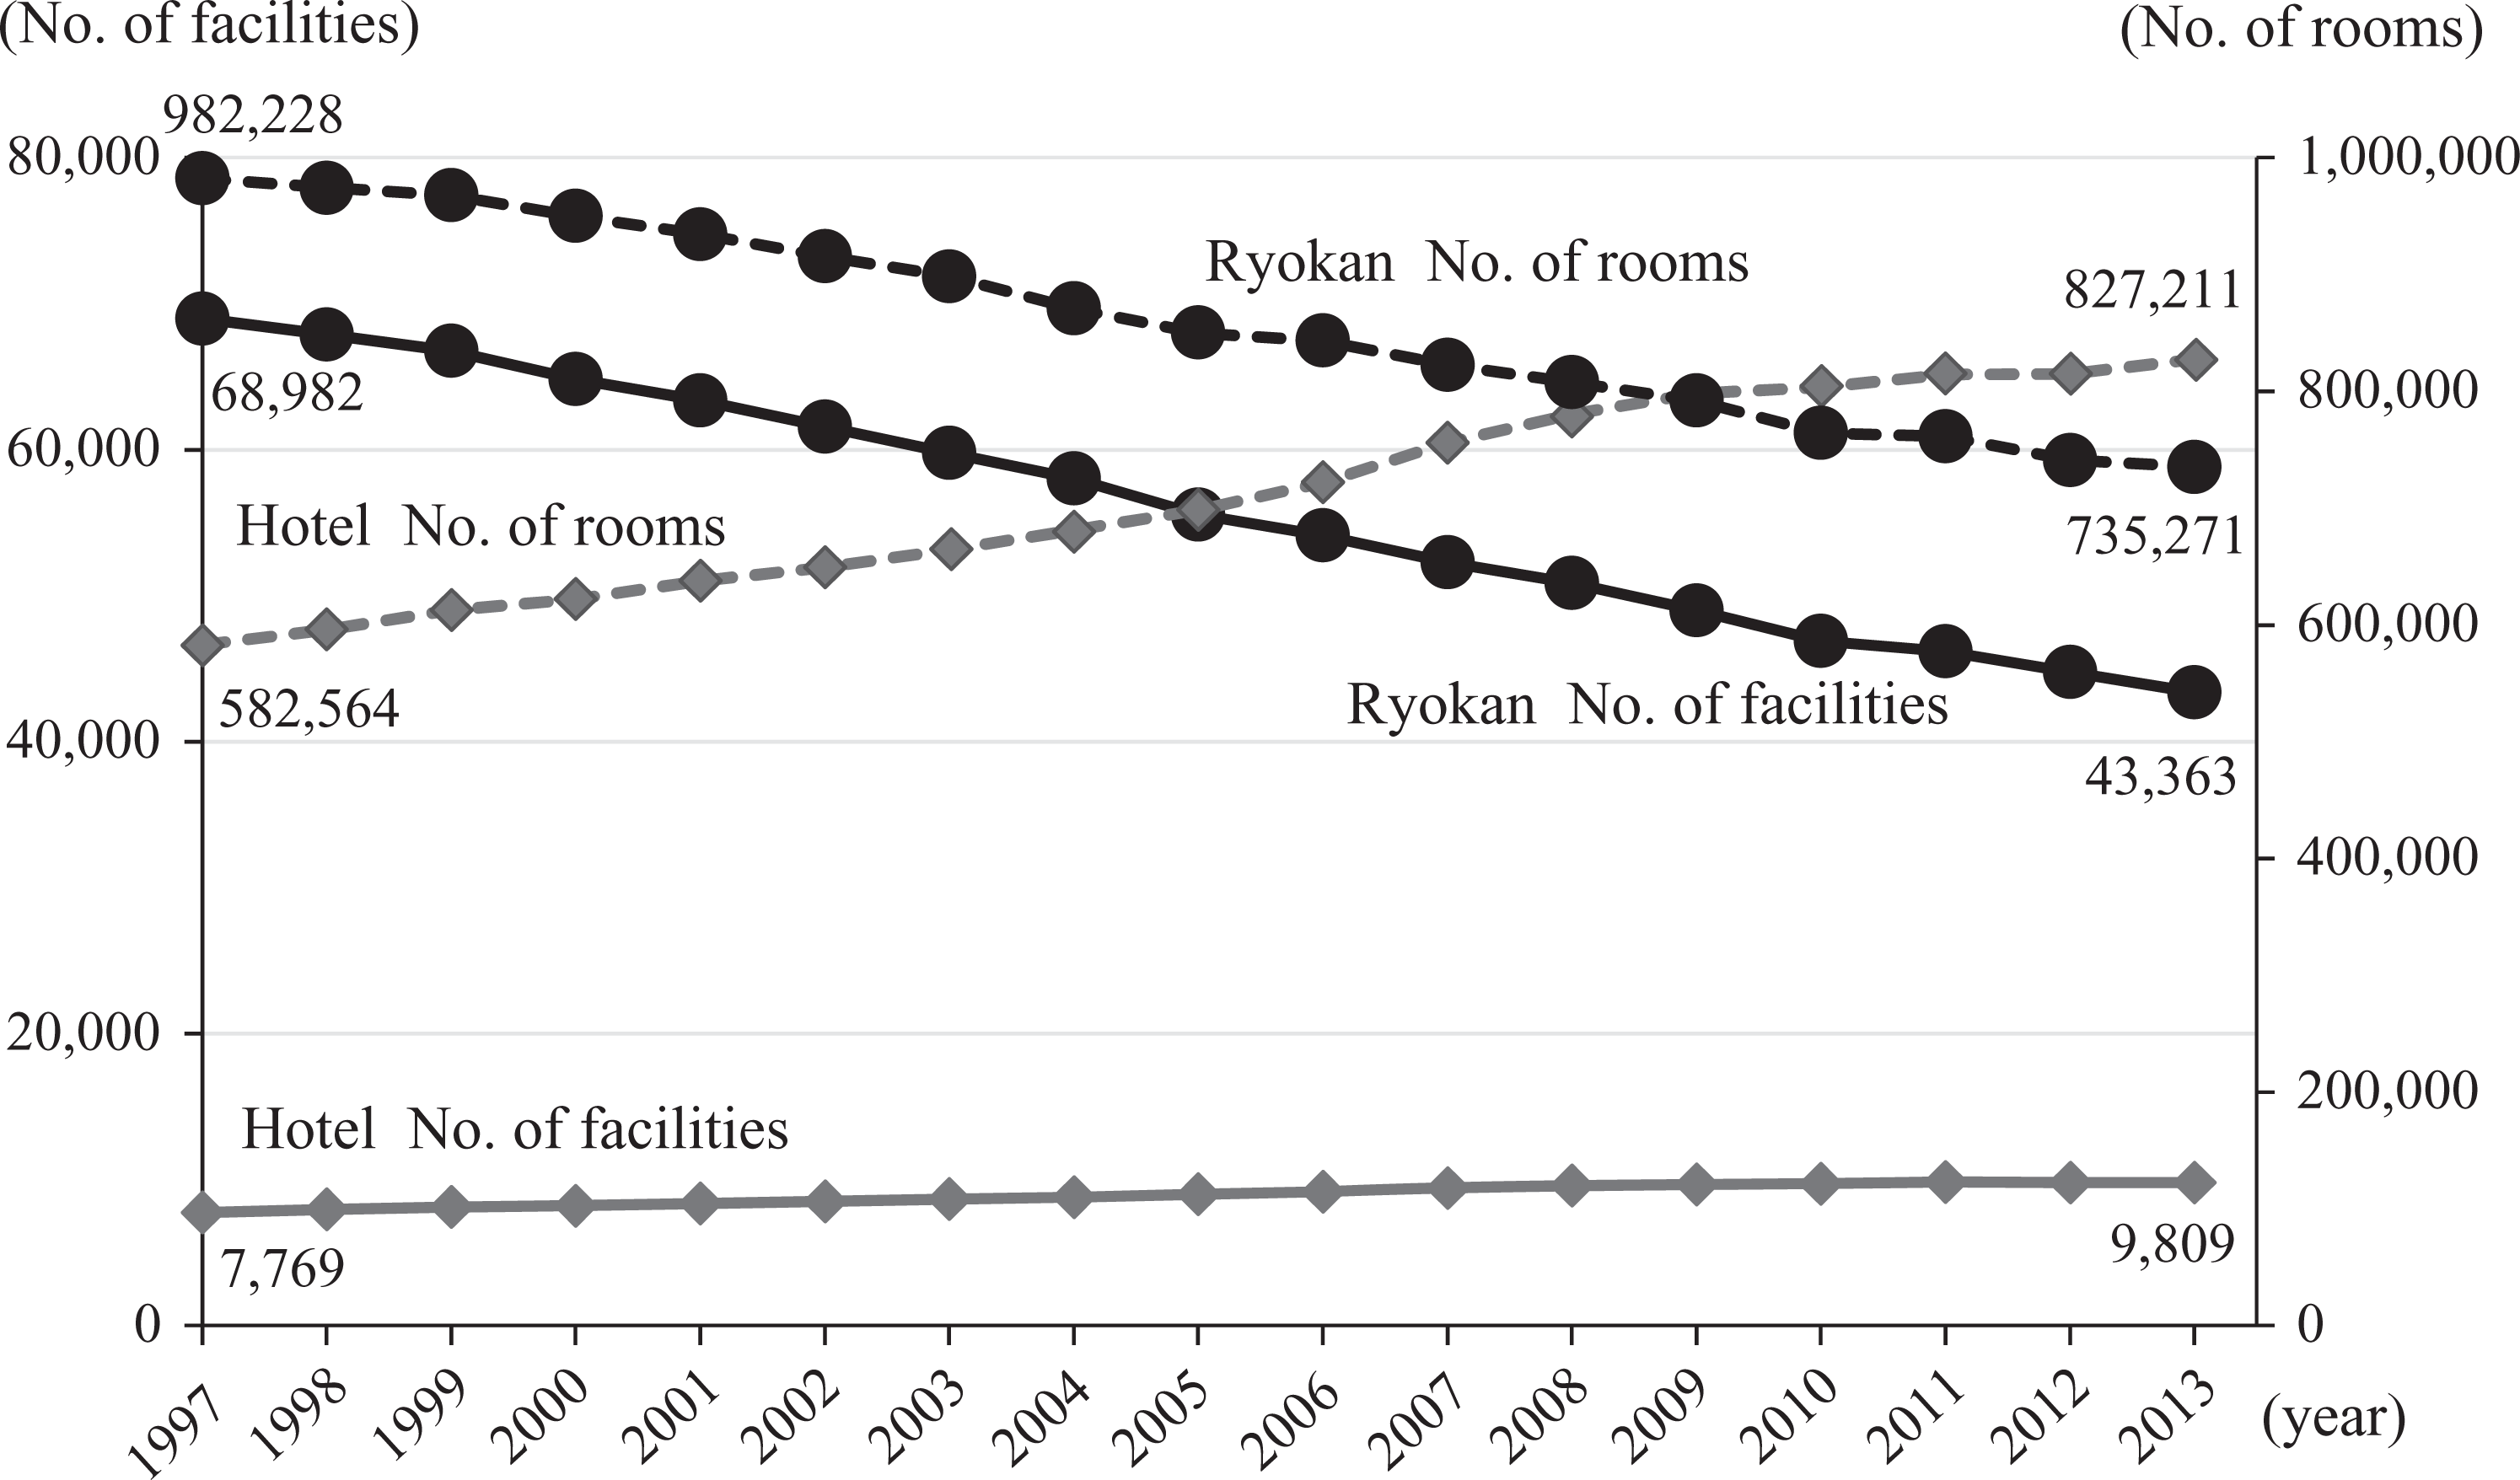
Trends in number and size of hotels and ryokans in Japan. Source: Ministry of Welfare and Labor, Japan.
In contrast, in the case of hotels not only has the number of facilities increased, but also their size has increased more rapidly than in the case of ryokans. The vertical gap between the number of facilities and rooms in Figure 1 has been growing larger than that of ryokans, meaning that the scale of hotels has increased faster than that of ryokans. This is because hotels have been seeking economy of scale to obtain a larger share of the demand and more efficient resource management. One reason behind this active enlargement of hotels is that there are many chain hotels competing with each other. They are more capable financially and in human resources than the majority of small family ryokans. In this respect, ryokans are far behind this trend. This is the dilemma that the traditional and authentic Japanese hospitality sector faces. The Ministry of Welfare and Labor, which administers the accommodation sector, issued a report in 2014 on the current situation of the accommodation sector based on a survey conducted in 2012 (Ministry of Welfare and Labor, 2014). The report pointed out problems that the accommodation sector faces, which are a decrease in tourist spending per head, aging facilities, aging operators, and increases in energy and utility costs. Those ryokans that went out of business were highly likely to have been affected by these issues. The report suggested improvement measures such as to increase repeat visitors, adapt IT, and improve service quality, including Omotenashi. Nevertheless, these remarks were a little too generalized, and it was not clearly indicated who most needed those improvements within that sector. This is the reason why evaluation of efficiency is necessary, especially for ryokans.
Methodology
Models
A tourism attraction (Leiper, 1990; Lew, 1987) is a key determinant in the understanding and analysis of tourism destinations. In order to be competitive, the management of resources is a key point. Part of the literature analyzes tourism destination competitiveness through efficiency analysis, which means the link between resources used and results obtained. Parametric and nonparametric approaches such as, respectively, stochastic frontier analysis (SFA) and DEA are useful tools to implement efficiency analysis. Many empirical contributions used SFA and DEA for the evaluation of tourism efficiency (Assaf and Dwyer, 2013; Peypoch and Solonandrasana, 2008), and a recent literature review was conducted by Assaf and Tsionas (2015). To our knowledge, a Japanese case has not been analyzed previously, neither at the destination nor at the sector level. Although Ohe (2011) econometrically evaluated the productivity of rural tourism activities including rural accommodations, the scope of the study was limited to rural areas.
The methodology used in this contribution is based on DEA. DEA is a nonparametric approach based on linear programming (LP), which has many key advantages. Among these, it is not necessary to suppose a priori a functional form for production technology; it allows the characterization of multi-input and multi-output production technologies. Charnes et al. (1978) and Banker et al. (1984) introduced, respectively, two seminal DEA models, namely Charnes, Cooper, and Rhodes (CCR) and Banker, Charnes, and Cooper (BCC) models.
In order to model production technology, it is considered that ryokans transform resources, or inputs, denoted by

where k represents the number of units analyzed in the sample and θ is an intensity variable.
The LP for the calculation of the efficiency score (δ) of each of the k units is given by
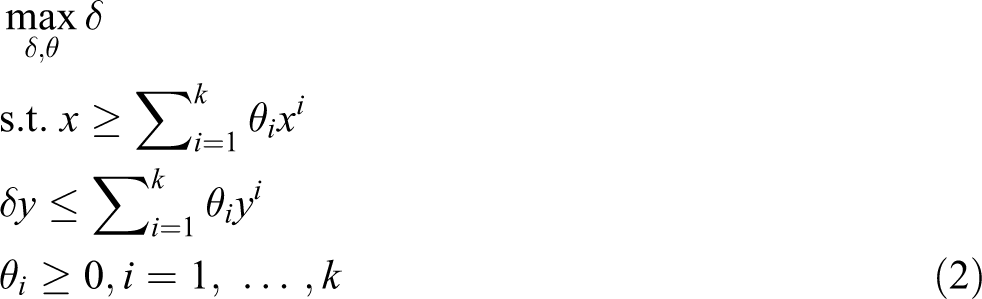
This model is the well-known CCR model, which assumes constant returns to scale. It is possible to consider variable returns to scale by adding the constraint
When the sample used in the DEA framework is too small, basic DEA models cannot be applied. Indeed, the number of units should be greater than three times the total of inputs and outputs (Cooper et al., 2007); otherwise, there is a risk of obtaining too many units on the efficient production frontier, which would affect the discriminatory power of the DEA. To overcome this problem and maintain the usefulness of the DEA for benchmarking and efficiency analysis, a Window DEA approach (Charnes et al., 1985; Klopp, 1985) can be employed. The objective is to treat decision-making units (DMUs), that is, ryokans in this article, in different time periods like different DMUs in order to increase the size of the sample. The selection of the length of the Window is then a key point. More technical details about the Window DEA model can be found in Cooper et al. (2007).
Data and hypotheses
The data set used in this study is sourced from the reports of the Japan Ryokan & Hotel Association, which conducts an annual survey of member ryokans and is designated as the “Statistical Survey on the Operation of International Tourism Ryokans (ITR) (in Japanese).” Membership in this association is limited to ryokans designated as an “international tourism ryokan” by the Tourism Agency. These designated ryokans are required to offer services that would satisfy the requirements of international tourists, which means that ITRs are relatively high-end ryokans with higher managerial capability than the average. Required services are language skills, signboards in English, Western breakfast menus, bed-style sleeping equipment, and so on. In April 2013, a total of 3234 ITRs were registered. Data were available from 2005 to 2012 according, on the one hand, to nine administrative regions and, on the other hand, to three sizes of ryokans (small, medium, and large). The regional classification in 2012 is illustrated in Figure 2. The data, however, have the following constraints. First, delivered survey sheets were returned without identification to maintain the privacy of respondents and to make those surveyed more likely to respond. Second, statistics about Japanese ryokans were gathered during periods of two zoning changes, respectively, in 2009 and 2012. Third, data on the basis of regions and sizes were aggregated and available separately. Then, two assessments were implemented in this study in order to compare the differences in efficiency in the ryokan sector in terms of regions and sizes. On the one hand, comparisons among nine regions were made for the period from 2005 to 2008 to avoid problems related to the zoning changes mentioned earlier. On the other hand, comparisons were made according to three sizes of ryokans from 2005–2012. Facilities with 100 or more rooms were classified as large, with 31 to 99 rooms as middle size and with less than 30 rooms as small.
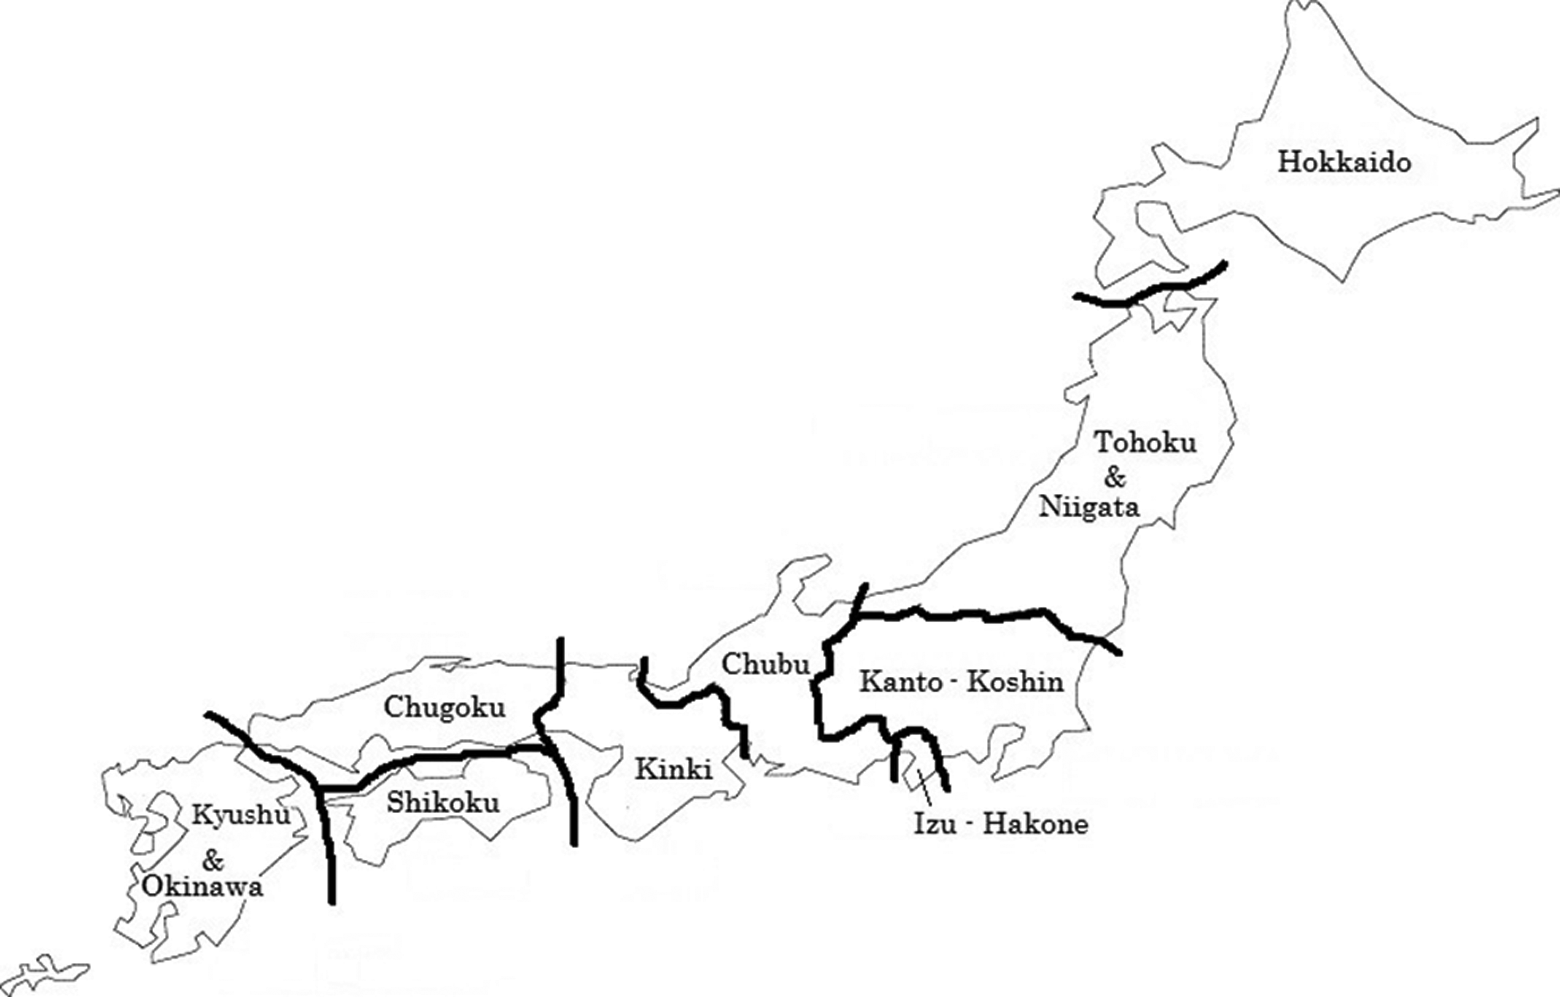
Map of regional mapping of ryokan data.
The selection of inputs and outputs for production technology was made as described in the literature (see Assaf et al. (2012) for a survey about the inputs and outputs used in tourism efficiency analysis) and the constraint of data availability. For the production technology of each region, two inputs (number of employees and rooms) and two outputs (total revenue and total number of overnight stays) are used for the nine administrative regions. A length of a Window of 2 years is selected because it is assumed that this Window is relatively short in order to avoid potential changes in the production technology in each region. For the production technology of the ryokan scale, two inputs (number of employees and rooms) and two outputs (total revenue and total number of overnight stays) are used for the three sizes. A length of a Window of 4 years is selected in order to ensure a sufficient number of units during a given window. Then, the basic DEA rule is respected, that is, the number of units is greater or equal to three times the sum of inputs and outputs. Table 1 summarizes the descriptive statistics of inputs and outputs.
Descriptive statistics of inputs and outputs.
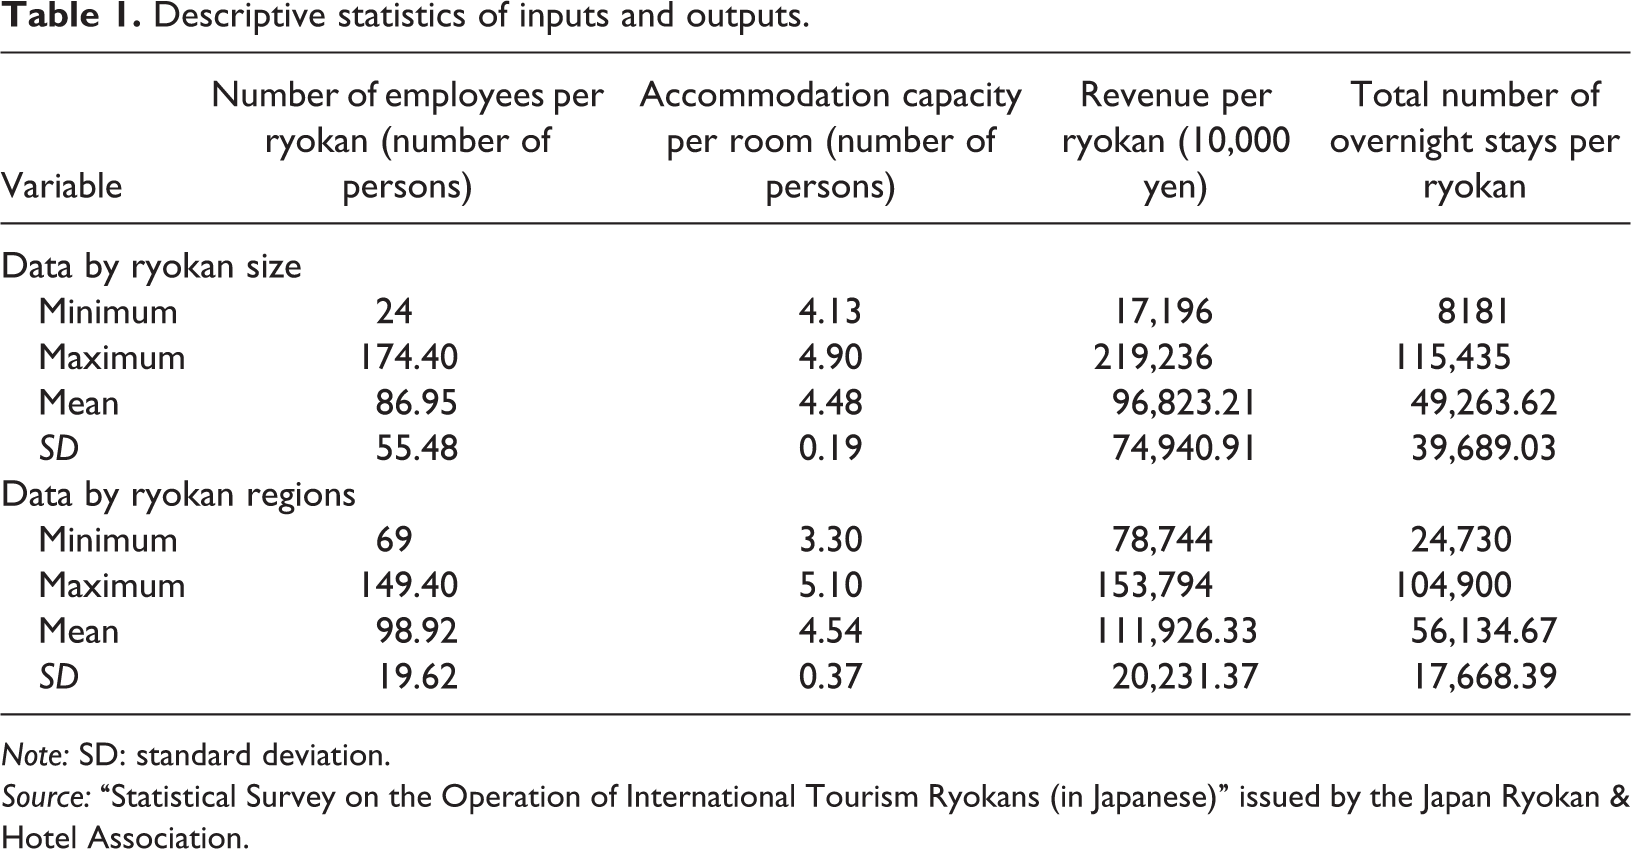
Note: SD: standard deviation.
Source: “Statistical Survey on the Operation of International Tourism Ryokans (in Japanese)” issued by the Japan Ryokan & Hotel Association.
The hypothesis for the empirical evaluation is based on the information on ryokans given in the previous section. Larger ryokans would be able to carry out a more efficient business due to more affordable resource management than smaller ones. The effects of size on tourism and hospitality performance were studied previously by Barros (2005) and Assaf et al. (2012). Furthermore, differences in regional efficiency will be clarified through the empirical evaluation below due to no available information beforehand on regional differences. Regional differences in terms of performance were studied by Botti et al. (2009) and Barros et al. (2011). In this study, we mix the last two points by analyzing whether scale differences are linked to regional differences.
Then the research assumptions analyzed in this study are H1: Large ryokans are more efficient than small ryokans. H2: Regional efficiency is linked to the scale of ryokans.
Results
Scale analysis
Figure 3 shows the mean efficiency scores for the ryokans according to scale for the time period of 2005–2012. Results clearly showed that large-scale ryokans were more efficient throughout the period than mid- and small-scale ones as indicated by the much higher scores for the large operations than the smaller ones.
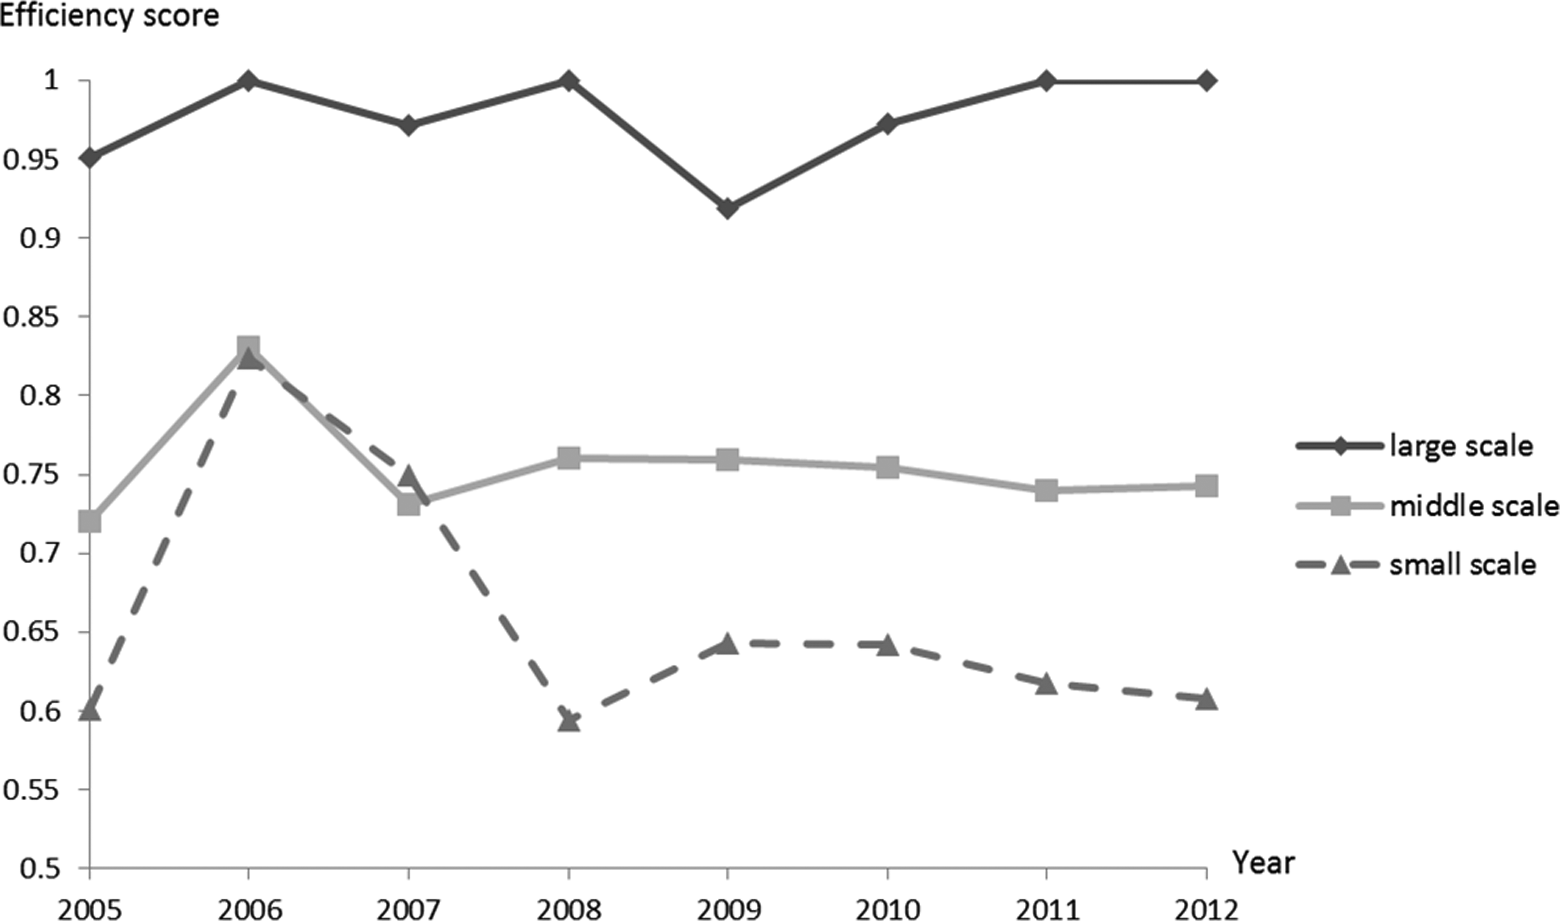
Mean efficiency scores of ryokans according to scale.
Thus, first, it can be stated that large-scale ryokans are relatively more efficient than mid- and small-scale ryokans.
Second, it is considered that the outcome of the so-called “global financial crisis of 2007–2008” was the sharpest drop in the efficiency score of the small-scale ryokans among the three categories between 2006 and 2008; this score remained at or near its lowest level since that time. The gap in managerial capability that existed among the ryokan scales is considered to be a cause of the significant decrease in efficiency of small-scale ryokans through decreases in the total revenue and the number of overnight stays, which are the numerators of the efficiency score. Thus, once such decreases occurred, it was difficult to recover. Small-scale ryokans were less resistant to an unexpected economic shock due to the insufficient capability of operators to cope with such events.
Third, although the impact of the 2011 disaster due to the earthquake and tsunami seems not significant among the large- and mid-scale ryokans over the period studied, the scores of the small-scale ryokans had decreased slightly since then. The lack of impact on the large- and mid-scale ryokans can most likely be explained by the restoration public projects started after that disaster, which created a heavy demand for accommodations for workers who were involved in these projects in disaster-hit areas. This demand compensated for the drop in demand by ordinary tourists caused by the disaster. Due to the heavy damage in the infrastructure in hard-hit areas, this demand has continued. Larger-scale ryokans tended to have greater advantages regarding accommodation capability than smaller ones because of the large groups of workers involved in the restoration projects. This unbalanced increase in demand among ryokan scales caused an unbalanced increase in outputs, which were the total revenue and the number of overnight stays in this study, which are the numerators of the efficiency score in comparison with stable inputs, which are the denominators.
Thus, we can say that the efficiency scores showed different patterns of changes among scales of ryokans and that small-scale ryokans tended to be left behind after both the economic shock and natural disaster, which supports hypothesis H1.
Regional analysis
Table 2 shows the mean efficiency scores of the ryokans for the nine administrative regions. Hokkaido is the best region of the sample in terms of efficiency and can be considered as a benchmark for Japanese ryokan sectors. This region has several tourism attractions that can explain this finding. Examples are its natural beauty, famous seafood and farm products, and a subarctic climate that attracts skiers and holidaymakers escaping from the summer heat.
Mean efficiency scores of ryokans by region.
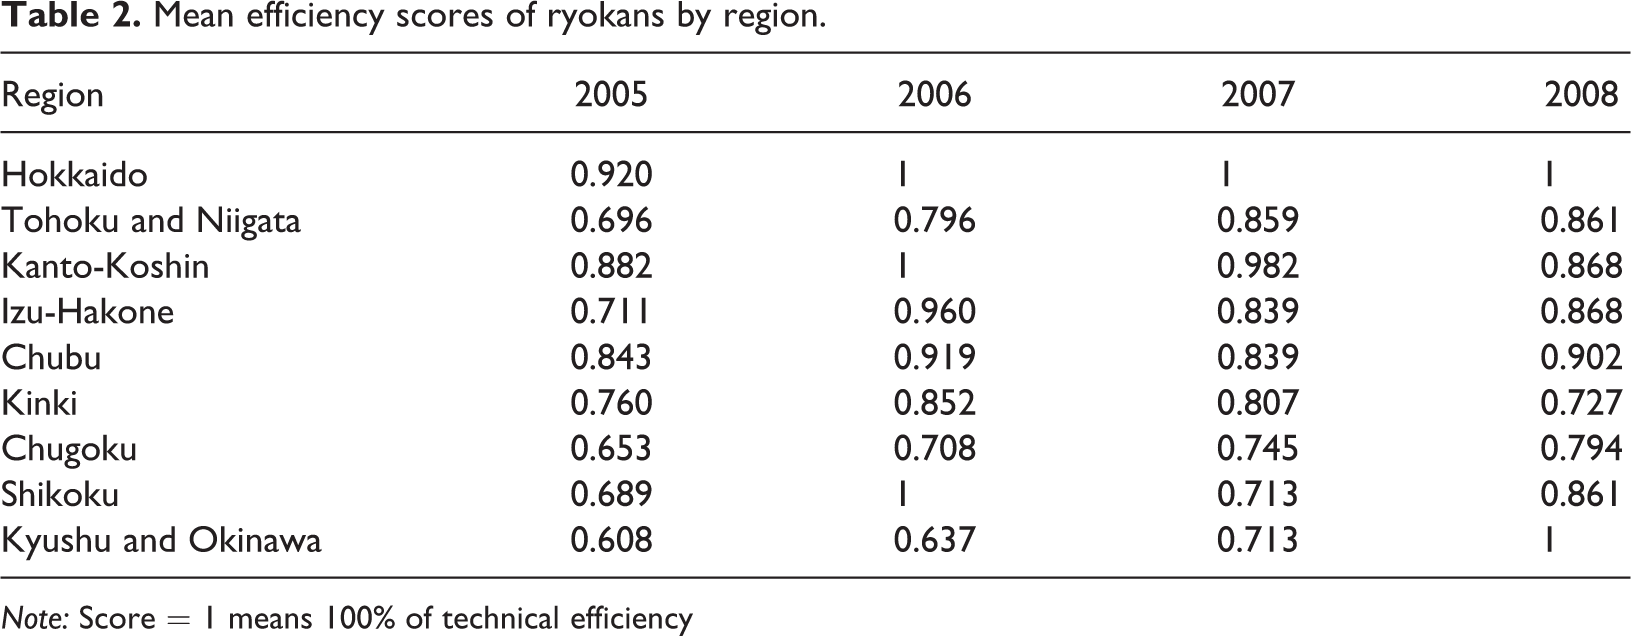
Note: Score = 1 means 100% of technical efficiency
Detailed results of the Window DEA analysis are reported in Tables S1, S2, and S3 (see Online Appendix). Results in rows show the relative efficiency score of each region. Results in columns, for a given unit, show the stability of efficiency scores. In our case, the results are relatively stable and few misreports of data or computational errors are observed as in previous studies (Pulina et al., 2010).
Regarding the decomposition of technical efficiency (TE) into pure technical efficiency (PTE) and SCE, the results are mixed. Four groups can be identified. In the first group, we find that Hokkaido, which is on average the benchmark region of our sample, has a mean TE score close to 1. In the second group, we find regions where technical inefficiency is due to both pure technical inefficiency and scale effects; this is the case for Izu-Hakone and Kyushu and Okinawa. In the third group, we identify regions that experienced mainly a problem of PTE (Tohoku and Niigata, Chubu, Kinki, Chugoku and Shikoku). Finally, the last group is constituted by Kanto-Koshin, a region where the technical inefficiency is entirely explained by scale inefficiency, that is, a problem of size.
The aforementioned results are confirmed by the distribution of ryokans according to their size and region. Indeed, Hokkaido, which is the best performing region in our sample, contains a high proportion of large ryokans. To explore the reason why Hokkaido was most efficient among regions, we compared the number of rooms per ryokan and percentage of tourists from abroad between Hokkaido and other regions. Table 3 shows the results, which tell us that Hokkaido had a far greater number of rooms than other regions with 1% significance: 164.2 rooms in Hokkaido and 76.9 in the other regions. Hokkaido also had the highest percentage of tourists from abroad with 1% significance: 7.4% in Hokkaido and 2.1% in other regions. These two factors were correlated: 0.8076 with 1% significance. These results strongly suggest that the higher efficiency in Hokkaido can be attributed to its advantage in having larger ryokans than in other regions, and this advantage was reinforced by the higher percentage of foreign tourists in addition to the conventional domestic market, which means that ryokans in Hokkaido had wider demand components that eventually led to more efficient operations. This is because the inbound demand for Hokkaido will improve the efficiency score through an increase in outputs, that is, total revenue and the number of overnight stays, in comparison with inputs. In short, regional differences in efficiency are attributed to size differences. The larger the operation is, the greater would be the possibility of flexibility in adapting to changes in circumstances. The gap in managerial capability existing between large and small ryokans was most likely the reason for differences in efficiency due to the inability of small ryokans to cope flexibly with fluctuations in the business environment to maintain or increase outputs. This eventually led to the lower efficiency score than that of larger scale accommodations and confirms hypothesis H2.
Differences between Hokkaido and other regions.
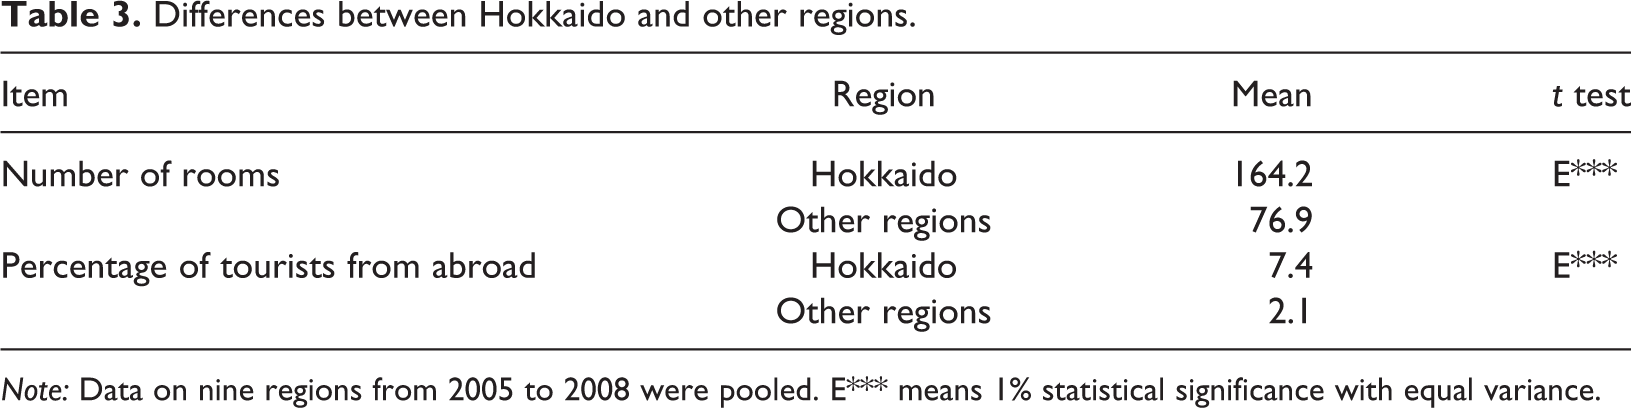
Note: Data on nine regions from 2005 to 2008 were pooled. E*** means 1% statistical significance with equal variance.
From the 2007 data, it can be observed that the level of TE decreased for five regions (Kanto-Koshin, Izu-Hakone, Chubu, Kinki, and Shikoku) compared to 2006. More precisely, the regions affected are located in the central and eastern part of the country. This trend could be attributed to the aforementioned financial crisis, which started during the year 2007. However, this finding must be considered carefully because this trend persisted in 2008 only for the Kinki region. Moreover, the zoning change in the administrative regions that started in 2009 did not permit confirmation of this analysis from available ryokan data. This is a data constraint caused by the data surveyor, the Japan Ryokan & Hotel Association, a factor for which we could not control.
Conclusion, discussion, and implication
Efficiency and productivity analysis are a growing field in applied tourism research. The literature on this topic reveals many empirical contributions applied to different destinations in the world. At the sector level, hospitality performance is one of the key elements of tourism performance. Although the ryokan is one of the oldest accommodation services in Japan and perhaps in the world, there has been no empirical quantitative evaluation of the efficiency of ryokans. This empirical contribution intends to reduce this gap in the literature. On the one hand, the results of efficiency evaluation by a Window DEA revealed that larger ryokans were more efficient than smaller ones. These findings are consistent with previous case-study contributions in the literature such as by Kiriyama (2008) and the Ministry of Welfare and Labor (2014). Our study provided clear quantitative information showing the inability of small ryokan operators to effectively cope with fluctuations in the business environment with a quantitative nationwide scope. Also, this contribution enlarges the literature about tourism efficiency with regional comparisons and underlines the impact of size on regional performance.
Recommendations to policy makers are as follows. Support measures should be provided to enhance the managerial capability of operators of small-size ryokans to narrow the efficiency gap that this study found to be widening between categories of facilities according to size. In this context, it is important to develop modern efficient and attractive hospitality services that can be specifically provided by small ryokans based on the traditional ways, which could be appealing not only to domestic tourists but also to tourists from abroad. Points that should be taken into account are that small ryokans need service innovations that are applicable to multiple market segments and that support measures for capability building among operators of small ryokans should be provided.
This first empirical contribution on Japanese tourism and hospitality performance opens new paths for future research. First, mainly due to data constraints, the limitations of this study are that micro-level data evaluation was not possible, and this contribution is limited to the analysis through size and regional levels. Second, comparative analysis with hotels was not conducted, and it should be very interesting to implement it in order to compare Western and traditional Japanese hospitality. Third, how Omotenashi, that is, Japanese hospitality, is connected to ryokan efficiency was not analyzed. These studies are next on our research agenda.
Footnotes
Acknowledgement
We thank Dr Stephen Wanhill, the participants in the Fifth IATE conference (Hong Kong) and two anonymous referees for helpful comments.
Declaration of conflicting interests
The author(s) declared no potential conflicts of interest with respect to the research, authorship, and/or publication of this article.
Funding
The author(s) disclosed receipt of the following financial support for the research, authorship, and/or publication of this article: This study was funded by Fondation Franco-Japonaise Sasakawa and Grant-in-Aid for Scientific Research No. 26283017, No. 25450342 and No. 16K14996, Japan Society for the Promotion of Science (JSPS).