
Abstract
This research note presents two measures of intra-party democracy (IPD) used on a global scale. We distinguish between assembly-based and plebiscitary IPD which represent two distinct logics of intra-party decision-making. The instrument was developed in the context of the first round of the Political Party Database Project (PPDB) covering 146 parties in 25 countries. It is now applied for the first time to parties in countries on all continents. We cover 274 parties from the second round of the PPDB in 51 countries, which provides us with a unique opportunity to assess the applicability and validity of this measure and compare it over time. Our results show that the expected stability of IPD values go together with plausible change over time. This opens up the potential to trace changes of IPD in detail and to investigate possible reasons for these changes. Furthermore, the new data are ideally suited to be applied in different institutional and cultural contexts.
Introduction
This research note presents two measures of intra-party democracy (IPD) used on a global scale. Initially, the instruments were developed in the context of the first round of the Political Party Database Project (PPDB), which collected data on the ‘official story’ from party documents (Katz and Mair, 1992; Poguntke et al., 2016; Scarrow et al., 2017). It covered 146 parties in 25 countries (von dem Berge and Poguntke, 2017). It is now applied for the first time to parties in countries on all continents. We cover 274 parties in 51 countries 1 , which provides us with a unique opportunity to assess the applicability and validity of this measure. We present the IPD from the second round of the PPDB (R2, reference years 2017-2019, Scarrow et al., 2022), compare it with round one (R1, reference years 2011-2016, Poguntke et al., 2020) and present a number of indicators which demonstrate the applicability of the IPD indices across a large universe of parties and over time. 2
By incorporating data from less institutionalized democracies in Africa, Latin America, and Central and Eastern Europe, this data may offer insights why democracies consolidate or why they do not (Debrah, 2014). Its longitudinal nature also allows us to observe the dynamics of intra-party democracy, including its effects on party unity (Close et al., 2019), party responsiveness (Lehrer, 2012), or trust in political parties (Shomer et al., 2018).
In recent years, the way parties organize themselves internally has gained renewed relevance because membership decline (Van Biezen et al., 2012) has confronted parties with the need to re-consider the way their own membership organization provides democratic linkage between rulers and ruled. It has been argued that parties are losing their central role as linkage agents (Mair, 2013). In response, many parties have strengthened measures for intra-party participation to attract members (Achury et al., 2020; Cross and Katz, 2013; Ignazi, 2020), sparking scholarly attention. The influence of IPD on the structures, actors and behaviour of parties has been investigated (Close et al., 2017; Cross and Katz, 2013; Koo, 2020). Furthermore, studies analysed how IPD influences party competition (Lehrer et al., 2017), the responsiveness of parties (Lehrer, 2012) and satisfaction with democracy (Shomer et al., 2016; Webb et al., 2022). Moreover, intra-party democracy features in the literature on democratic consolidation. Okafor et al. (2020) find that IPD is crucial in explaining the difference in quality of democracy between Ghana and Nigeria. Likewise, Bwalya and Sichone (2022) and Debrah (2014) conclude that political parties in Zambia and Ghana need more intra-party democracy to facilitate democratization.
This brief overview demonstrates the relevance of intra-party democracy. Yet, the available data has been limited so far. As a result, many studies resorted to selected party or single country studies (Close et al., 2017; Koo, 2020; Shomer et al., 2016). Especially for younger democracies there is a lack of data, which hinders important comparative research on how to strengthen democracy (Bwalya and Sichone, 2022; Okafor et al., 2020). The comparative perspective presented by this research note is important to identify differences and similarities across parties, countries, or regional contexts and to gain insights into the general dynamics of IPD. Above all, only comparative data can avoid the pitfall of the attention bias that is usually generated by conspicuous cases.
Concept, data and operationalization
It is a widespread tenet that giving ordinary party members a direct vote in important party affairs equals an increase in intra-party democracy because it expands the number of decision-makers. It is frequently overlooked, however, that this changes, in the first instance, the inherent logic of decision-making. von dem Berge and Poguntke (2017) account for this by proposing two distinct conceptualizations of IPD, an assembly-based (AIPD) and a plebiscitary variant (PIPD). While the former denotes intra-party decision-making which is done by party arenas where the members of these bodies can discuss and amend the matter of the decision at stake, the latter refers to plebiscitary modes of decision-making where all members (or even party supporters) have a direct say over a certain matter. 3 Importantly, those who decide cannot change the matter of the decision – discussion and decision are separated. In a nutshell, we conceptualize IPD to depend on the degree of inclusiveness of decision-making but we distinguish between two different dimensions, namely an assembly-based and a plebiscitary mode. There are other conceptualizations of IPD which are based on multiple dimensions including centralization, accountability and the degree of participation (e.g. Scarrow, 2005; Cross and Katz, 2013; Rahat and Shapira, 2017; Ignazi, 2020), but we maintain that inclusiveness is the most important one, because the other dimensions are derived from it (von dem Berge and Poguntke, 2017: 139). 4 As all organizations logically need a minimum of collective bodies to be run, we expect that parties will, save extreme exceptions, have a certain level of assembly-based decision-making. They can, however, be run without any plebiscitary elements. Whether or not plebiscitary decision-making enhances democracy is a normative debate: supporters of representative democracy often disagree, while advocates of participatory democracy are more likely to agree (Katz, 2013).
The measurement of both AIPD and PIPD rest on the inclusiveness of intra-party decision-making. Each represents a formative index made up of three components (von dem Berge and Poguntke, 2017: 138; Coltman et al., 2008). The first component, ‘decision-making: programme’, measures the inclusiveness of drafting party manifestos. The second, ‘decision-making: personnel’ captures the inclusiveness of leadership and candidate selection processes, ‘organizational structure’, assesses how power is distributed within the party (von dem Berge and Poguntke, 2017: 142–143). Each component was operationalized through suitable variables from the PPDB data set which tapped into different aspects of the inclusiveness of intra-party decision-making. For example, the AIPD’s organizational component consists of four variables derived from the PPDB. One of them, Congress Voting Rights, measures who may vote at the party congress—from all members (most inclusive) to only regional delegates (least inclusive). The complete index construction is documented in Appendixes A.2.1 and A.2.2. We included all PPDB parties and countries with sufficient data, excluding Australia and Israel from the regional comparison. The complete case selection is detailed in Appendix A.1.
The calculation of IPD values using the second round of PPDB data largely follows the method from the first round, with minor adjustments due to changes in the data collection protocol (see for more detail on R1 von dem Berge and Poguntke, 2016). Most of the changes are due to the transformation of the open questions measuring the influence of different party bodies on candidate and party leader selection into closed questions. This is likely to improve the reliability of the index. All relevant changes and a coding example can be reviewed in the Appendix (A.2). It is important to note that we will work with different subsamples during the following sections. For the comparison across space, we will use the full R2 data, which includes 274 observations for the AIPD and 247 for the PIPD. The values for all parties are reported in Appendix A.1. However, for longitudinal comparisons we are limited to the smaller subset of parties included in the first PPDB round.
IPD across space: Descriptive statistics in comparison
In the following section we present a short descriptive overview of our IPD indices for round two focusing on regional differences. Above all, we want to investigate whether our concepts and its measures travel well to other regional contexts like Central Eastern Europe, Latin America, or Africa.
Parties in democracies face universal challenges in solving problems of coordination, representation and decision-making, not least because they work under similar institutional conditions (the differences between parliamentary and presidential democracies notwithstanding). It is hence reasonable to expect a high degree of functional similarity across parties and regions (Poguntke, 1998), which implies similar distributions of our index values across different regions. Another corroboration of the universal applicability of our measure would be a largely similar distribution of missing values across different regions, which would indicate that the variables work equally across space. Finally, as it is highly improbable for parties to be categorized as either fully democratic or entirely autocratic, we expect AIPD values to resemble a normal distribution – as was found in round one. PIPD values, on the contrary can be zero for internally democratic parties which simply choose not to use intra-party plebiscites. This leads us to the following expectation: Expectation 1: We expect to find broadly similar distributions of IPD values and missing values across regions.
At the same time, country contexts influence IPD levels due to unique political, institutional, and historical factors. Bolin et al. (2017) found that the variable ‘country’ explained more variance in intra-party democracy (IPD) levels than ideological family. This indicates that IPD levels are also influenced by the political and institutional context of a country, including the level of democracy (Poguntke et al., 2016: 672). In addition, rules on IPD are also subject to the logic of party competition as they send signals concerning the democratic credibility of parties to the electorate. This implies variation between countries and also between regions because organizational contagion is more likely to occur within a single country or region. Furthermore, presidential systems tend to provide for more familiarity with plebiscitary IPD instruments such as primaries compared to parliamentary systems (Poguntke, 2020: 330; Sandri et al., 2015). In sum, we expect to find a high degree of uniformity and a modest degree of variation between countries and regions according to regional political and institutional contexts: Expectation 2: We expect to find modest differences within and between regions, shaped by varying political and institutional context factors.
To scrutinize our expectations, we compare our index values for the following geographical regions (Figure 1) comprising of the following countries
5
: Latin America: Colombia, Peru, Chile, Brazil, Mexico, Ecuador North America: United States of America, Canada Western Europe: Austria, Belgium, Ireland, Spain, Portugal, United Kingdom, Switzerland, France, Denmark, Finland, Germany, Italy, Netherlands, Norway, Greece, Sweden Central and Eastern Europe: Estonia, Latvia, Lithuania, Slovakia, Poland, Bulgaria, Serbia, Romania, Croatia, Czech Republic, Hungary Africa: Botswana, Namibia, South Africa, Tanzania, Uganda, Zambia, Zimbabwe, Kenya, Burkina Faso, Malawi, Nigeria East Asia: Japan, South Korea, Taiwan AIPD descriptive statistics R2 by regions.
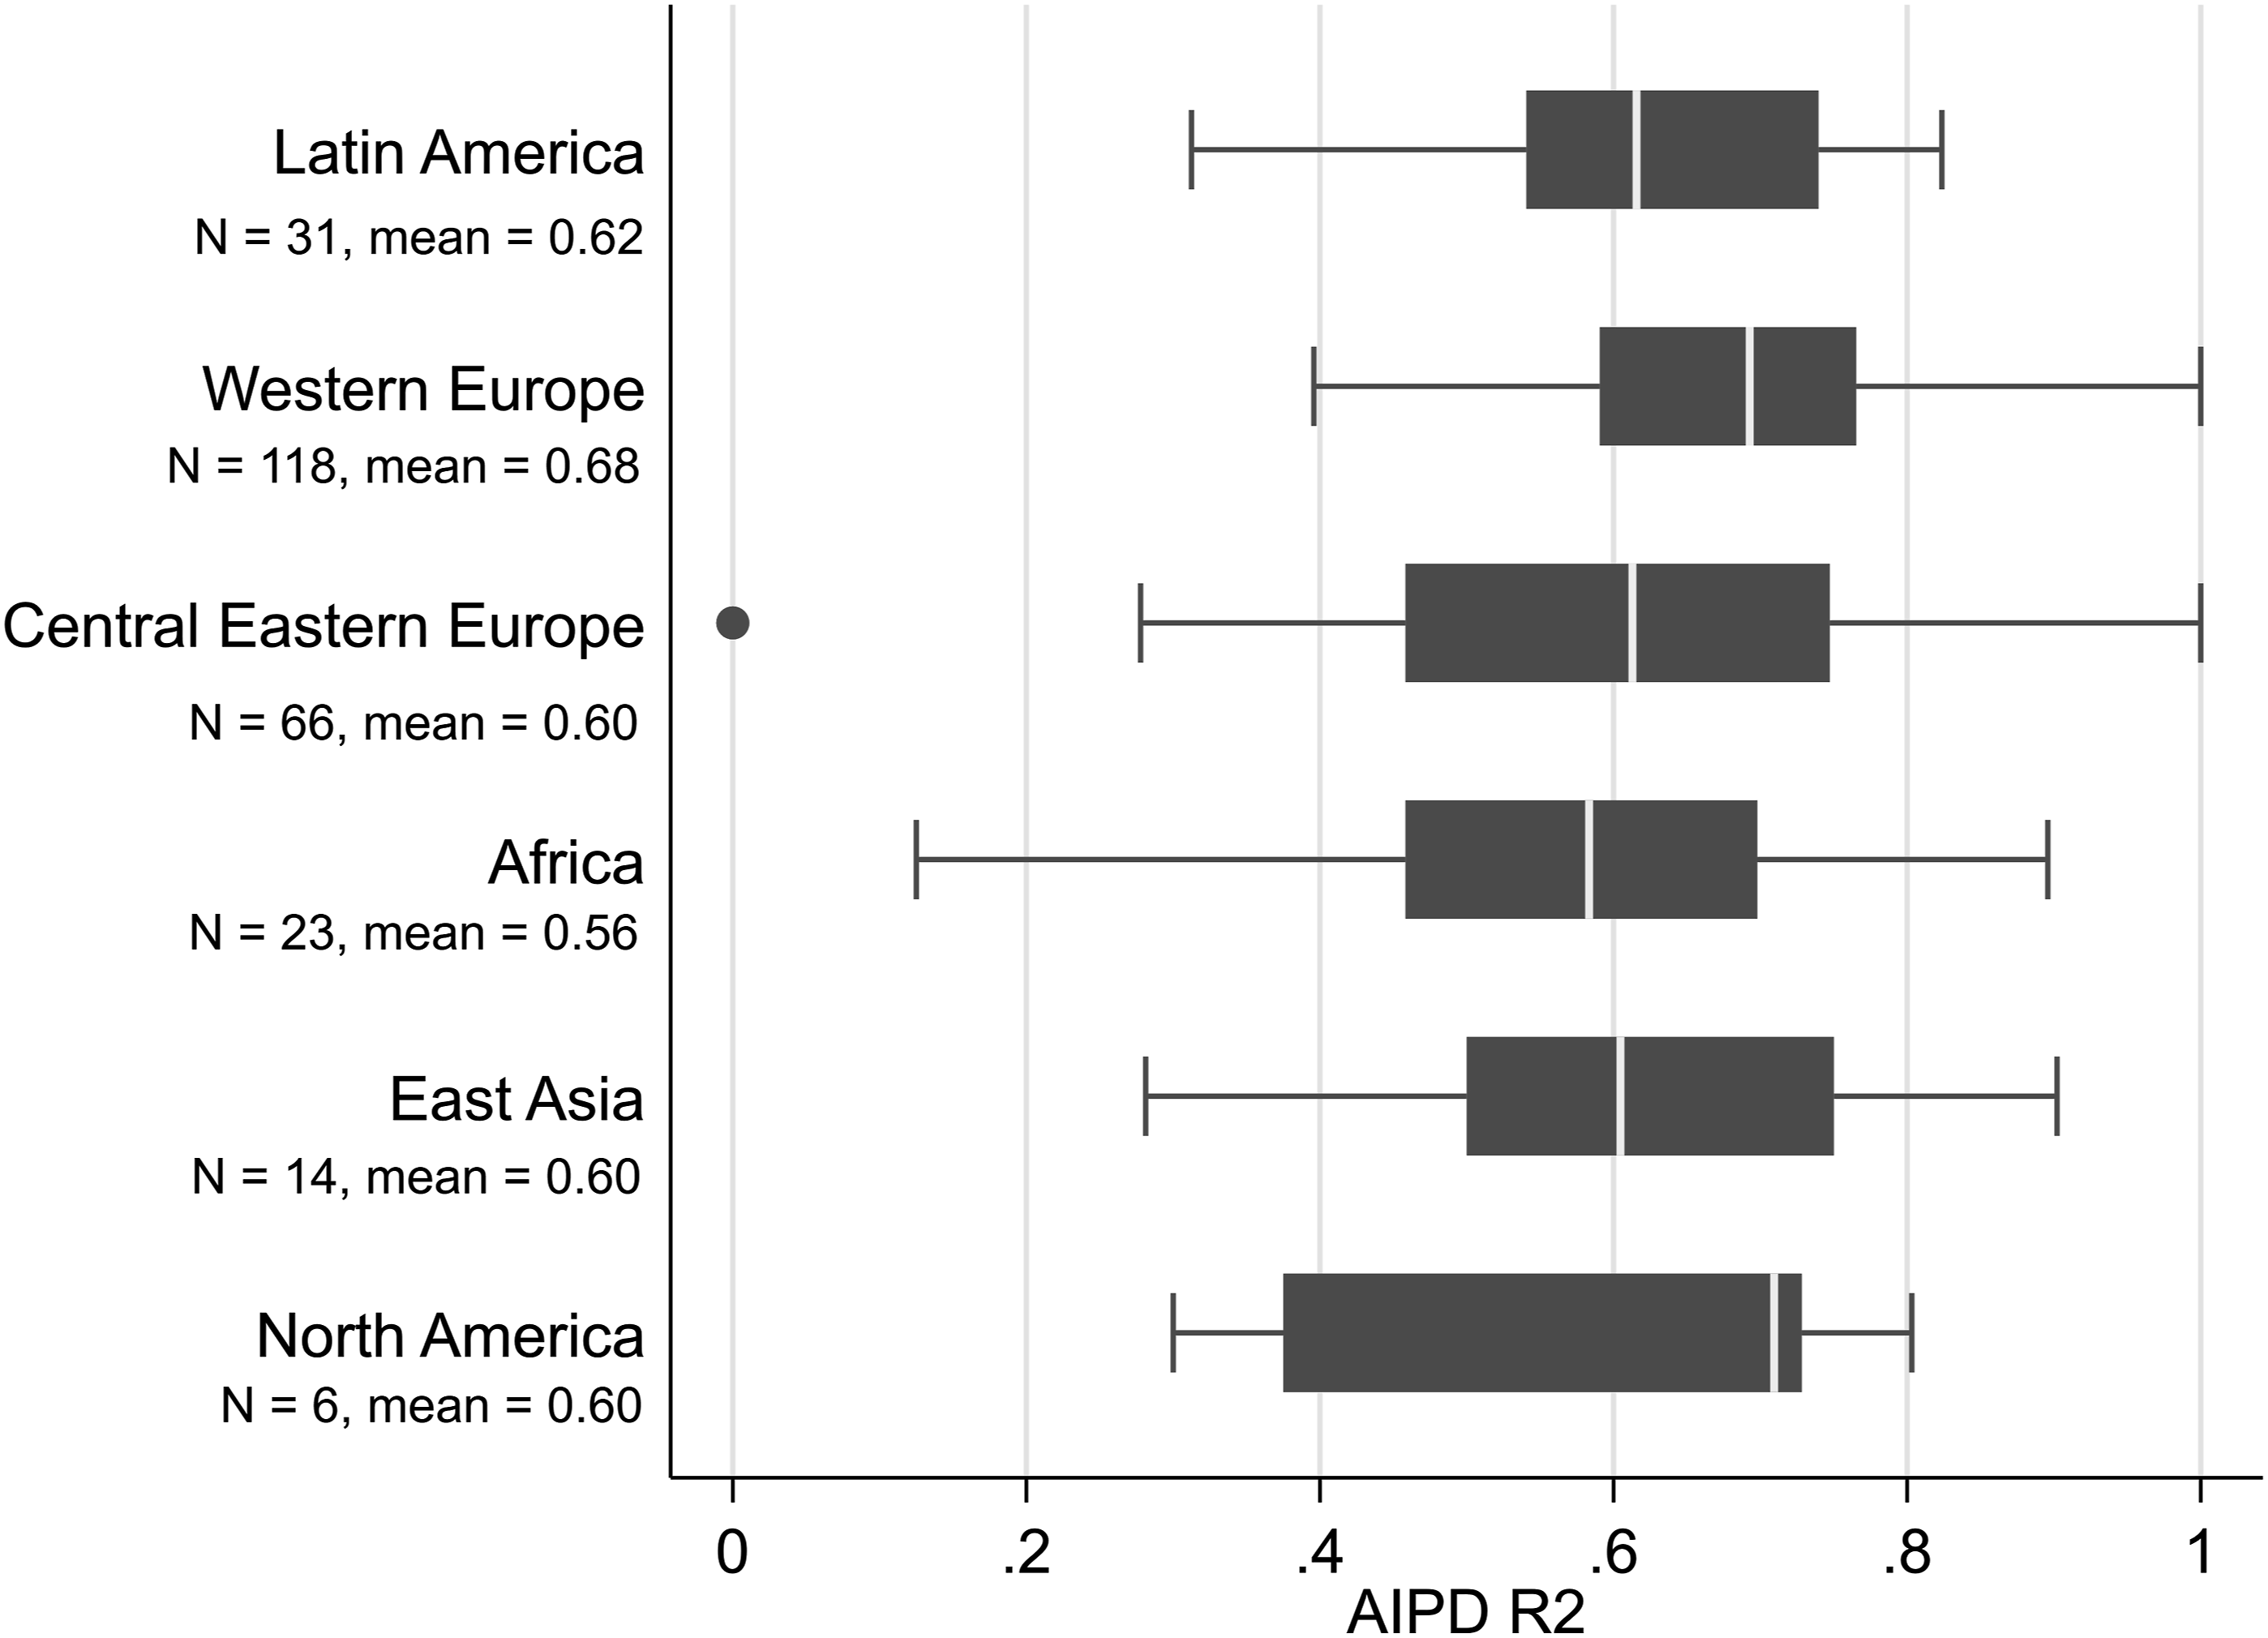
Some regions, particularly North America, cover only a limited number of parties and countries. This makes the results sensitive to outliers, as seen in the stark difference between AIPD scores for U.S. and Canadian parties; it means that they should be taken with a grain of salt. The country selection covers a broad range of different systems ranging from presidential to parliamentary regimes, from less to more democratic states with distinct political cultures. All of these factors may influence the variation and distribution of IPD.
We begin with the AIPD results from round two, which includes 274 parties. The mean AIPD value is 0.63 (SD 0.17), with a median of 0.65. 6 Half of the cases fall between 0.54 and 0.74, forming a bell curve skewed slightly toward higher AIPD values (Figure 3). Western Europe yields the highest mean of 0.68 (SD 0.13), followed by Latin America (mean 0.62, SD 0.13), while North America (mean 0.60, SD 0.21), Central Eastern Europe (mean 0.60, SD 0.19), and East Asia (mean 0.60, SD 0.20) display similar mean values and variance. North America’s high variance results from the difference between US parties (mean 0.34) and Canada, which has a remarkably high value of AIPD (mean 0.74). Africa displays (mean 0.56, SD0.16) the lowest AIPD values in R2. Western Europe dominates R2 regarding the number of observations (118 of 274), while North America only displays six and East Asia 14 cases.
Now we turn to the distribution of missing values. The AIPD index consists of 10 variables derived from 33 PPDB variables, with an average missing value rate of 36.31%. 7 Missing values vary across regions: Western Europe (23.47%), Latin America (27.27%), and Africa (27.39%) have the lowest shares, while East Asia (42.86%) and North America (45%) have the highest. The variance of missing values for eight out of 10 AIPD variables across regions is relatively low, with standard deviations below 22, indicating consistency. However, two variables show higher regional differences: Party Leader Selection Process (Mean 69.54, SD 27.39) and Party Leader Selection Vote (Mean 57.64, SD 30.42). This is mainly due to East Asia and North America which are sensitive to outliers due to their small country samples. Additionally, some countries hold (open) primaries for party leader elections and this is not part of the AIPD index. Overall, the AIPD variables work well in Europe, Latin America, and Africa, and to a lesser extent in North America and East Asia, with some limitations concerning party leader selection.
To summarize, first, our analysis confirms that the distributions of AIPD scores are generally consistent across regions, suggesting that our index effectively captures the logic of intra-party democracy without significant regional biases. Second, the analysis shows a relatively consistent distribution of missing values across most regions, with Western Europe, Latin America and Africa showing lower rates of missing values compared to East Asia and North America (expectation 1). Third, our results confirm that the context influences AIPD levels. The variations in AIPD, such as the lower values in Africa and the variation between the United States and Canada within North America, reflect the modest impact of the political context on intra-party democracy (expectation 2).
The PIPD index for R2 includes 247 observations. Unlike the AIPD index, PIPD is based on fewer variables, resulting in a limited range of discrete values. The mean value is 0.39 (SD = 0.37), the median is 0.33. 8 A large share of parties (37.65%) did not provide for any plebiscitary decision-making methods, while 16.19% employ full plebiscitary decision-making methods. In between are parties with varying degrees of PIPD ranging from 0.25 to 0.75. Again, we do not include Israel and Australia in the graph. Furthermore, we did not include North America, as we do not have PIPD values for the USA.
When comparing regions (Figure 2), Western Europe displays the highest PIPD mean (mean 0.46, SD 0.36), followed by Africa (mean 0.44, SD 0.40) and East Asia (mean 0.41, SD 0.41). A large share of African parties yields the highest PIPD score (26.32 %). Latin America (mean 0.35, SD 0.37) displays moderately high PIPD values. Central and Eastern Europe shows the lowest mean PIPD value (mean 0.26, SD 0.34). PIPD descriptive statistics R2 by regions.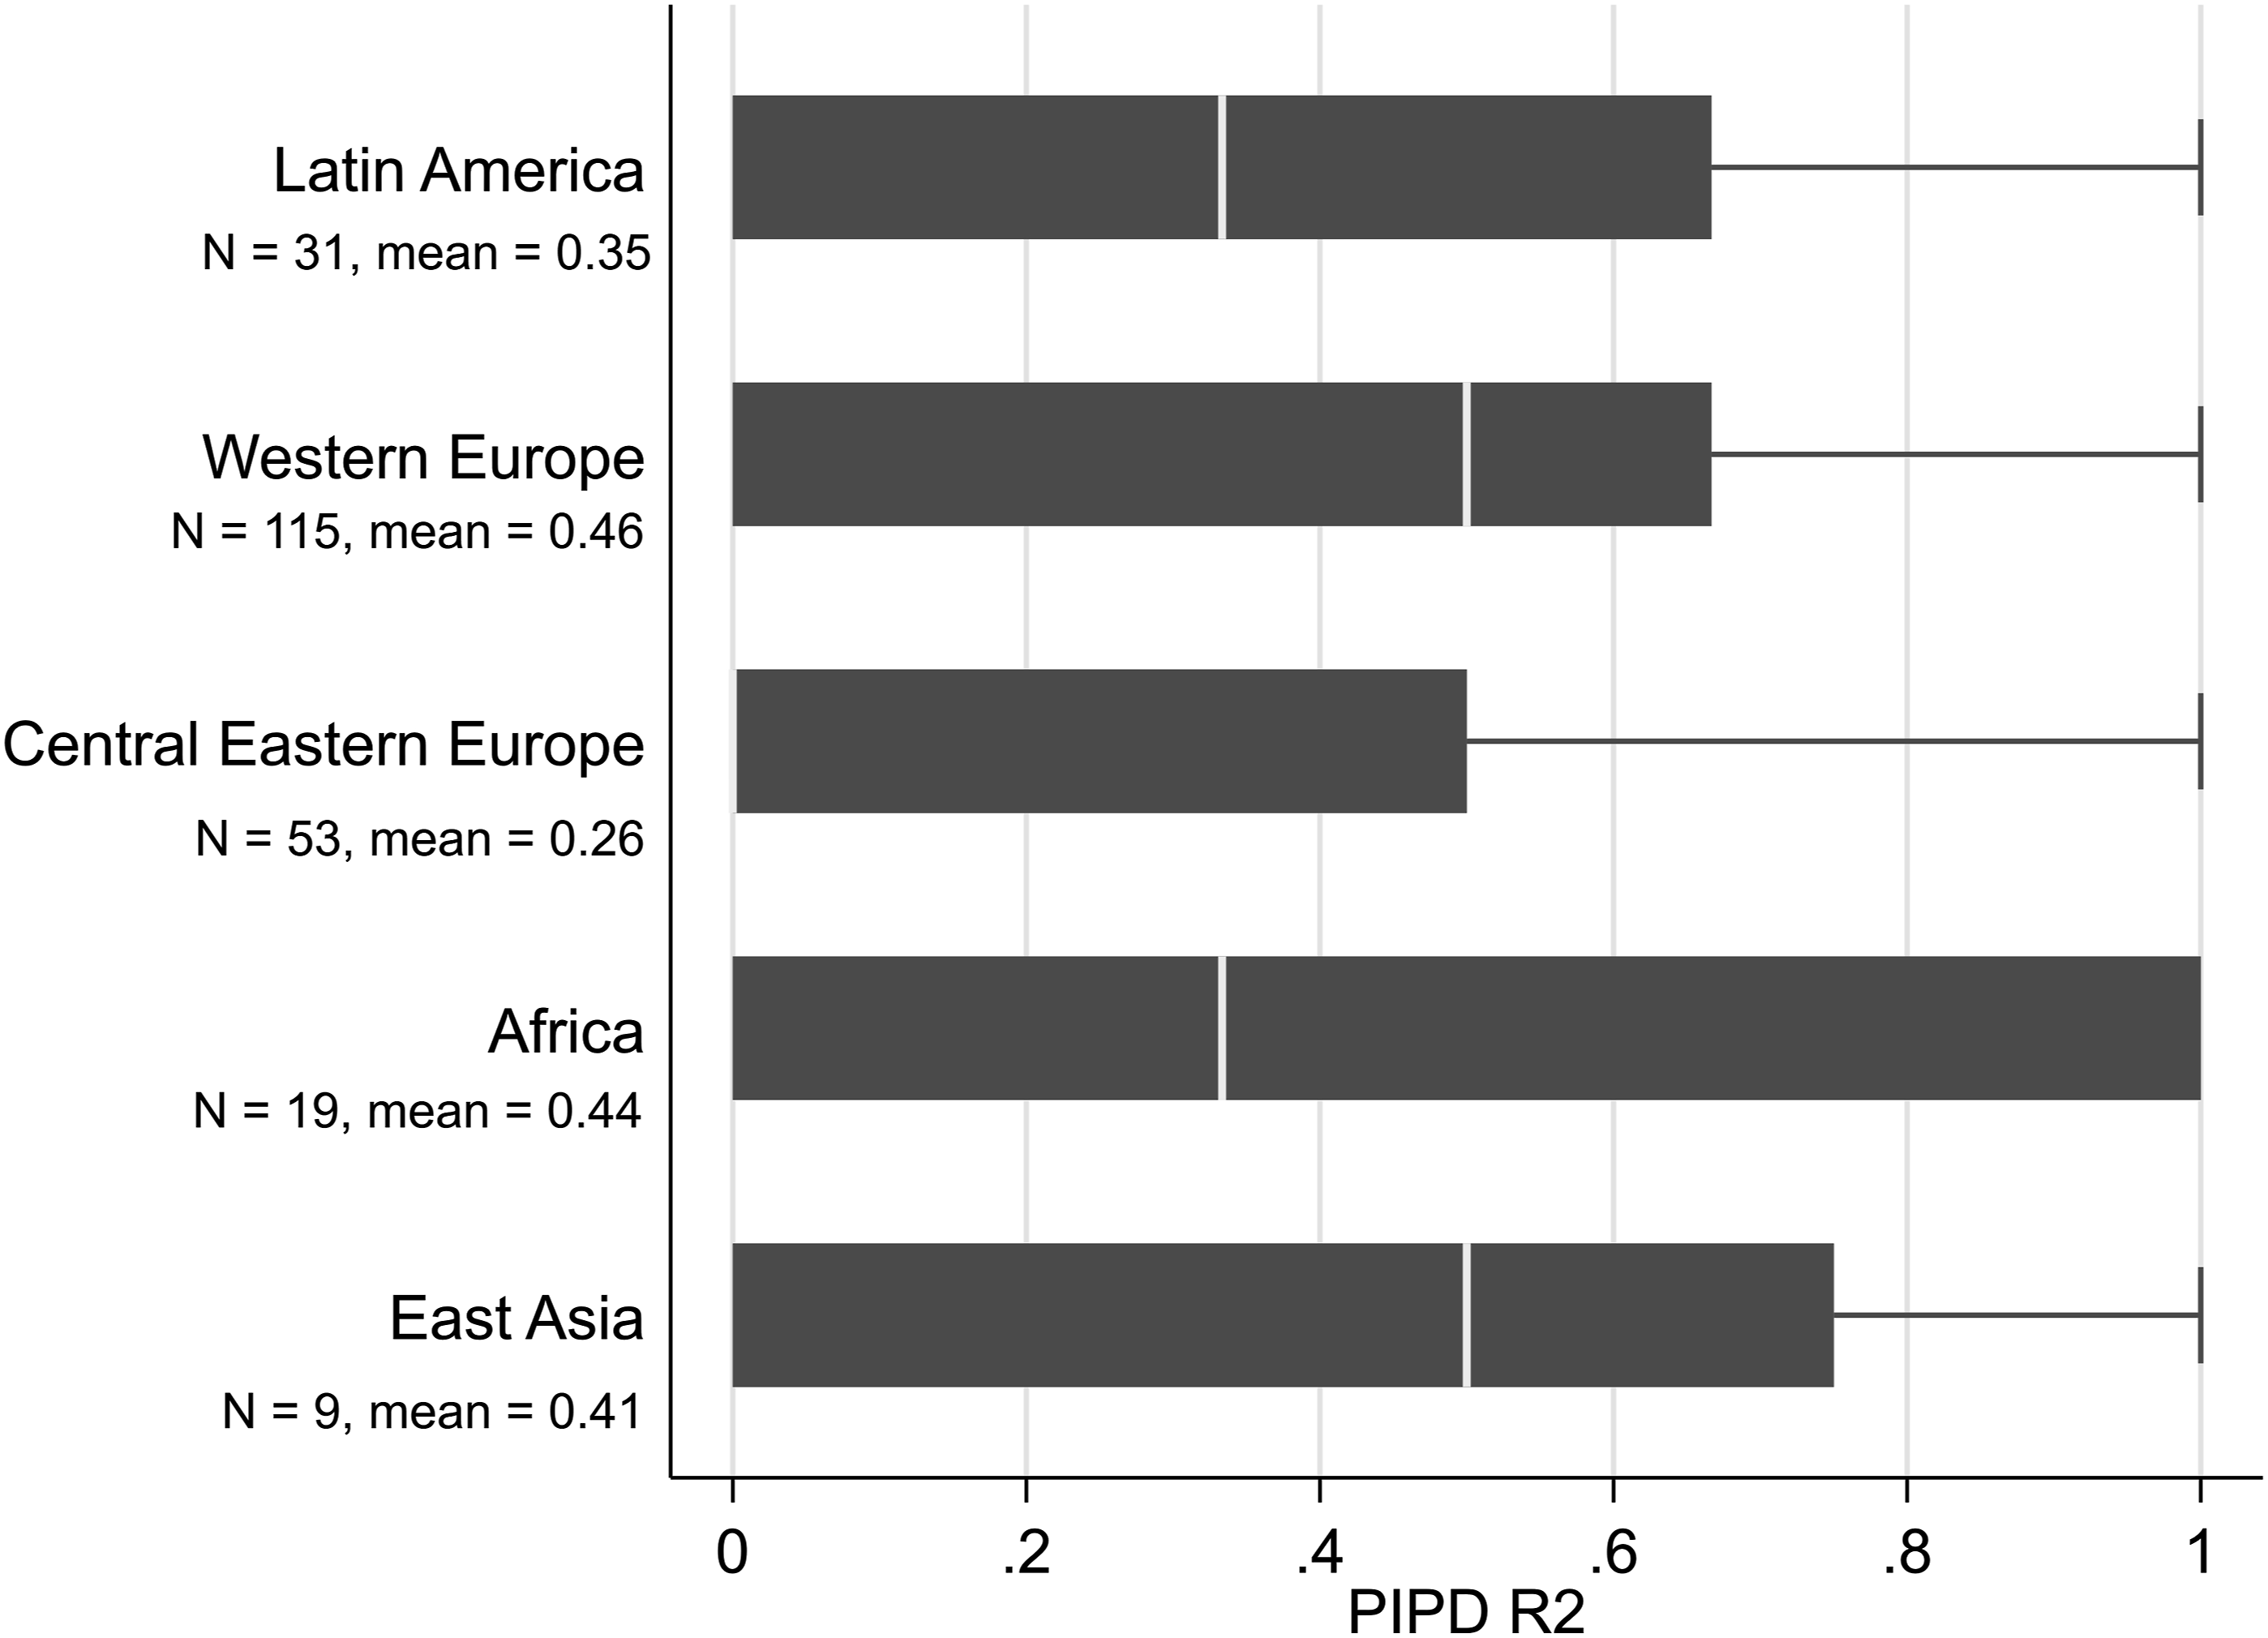
Looking at the distributions of missing values for the four PIPD variables, we see on average a share of missing values of 50.12%. This relatively high share is especially influenced by the Ballot-Vote variable (78.22% missing values), as it is in most countries not specified who is eligible to directly vote on intra-party policy ballots and this was often coded as ‘not provided’.
Again, also the manifesto variable displays a high share of missing values (56.65%). The two other variables display shares of missing values between 32.48% and 34.77%. The distribution of missing variables varies across regions. Africa (55.44%), Central Eastern Europe (58.33%), and East Asia (62.5%) show the highest shares of missing values, while Latin America (40.91%), Western Europe (34.50%), and North America (41.67%) have lower shares. However, only Canadian parties are included, while the two US parties are completely missing. Similarly, we have only data for 35 of 78 parties in Central Eastern Europe.
The variance between regions is similar for all variables (SD around 16); it is the lowest for the Ballot Vote variable (SD 10.44). Thus, we see variance in the distribution of missing values, but, no stark differences between the regions overall.
Summing up, the entire scale of the PIPD is covered in all regions, while we have few parties at the inclusiveness-end of our PIPD scale (except for Africa). We see more variance within regions compared to AIPD but the variance for the PIPD between regions is quite low (expectation 1; see also for similar results in round one, Poguntke et al., 2016). Only CEE deviates from the other regions with a much lower mean value (0.26) of PIPD. The other regions are very similar and our new region Africa fits into the existing pattern. The distribution of missing values varies but remains within a reasonable range across regions. This conforms to the expected the similarity of PIPD distributions and missing value rates across regions (expectation 1), with only minor inter-regional differences (notably in Africa) (expectation 2). Arguably, this reflects a general trend towards more inclusive party leader selectorates (Kenig et al., 2015, see also the next section). Overall, we are confident that our measurement can be used to measure the plebiscitary dimension of IPD under varying contextual conditions.
IPD across time: Similarity
We have established that our measures work well across regions. Another crucial test of the applicability is consistency over time combined with theoretically meaningful change. We turn to this now by comparing the development of IPD between round one and round two. In R2, open-ended questions were replaced with closed ones, improving data reliability. Additionally, many cases lacked data for the programmatic component in R1 but do so in R2, enhancing the measurement quality of AIPD in R2.
We expect modest changes in IPD as parties are conservative organizations which only change under considerable pressure (Harmel and Janda, 1994). Moreover, we cover a relatively short time span which makes much fundamental change unlikely. However, given the overall climate of increasing popularity of IPD instruments, especially towards more direct membership involvement (Cross and Pilet, 2015; Kenig et al., 2015; Poguntke et al., 2017; Poguntke, 2020), valid and reliable IPD measures should yield a moderate increase of IPD values. Expectation 3: We expect to find a moderate increase of IPD values; this should be larger for PIPD than for AIPD
The comparison over time was only calculated for parties included in both rounds, reducing the number to 146 parties (R1) and 274 (R2) to 132 parties represented in both rounds. 9 In R1 the AIPD index suffered from a high share of missing values of the manifesto indicator, meaning that several AIPD values were based on only two instead of three components (von dem Berge and Poguntke, 2017: 149). Thus, we used a simplified version of the AIPD index (without the manifesto component) for this comparison over time. 10
The AIPD mean for the observations included in the comparison in round one was 0.62 (SD 0.15), the median 0.61. In round two the mean is 0.63 (SD 0.15), the median is 0.63. These values indicate a slight increase of assembly-based intra-party democracy for parties represented in both rounds. Figure 3 shows that the distribution has not changed significantly between round one and round two. Furthermore, the values broadly resemble, as expected, a normal distribution. We also calculated mean absolute differences of IPD values between R1 and R2. The higher the value of this difference, the higher is the change between both rounds. For AIPD, the mean difference is 0.14 (SD 0.13).
11
Distribution of AIPD values for parties included in R 1 & 2.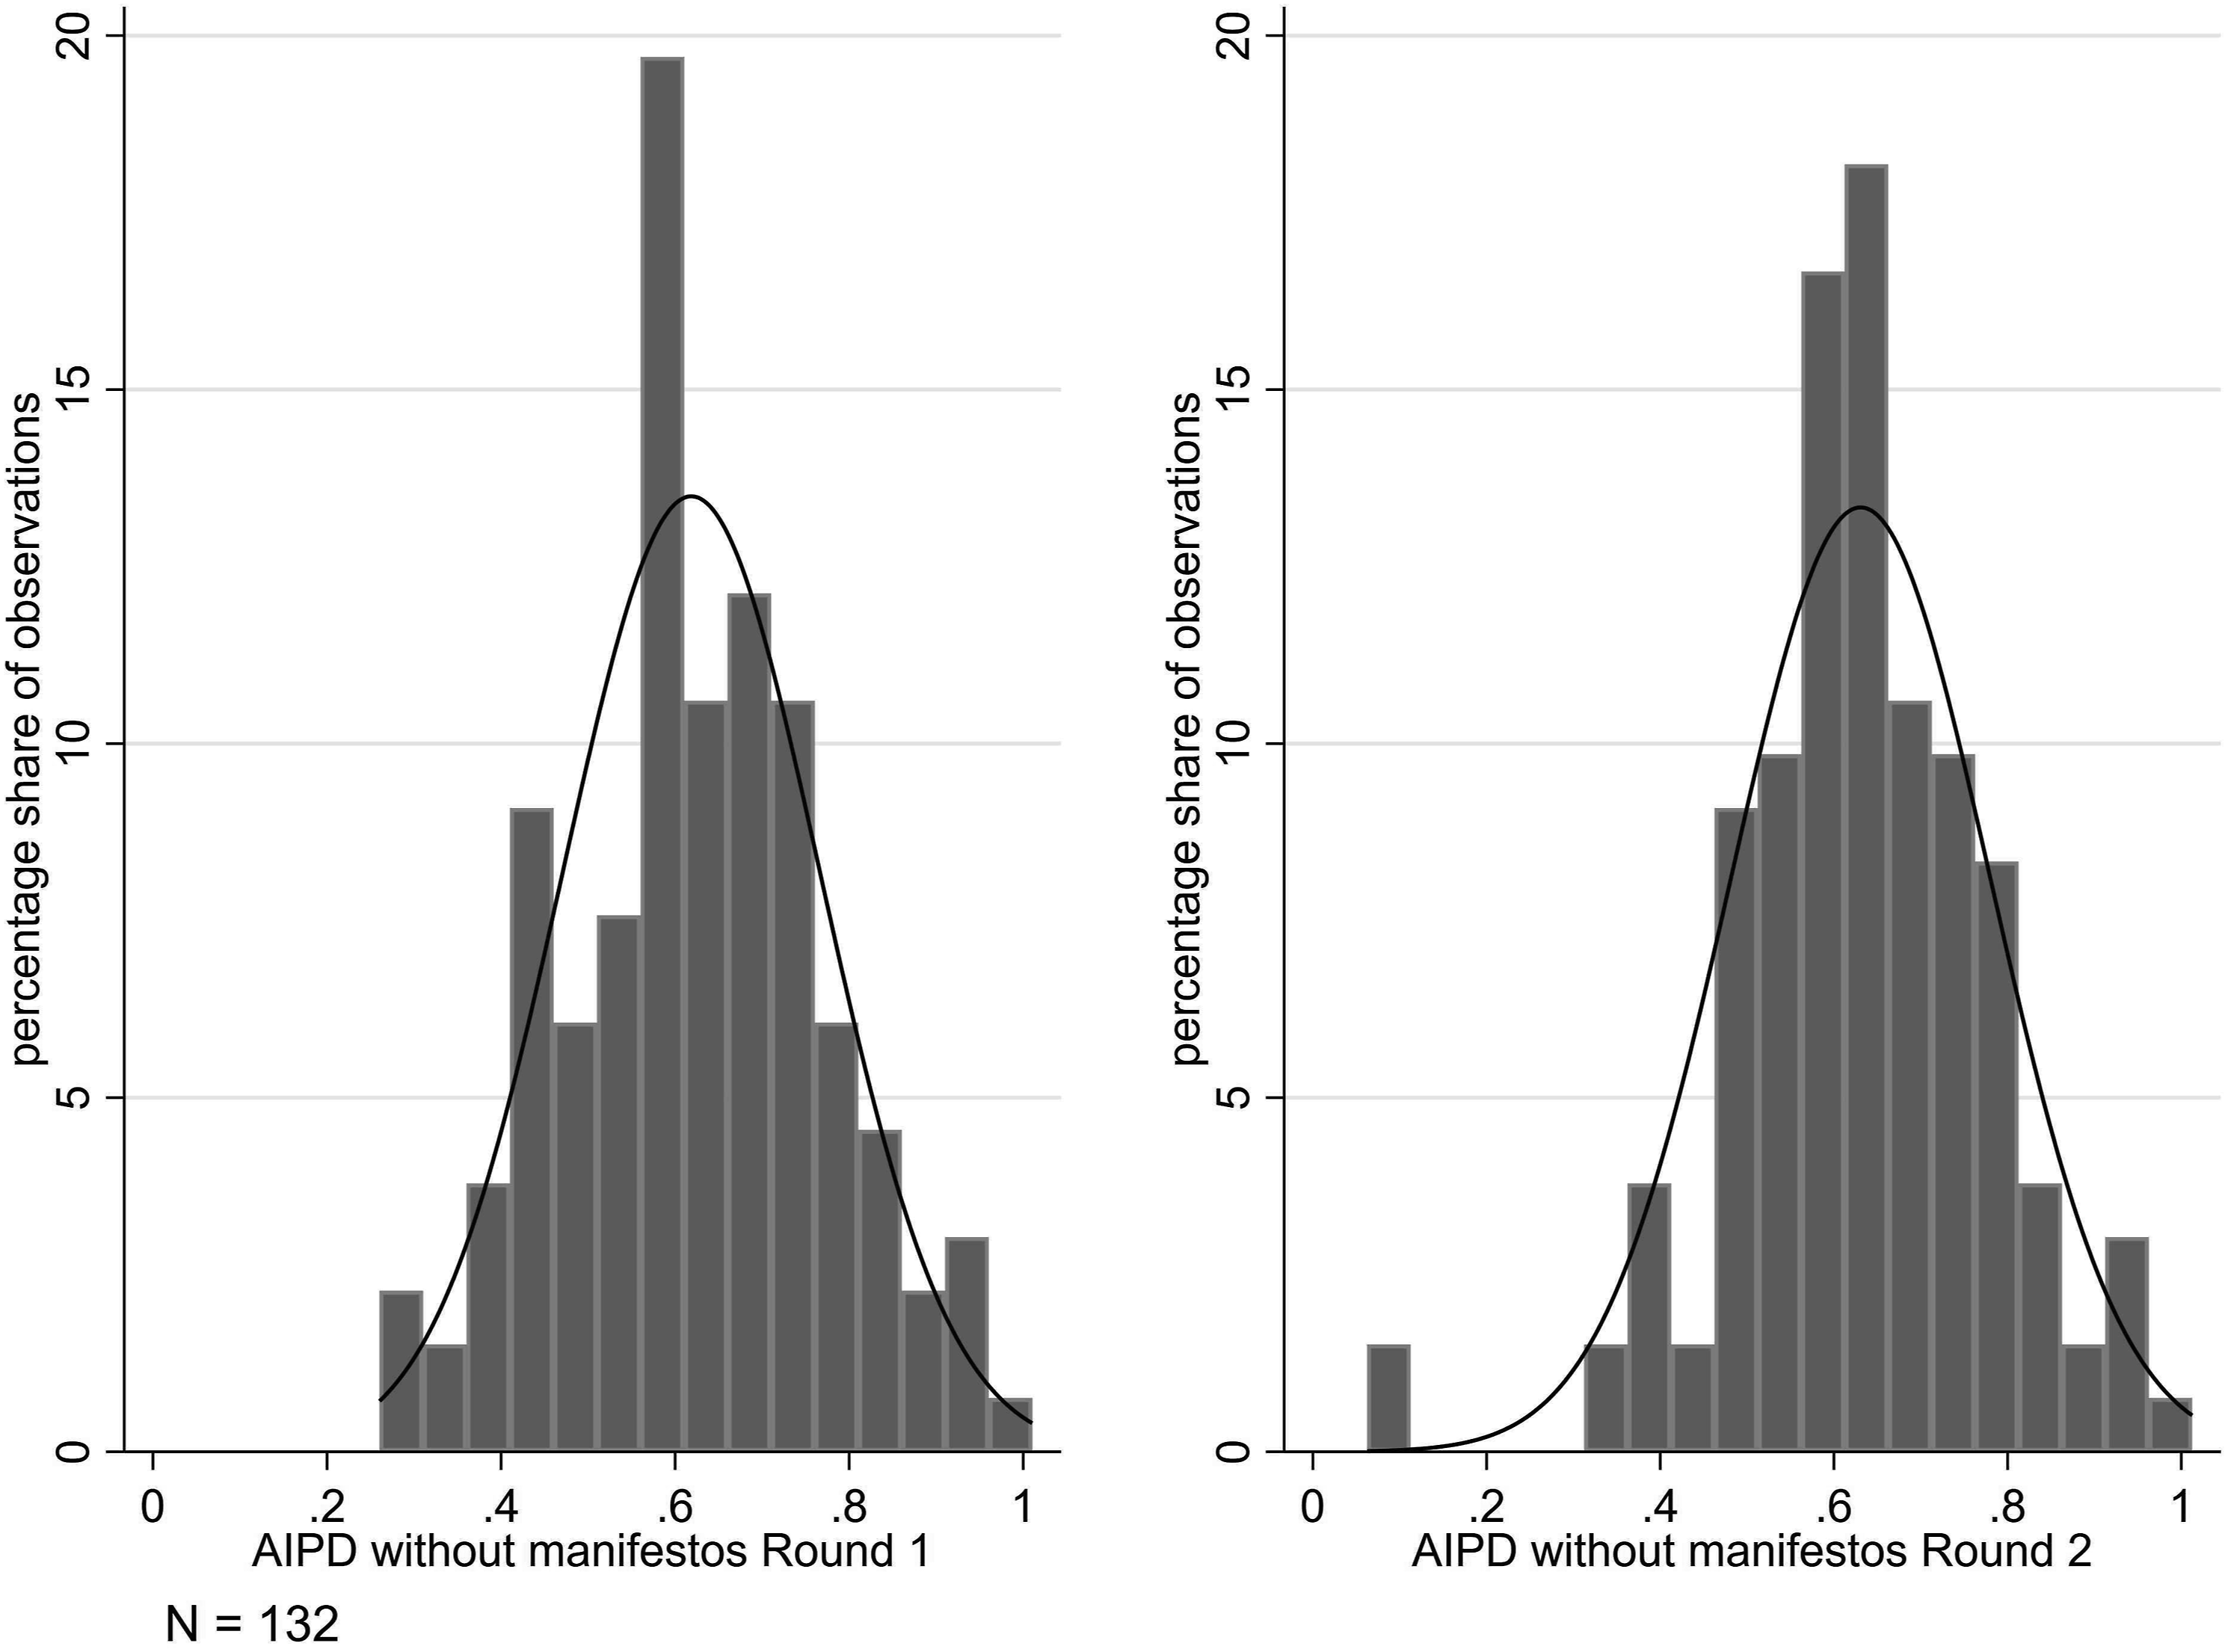
For PIPD 124 observations were compared, showing and increase in the mean value from 0.34 (SD 0.33, median 0.30) in R1 to, 0.45 in R2 (SD 0.36, median 0.5). These values indicate a notable increase of plebiscitary intra-party democracy. Figure 4 illustrates this shift, with fewer parties showing low PIPD values and more displaying high values. The mean absolute differences for PIPD is 0.24 (SD 0.25), slightly higher than for AIPD, indicating more overall change in PIPD values. Distribution of PIPD values for parties included in R 1 & 2.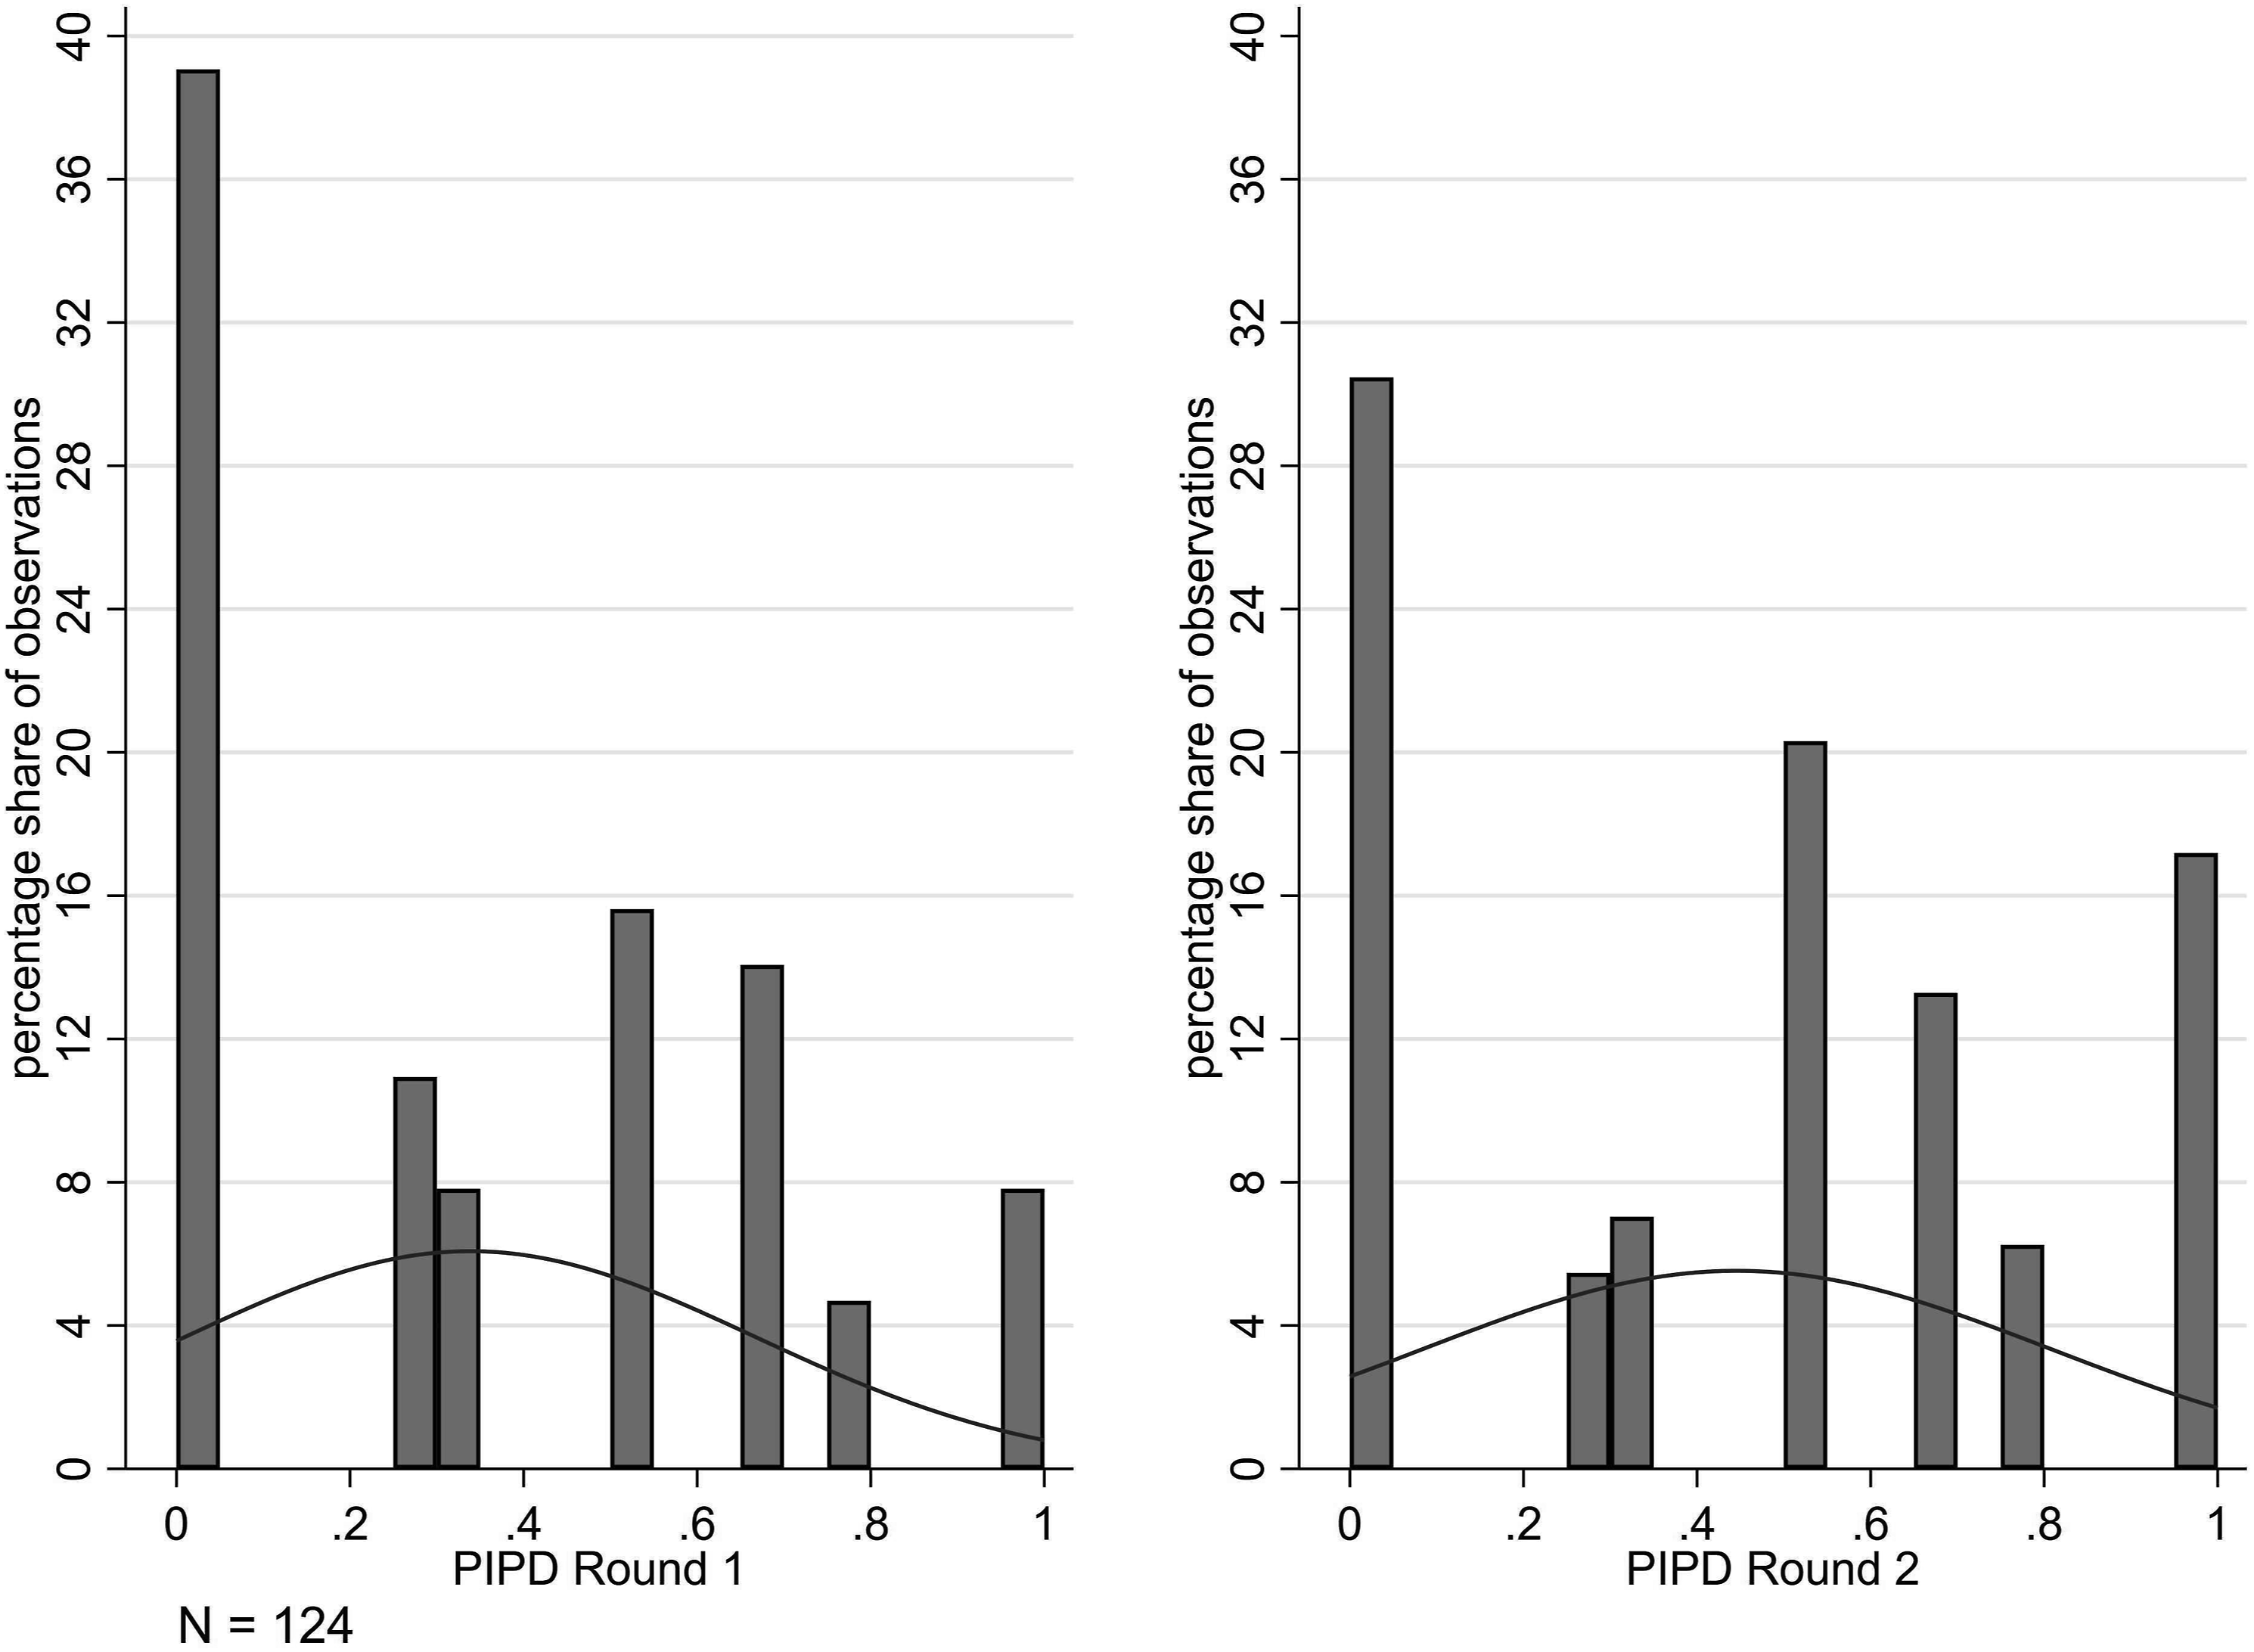
Thus far, we have compared aggregate change over time. A final reliability test of our measure consists a simple OLS-regression between round one and round two for the AIPD and PIPD indices, which measures how well the values of individual parties in round two can be predicted by knowing their values in round one. The coefficient for AIPD reveals a strong positive relationship (b = 0.503, R2 = 0.25).
12
Figure 5 displays the bivariate regression estimates for both AIPD indices. While the correlation is not as strong as one would intuitively expect, this reflects the modest pace of change, as indicated by the mean absolute differences. Hence, the AIPD index in round two is clearly dependent on the AIPD index in round one, while there has been change between both rounds. The overall positive direction of the relationship supports our earlier finding of a trend to more inclusive intra-party decision making. Bivariate estimation for the AIPD R1 & R2 and the PIPD R1 & R2.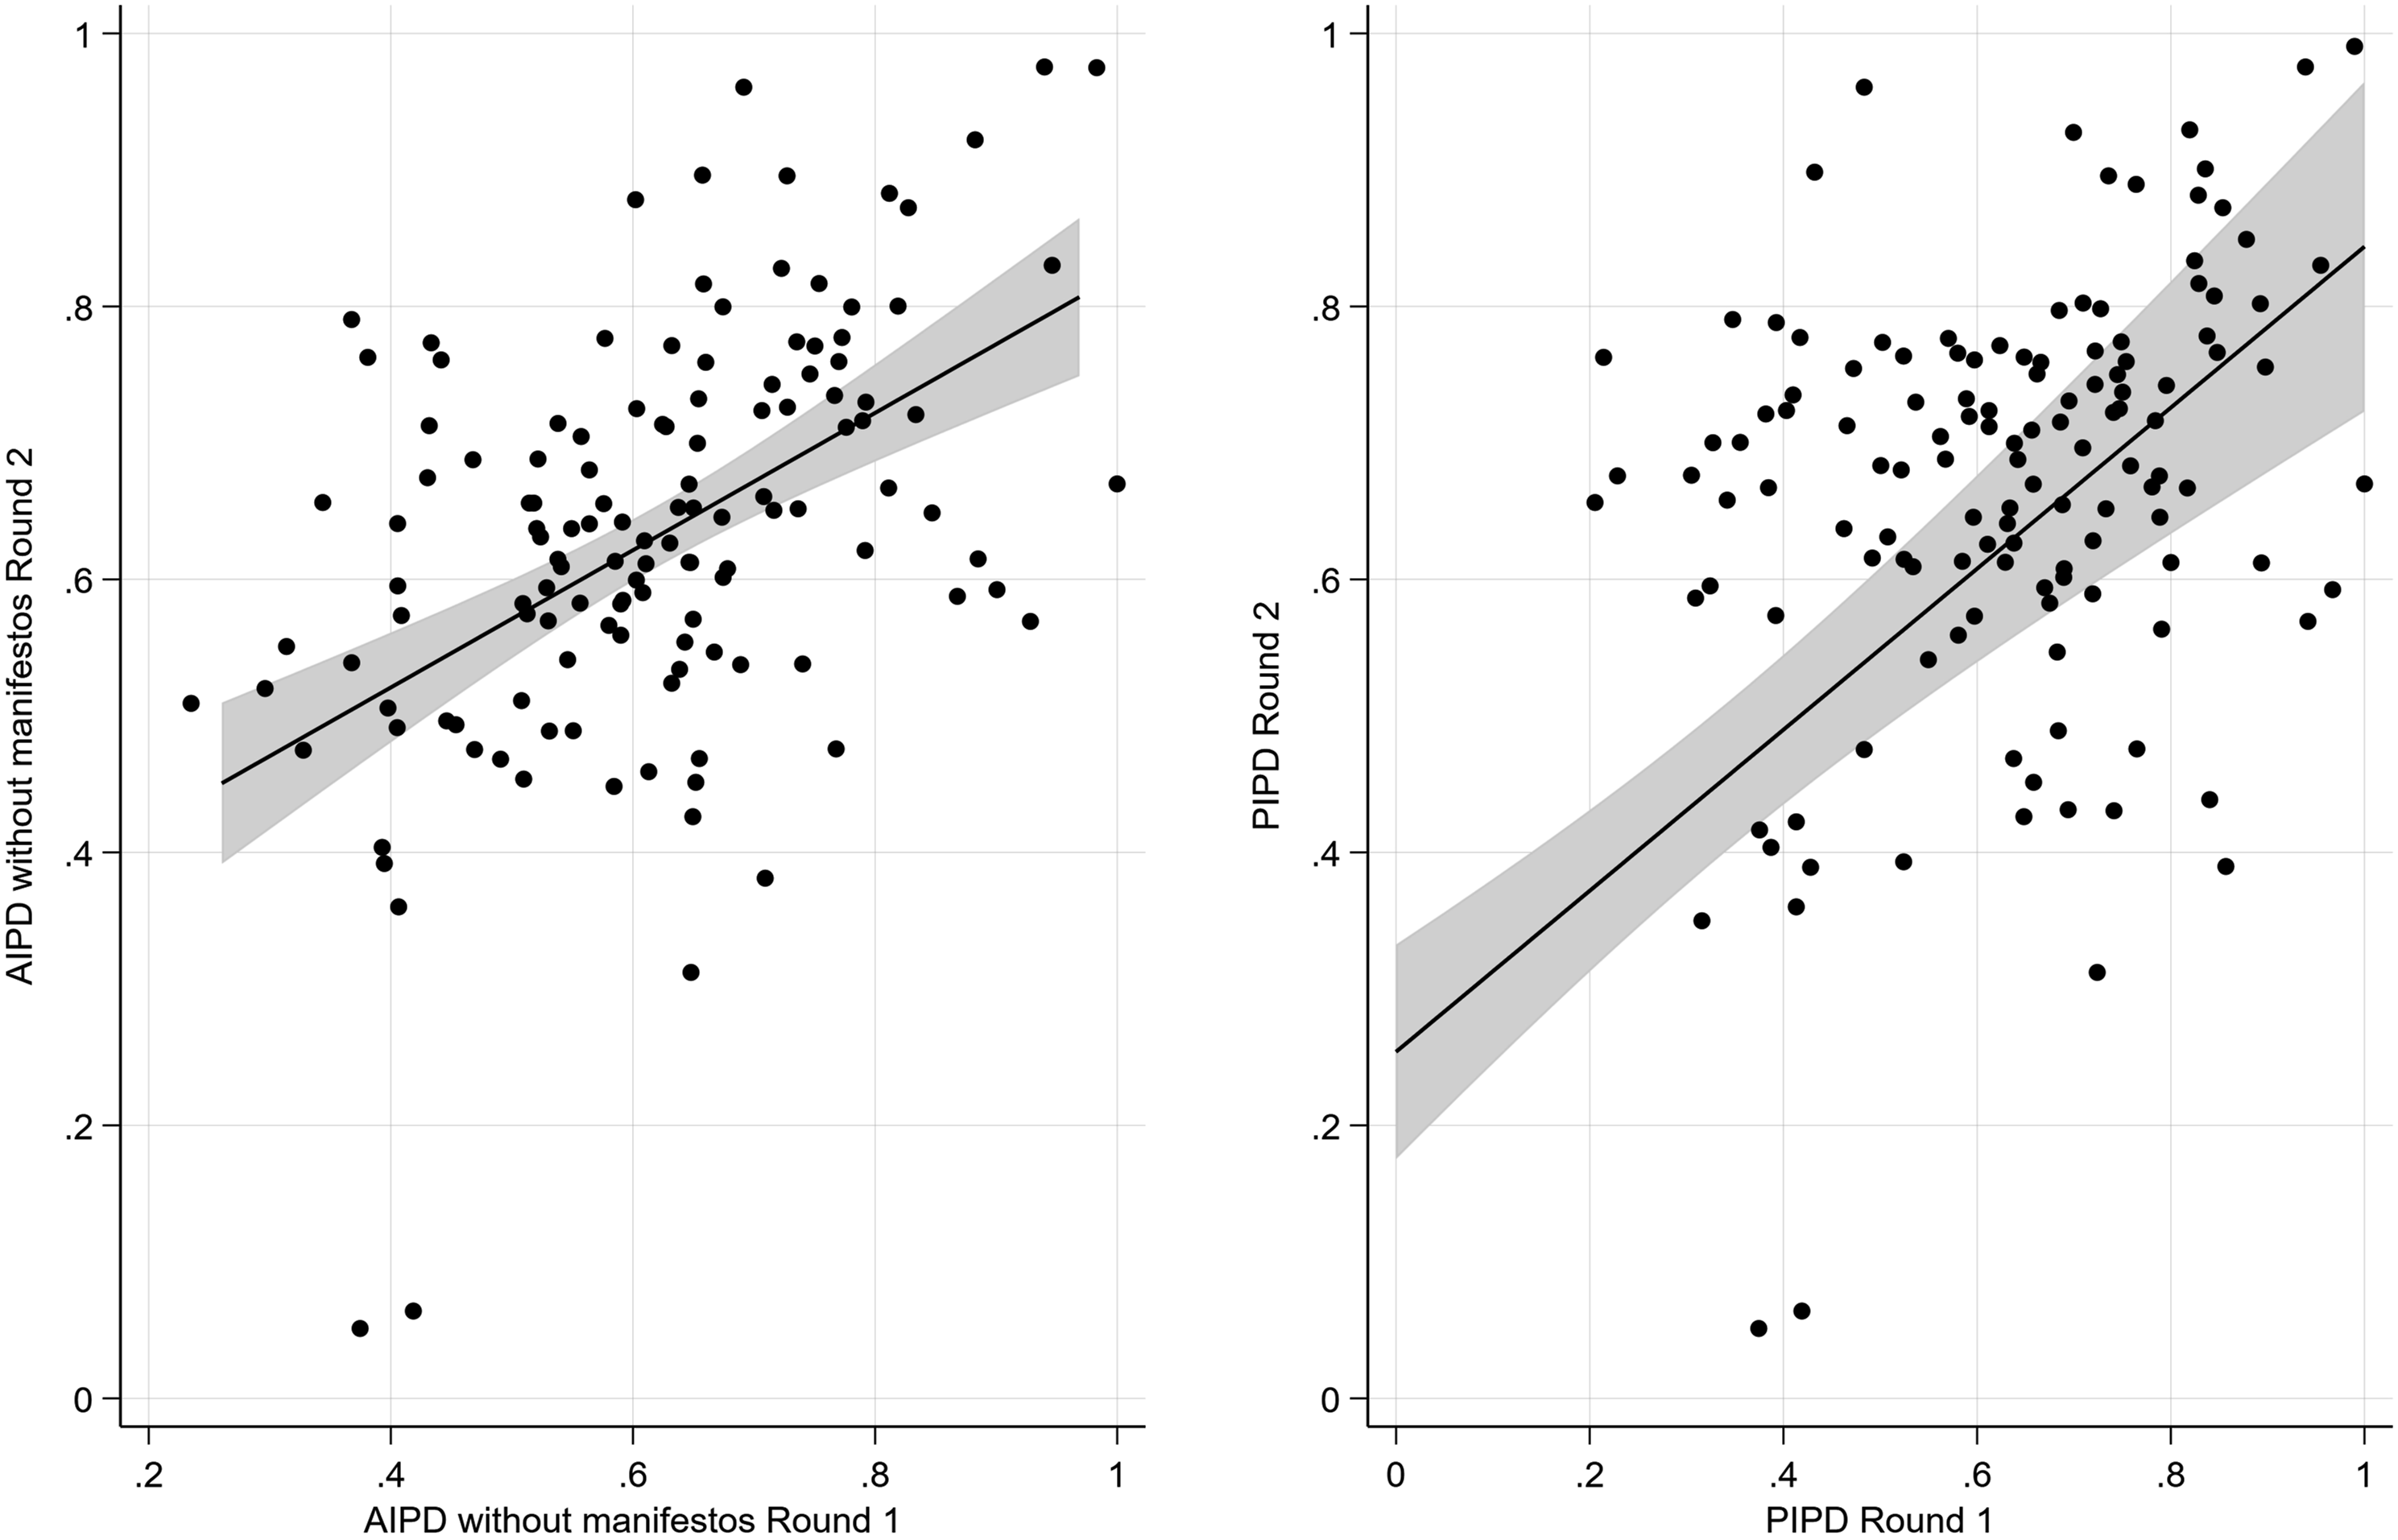
The regression for the PIPD indices reveals also a strong statistically significant positive relationship between both rounds (b = 0.59), with an R2 of 0.29, indicating a high degree of explained variance. Figure five plots the relationship for the PIPD indices. The PIPD in R2 is highly dependent on the PIPD in R1, while there is variance between both rounds. Moreover, we see the same positive relationship with many cases showing higher PIPD values.
Conclusion
In conclusion, we observe modest change in the AIPD and the PIPD values between round one and round two. Parties change, but they do change slowly. Overall, there is an increase in intra-party democracy from round one to round two. This change is especially pronounced for the PIPD. These findings fit into the debate on democratization of parties and the pressure with which they are confronted by normative expectations (Gauja, 2015; Scarrow, 2014). Furthermore, we were able to confirm the findings of others who used different methods to measure intra-party democracy, as we found a clear trend to more inclusive means of intra-party decision-making (Hazan and Rahat, 2010; Sandri et al., 2015).
Overall, our analysis confirmed the robustness of the AIPD index in capturing different forms of party organization, while revealing regional differences that are worth exploring. By successfully applying the AIPD index to a new region, namely Africa, and extending the number of observations for all other regions, we have improved the applicability of our measurement under different contextual conditions. Our analyses demonstrate that the indices for AIPD and PIPD are suitable tools for the cross-national analysis of intra-party democracy. Clearly, they are concepts and measures that travel well and are applicable to political parties around the globe. This index may help researchers studying intra-party democracy, its causes and effects and how it is connected to responsiveness, party competition, democratization or party change.
Supplemental Material
Supplemental Material - Measuring intra-party democracy on a global scale
Supplemental Material for Measuring intra-party democracy on a global scale by Simon D Brause and Thomas Poguntke in Party Politics
Footnotes
Acknowledgements
We acknowledge the work of Benjamin von dem Berge, without whom this article would not have been published. We are grateful to Paul Sax for his support working on the manuscript.
Declaration of conflicting interests
The author(s) declared no potential conflicts of interest with respect to the research, authorship, and/or publication of this article.
Funding
The author(s) disclosed receipt of the following financial support for the research, authorship, and/or publication of this article: This manuscript benefited from Open Research Area (ORA) funding provided by Deutsche Forschungsgemeinschaft PO 370/11-1, Economic and Social Research Council (UK) ES/170383, and National Science Foundation (USA) 1419401.
Supplemental Material
Supplemental material for this article is available online.
Notes
Author biographies
![]() ).
).
References
Supplementary Material
Please find the following supplemental material available below.
For Open Access articles published under a Creative Commons License, all supplemental material carries the same license as the article it is associated with.
For non-Open Access articles published, all supplemental material carries a non-exclusive license, and permission requests for re-use of supplemental material or any part of supplemental material shall be sent directly to the copyright owner as specified in the copyright notice associated with the article.