
Abstract
Party system institutionalization (PSI) is regarded as a critical underpinning of democracy. However, the systematic study of PSI in democracies is constrained by weaknesses in existing measures, which are limited in coverage or comprehensiveness, and do not account for the latent nature of the concept, measurement error, and non-random missing data. This article presents a novel measure of PSI that uses a Bayesian latent variable measurement strategy to overcome extant measurement issues. The subsequent measure not only offers unmatched coverage and has demonstrated validity, but also exhibits more robust empirical associations with a range of outcomes related to the performance of democracy than existing measures. The measure should facilitate more integrated research on the causes and consequences of PSI in democracies around the world.
Introduction
Party system institutionalization (PSI) refers to the extent to which “a stable set of parties interacts regularly in stable ways” (Mainwaring, 2018:4) and come to “complete, colligate, and collaborate” in a predictable manner (Casal Bértoa and Enyedi, 2021:17). Stable and predictable party systems are regarded as a critical underpinning of democracy as they generate information about who the parties are, what they stand for, and how they might behave. Under-institutionalized party systems that exhibit frequent reshuffling of parties and erratic interparty interactions are thought to undermine accountability (Jensenius and Suryanarayan, 2022; Ridge, 2022; Robbins and Hunter, 2011; Schleiter and Voznaya, 2018), impede interparty coordination (Bernhard et al., 2020; Hicken, 2016), and diminish the capacity of governments to implement consistent policies that promote social and economic welfare (Hicken, 2016; Mauro, 2022; Robbins, 2010; Tommasi, 2006). Such deficiencies can erode the legitimacy of democratic institutions and create openings that anti-democratic actors can exploit to trigger the breakdown of democracy (Mainwaring, 2018; Mainwaring and Scully, 1995).
Despite this widely entrenched belief that democracy is unworkable—and perhaps even unsustainable—without institutionalized party systems, the supporting evidence is not as conclusive as one might expect (Casal Bértoa, 2017). This is in part due to weaknesses in existing measurement approaches. Given the significant challenges associated with gathering comparative party system data, empirical studies often employ dissimilar indicators or focus on disjoint regions, which has at times produced conflicting results (Enyedi and Casal Bértoa, 2020). Other studies reduce data demands by mono-operationalizing PSI with Pedersen’s (1979) index of electoral volatility or the age of the main parties, but these measures only partially or indirectly capture PSI. While recent works have advanced the measurement of the concept, the coverage of the subsequent measures remains limited (e.g., Casal Bértoa and Enyedi, 2021; Chiaramonte and Emanuele, 2022; Rodriguez and Rosenblatt, 2020). Moreover, no measure directly accounts for the latent nature of PSI, the accompanying measurement error, and non-random missing data, but overlooking such issues can generate misleading inferences. Together, these unresolved measurement challenges have inhibited the development of systematic understandings of how PSI is related to party building and collapse, on one hand, and democratic consolidation and backsliding, on the other, across regions, contexts, and over time (Casal Bértoa, 2018).
This article fills this gap by presenting a novel measure of PSI that addresses these measurement issues. Since PSI is a latent concept that cannot be directly observed or measured (Casal Bértoa and Enyedi, 2021; Mainwaring, 2018), I employ a Bayesian latent variable measurement strategy, which leverages information from manifest (observable) indicators of the concept to estimate PSI. I overcome data limitations by gathering extensive data on the partisan composition of legislatures and governments, and use this data in conjunction with the Varieties of Democracy (V-Dem) dataset (Coppedge et al., 2020) to construct five manifest indicators of PSI that cover 96 democracies from 1945 to 2018. The subsequent Party System Institutionalization Scores (PSI Scores) measure not only offers unmatched coverage and is more comprehensive than single indicators, but also aligns with the latent nature of the concept, quantifies measurement uncertainty, and accounts for non-random missing data. Nonetheless, the utility of a measure depends more critically on its validity. As such, I conduct numerous validity tests while comparing the measure’s performance to existing measures, and the results strongly favor the PSI Scores. Notably, this measure is a better predictor of a range of outcomes related to the performance of democratic institutions, and should be a useful empirical tool that can advance more integrated research on the causes and consequences of PSI across democracies.
Measuring PSI: Existing approaches
Following Mainwaring and Scully’s (1995) seminal volume on party systems in Latin America, a wave of empirical studies highlighted the potential utility of the concept of PSI for explaining variations in the performance of democracies (e.g., Coppedge, 1998; Croissant and Völkel, 2012; Jones, 2010; Kuenzi and Lambright, 2001; Lindberg, 2007; Mainwaring and Torcal, 2006; Meleshevich, 2007; Stockton, 2001; Weghorst and Bernhard, 2014). However, given data constraints, these studies tend to employ dissimilar indicators or focus on disjoint regions, which makes it difficult to systematically compare results, explain discrepancies, and build unified theories. Furthermore, the usual strategy to aggregate multiple indicators is to average them into an index, but there is usually no justification given as to whether this strategy is appropriate for measuring PSI (Luna, 2014).
A popular workaround to reduce data demands has been to mono-operationalize PSI with electoral volatility or the age of the main parties, which can permit more encompassing examinations of PSI (e.g., Mauro, 2022; Ridge, 2022; Robbins, 2010; Robbins and Hunter, 2011; Schleiter and Voznaya, 2018). 1 However, using a single indicator to measure a multi-faceted concept such as PSI can introduce bias in cross-space/cross-time analysis (Munck and Verkuilen 2002), which undermines the principal advantage of these measures. Furthermore, electoral volatility is a noisy measure (Casal Bértoa et al., 2017) that only accounts for the electoral/legislative arenas and, as discussed later, even discards pertinent information about stability and predictability by focusing on election-to-election changes. On the other hand, the age of the main parties is more closely aligned with party institutionalization since the measure simply aggregates characteristics (i.e., the age) of individual parties. Older parties may be more likely to be institutionalized, but this does not necessarily mean that interparty interactions will be stable and predictable. Hence, this measure may be less applicable for testing theories that specifically concern PSI.
Recent works on PSI address some of these weaknesses, and Casal Bértoa and Enyedi (2021) provide one path-breaking contribution in this regard. The authors build on Mair (1997), who argues that the stability and predictability of patterns of government formation is a core characteristic of PSI since it captures key interactions between the most relevant parties. When measuring PSI, the authors accordingly deviate from existing approaches that typically focus on the electoral/legislative arenas. Instead, they construct the Party System Closure Index, which measures the stability and predictability of government formation based on the extent to which parties adhere to existing alliances and form familiar cabinets. Importantly, the authors find that their index offers additional insights about PSI that may not be readily apparent from looking at electoral patterns. Their work suggests that patterns of government formation encompass relevant and distinct information about PSI, and could be incorporated into more comprehensive measures of the concept.
However, one drawback of this index is its neglect of the electoral/legislative domains, which precede government formation and thus remain important arenas of interparty competition (Chiaramonte and Emanuele, 2022; Mainwaring, 2018). To build a more complete measure, Chiaramonte and Emanuele (2022) standardize and average time-weighted volatility measures across the electoral, legislative, and government arenas to form their own index. This index offers clear advantages as it tracks interparty competition across multiple arenas, and accounts for long-term stability by time-weighting observations from the past three elections/legislatures. However, the inclusion of both electoral and legislative volatility in the index may be problematic since the two measures are very highly correlated and convey almost identical information about PSI, which mechanically underweights the importance of government volatility. In addition, the index does not account for measurement uncertainty even though volatility calculations can be quite noisy (Casal Bértoa et al., 2017).
In contrast to the preceding two works, Rodriguez and Rosenblatt (2020) recast PSI as having a necessary and sufficient conceptual structure that requires both (1) stability and predictability, and (2) the capacity of the party system to incorporate new societal demands. When constructing their accompanying measure, the authors correctly note that averaging indicators would misrepresent their concept since this assumes an additive conceptual structure. Instead, the authors use a combination of interactions and geometric/arithmetic means to reflect the necessary and sufficient conditions within their concept. Although this resulting measure more faithfully adheres to their underlying concept, the authors’ conceptualization runs counter to recent trends that treat PSI as strictly revolving around stability and predictability (e.g., Casal Bértoa and Enyedi, 2021; Mainwaring, 2018), 2 and their second dimension might be more rightly viewed as one cause of PSI than as one of its internal components (Chiaramonte and Emanuele, 2022).
While these novel measures provide valuable insight into how PSI could be more effectively measured, their coverage remains limited, though this is understandable as they carry more burdensome data requirements. 3 On the other hand, the Party Institutionalization (PI) Index in the V-Dem dataset offers almost universal coverage and has been utilized in more expansive studies of PSI (e.g., Mauro, 2022; Ridge, 2022). 4 The index averages various indicators of party characteristics but—as its name suggests—it specifically measures the institutionalization of parties rather than the party system. Although PI and PSI are intimately intertwined, they may not always be complementary (Randall and Svåsand, 2002). Thus, conflating these concepts and associated measures can impede our understanding of how the two processes might be related, and whether it is the institutionalization of individual parties or the party system that drives outcomes of interest (Casal Bértoa, 2017).
Additional measurement issues have also been frequently overlooked. PSI is a latent concept since stability and predictability are a function of perceptions and expectations, which means that it cannot be directly observed or measured (Casal Bértoa and Enyedi, 2021; Mainwaring, 2018), but there has been no attempt to explicitly measure PSI as a latent variable. In turn, this has meant that estimates do not account for measurement uncertainty even though manifest indicators of latent concepts likely contain varying degrees of noise. Furthermore, the difficulties of acquiring comparative party system data—particularly for less institutionalized party systems—often lead to missing observations that are unlikely to be missing at random. Although such issues do not necessarily pose insurmountable hurdles, leaving them unaddressed can lead to imprecise estimates and misleading inferences.
Measuring PSI as a latent concept
To deal with the aforementioned issues, I use a Bayesian latent variable measurement approach, which estimates latent levels of PSI by drawing on the common variance between its manifest indicators. This strategy offers numerous advantages for measuring the concept at hand. First, it incorporates information across multiple indicators, which should produce a measure that is more useful for cross-space/cross-time analysis relative to single indicators such as electoral volatility or the age of the main parties (Munck and Verkuilen, 2002). Second, it follows Rodriguez and Rosenblatt’s (2020) example by aligning measurement with the underlying concept. Third, it provides a way to quantify measurement uncertainty, which is an important feature given the latent nature of the concept. Fourth, the measurement model can flexibly handle non-random missing data to mitigate bias.
Manifest indicators
The manifest indicators are selected based on two broad criteria. First, manifest indicators should capture observable characteristics of party systems that are a function of underlying levels of PSI. 5 Some indicators may covary with PSI but represent features of related but distinct concepts. Including such indicators in the measurement model could generate imprecise estimates and produce a conflated measure that is less useful for theory-testing. As such, indicators of concepts such as party institutionalization (e.g., party age) and the quality of democracy (e.g., legitimacy of elections), or those that mainly focus on actors external to the party system such as the electorate (e.g., partisan identification) are not included in the measurement model. 6
The second criteria used to select the manifest indicators are data coverage and generalizability since the goal is to develop a robust measure of PSI that also encompasses a global sample of democracies. Some indicators may convey pertinent information about PSI, such as the consistency in the ideological configuration of parties or patterns of legislative voting. However, such indicators are not included in the measurement model since requisite data are not consistently available for many countries. For similar reasons, indicators that are only applicable to a subset of democracies—notably those related to presidential elections—are also not included.
The manifest indicators used in the measurement model—Aggregate Legislative Volatility, Aggregate Government Volatility, Minor Party Performance, Party Distinctiveness, and Party Switching—satisfy these criteria. 7 Moreover, the analyses presented later in this article demonstrate that these indicators contain sufficient information to produce overall estimates of PSI that perform quite well in validity tests.
The first three indicators focus on the composition of the party system. In institutionalized party systems, interparty competition revolves around well-established parties that engage in consistent patterns of interactions across the electoral/legislative and government arenas (Casal Bértoa and Enyedi, 2021; Chiaramonte and Emanuele, 2022; Mainwaring, 2018). In such cases, the composition of parties that win seats and gain access to government offices should be generally stable over time. The Aggregate Legislative Volatility and Aggregate Government Volatility indicators modify conventional volatility calculations to capture such long-term stability.
While the volatility indicators reflect the stability of partisan composition, the Minor Party Performance indicator instead focuses on the distribution of the seats among parties in the legislature, and more specifically on the cumulative seat shares won by minor parties (and independents). As party systems become institutionalized, political competition comes to be channeled through and largely restricted around a set of well-established parties. This raises the barriers of entry for other contenders and increases the costs of challenging these main parties (Casal Bértoa and Enyedi, 2021; Mainwaring, 2018; Meleshevich, 2007), which diminishes the likelihood that many minor parties will both compete and successfully win seats in elections. As such, PSI should be associated with higher levels of major party dominance and, correspondingly, a reduced presence of minor parties in the party system. 8
PSI also alters the expectations of actors within the party system (Mainwaring, 1999), and thus their subsequent behaviors can also inform about latent levels of PSI. As interparty interactions become more stable and predictable, actors come to expect such patterns to persist and develop longer time horizons (Hicken, 2016; Mainwaring, 2018). This magnifies the costs of short-term opportunistic behaviors that defy such expectations and generate uncertainty (Tommasi, 2006), which weakens the appeal of ephemeral parties or those that frequently change their policy platforms (Lupu and Riedl, 2013). Consequently, PSI fosters Party Distinctiveness by generating stronger incentives for parties to carve out clear and consistent identities within the party system (Greene and Sánchez-Talanquer, 2018; Jones, 2010). PSI should also have comparable implications for the behaviors of individual politicians. In particular, the reputational costs that legislators incur when switching parties increase as parties become more distinct and actors develop longer time horizons. Hence, PSI should also be associated with reduced occurrences of Party Switching within the party system (Desposato, 2006; Kreuzer and Pettai, 2009). 9
These indicators offer related but distinct information about PSI, and requisite data are also generally available across most democracies in the post-WWII period. The following section discusses the data sources and the construction of the indicators.
Data
To construct the aggregate volatility indicators, I gather extensive data on the partisan composition of around 1050 lower-house legislatures and 1300 cabinets across 96 post-WWII democracies.
10
These indicators modify Pedersen’s (1979) index of electoral volatility:
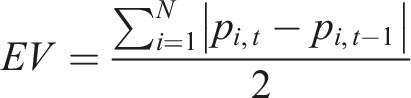
Therefore, I calculate the Aggregate Legislative Volatility indicator by adapting existing applications of dissimilarity measures. At each year t in country i, I use seat share data 11 from the most recent election to calculate a linear weighted moving average of the volatility scores 12 between year t and each of the twenty years (or t-1 if t<20) preceding t. 13 Substantively, the indicator summarizes how similar the partisan composition of the legislature at year t is to those from the past twenty years, with recent legislatures and those that lasted for a longer period receiving greater weight. 14 I also calculate the Aggregate Government Volatility indicator following a similar procedure, weighting parties in government by their legislative seat shares.15, 16 Both indicators range from 0 to 1, with lower scores indicating greater long-term stability. The Minor Party Performance indicator is calculated by summing the seat shares won by minor parties (i.e., those that secure less than two percent of the seats) and independents, which are excluded from the legislative volatility calculations due to data limitations. 17
Data for the Party Distinctiveness and Party Switching indicators are sourced from the V-Dem dataset. The former indicator is constructed using a Bayesian Item Response Theory measurement model that aggregates expert assessments of whether parties “have publicly available platforms that are publicized and relatively distinct from one another.” 18 The indicator is rescaled to a unit interval so that its scale is equivalent to the other indicators. The latter indicator represents expert assessments of the percentage of members of the national legislature who change or abandon their parties in between elections. 19
Measurement model
In the model,
Despite extensive efforts and consultation across numerous sources, it was not possible to compile consistent cabinet composition data for some democracies. Aggregate Government Volatility cannot be calculated in such cases since the indicator requires complete data across all twenty-year periods. These observations, which account for around fourteen percent of the total observations, could be excluded or their missingness ignored—as is usually the case when averaging indicators into an index—but this could bias estimates since missingness is likely to be non-random, i.e., more likely when party systems are under-institutionalized and consistent cabinet data are harder to come by given the frequent entry and exit of parties. As such, I adopt the approach presented by Lee (2007) and Arel-Bundock and Mebane (2011), which leverages missingness to obtain more information about the latent factor. More specifically,
Since stability and predictability cannot be evaluated given a short time span, observations for democracies 20 begin after the first two consecutive democratic elections or five years have passed since the inauguration of democracy, depending on whichever occurs later. For similar reasons, democratic regimes that survive for less than ten years are excluded. I estimate the model using Stan in R. Each of the four independent chains discards the first 2000 iterations as burn-in, and the next 5000 iterations are treated as draws from the joint posterior density. Standard MCMC diagnostics indicate that all chains have sufficiently converged. Substantive and statistical summaries of the manifest indicators and their posterior distributions are presented in Appendix E.21, 22
PSI Scores
The measurement model uses 15,988 data points across the five manifest indicators to generate 3,313 posterior distributions of the latent factors, which provide country-year estimates of PSI across 96 post-WWII democracies. In my discussion, I refer to the medians of these posterior distributions as PSI Scores, which serve as reasonable point estimates, and the full posterior distributions as PSI Scores (D), which incorporate measurement uncertainty. 23 The coverage of the PSI Scores far outstrips those of existing measures, which should facilitate tests of PSI that encompass a global sample of democracies. Nonetheless, the utility of a measure is determined principally by its validity, and thus I examine the face, convergent, and construct validity of the PSI Scores. 24
In the latter two tests of validity, I compare the PSI Scores measure with four alternative measures of PSI. The first two are electoral volatility (EV) and the age of the main parties (Party Age), which provide a useful baseline given their frequent deployment in the literature. EV is calculated using the same data as the Aggregate Legislative Volatility indicator, and its scale is reversed so that higher values are associated with more institutionalized party systems. The Party Age variable calculates the average age of the two largest governing parties and the largest opposition party (Cruz et al., 2018) and is logged given its skew. The third measure is Casal Bértoa and Enyedi’s (2021) Party System Closure Index (Closure), which measures PSI in the government arena across Europe. Comparisons with the index should reveal how the PSI Scores perform relative to a detailed within-region measure. The fourth measure is simply the average of the five manifest indicators used in the measurement model (MI Avg). It is included to assess whether using the more complex Bayesian latent variable measurement model to aggregate indicators provides any noticeable advantages. To facilitate comparisons, I limit the observations to those that cover the 96 post-WWII democracies in my sample.
Face validity: PSI across space and time
A measure with face validity should conform to existing expectations (Adcock and Collier, 2001). To give a sense of the spatial and temporal variation in the PSI Scores, I plot the mean PSI Scores for the first and last five observations for each country in Figure 1. Variations in the PSI Scores across space and time.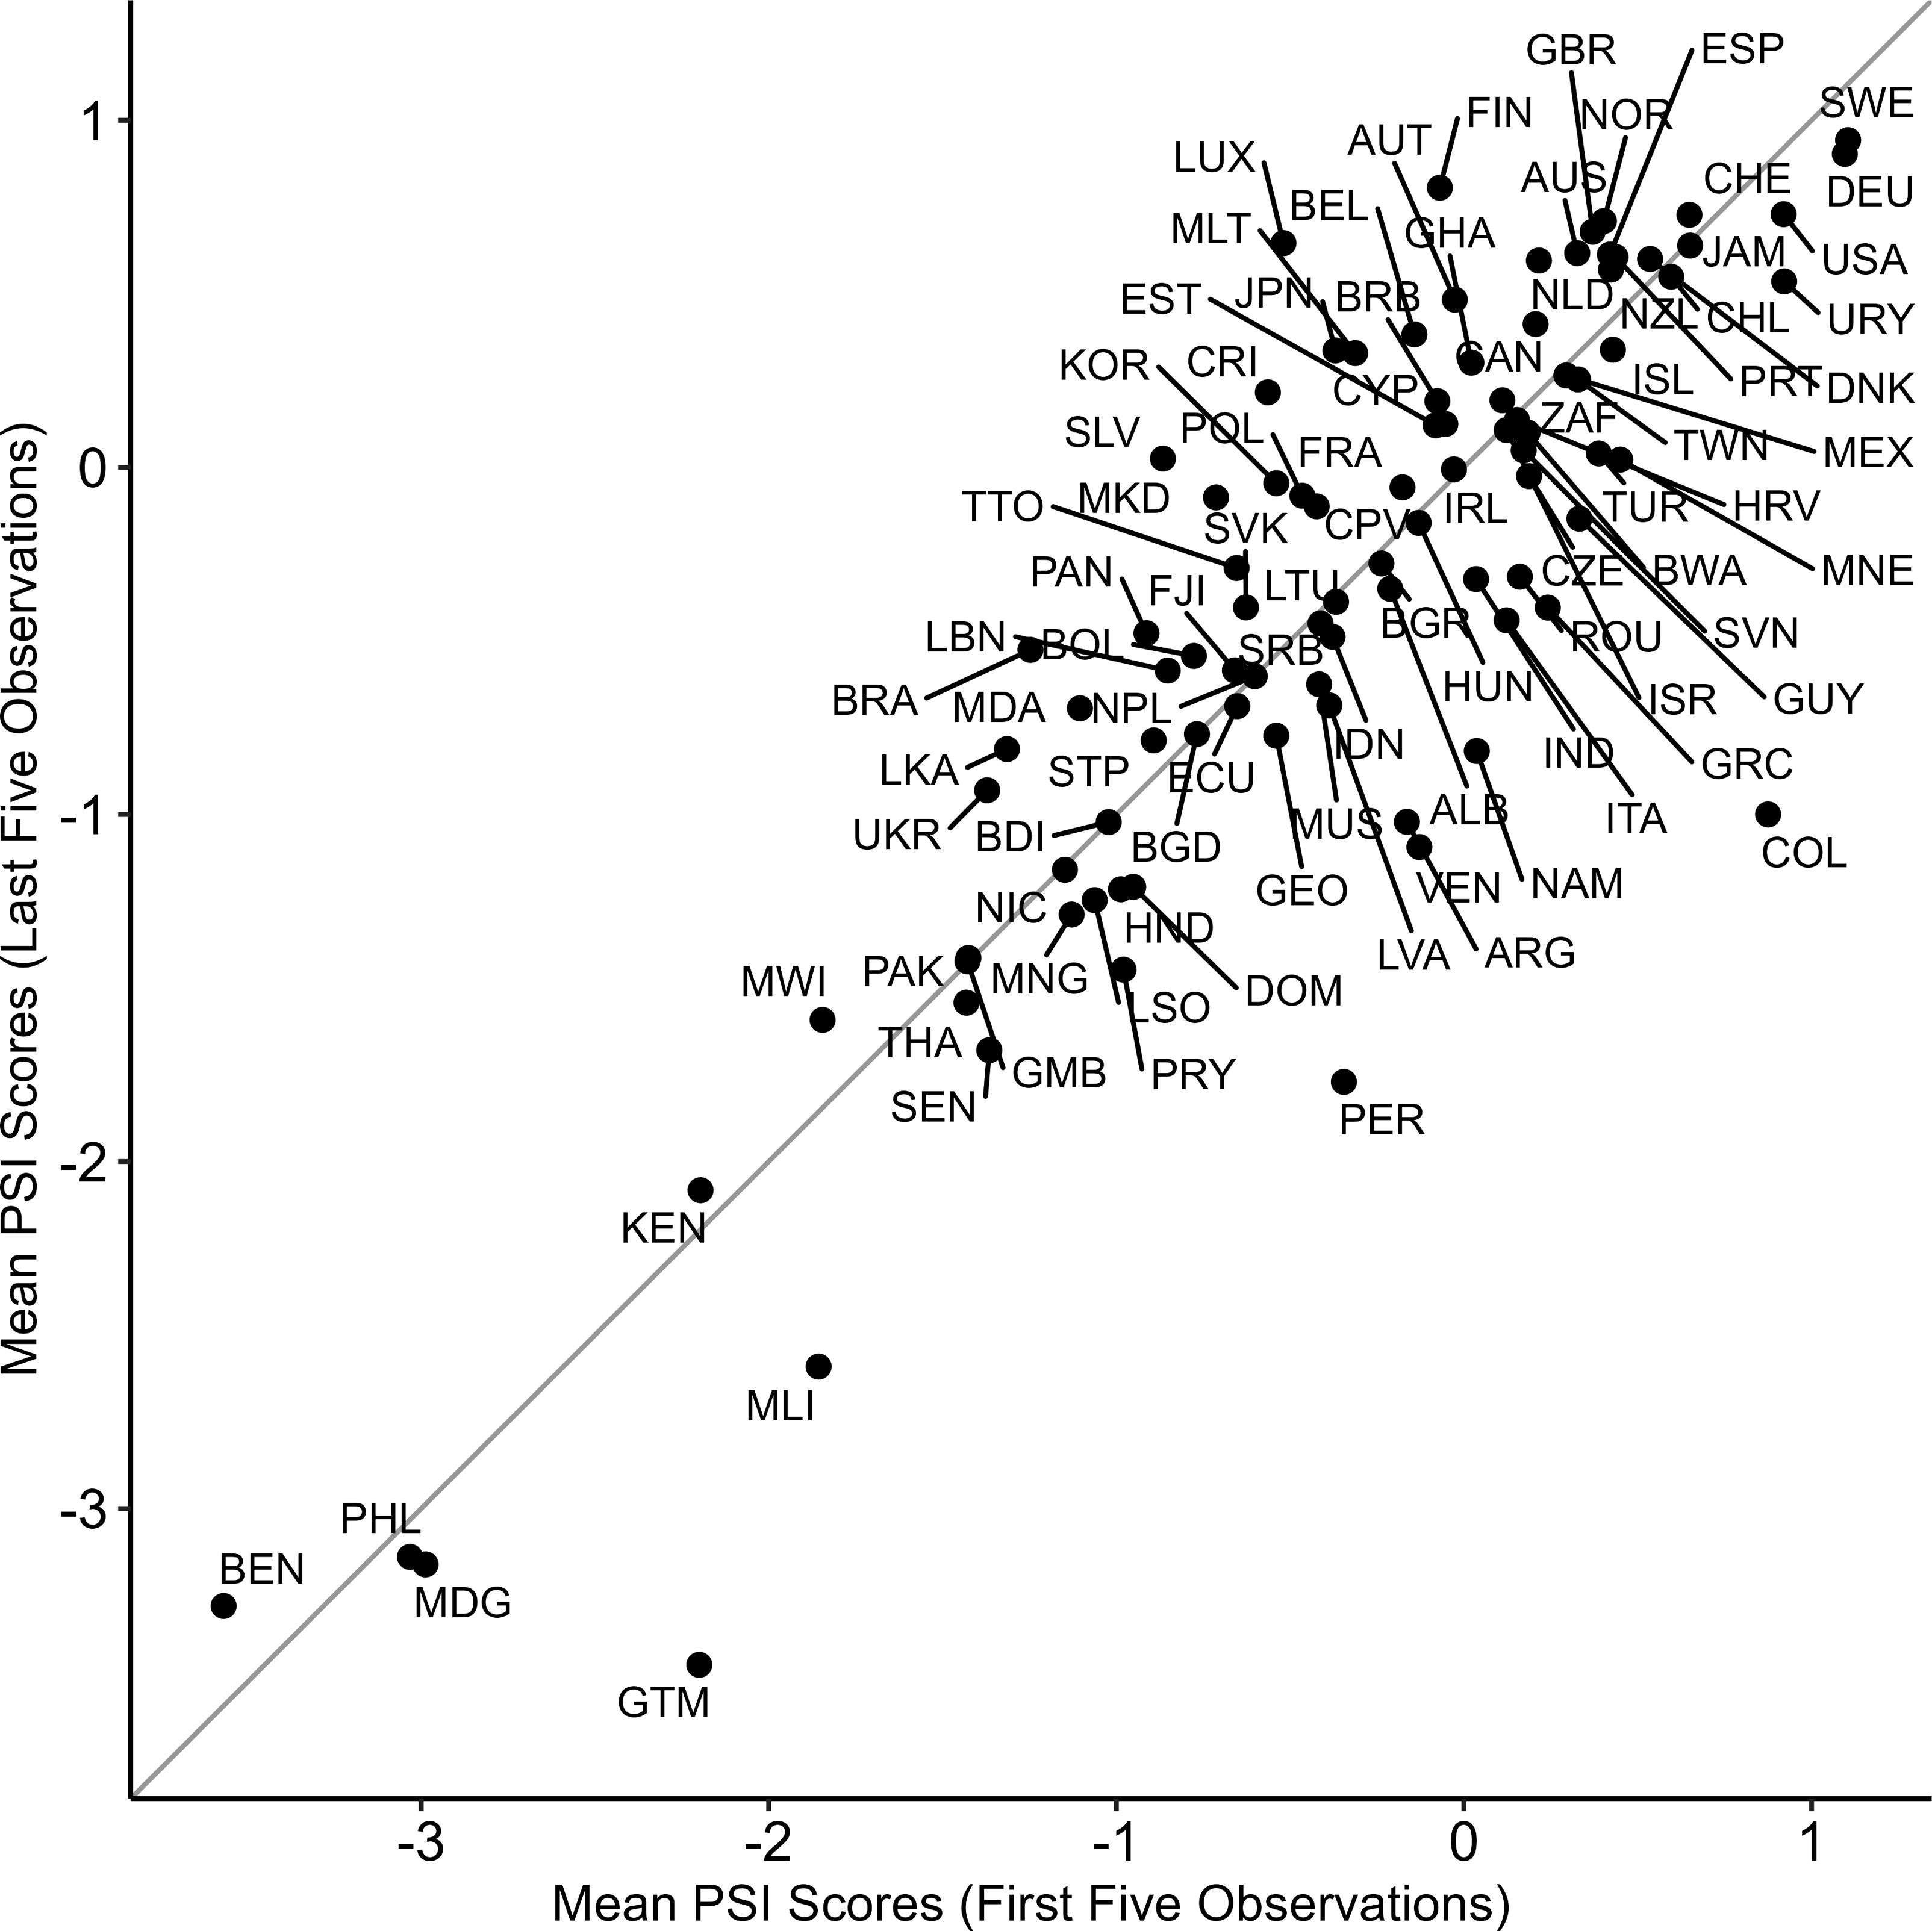
The spatial distribution generally aligns with expectations. Western democracies dominate the upper right spectrum, whereas countries that have been noted as having consistently under-institutionalized party systems such as Benin (Kuenzi and Lambright, 2001), the Philippines (Hicken and Kuhonta, 2015), and Guatemala (Mainwaring, 2018) occupy the lower left spectrum. 25
In addition, countries that lie above (below) the 45-degree line are those that are estimated to have become more (less) institutionalized over time. The points are evenly divided by the grey line and do not exhibit a clear trend, which affirms existing arguments that party systems do not necessarily become and stay institutionalized over time, and that even institutionalized party systems can also undergo de-institutionalization (Casal Bértoa and Enyedi, 2021; Chiaramonte and Emanuele, 2022; Lindberg, 2007). On a pessimistic note, this suggests that there has been little convergence in the institutionalization of party systems over time.
Convergent validity: Correlations with existing measures
Convergent validation examines whether a measure is correlated with other measures of the same concept (Adcock and Collier, 2001). Figure 2 plots the PSI Scores and the four alternative measures of PSI. Reassuringly, the correlations are relatively strong, but there remain noticeable differences between the measures, which could impact inference. Interestingly the correlation between the PSI Scores and MI Avg measures is only 0.78 even though they are constructed from the same indicators, which suggests that the aggregation method could make a meaningful difference. Furthermore, the correlation between the PSI Scores and V-Dem’s Electoral Democracy Index is 0.56, which signals that the measure is capturing a concept that is related to but distinct from democracy. Scatterplots, histograms, and correlations of the PSI measures.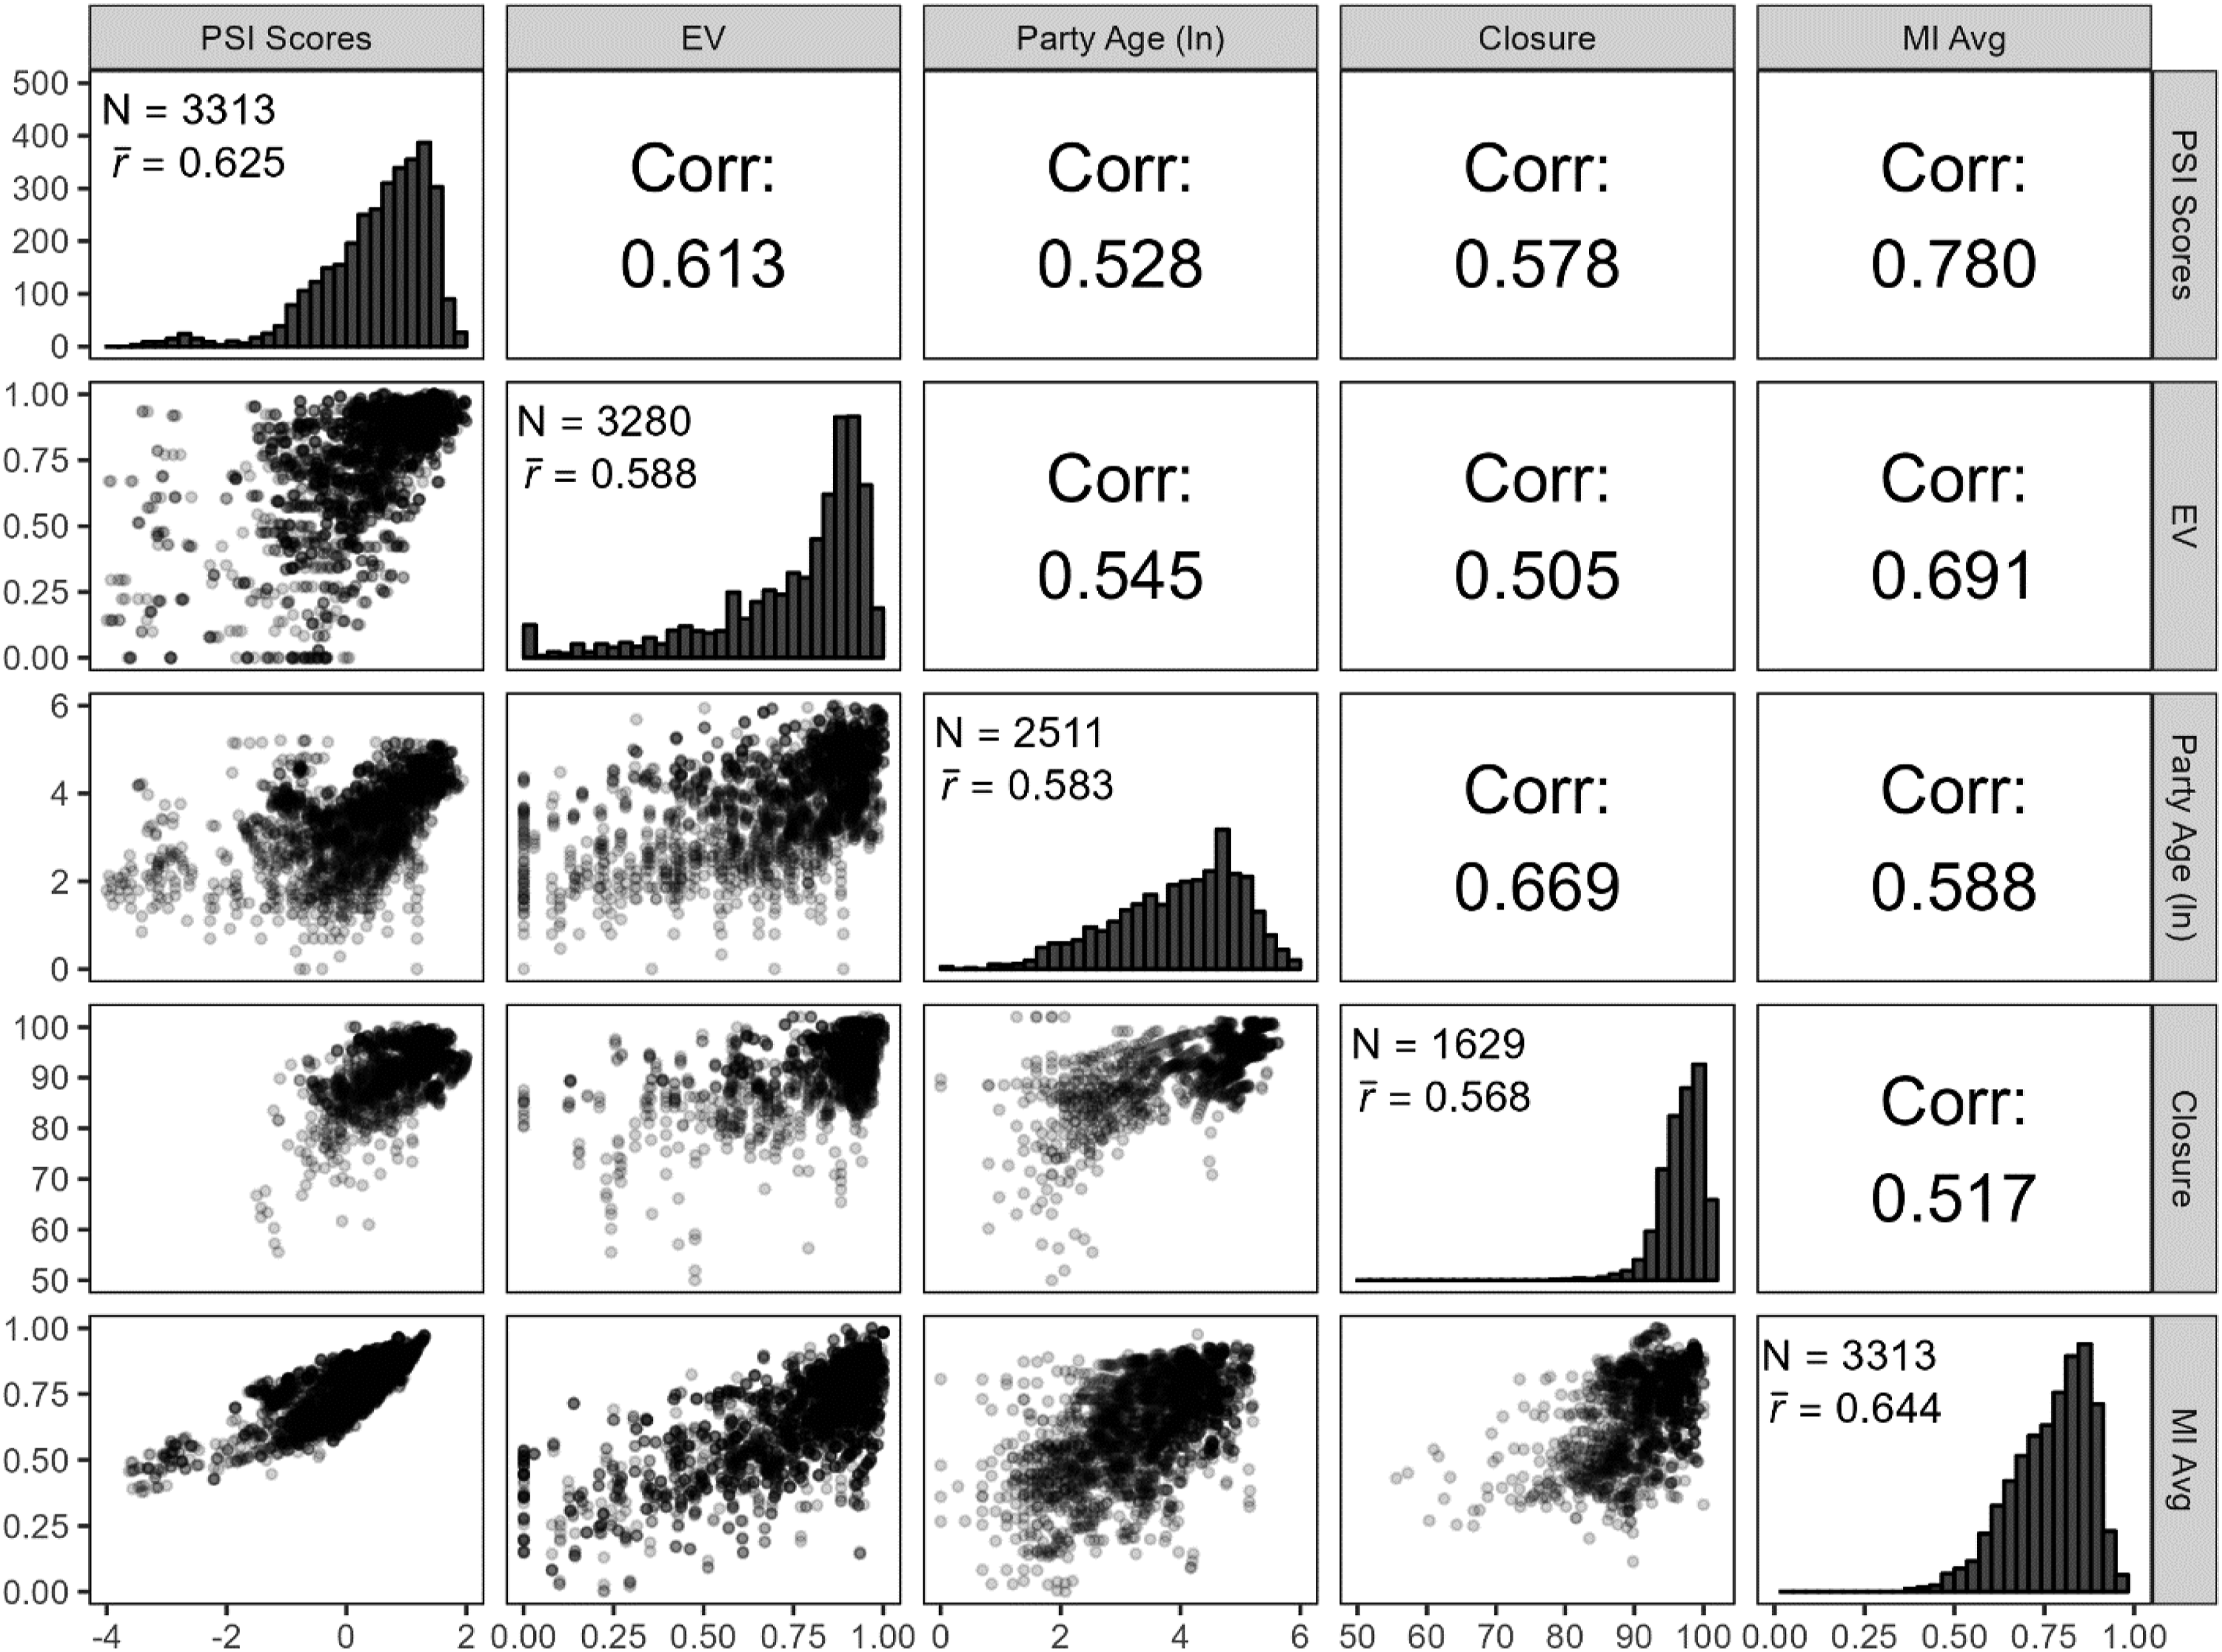
Construct validity: Democracy and PSI
Construct validation assesses whether a measure corroborates well-established hypotheses, and builds on the premise that a valid measure should be correlated with measures of distinct but theoretically related concepts (Adcock and Collier, 2001). 26 PSI is widely regarded as being beneficial for the performance of democratic institutions as it generates information about parties and lengthens their time horizons, which enhances the ability of parties to hold each other accountable, cooperate and sustain intertemporal agreements, and implement policies more consistently and efficiently (Hicken, 2016; Mainwaring, 2018; Schleiter and Voznaya, 2018; Tommasi, 2006).
Summary of the dependent variables.
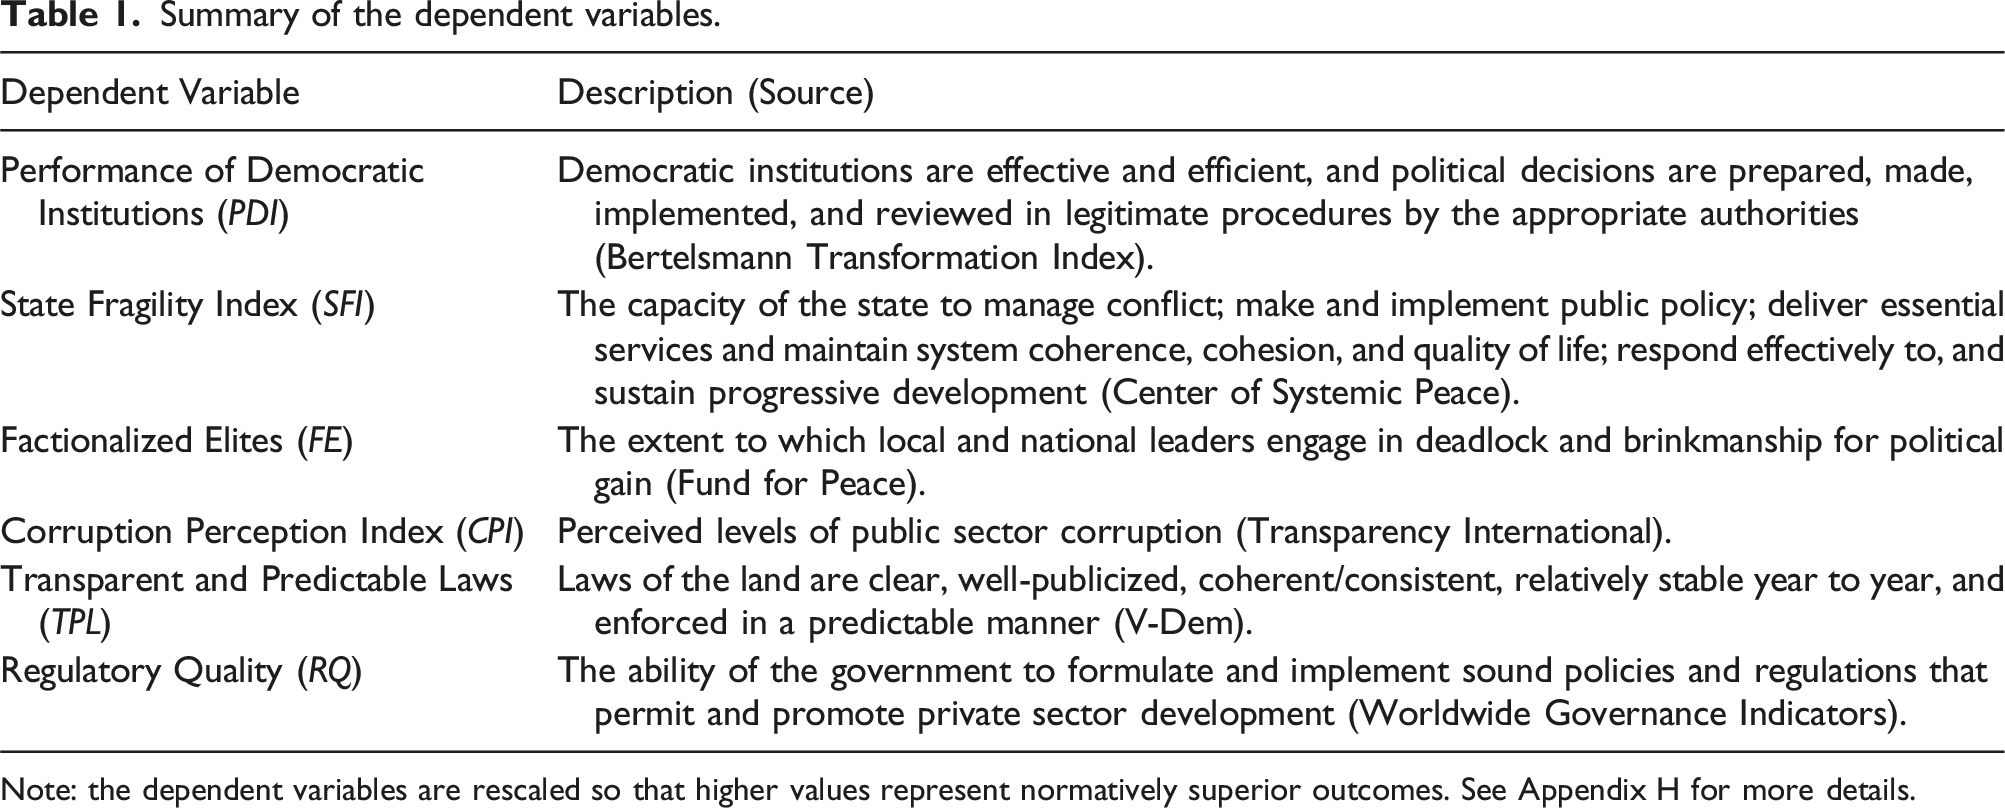
Note: the dependent variables are rescaled so that higher values represent normatively superior outcomes. See Appendix H for more details.
Summary of the coefficient estimates.
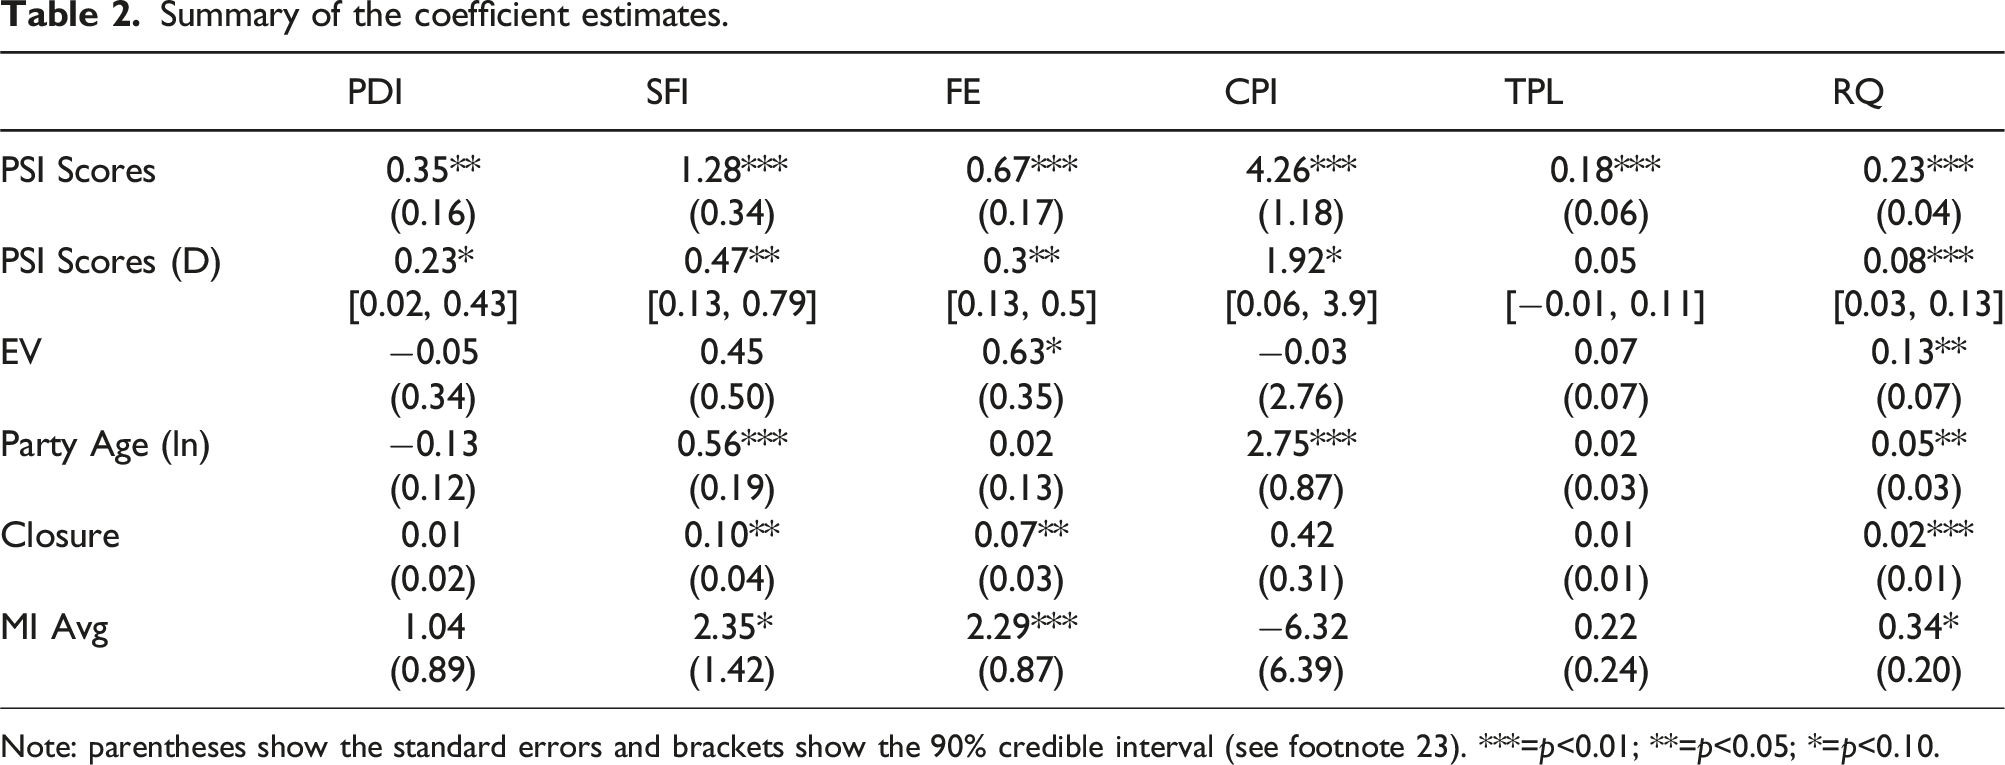
Note: parentheses show the standard errors and brackets show the 90% credible interval (see footnote 23). ***=p<0.01; **=p<0.05; *=p<0.10.
The substantive implications are also meaningful. A one standard deviation increase in the PSI Scores, which is about the mean difference between the United States and Turkey, is associated with a 0.22 standard deviation increase in the dependent variables, on average. Moreover, such estimated magnitudes are larger or comparable to those associated with the bureaucracy, civil society, judiciary, media, and the state, 28 and the fact that the PSI Scores measure remains a strong predictor even when controlling for the strength of these actors suggests that the measure does seem to measure a distinct concept. 29
Interestingly, the EV measure performs relatively poorly in this analysis, which warns against the tendency to default to electoral volatility when carrying out cross-national tests of PSI. Moreover, the MI Avg measure is a weaker predictor than the PSI Scores. This affirms the benefits of measuring PSI using a latent variable measurement strategy over the more straightforward but less appropriate method of averaging indicators.
Conclusion
The comparative study of PSI currently lacks a comprehensive measure of the concept, which has limited the formulation of unified understandings of PSI’s role in democracies. This article fills this gap by constructing a novel measure of the concept that covers 96 post-WWII democracies, addresses extant measurement issues, and has demonstrated validity. Importantly, the measure exhibits robust empirical associations with numerous outcomes that are linked to the performance of democratic institutions, and should contribute to more systematic and encompassing studies of the relationship between PSI and democracy.
Although there is still much to be learned about this relationship, there is another strand of research on PSI that generally remains unexplored. Most of the PSI literature focuses on democracies, but the rise of authoritarian regimes that incorporate interparty competition means that PSI could have meaningful implications for regime performance even in non-democratic contexts (Kim et al., 2022). Moreover, the patterns of interparty competition developed during past authoritarian regimes could cast long shadows that continue to shape the party system after democratization (Hicken and Kuhonta, 2015; Riedl, 2014). However, given disjointed efforts to measure PSI in democracies and the increased difficulty of gathering comparative party system data in autocracies, it is unsurprising that there is no comprehensive measure of the concept that extends to non-democratic regimes. Nonetheless, the measurement strategy presented in this article could be expanded to cover non-democratic regimes, and the subsequent measure could facilitate the development of holistic theories about the long-term causes and consequences of PSI across regime types and regime transitions.
Supplemental Material
Supplemental Material - Measuring party system institutionalization in democracies
Supplemental Material for Measuring party system institutionalization in democracies by Wooseok Kim in Party Politics.
Footnotes
Acknowledgements
I would like to thank Fernando Casal Bértoa, Christopher Fariss, Robert J. Franzese, Laura Gamboa, Allen Hicken, Woojin Kim, Walter Mebane, Anja Neundorf, Yuki Shiraito, George Tsebelis, Fabricio Vasselai, and participants at Michigan’s Comparative Politics workshop and MPSA 2021 conference for their helpful comments and suggestions. I am also indebted to Octavio Amorim Neto and Don Lee for sharing their data. Lastly, I am grateful to the editor and three anonymous reviewers for their constructive feedback.
Declaration of conflicting interests
The author(s) declared no potential conflicts of interest with respect to the research, authorship, and/or publication of this article.
Funding
The author(s) received no financial support for the research, authorship, and/or publication of this article.
Supplemental Material
Supplemental material for this article is available online.
Notes
Author biography
References
Supplementary Material
Please find the following supplemental material available below.
For Open Access articles published under a Creative Commons License, all supplemental material carries the same license as the article it is associated with.
For non-Open Access articles published, all supplemental material carries a non-exclusive license, and permission requests for re-use of supplemental material or any part of supplemental material shall be sent directly to the copyright owner as specified in the copyright notice associated with the article.