
Abstract
In recent years, social democratic parties have been confronted with the rise of second dimension issues. These issues often see social democratic parties facing a choice between competing portions of their own electorate. A particularly prominent second dimension issue is that of the EU: should social democratic parties take pro or anti-EU positions? I look at the case of the UK as an instructive example of this debate. I estimate a narrow counterfactual, simulating how the Labour Party’s vote share and seat count would have changed as its position on Brexit changes. I call this counterfactual narrow because I only consider the effect of these position changes on vote choice and turnout, and not any broader consequences. I run two simulations to compare the implications of pure proximity and proximity-categorisation models of vote choice. I generate seat predictions from the simulation results by using Uniform National Swing and Uniform Regional Swing. Broadly, I find that being pro-Remain clearly benefited the party in terms of votes, but that results are more mixed in terms of seats.
Introduction
Politics in the West for the past 10 years or more has been defined by dramatic changes. New ideological dimensions have risen to challenge the salience of traditional issues of redistribution - sometimes outright replacing them. The proportion of graduates in the electorate have increased while the blue-collar working class has decreased in size. Where social democratic parties have suffered, liberal, green, and radical right parties have prospered. If politics across the West has been transformative, nowhere is this more true than the United Kingdom. Brexit has acted as a catalyst for all of these trends in the UK, with the 2019 general election in particular being an election defined first and foremost by the issue of Britain’s EU membership. Yet while the Labour Party’s stance generated much debate, it has thus far provided few answers. I therefore set out to construct a narrow counterfactual simulation of the election to address these debates.
To perform this simulation, I use data from the 17th wave of the British Election Study internet panel (BESIP) and draw on a simulation methodology popular in the spatial tradition of political science research. In this approach, a conditional logit model is run regressing vote choice on voter-party distances on the ideological dimensions of interest. Once the model has been estimated, new data are simulated by changing the party’s position on a given variable and re-calculating party-voter distances. The simulated data are then turned into predicted vote shares by using the parameters estimated in the earlier stage. This allows for simulation of a narrow counterfactual of party vote shares as the party’s position changes (Adams and Merrill III, 1999, 2000; Adams et al., 2005). I call this a narrow counterfactual because I am only considering the effect of changes in the Labour Party’s Brexit position on its vote and seat shares and not on anything else. To estimate seat share from the simulated counterfactual, I utilise both uniform national swing and regional national swing to generate predictions. By doing so, I am able to directly assess the particular strategic claims on both sides of the debate.
I proceed with this paper in five steps. First, I present the dilemma facing social democratic parties by broad, long-term changes in the nature of political competition. Second, I provide contextual information on the 2019 UK general election and discuss its relevance to the wider social democratic dilemma. Third, I discuss the spatial model of vote choice, and introduce the complications of ideological multidimensionality and the UK’s party system. Fourth, I outline my methodological approach. I discuss the use of Aldrich-McKelvey scaling to deal with the twin problems of differential item functioning and placing survey respondents and parties on the same scale. I then proceed to discuss the conditional logit plus simulation approach popular in the spatial tradition of vote choice. I introduce the use of cross-validation methods from the world of machine learning to assess the predictive capabilities of the model. Finally, I discuss generation of seat predictions via uniform national swing and uniform regional swing. Fourth and finally, I present the results of the simulation.
I find that broadly, the evidence of the simulated counterfactual points towards a strategic need for the Labour Party to be a party of Remain. This is in line with past research on how social democratic parties should handle second dimension issues. Points near Labour’s ‘true’ position maximise its vote share and minimise the vote share gap between the Conservatives and the Labour Party. Similarly, a range of points before the mid-point on the scale maximise the Party’s seat share. However, some ambiguity does remain in the results in minimising the seat gap between the Labour Party and the Conservatives. This result joins results in past research papers that show once other components of the voting decision have been accounted for, parties can rarely drastically alter their overall results in terms of spatial positioning. The simulation also goes some way to confirming Downs’ intuitions regarding the role of voter distributions in shaping optimal positioning, even after a large number of complications over and above Downs’ model are introduced.
Social democratic parties in the 21st century
Across the West, the traditional ideological cleavage of economic redistribution has diminished in salience while ‘new’ ideological divides have emerged. These ‘new’ divides cover issues such as globalisation, environmentalism, and multiculturalism. In particular for European politics, the growth and enlargement of the EU has brought issues of nation and immigration to the fore (Hooghe et al., 2002; Hooghe and Marks, 2009, 2018). Broadly speaking, these issue areas have collectively been called ‘second dimension’ issues. Second dimension issues do not only imply new ideological landscapes for political competition. Changes in the nature of ideological competition have been accompanied by changes in the core demographic cleavages in the electorate. Gone is social class as the primary organising principle of Western politics. In its place are divides such as education and age (Ford and Jennings, 2020).
The new electoral cleavages and shifting patterns of ideological division necessarily reshape party competition. If liberal, green, and radical right parties have prospered across Europe as a consequence of these trends, social democratic parties have suffered (Ford and Jennings, 2020). Particular examples stand out: the PS in France, PASOK in Greece, and PvdA in the Netherlands have all seen dramatic declines in their vote shares. These are extreme cases, but all fit a broader trend of social democratic decline. Why should social democratic parties in particular have suffered where other party families have not - or have even prospered? Social democratic parties have struggled with the new landscape of party competition due to a dilemma these transformations present them. Historically, the core constituencies of social democratic parties have been the blue collar working class and graduates. The movement in salience from redistribution to the new second dimension issues - in particular to European unification and immigration - results in these groups changing from natural political allies to natural political opponents (Kitschelt, 1994).
This is because these two groups hold very different stances to one another on the new dimensions of ideological competition. The working class favour socially conservative positions on immigration and the EU while the educated typically take a more cosmopolitan stance (Kitschelt and Rehm, 2014; Hakhverdian et al., 2013). Consequently, it was initially supposed that the reason social democratic parties struggled in the face of the West’s political transformations was their inability to win (or retain) the votes of the ‘losers’ of globalisation (Kriesi et al., 2006, 2008, 2012). However, the picture is not so simple. The raw proportion of votes represented by the blue collar working class in the electorate have declined (Kitschelt and Rehm, 2014), while expansion of higher education has resulted in a sizeable graduate electorate (Ford and Jennings, 2020). Consequently, social democratic parties today are in face dependent on the votes of the highly educated (Gingrich and Häusermann, 2015).
In line with this thinking, and contrary to the early thinking, recent research has found that social democratic parties do not improve their position by taking anti-EU stances (Abou-Chadi and Wagner, 2020). Moreover, research has further found that they perform best by adopting culturally liberal stances alongside investment-oriented economic stances (Abou-Chadi and Wagner, 2019). The debate is however not yet settled. In the case of the radical left, recent research has found that far-left parties benefit from taking anti-EU positions (Wagner, 2022).
The case of the UK labour party’s Brexit dilemma
If the transformations in political competition across the West have been broadly shared between countries, the UK is perhaps one of the most interesting cases. The dramatic pro-Leave result in the 2016 EU referendum profoundly reshaped British politics generally and party competition specifically for several years. Although seemingly not a salient issue in much of the discourse around the 2017 general election, in terms of the broad patterns of vote choice the election could be characterised as a Brexit election (Mellon et al., 2018). Indeed, in the 2017 general election, the Labour Party won a large percentage of Remain voters while the Conservative party won a large percentage of Leave voters (Hobolt, 2018). From the 2016 EU referendum onwards, cultural issues became a core divide in UK politics and therefore in competition between UK political parties (Hobolt, 2018; Mellon et al., 2018).
At the time the election was heralded as the return of a two-party dominated politics due to the large combined vote share of both parties after a long period of increasing third party strength in UK politics (see e.g. Heath and Goodwin, 2017). The Conservative Party had taken an unambiguously pro-Brexit stance, while the Labour Party had opted for a more moderate stance of ‘constructive ambiguity’ rather than appealing directly to its pro-Remain base. The Labour Party’s increased seat and vote share (and the Conservatives’ loss of seats) could initially be argued to represent a vindication of this strategy (Diamond, 2018). However, in reality many Remain voters supported the Labour Party, and despite (or perhaps because of) its ambiguity the Labour Party gained ground in pro-Remain areas and lost ground in pro-Leave areas (see discussion in Sobolewska and Ford, 2020, chapter 10). Insofar as debate on this point exists, it is on the extent to which Brexit was a catalyst for these trends, following longer-term trends towards a divide between ‘cosmopolitans’ and ‘non-cosmopolitans’ (see discussion in Jennings and Stoker, 2017; Hobolt, 2018; Mellon et al., 2018).
More change was yet to come. As the Brexit negotiations were increasingly drawn out, it became increasingly salient as the primary issue of British politics. This was perhaps a unique moment: in few other countries has European integration been so salient in this manner. Several rounds of failed attempts at passing May’s version of Brexit or to reach any kind of compromise in parliament had deeply damaged the Conservatives’ image among Leave voters. The Labour Party meanwhile had lost much of the trust of Remain voters, with Jeremy Corbyn’s personal popularity plummeting from its peak in 2017 - plausibly in part due to a lack of a firmly pro-Remain stance on his part. This culminated in the 2019 EU parliament elections which Britain originally should not have participated in. In these elections the Brexit party came first, while the Liberal Democrats came second and the Greens fourth but not too distant from the Labour Party. The election was a disaster for both main parties, with Remain voters opting in large numbers for the Liberal Democrats and the Greens and Leave voters opting for the Brexit Party (Cutts et al., 2019).
In response to these results, the two parties took different approaches. The Conservatives replaced Theresa May with Boris Johnson, who as the most prominent backer of Vote Leave had clear pro-Brexit credentials. The Labour Party by contrast was less drastic in the changes it pursued, adopting a more clearly pro-second referendum stance - albeit one where Jeremy Corbyn would not take a stance during the second referendum. Like May, Johnson failed to get his Brexit deal past the parliamentary deal past the arithmetic of the hung parliament, so instead called a general election to pass his deal. During the 2019 General Election, the primary issue at stake was Brexit, but economic issues remained important.
These shifts were not uncontroversial within the Labour Party. Where Corbyn himself had favoured the prior stance of ‘constructive ambiguity’, the Shadow Chancellor John McDonnell and Shadow Brexit Secretary Keir Starmer had both at this point come to favour a pro-second referendum stance (Pogrund and Maguire, 2020). These divisions were not necessarily new. Prior to becoming leader, Corbyn was known to hold Eurosceptic stances, and due to his lukewarm support for the Remain campaign in 2016 he faced a great deal of criticism that culminated in a leadership challenge against him. Corbyn and many of his key advisers favoured Labour’s 2017 stance of ambiguity, while many other key leadership figures and the wider membership of the party were typically pro-EU (Diamond, 2018; Pogrund and Maguire, 2020).
Although in no small part an ideological debate, many of the terms of the debate were framed in terms of strategy. Those favoured a pro-Remain stance argued that Labour’s core vote was those in favour of Remain and that the party was doomed without this vote base. By contrast, those favouring a pro-Leave stance argued that the distribution of voters across constituencies meant that it was more important to target pro-Leave voters in marginal constituencies. The debate was then a clear mirror of a wider dilemma facing all social democratic parties: how to respond to new ideological divisions along nationalist versus cosmopolitan lines? Yet the UK case brings three unique factors. First, issues such as the EU and immigration are so tightly intertwined in the UK as to be essentially the same issue dimension. Second, in the 2019 general election there is a clear ‘second dimension’ issue in the form of EU integration as the primary issue of political competition. Third, the UK’s electoral system distorts results in a manner that influences the dilemma the UK Labour Party faces, as compared to other social democratic parties.
Answering the question of optimal Labour Party strategy in terms of Brexit in the 2019 general election therefore carries a relevance to the wider debate. Most social democratic parties contend with conditions where second dimension issues may be more or less salient, but not so clearly and unambiguously the primary issue of political competition as in the 2019 general election. The UK’s first past the post electoral system arguably makes it the most important test-case for the notion that social democratic parties need to focus on non-cosmopolitans: if this is not true where the electoral geography weights strategy in this direction, where is it true? For all these reasons, understanding how the Labour party might have (failed to) improve its position in terms of Brexit is relevant to the wider debate on social democratic parties and their strategies on second dimension issues.
Theory
In this section I discuss the spatial model of vote choice which I use to build the counterfactual simulation around which this paper is centred. I begin by discussing the spatial model of vote choice in its simplest, two-party and one-dimensional form before introducing additional complications.
Spatial theory
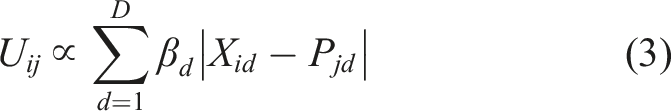
Spatial models of vote choice are a formalisation of a simple intuition, which is that voters prefer to vote for (and see elected) the political party ‘closest’ to their own views. In these models, ideological viewpoints are arranged along a numerical dimension (e.g. left-right) and parties and voters are placed along this dimension (see Downs, 1957a, 1957b). To make their voting decision, voters then make a utility calculation, which can be expressed in a general form as


An important early contribution to the spatial vote choice literature was a rejection of the median voter theorem by Downs. Early work on spatial vote choice had suggested that where two parties competed on the ideological dimension, as rational actors they would converge to the position of the median voter (Hotelling, 1929; Black, 1948). However, Downs rejected the median voter theorem by introducing the possibility of non-voting. In Downs’ model, if both parties are far in distance from a given voter, then they have less reason to vote and thus will abstain (Downs, 1957b, 142). It follows from this that the best position for the two political parties is conditional on the distribution of voters along the ideological spectrum. If normally distributed, the parties will converge to the median voter. However, if bi-modally distributed, the parties will move away from each other and towards the two poles (Downs, 1957a, 1957b). The result of the median voter theorem therefore does not hold. It follows that our expectations for the optimal Brexit position for the Labour party will be conditional on the distribution of voters along this ideological dimension.
Several additional, overlapping complications for the general spatial model exist beyond merely the prospect of non-voting. I have broadly if somewhat arbitrarily divided these between extensions of spatial theory, specific theoretical considerations arising from the UK electoral system, and behavioural theory. The first of the extensions of spatial theory is the existence of multidimensional political ideology. A broad trend in political science over the past decades has dealt with various means of conceptualising new ideological cleavages in the electorate (see Ford and Jennings, 2020) and how challenger political parties have emphasised previously ignored issues (see Hobolt and De Vries, 2015). Including multiple dimensions within vote choice is straightforward, as parameters on the distances can be included representing the salience of a given ideological dimension
More complicated to consider - especially in a simulation context - is the fact that parties may attempt to introduce previously ignored issues to destabilise a previously unfavourable equilibrium. A fundamental result in formal theory is that equilibrium cannot be guaranteed once parties are given this ability (McKelvey, 1976, 1979). However, the fact that it is not guaranteed does not mean that it is not common for equilibrium to exist (Armstrong et al., 2020). For the purposes of the simulation of this paper I therefore make the simplifying assumption that counterfactual changes in party positions in the 2019 UK general election would not have introduced any changes in issue salience. In other words, as discussed above the two ideological dimensions at play in the election were economic issues and Brexit.
The second extension of spatial theory to discuss is that of categorisation theory. While categorisation itself is a theory of mental processing with a long pedigree, a comparatively recent paper introduced it to the realm of voters’ understanding of ideological space (Bølstad and Dinas, 2017). In short, voters perceive political ideology - and the relationship of political parties to it - through ‘coarse categorisations’. One example would be left-right: most voters will see parties as ’left’ or ‘right’, with finer spatial distinctions mattering more for choosing between multiple parties on the same side as the voter.
Brexit in spatial theory
Before proceeding, it is worth considering how the notion of ‘Brexit’ fits into spatial theories of vote choice. The EU referendum was binary - in or out. Subsequent debate remained ideologically polarised between a Remain camp and a Leave camp. It is important to set out therefore how a continuous dimension of preferences would have plausibly existed. First, it is broadly clear that while the choice facing voters was often binary, it does not follow that their preferences necessarily were. In discrete terms, some voters may have wished for a unified European state, while others wished for a soft Brexit in either the single market or customs union (or both). Others still would have favoured the status quo, or perhaps an even harder Brexit with no trade agreements in place.
It is not much of a stretch of the imagination to broadly conceive of a continuous dimension underpinning any discrete preference, where each individual has a preference on how closely aligned to the EU the UK would ideally be. Whether that preference was at any point a plausible option is not relevant to the existence of such a preference. Such preferences would have sorted voters into their primary categories, but would nonetheless still exist after this sorting.
Of course, the binary nature of both the 2016 EU referendum and subsequent debate would have likely had a role in the way these preferences fed into the wider debate. There is strong evidence that UK voters possess strong Brexit identities that likely shape voters’ perception of political space (Hobolt et al., 2021). It may therefore be reasonable to expect a strong categorisation effect in terms of vote choice. Categorisation is still a form of spatial theory - perceptions of whether the party is still on the same side as the individual or not. But it seems plausible that the effect of EU preferences in the 2019 general election are strongly expressed through categorisation.
UK electoral system
Like any other, the UK electoral system brings its own particular strategic considerations for both voters and political parties. First among these is the single-member plurality (SMP) voting system. In SMP, voters must weight their preferences against the probability of their preferred party actually winning. Often, voters vote strategically for a less-preferred party. It is therefore necessary to consider how likely a party is to win in a given constituency. For political parties however, SMP means that the best ideological position can be distorted by electoral geography. This is because if voters are not distributed randomly, but instead concentrated and dispersed in particular ways, this can separate the tasks of vote maximisation and seat maximisation. In practice, since center-left voters are typically concentrated in cities, electoral geography in SMP tends to skew results to the right (Döring and Manow, 2017). This is the abstract version of the argument made for a shift in a more pro-Leave direction for the Labour party described above.
An additional consideration for party strategy in the UK context is the third parties. Until now my theoretical discussion has focussed on the two-party case and I have introduced additional complications to this straightforward competition. However, in the 2019 UK general election several additional parties represented additional key actors: the Liberal Democrats, the Greens, the Brexit Party, Plaid Cymru, and the SNP. In terms of the latter two, in the simulation I consider only English voters.
This is because Wales and Scotland introduce an additional issue dimension in the form of nationalism versus unionism. This is especially pronounced in the case of Scotland, where the Labour Party is itself a de-facto third party. England represents the largest constituent nation of the UK by far and elections are broadly decided there, meaning that ultimately the simulated counterfactual should remain reasonably informative. Similarly, there is an entirely different party system in Northern Ireland, where the UK Labour Party does not even stand.
Broadly, these parties should make it harder for both of the main parties to move away from their core voters, as such a move becomes riskier as they no longer need only be concerned with the threat of non-voting. In this particular case, the Liberal Democrats and Greens represent competition on the Remain side of the debate, while the Brexit Party represent competition on the Leave side. Given the reliance of the Labour Party on the Remain voters and the Conservative Party on Leave voters as of the 2017 general election, we might imagine that these smaller parties force the Labour and Conservative parties to take clearer pro-Remain and pro-Leave stances respectively.
Non-policy variables
So far, in this theoretical discussion I have emphasised the effect of spatial distance and categorisation in vote choice. However, non-policy issues also have an effect on vote choice and there are clear explanatory benefits to integrating both approaches in modelling vote choice (Adams et al., 2005). First, vote choice is in practice often habitual. Even in times of increased voter volatility (Fieldhouse et al., 2021, see), Voters often end up voting for the same party as they did in the previous election. Relatedly, many votes will have varying degrees of partisanship with respect to the political parties. They may identify with one of the parties, will like the parties to varying extents, and will like the parties’ leaders to varying extents. Finally, while it is reasonable enough to acknowledge that voters prefer to choose a party closer to their own views, and that voters vote strategically in SMP systems, these phenomena are not necessarily captured in the preceeding discussion.
However, failing to take these variables into account in modelling vote choice may carry consequences for the results of the simulation. This is because these variables alter the strategic options available to the political parties, as for each party they break voters into groups likely to vote for that party, and groups unlikely to vote for that party before policy dimensions are ever taken into account. Parties must therefore seek the votes of these voters specifically, and alter their policy strategies accordingly (Adams et al., 2005). In the specific case of Brexit, this may produce a large amount of pressure on the Labour Party to stay on the side of Remain, and vice versa for the Conservatives, due to the pre-existing Remain-Leave division as of the 2016 EU referendum.
Data and methodology
With the contextual background and theoretical considerations for the simulation established, I now turn to the dataset and methodology for the counterfactual simulation.
Data
In this paper I use the 17th wave of the British Election Study Internet Panel (BESIP) as a cross-sectional dataset (Fieldhouse et al., 2020). The English subsample of this wave used in this paper contains 22,657 respondents. This wave was the pre-election wave for the 2019 general election collected in November 2019. I use this wave primarily to reduce of threat of reverse causality as for the dependent variable of the analysis I use vote choice in the actual election. To capture the two ideological dimensions of economics and Brexit at play in the election, I use two of the perceptual scales available in most BESIP waves in the form of the redistribution and EU integration scales. These are 0–10 self placements and placements of the political parties by respondents with the following item wordings: • •
I choose these as reasonably close approximations to the ideological dimensions at play in the election. The redistribution variable should reliably capture economic differences in voters and parties, while the EU integration variable should proxy for Brexit positions. I do not use a traditional Left-Right variable because the interpretation of this likely does not so much capture a specifically economic dimension as a mix of the most salient dimensions. For the purposes of this paper, these dimensions are thus more usefully parametrised separately.
Methodology
To construct a simulated counterfactual of how the Labour Party would have performed with different Brexit positions, I proceed in four broad steps: 1. Scale voter and party positions 2. Run model for spatial vote choice 3. Simulate new results based on different Brexit positions for the Labour Party 4. Generalise the results from survey sample to England-wide
Scaling voter and party positions
For the first step, I use Bayesian Aldrich-McKelvey scaling to rescale the voter and party placements (Hare et al., 2015). Aldrich-McKelvey scaling is a method used to correct differential item functioning and rationalisation bias in placements of external stimuli such as political parties along a given ideological dimension and thus to recover a corrected placement for each stimulus (Aldrich and McKelvey, 1977). The parameters recovered can then be applied to respondent self-placements to recover corrected respondent placements on the same ideological dimension as the external stimuli. Bayesian Aldrich-McKelvey scaling improves on the previous iteration of the model by allowing missing data in respondent placements of political parties. This is because the model follows a Bayesian approach to missing data, wherein missing data are treated as parameters to be estimated (Jackman, 2000; Hare et al., 2015). I therefore retain all respondents who reported placements for at least 3 of the 5 parties in BESIP. This has the benefit of reducing data loss in the scaling stages, particularly as data loss here would skew the sample towards more political informed survey respondents. For each model, ten-thousand burn-in iterations were run across two chains. After that, five thousand draws were taken to construct the posterior distributions.
Spatial vote choice
To estimate a model of spatial vote choice, I take a conditional logit approach. The conditional logit model has a close relationship with multinomial models, but instead models a binary variable denoting whether chooser i opted for outcome j of J outcomes or not. Where multinomial logit models choice outcomes as a function of chooser characteristics, conditional logit models choice outcomes as a function of choice characteristics. Substantively, this means I am able to model vote choice (whether individual i voted party j) as a function of party characteristics (such as voter-party distance on a given dimension). This also constrains each variable to have a single parameter - the average effect of distance on a given dimension will be the same across parties. As in multinomial models, this does mean that individual nuances are ignored (i.e. the relative salience of a dimension is not allowed to differ for two voters). However, differences between voters in salience should broadly cancel one another out and so the average effect should be sufficient to estimate the narrow counterfactual.
I estimate two sets of models - one proximity model with distances on the redistribution and Brexit dimensions, and one proximity plus categorisation model. For the categorisation model, I use the 0 point on the rescaled data to determine whether a voter was on the same ‘side’ on a given distribution as the party or not. There is some arbitrariness in this as the rescaled data are interval and not ratio scale, meaning that the 0 point is not necessarily a meaningful one. However, the stimuli positions are constrained to be mean 0 and so the position should nonetheless be close enough to wherever the meaningful center point would be that this is a reasonably good approximation. I further include several controls in both models, including respondent perceived probabilities of the party winning in their constituency, whether the respondent previously voted for that party, whether the respondent identifies with that party, respondent likeability ratings for the party, respondent likeability ratings for the party leader, and party dummies. Most of these control variables follow on from the preceding discussion and as they are straightforward binary variables do not require further explanation. The use of party dummies has a long pedigree in the spatial tradition, fulfilling a definition of valence as ‘everything that’s not spatial’. I further included the like data and probabilities to better decompose this, with party dummies therefore acting as a baseline for the likelihoods of that party being chosen.
Some further notes should be made explicit for some of the control variables. For the like data, to prevent missingess a value of ‘5’ was imputed into the 0–10 scales where missing data occurred. This value was chosen as a reasonably good guess as to how someone without a strong opinion on a given party or leader might have responded if forced. The like data were regressed on the recovered ideology values for respondents; and predicted errors from these regressions were used. This is because prior to this the like data will be driven in part by spatial preferences - using the error terms from this regression partials the spatial component of like scores away. The like scores for the Green party leaders were averaged into a single score at the end of this process. For the Brexit Party, I treated past UKIP voters as past Brexit Party voters given the continuity between the two parties.
Non-voting was included in the model as an additional choice alongside the five parties. For most variables, the value for this choice was set to 0. The exceptions were that respondents who did not identify with any party were set to identifying with non-voting as a choice and those who previously did not vote were set to this being their previous choice. With these two exceptions, the dummy for non-voting then becomes a sort of threshold which the other choices must overcome if the respondent is to turnout - meaning that turnout patterns will change as the Labour Party’s Brexit position changes. This modelling approach treats non-voting as occurring through alienation - when no party is sufficiently attractive to the voter in question. This is in contrast to another possible modelling approach I do not pursue here, where non-voting could occur through indifference, expressed in utility terms by two parties being too close to one another.
Brexit position simulation
Once the models were estimated in the previous step, I turned to the task of predicting choice probabilities across a range of positions for the Labour Party. While this prediction approach to counterfactuals has long existed in the spatial tradition, I adopted a cross-validation approach to modelling the data in the previous stage. I split 60% of the data into a training sample and 40% into a test sample. I ran the conditional logistic models on the training sample, then verified that both models reliably predict the correct vote shares for the test sample. Once this was verified, I proceeded with the simulation step. Here, I simulated new positions for the Labour Party from −2 to 2 on the Brexit dimension (covering the vast majority of respondent positions) over steps of 0.01, recalculated the relevant party-voter distances and categorisations, then predicted new results from both models. I do not perform steps of 0.01 because such a step-size would have a meaningful real-world analogy, other than the party’s own EU preferences in terms of closeness or distance. The purpose of the simulation is to offer a sense of how the result may have changed as the Labour Party becomes more or less pro-EU integration - no more and no less.
Generalisation
While step 3 is sufficient to learn what position would have been best in terms of maximising vote share it does not answer questions regarding seat share maximisation. Resolving this is crucial to addressing arguments that suggested the Labour Party’s best strategically optimal position would have been. I therefore generalise the simulated results from step 3 by utilising Uniform National Swing and Regional National Swing to predict seat shares based on these results.
Analysis
Bayesian Aldrich-McKelvey scaling
Figure 1 shows density plots of the rescaled redistribution and EU integration scales from BESIP wave 17. The vertical lines overlayed on the density plots represent the median positions of the political parties from their posterior distributions. These points were used to calculate the distances in the conditional logit model. For four of the five parties, the lines were coloured using the party’s colours.
1
The exception is the Brexit Party, for which purple was used to better differentiate it from the Conservative blue. On the redistribution plot, the Brexit Party line was dashed as its position was so close to the Conservatives’ as to be overlapping on the plot. Ideology distributions.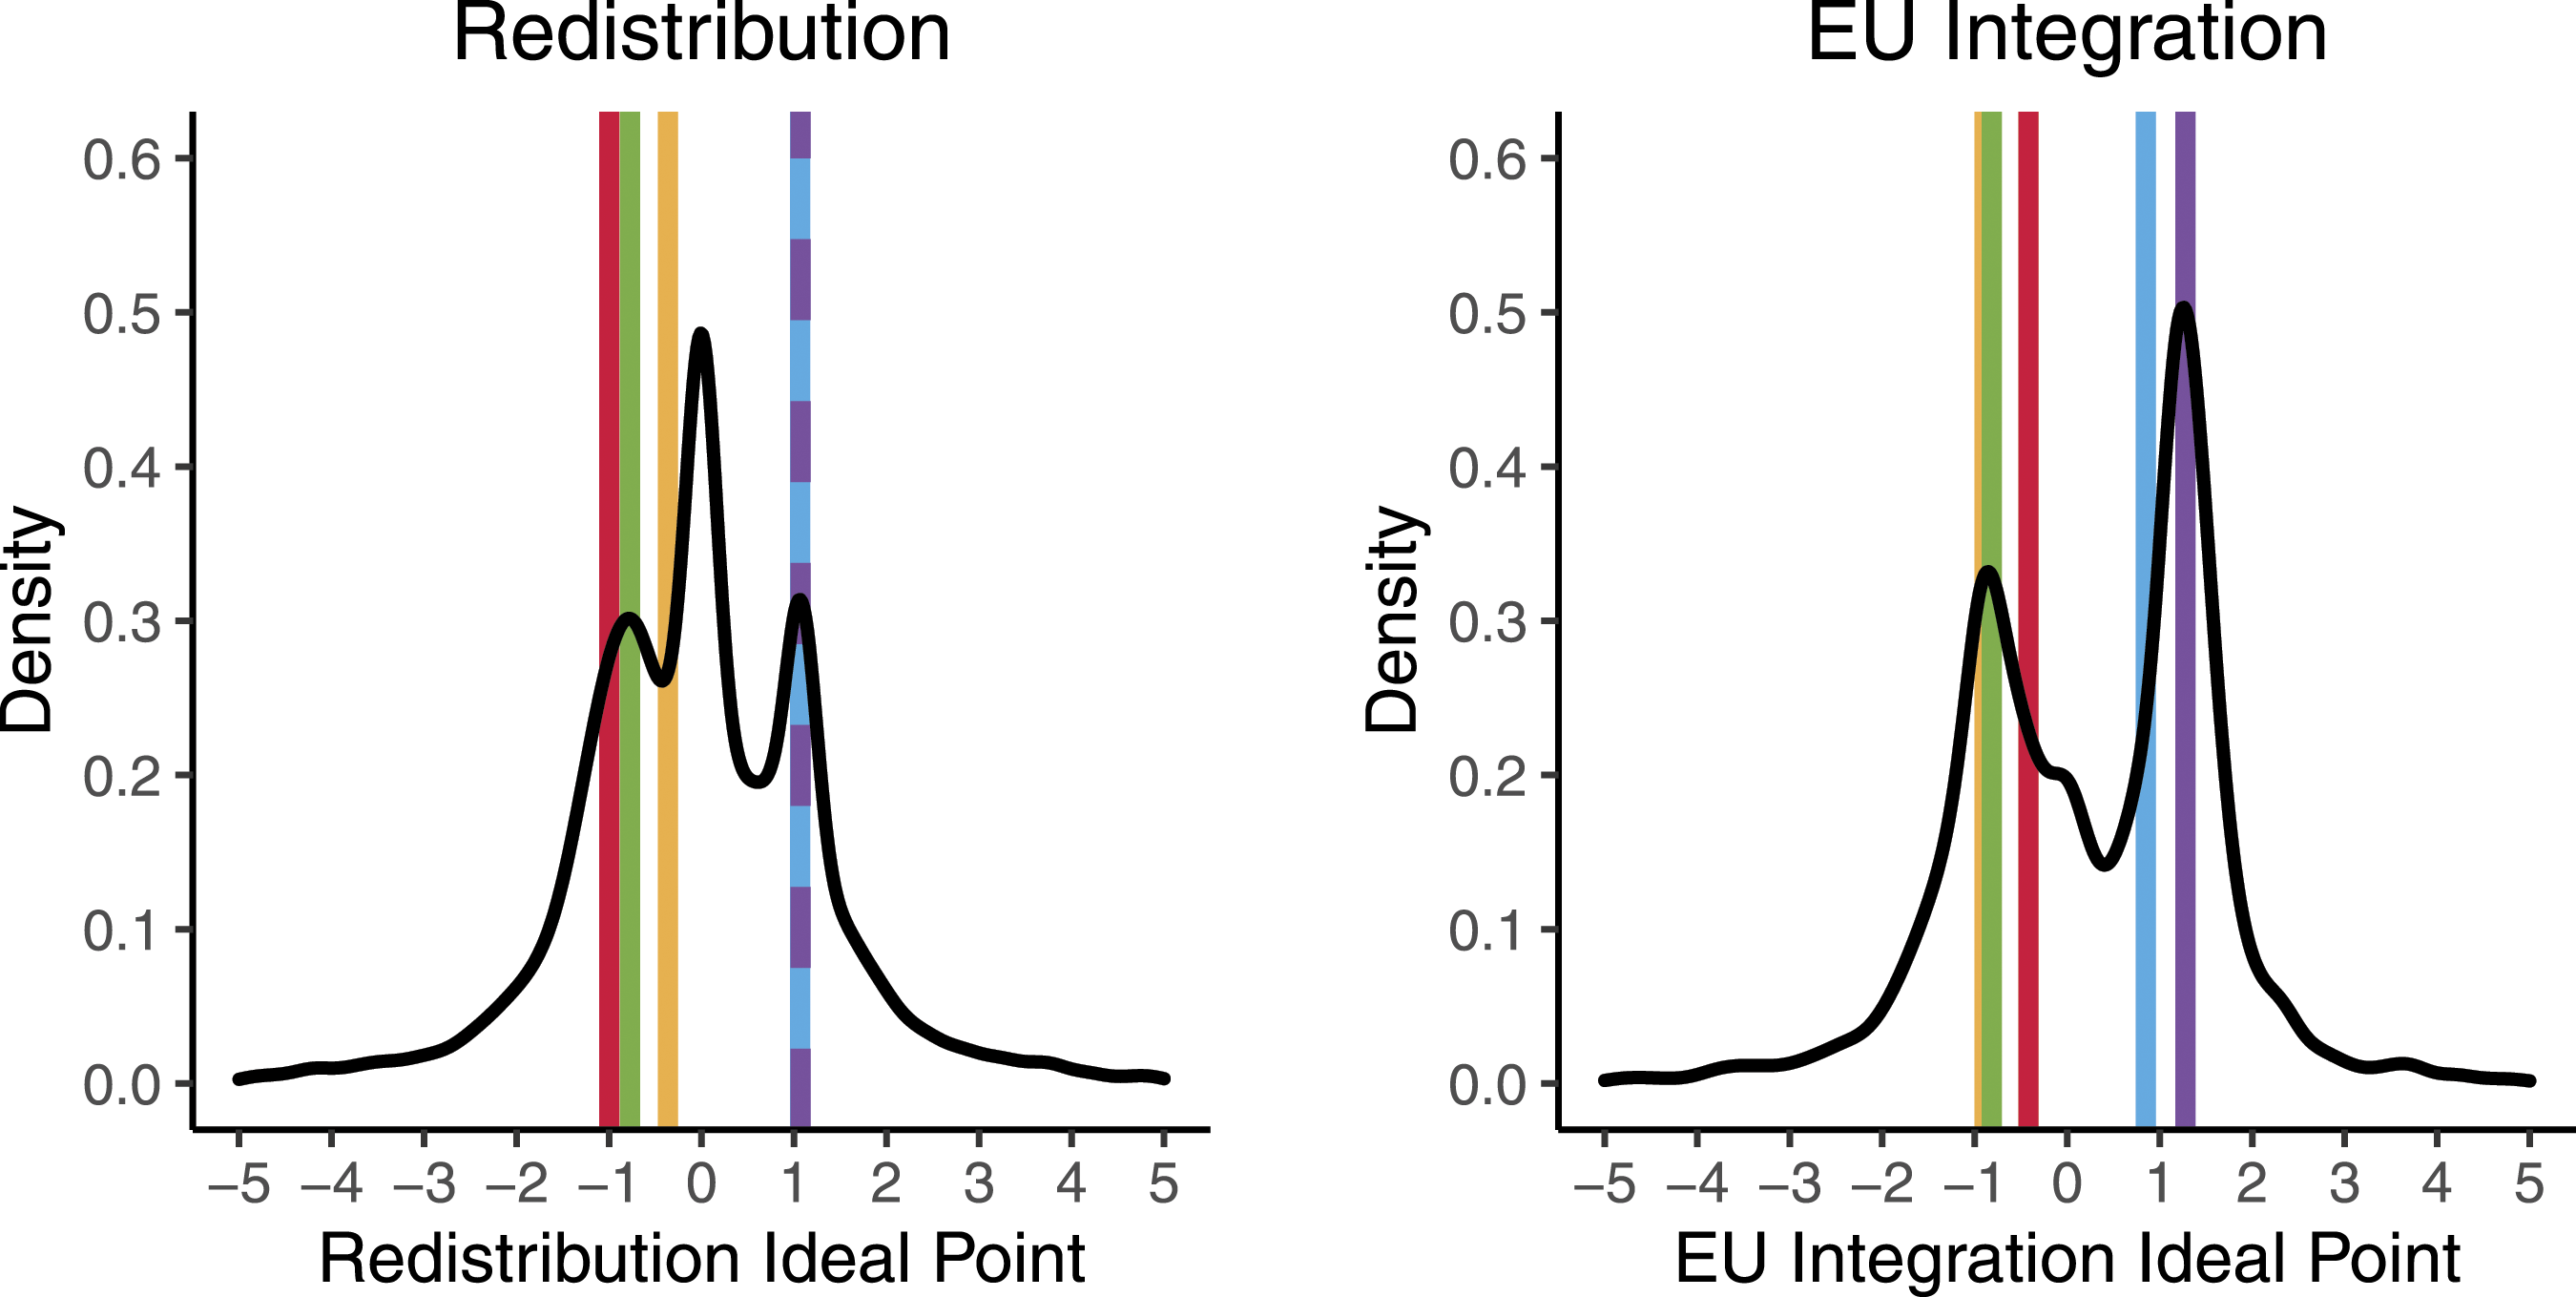
The black line corresponds to the density of the estimated respondent ideal points. The vertical lines represented the estimated locations of the political parties on these scales and are coloured according to political party. The exception is the Brexit Party, which is coloured as purple to better differentiate it from the Conservative Party.
Some clear differences between the distributions of the rescaled redistribution and EU integration variables are made visible by the plots. The redistribution variable has three peaks, but they are close to one another and there is a clear central tendency in-between the parties of left and right. By contrast, there is a clear dip in-between the Remain and Leave parties on the EU integration scale. In the redistribution plot, the Labour Party emerges as the most pro-redistribution, closely followed by the Greens. The Liberal Democrats are reasonably centrist (albeit appearing center-left), while the Conservatives and Brexit Party are equally anti-redistribution. By contrast, the Liberal Democrats and Labour Party essentially switch places in terms of centrism (although still pro-Remain). On the Leave side, the Brexit Party are clearly more pro-Brexit than the Conservatives. Both rank orderings carry a great deal of face validity in terms of the party placements. Similarly, it is unsurprising that the EU integration scale implies a larger divide between voters than the redistribution scale. One implication of this may be that given Downs’ theory, there is more benefit in taking a centrist stance on economics and a more pro-Remain stance on Brexit. Of course, such a prediction can only be made prior to fully accounting for the myriad complications discussed above. In the next sections the survivability of Downs’ claim through increased levels of complexity is therefore tested.
Conditional logit
In Figure 2 I present a coefficient plot from the two conditional logit models estimated. The blue coefficient estimates on the plot relate to the model containing only a proximity component. The red coefficient estimates on the plot relate to the model containing both proximity and categorisation components. 95% confidence intervals are included in the plot. A full table of regression results with all controls is included in the Supplementary Material. Conditional logit coefficients.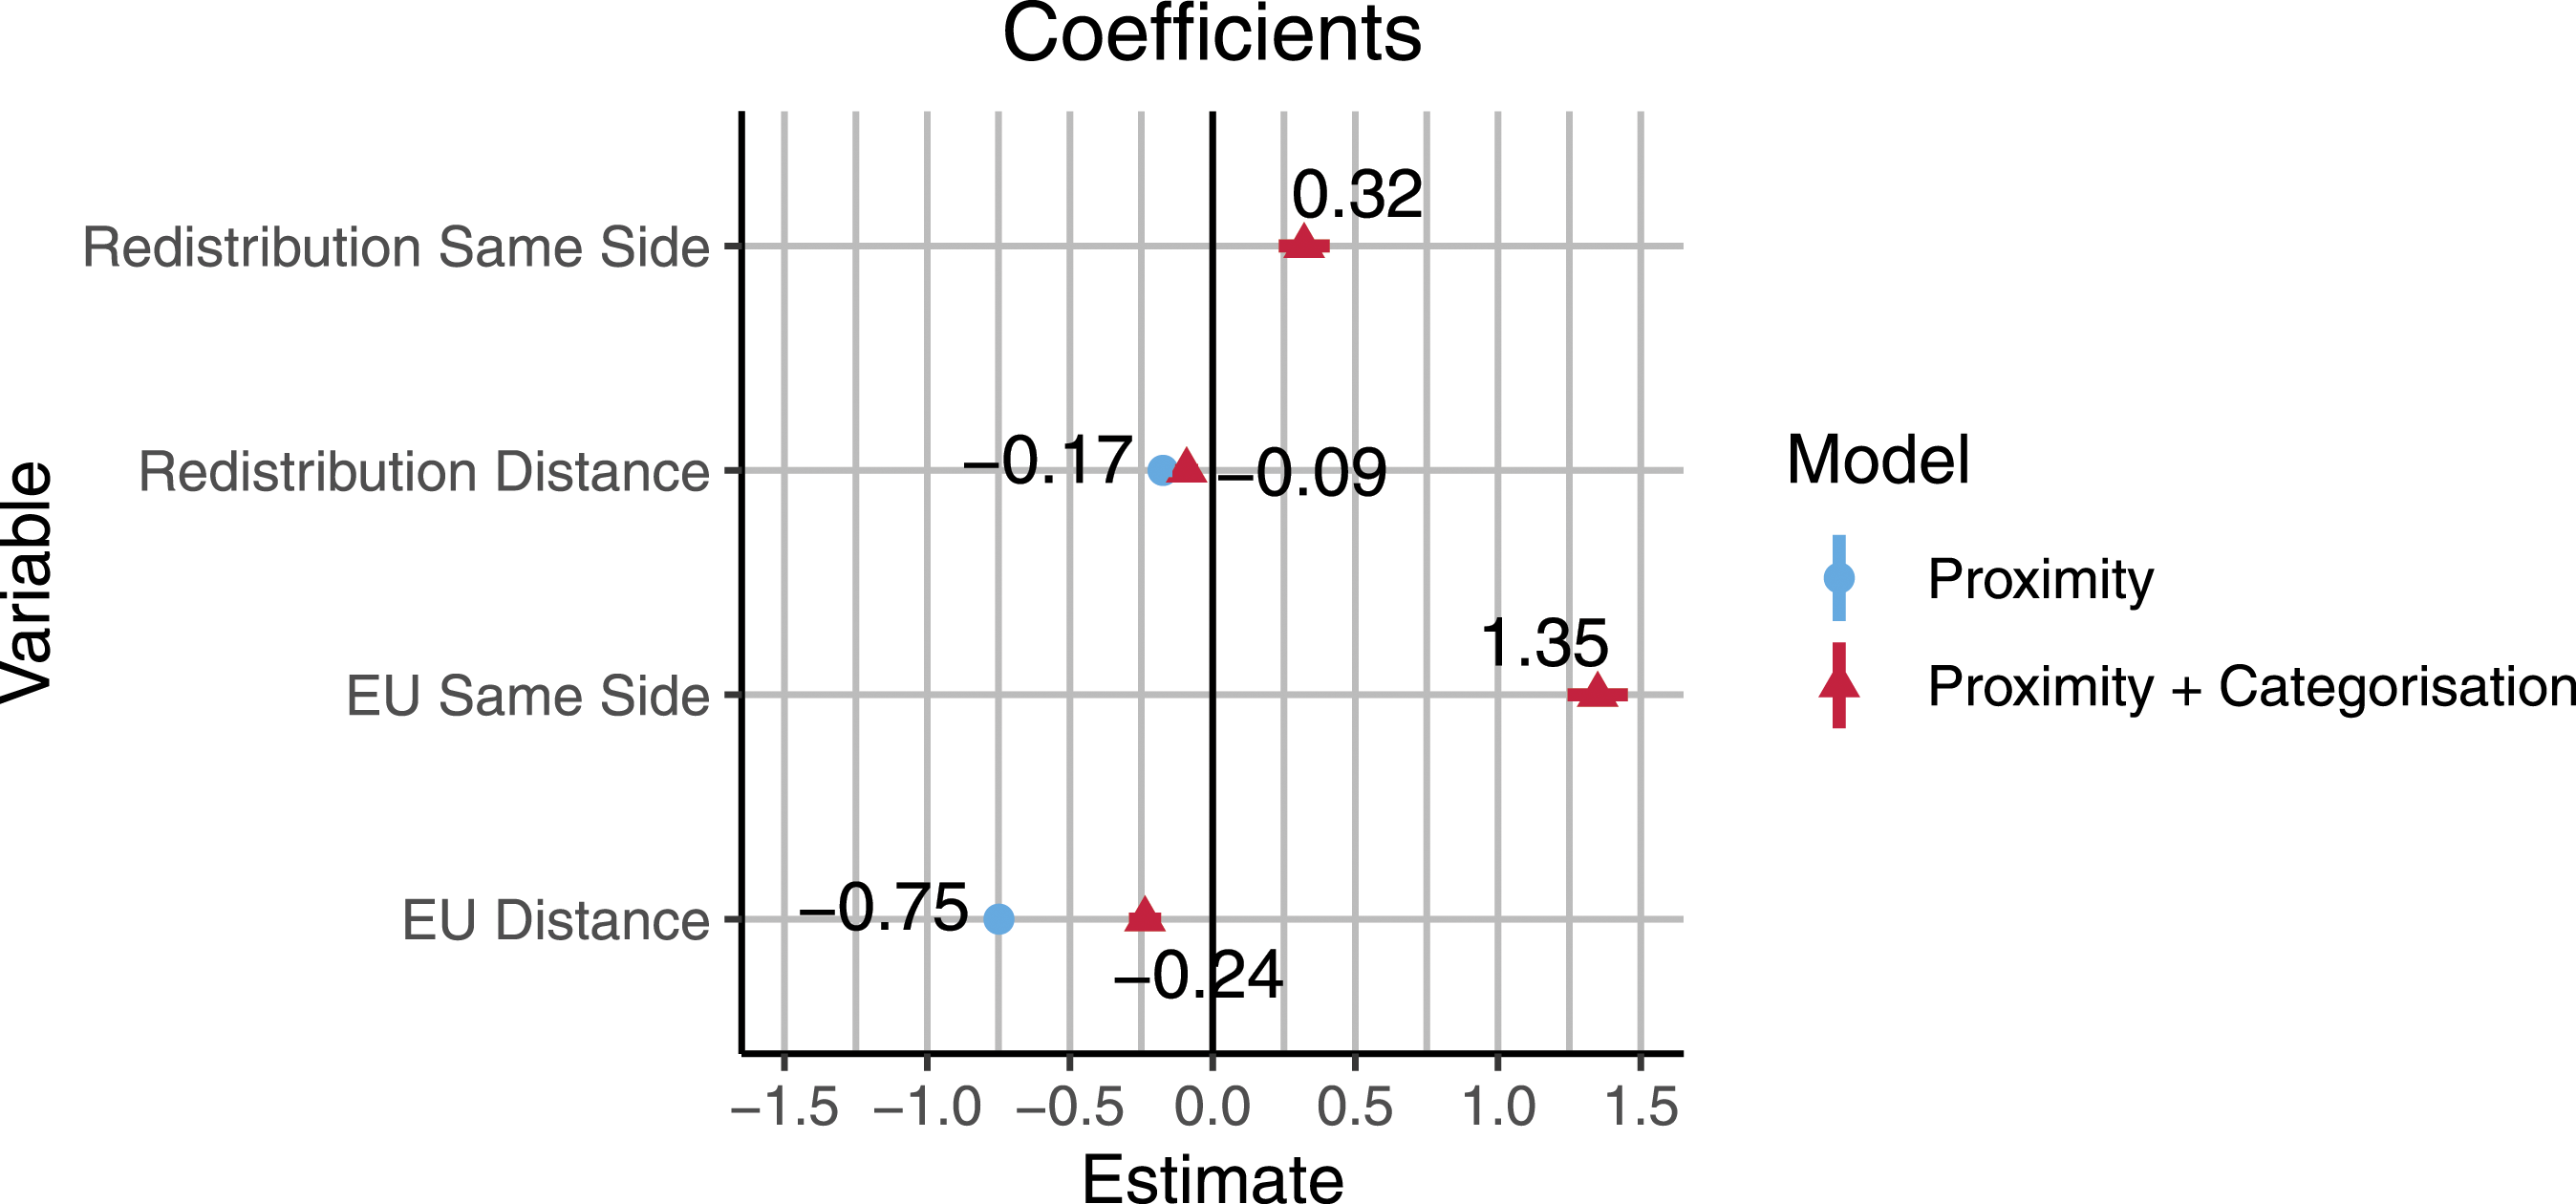
In both models the proximity coefficients for both scales are significant at the 95% confidence level and are negative. The proximity coefficient for the EU integration scale is larger, in line with the fact that the main issue in the election was Brexit. However, the size of the EU integration proximity coefficient varies considerably with the inclusion of categorisation effects. Without categorisation effects, the coefficient is roughly 0.5 larger in the proximity-alone model. The categorisation effects in the second model for both scales are significant at the 95% level and positive, although again in line with the previous model the EU integration categorisation effect is considerably larger than the redistribution categorisation effect.
The main point on which these models corroborate one another is in confirming that the primary issue of the election was Brexit. I do not attempt to choose between the models through any formal testing as their comparison is itself useful. However, it is worth noting two things. First, recent research lies in favour of categorisation theory in vote choice. Second, the large categorisation effect is consistent with an interpretation of Brexit as a binary issue. EU preferences did not need to be binary in their effect - but it seems likely that Brexit it so. The categorisation model is thus likely the closer approximation to reality. Cross-validation results for both models are available in the Supplementary Material.
Simulation
Figure 3 contains plots showing how the party and non-voter shares of the sample change as the simulated value for Labour Party vote share changes. The x-axis shows the simulated Labour Party positions along the BESIP EU integration scale, while the y-axis shows the proportion of respondents. The lines along the plot as before are in the party colours and show how the proportion of choices changes with simulated Labour party positions. The black line represents non-voters. The vertical lines represent 3 separate points. The solid black line visualises the ‘true’ Labour Party position extracted from the Bayesian Aldrich-McKelvey scaling. The red dashed line visualises the simulated position that maximises the Labour Party’s vote share. The blue dot-dash line visualises the position that minimises the difference in the Labour-Conservative vote share. The left plot visualises simulation results for the proximity-only model, while the right plot visualises simulation results for the proximity plus categorisation model. Sample changes in vote share. The horizontal lines represent the estimated vote shares of the political parties in the sample, with the black line being the percentage of non-voters. The vertical lines are various Labour Party positions. The solid black vertical line is the Labour Party’s original position, the dashed red vertical line is the Labour Party’s vote-maximising position, while the dot-dash blue line is the position minimizing the gap between the Labour Party and the Conservative Party.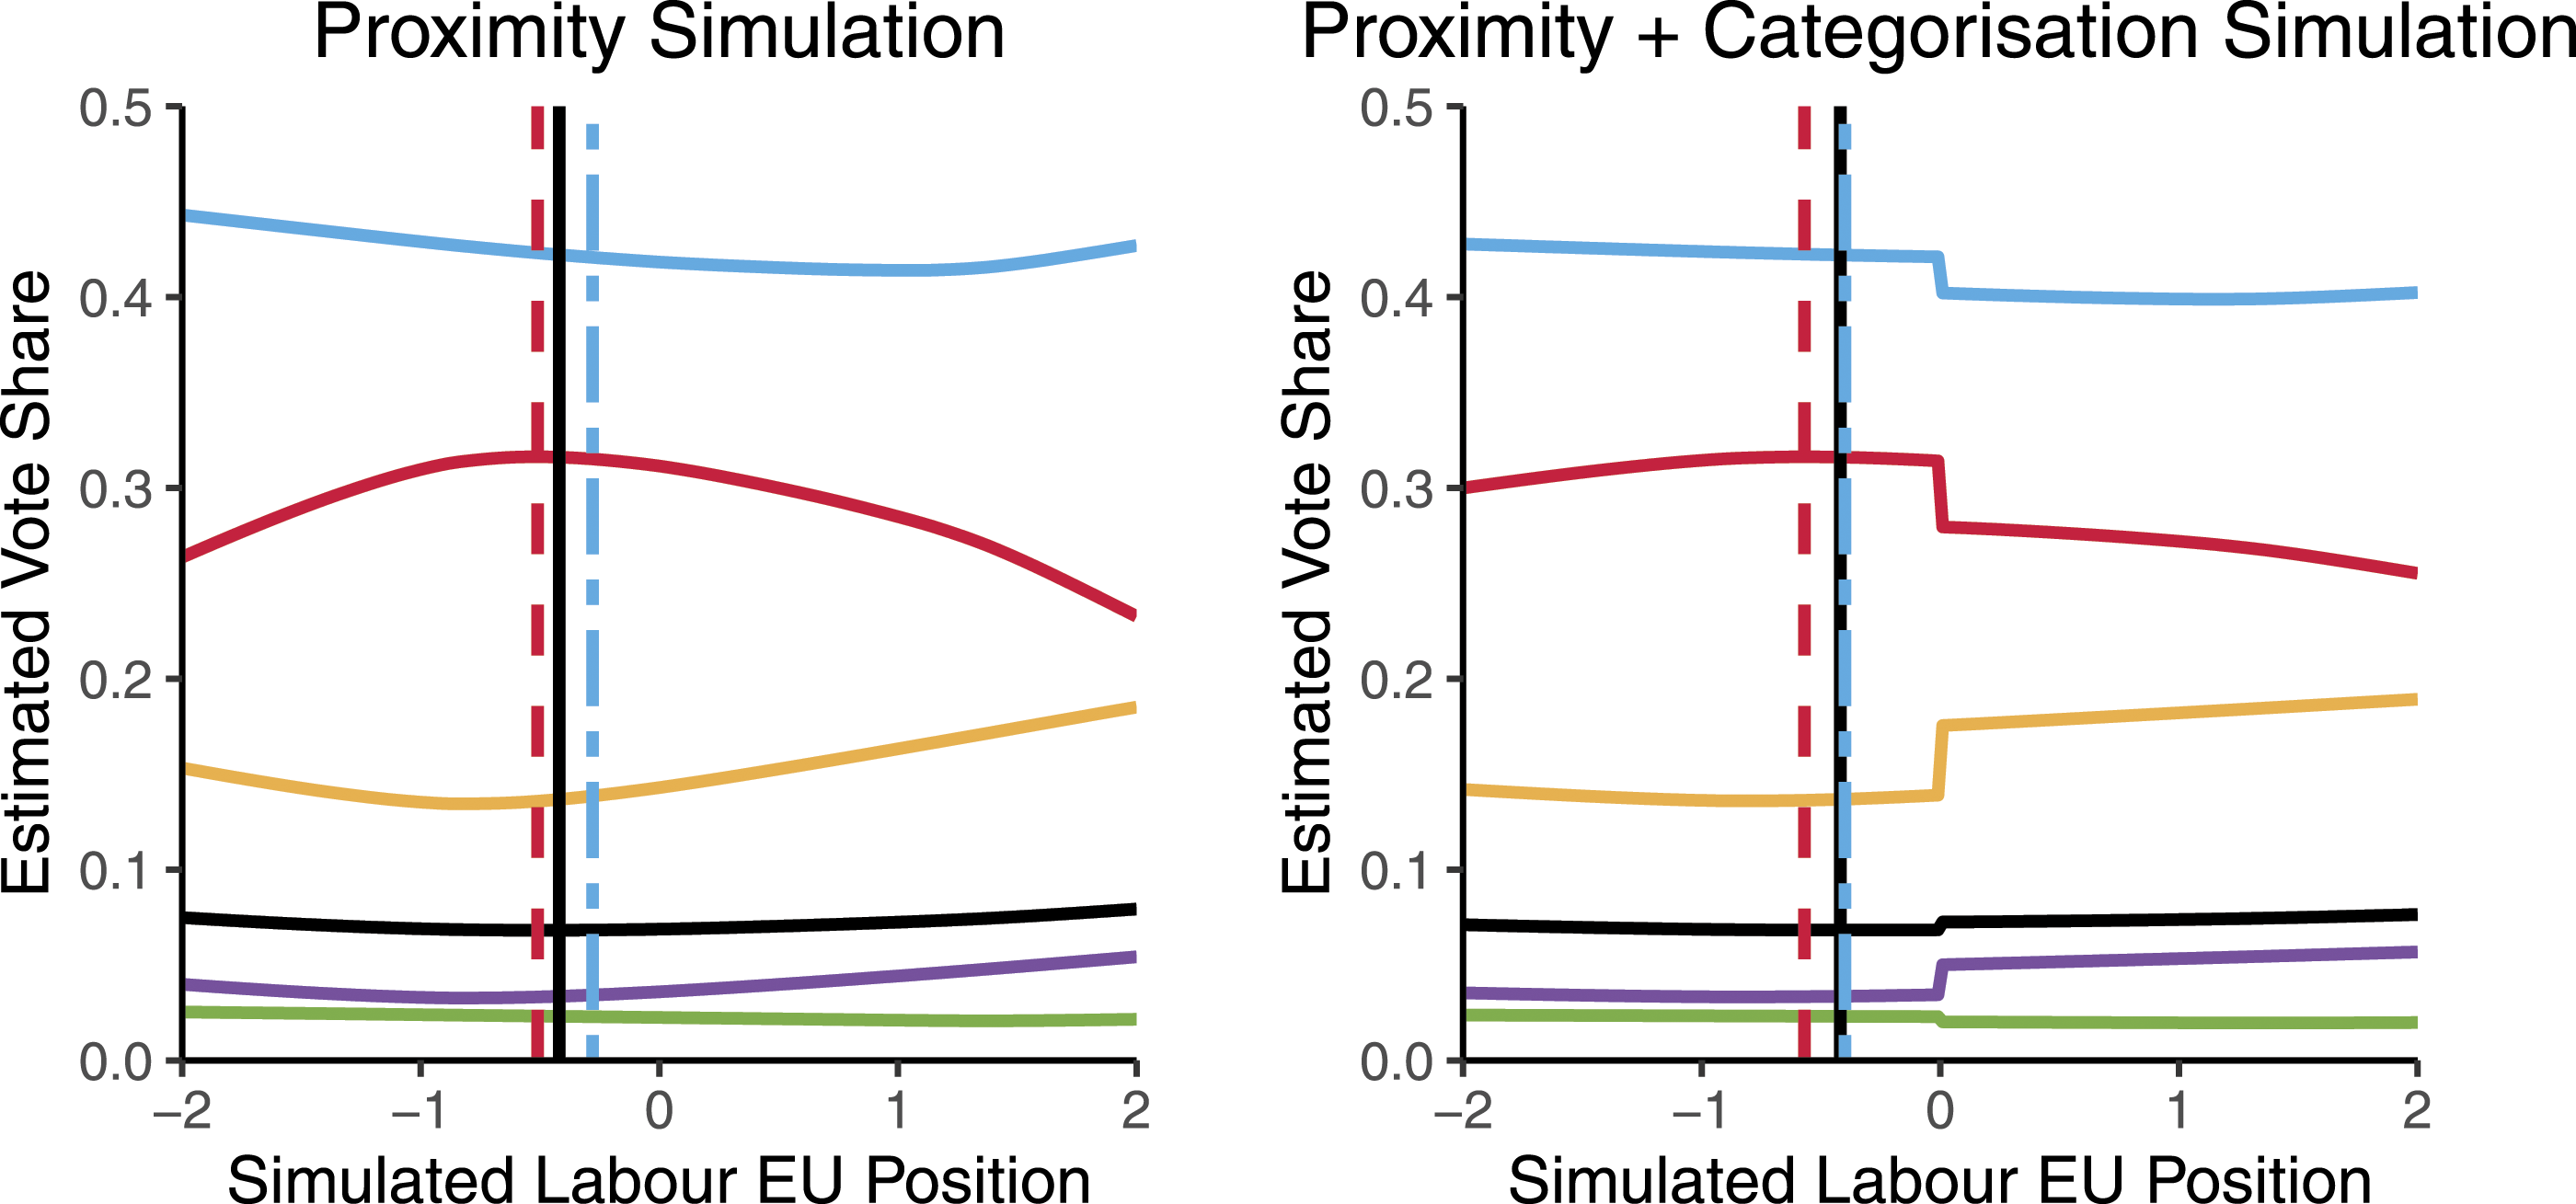
For my primary purpose in this paper, the most salient feature in Figure 3 is the convergence of evidence showing that the Labour Party optimises its vote share broadly by being a party of Remain. In both plots evidence suggests that Labour Party maximises its vote share by being to a small degree more pro-Remain than it was in the election. There is less convergence in the two models regarding the position that minimises the Labour-Conservative difference in vote share with the proximity-only model favouring a marginally more pro-Leave position (though still overall pro-Remain) and the proximity plus categorisation model suggesting that the ‘true’ position was in fact approximately best for the party. However, in all cases the ‘true’ position was not far from the position implied by the simulation to be best for the party’s results.
This is a result that cuts in both directions - both simulations also strongly imply that the party would not have benefited from taking a more pro-Remain position than it had already taken. Some degree of moderation was necessary. Matching the Liberal Democrats’ position on Brexit would not have been beneficial to the Labour Party. Although this point does vindicate the overall position taken by the party, it also suggests that those looking to Brexit policy to improve the party’s vote share were mistaken. In line with recent results regarding centrist parties (see Zur, 2019, 2021), changing the party’s spatial position does not drastically improve performance. A wider implication of my results is that parties can adopt good ideological positions on which they cannot improve - and still lose the election. In both cases, the rank order of party vote shares remains the same throughout the simulations.
Generalisation
While the simulation results broadly confirm Downsian intuitions around a polarised electorate requiring the Labour Party to lean Remain (if not on the mode of that side of the distribution), arguments suggesting the party needed to move in a more Leave direction must be addressed. I utilise both uniform national swing (UNS) and uniform regional swing (URS) to this purpose, so as to again check the extent to which results converge. It is however likely that URS will pick up on regional nuances that UNS does not, so insofar as results diverge it may well be the more accurate reference point for discussion. Figure 4 contains the UNS results. As before, the x-axis contains the simulated Labour Party positions. The y-axis the seats shares of the parties and the lines show the number of seats that party has won. One again the black solid vertical line shows the ‘true’ Labour Party position from the Bayesian Aldrich-McKelvey scaling. The red shaded area shows the range of positions where the Labour Party maximises its seat share while the light blue shaded area shows the range of values where the Conservative-Labour seat difference is minimised. Where these areas overlap, the area becomes a dark blue shade. The left plot shows results for the proximity model while the right plot shows results for the proximity plus categorisation model. UNS changes in seat count. The horizontal lines represent the estimated seat counts of the political parties in the sample, with the black line being the percentage of non-voters. The vertical lines are various Labour Party positions. The solid black vertical line is the Labour Party’s original position. The red shaded area is the Labour Party’s seat maximising range, while the blue shaded area is the range for minizing the seat gap between the Labour Party and the Conservative Party.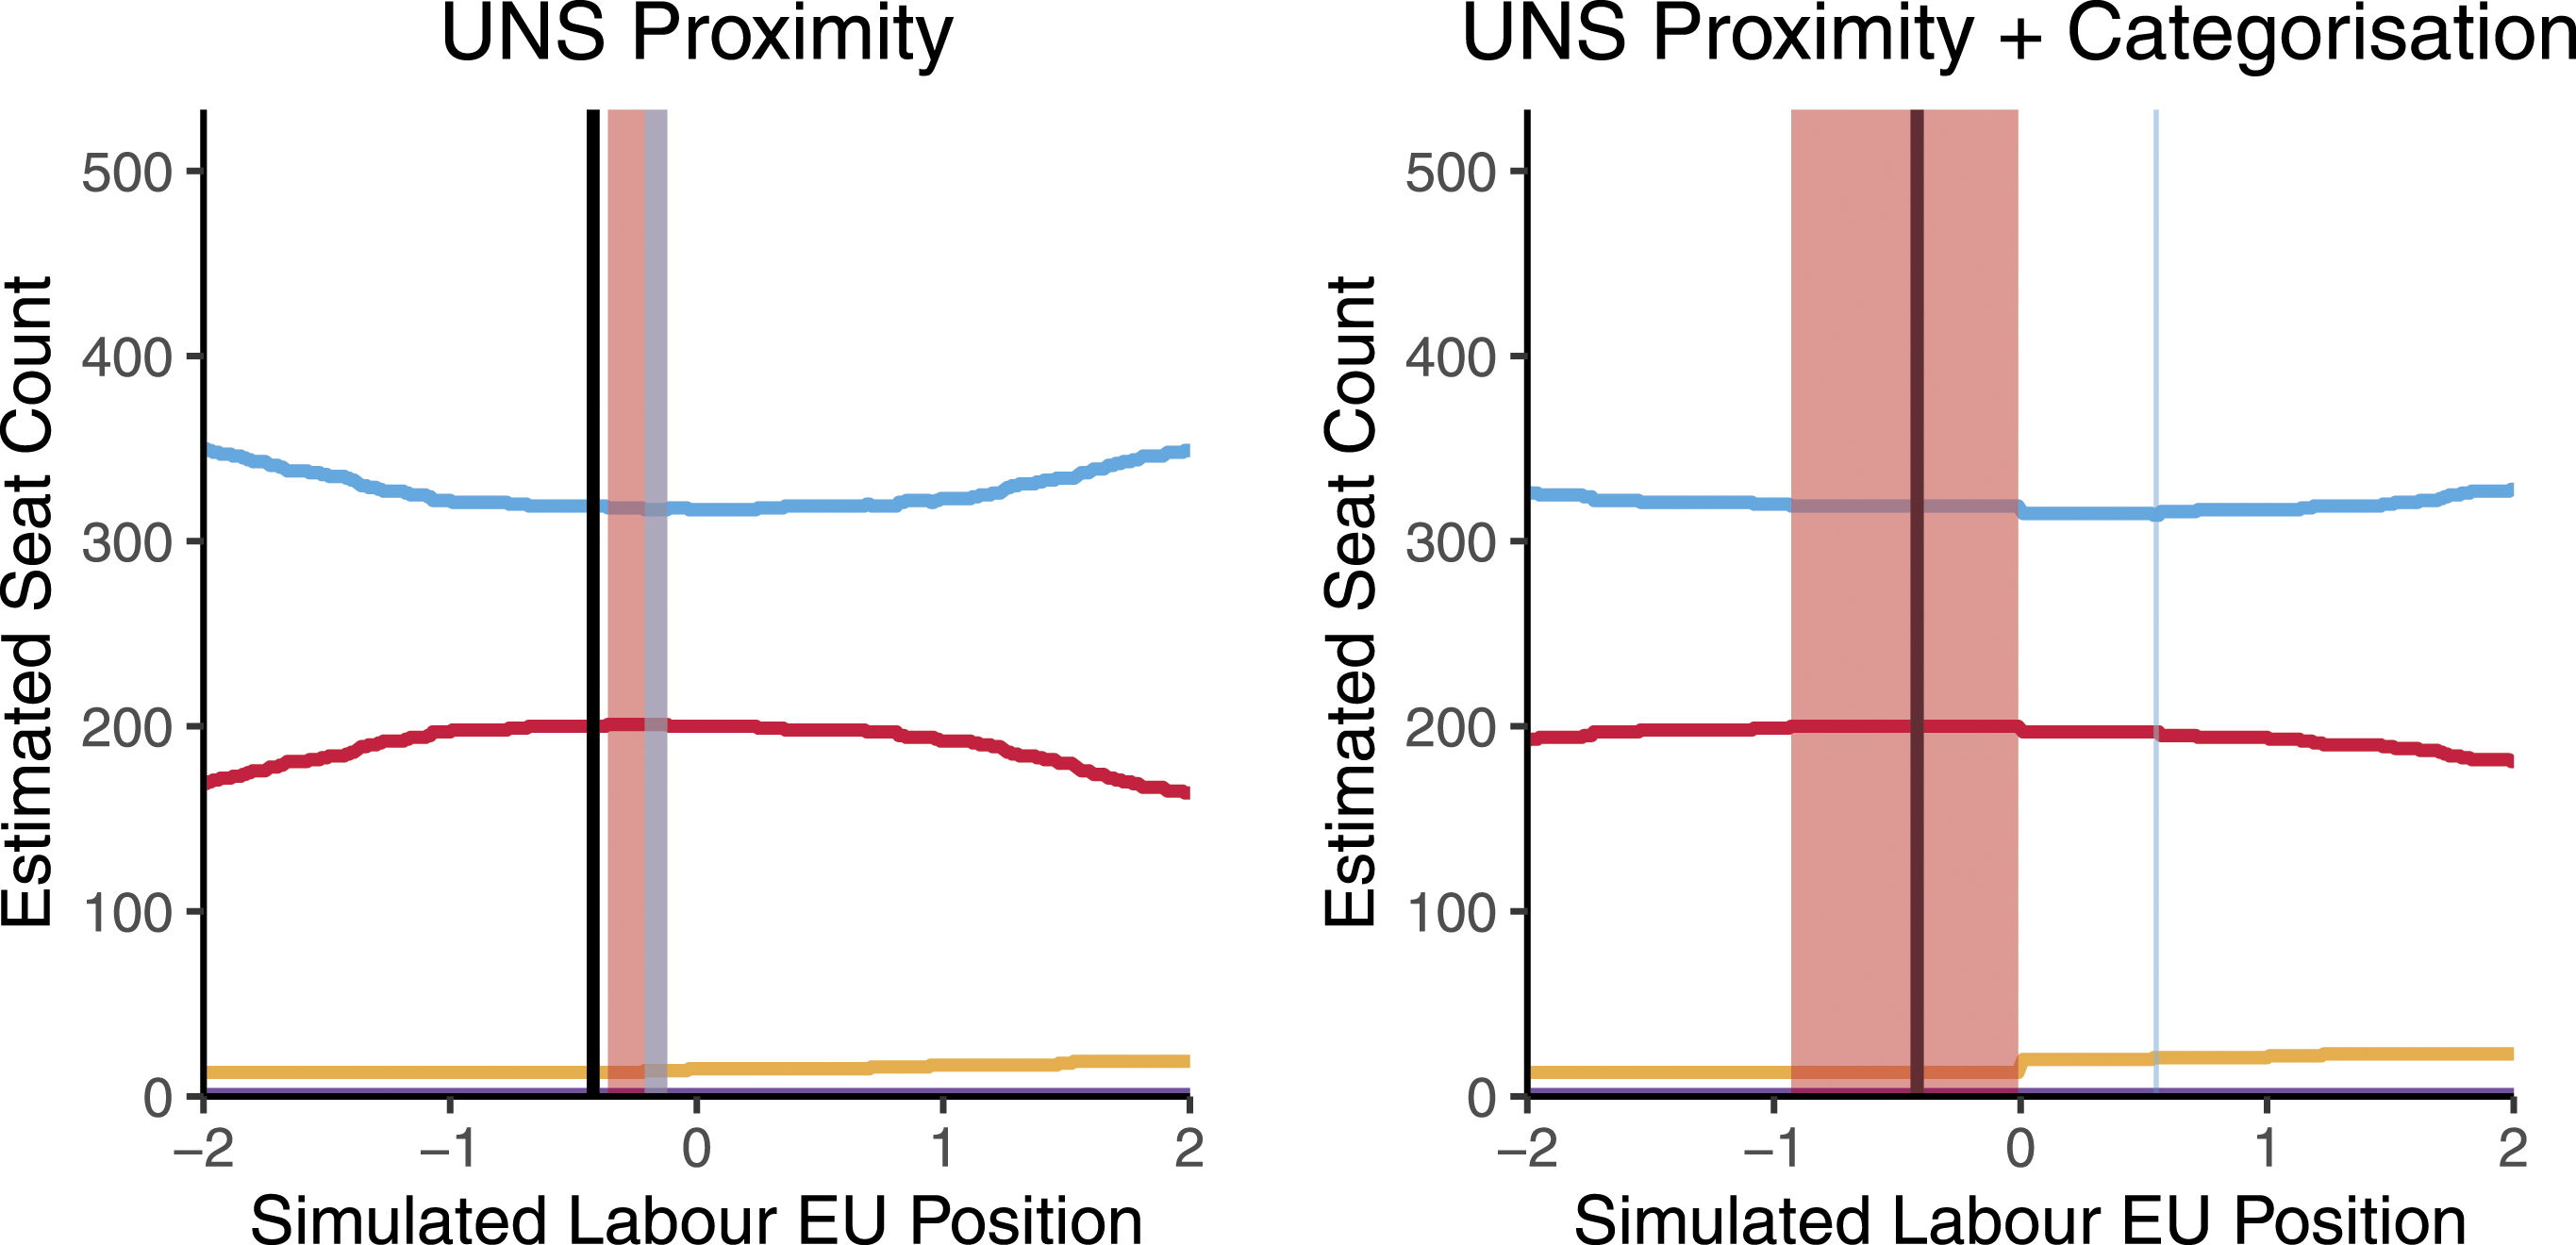
An immediate but clear issue from these results is that the results from both models only half-agree. There is consensus that the Labour Party maximises its seat share on the Remain side of the scale, but there is less consensus on minimising the gap between the Conservatives and the Labour Party. On the proximity model, this is very near the 0 point and on the Remain side. In the proximity plus categorisation model however, this is after the 0 point. The issue seems in part to be driven by the question of the extent to which the Liberal Democrats benefit from the Labour Party’s pro-Leave shift. The move is less drastic in the proximity model, so the difference may be driven by this fact. However, when we turn to the URS results, this becomes less clear. Figure 5 visualises these results, following the same structure as Figure 4. URS changes in seat count. The horizontal lines represent the estimated seat counts of the political parties in the sample, with the black line being the percentage of non-voters. The vertical lines are various Labour Party positions. The solid black vertical line is the Labour Party’s original position. The red shaded area is the Labour Party’s seat maximising range, while the blue shaded area is the range for minizing the seat gap between the Labour Party and the Conservative Party.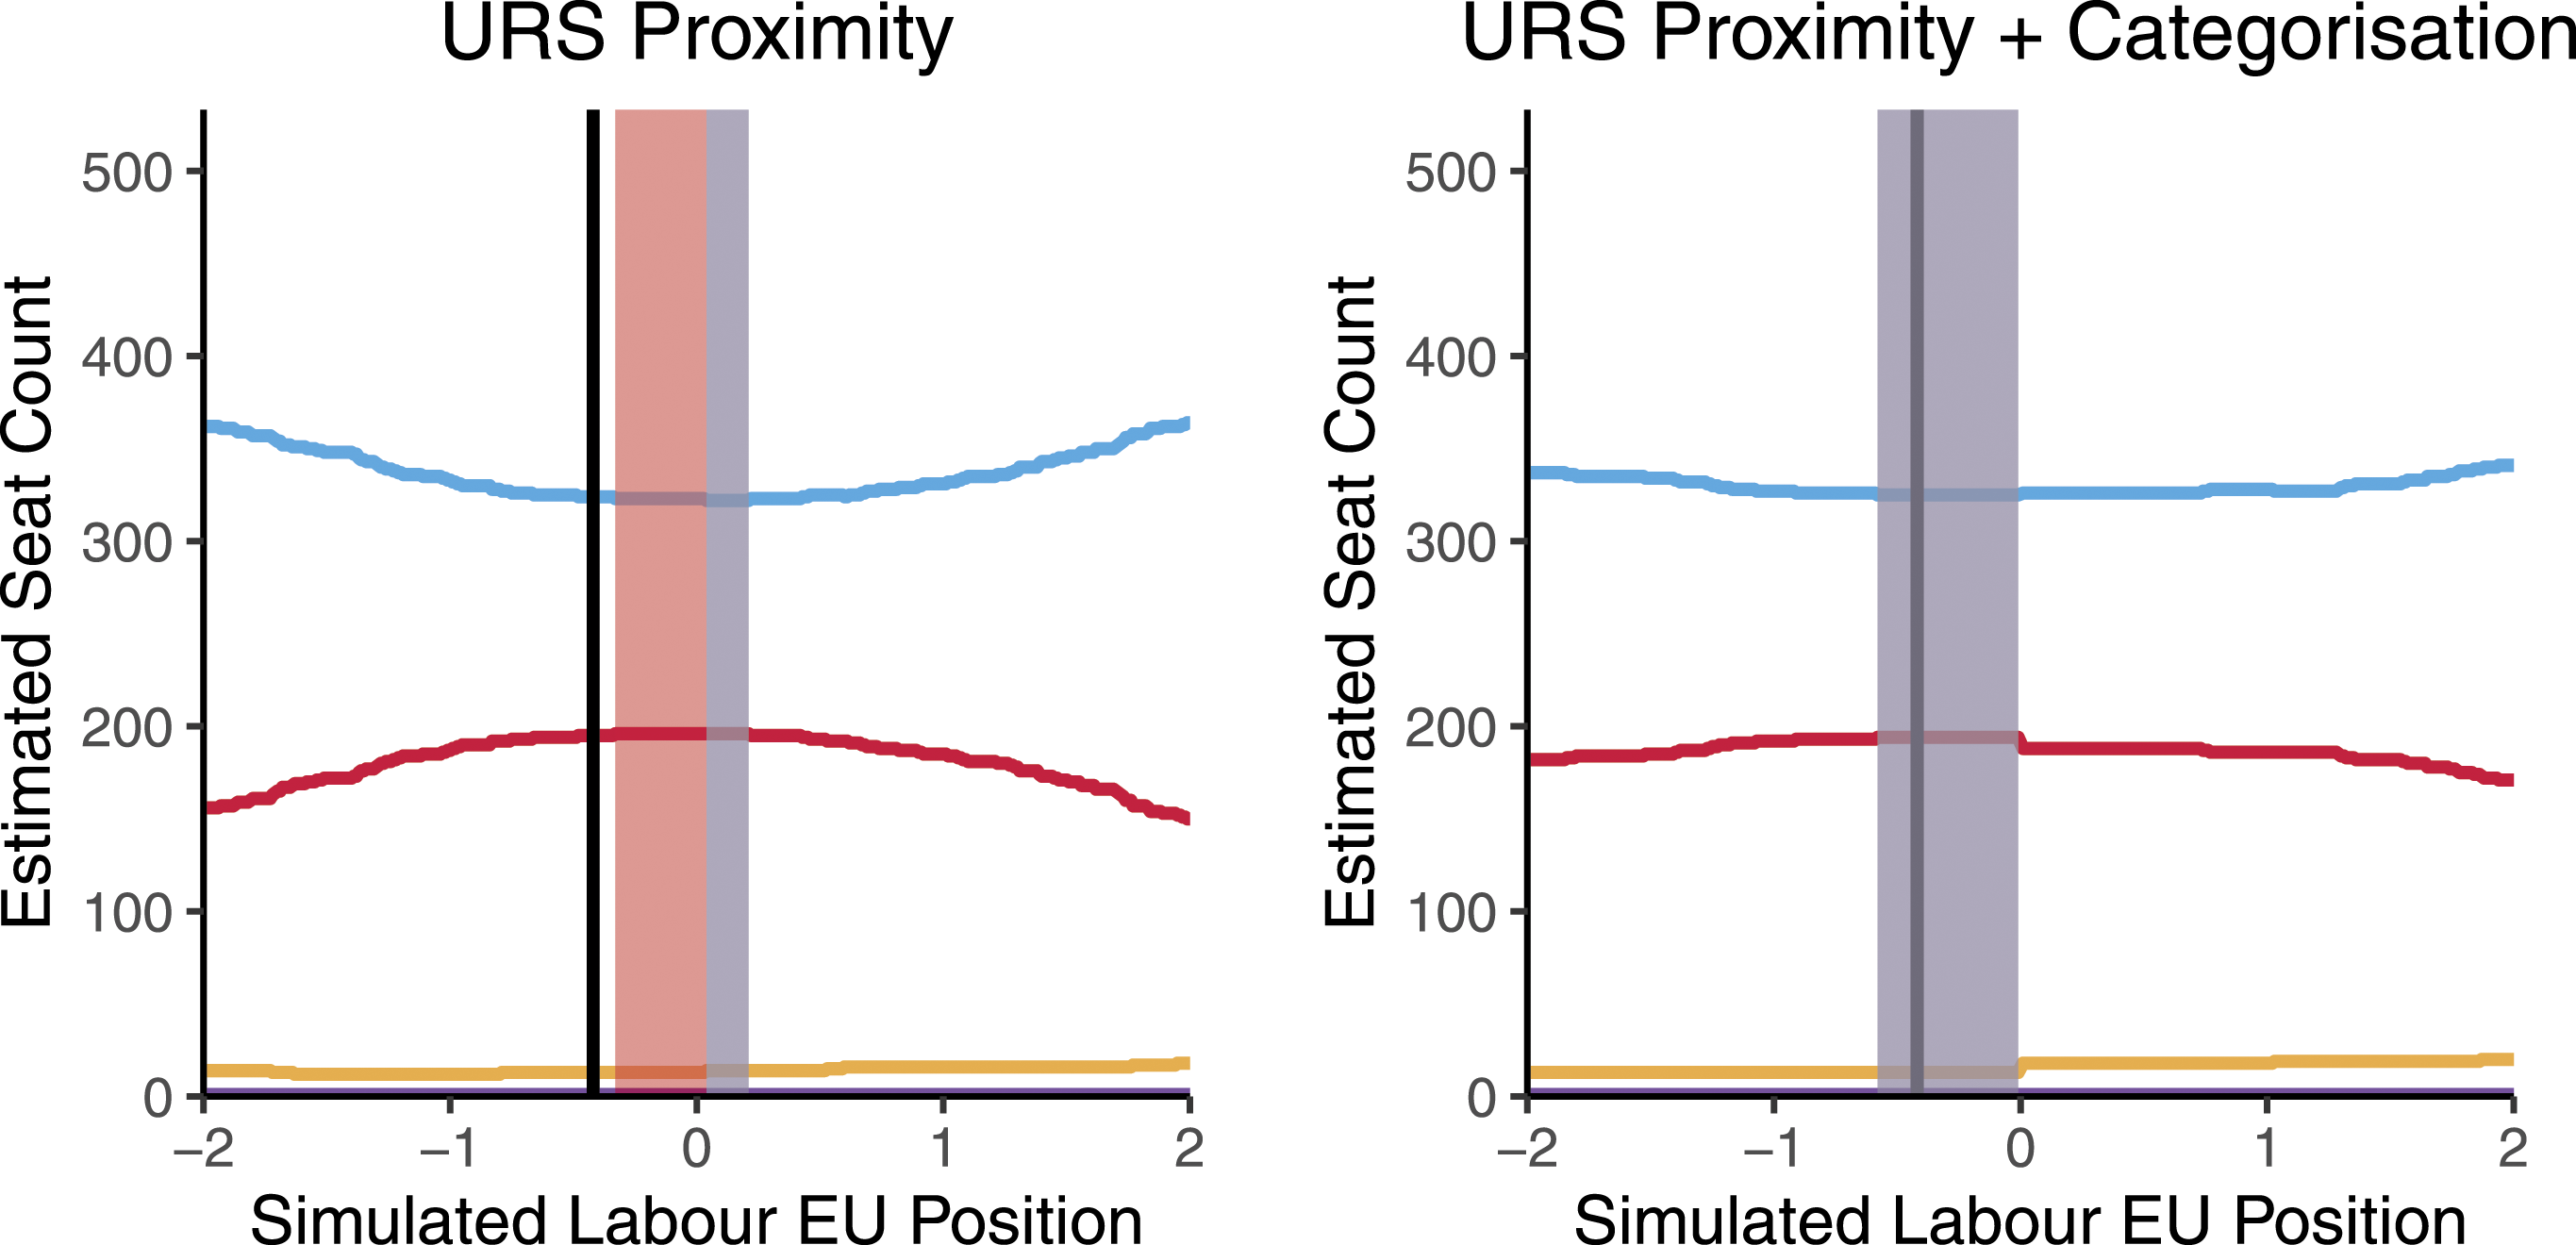
Once again, there is convergent evidence in favour of a pro-Remain stance maximising the Labour Party’s seat share. So long as the party stays on the Remain side of the 0 point, it is able to maximise its vote share. However, there is divergent evidence regarding the minimisation of the Conservative-Labour seat gap in the opposite direction. Here, the proximity model favours the idea that the Labour party could have taken either a Remain or Leave stance, so long as it was close to the center of the distribution. By contrast, with URS the proximity plus categorisation model suggests that the Labour Party should have taken a Remain stance.
One way to approach the contradictory evidence presented here is to highlight that the proximity plus categorisation model is a theoretically better approximation to vote choice, while the URS generalisation is a theoretically better approach to predicting seats. Overall though, there is clear convergent evidence of a pro-Remain stance maximising the Labour vote share, minimising the Conservative-Labour vote gap, and maximising Labour’s seat share. It is therefore probably the best approach given the available evidence, albeit with some remaining ambiguity around minimising the seat gap between Labour and the Conservatives.
Robustness of results
Although each of my modelling decisions in building this simulation have been driven by theory, it is nonetheless important to establish how robust to particular decisions these results are. I have verified my results across three sets of core decisions during the modelling process. These are the functional form of the distance function, the inclusion of non-spatial control variables, and the precise placement of the midpoint of the ‘same side’ approximation. In each analysis, I focus primarily on the robustness of the simulated vote shares result, as it is this result which is most consistent throughout my analysis. All robustness check plots including simulated seats shares are however presented in the Supplementary Material for this paper.
To examine the robustness of my results to choice of utility loss, I reran the analysis with squared distances between parties and voters. Of the robustness checks, this was most challenging for the results of the paper. The resulting vote maximising and vote-gap minimising positions shift, relative to the main results, in a more pro-Leave direction. The difference is most marked for the model without categorisation effects, which shows the vote minimising position as being very near the center. The model with categorisation effects by contrast shows more similar results to the main results of this paper. The theoretical result that absolute distances best capture voter utility loss is thus an important one for the results presented here - especially if we were to ignore categorisation effects.
One important check is on the inclusion of non-spatial variables which nonetheless contribute to the voting decision. These are the perceived win probability of the party in question, whether the voter voted for the party in the previous election, whether the voter identifies with that party, how much the voter likes the party, and how much the voter likes the party leader. These variables are both consequences of party-voter distance and may in turn contribute to the voters’ own ideological stance. The fact that these variables do in fact matter has an impact on party strategy as parties are incentivesed to focus their strategy on voters at least somewhat drawn to them for non-policy reasons instead of all voters equally (Adams et al., 2005).
I therefore ran models and simulations without these controls (but still with party dummies, to broadly capture valence effects and to act as a baseline for non-voting). Here the results were most different from the main results. While the Labour Party’s vote maximising position is still close to its original position, its vote-gap minimising position is on the pro-Leave side of the dimension. This is because while the Liberal Democrats’ pro-Remain stance results in it taking a large number of voters from the Labour Party, the Labour Party gains many pro-Leave voters for the Conservatives at a fast rate. This robustness check largely shows that in no small part part of the reason a pro-Remain strategy was necessary for the Labour party was that non-policy portions of the voting decision such as partisanship meant that Leave voters were unlikely to switch loyalties.
Since the selection of a center point is in practice somewhat arbitrary given the fact that the scale extracted from Bayesian Aldrich-McKelvey scaling is interval rather than ratio scale, I ran two further sets of models while varying the choice of center point on the EU dimension. In the first, I set the center point to be −0.1. In the second, I set the center point to be 0.1. Broadly, these results corroborate the main results in the paper - the categorisation model remains robust to selection of this point. Overall, the inferences of this paper are robust, although under a different utility loss function a more moderate though still pro-Remain stance may be recommended for the Labour party.
A final note on the substantive interpretation of these results. Throughout this paper, I have primarily focussed on an economic dimension of redistribution and a dimension of EU preferences. Focussing on the latter, it is likely the case that the EU dimension is correlated with other cultural dimensions such as environmental issues, immigration, and crime. It is therefore plausibly the case that some of the effect - and thus some of the changes in results - are also driven by these dimensions. Two points bare making however. First, the election was very clearly an EU election. No other policy dimension took as much prominence prior to and during the 2019 general election as Brexit. It is therefore unlikely that other cultural dimensions were particularly important in the result, and thus the degree of omitted variable bias is likely small in this specific case.
Second, in line with the hierarchical model of public opinion and especially in the specific case of immigration attitudes in the UK (Peffley and Hurwitz, 1985), it is not clear that a political party could pass itself off as pro EU but not immigration - or vice versa. These issues were so closely intertwined for the UK that even if the EU became more salient than immigration, to be pro-EU would be to some extent to be pro-immigration. Insofar as the simulation also captures the effects of changes in immigration position, this may therefore in practice serve to make the simulation somewhat more, rather than less realistic.
Conclusion
The clear conclusion of my counterfactual simulation is that the Labour Party is best off as a party of Remain. This evidence is in line with recent more general research on the positions of social democratic parties with respect to second dimension issues (Abou-Chadi and Wagner, 2019, 2020). On the whole, the party clearly had its stance about right in the election - the vote-maximisation and vote gap-minimisation points from both models were all near the ‘true’ Labour Party position. Becoming as firmly Remain as the Liberal Democrats or Greens would have been a mistake. Similarly, the range of positions in which the party maximises its seats is on the Remain side of the 0 point - even in the proximity-alone models where this point is not explicitly used in the variables of the model. Some ambiguity remains around the range of values where seat gap-minimisation occurs, but broadly it would be inadvisable to build a strategy around this ambiguous result instead of the firmer conclusions set out above. We should consider how these results might generalise to other parts of the UK. Wales and especially Scotland both have pro-Remain nationalist parties and an additional pro versus anti-union dimension at play. This constraint notwithstanding, there is little reason to imagine that the general findings do not apply.
There are several wider implications for the simulation beyond confirming recent research on social democratic party placement. The first is that it appears once enough aspects of the voting decision are considered that there is little room for political parties to drastically alter electoral results through changes in their spatial position. Although the vote and seat shares could shift in sometimes large amounts, the overall rank order of the parties did not change at any point. There does appear to be some distortion being introduced by the UK’s SMP electoral system in that a range of positions produces the same seat count, but the ambiguity in this set of results means that the Labour Party was best off focussing on votes alone. This has some relevance to the ongoing debate on proportional representation in the Labour Party: it may simplify party strategy by more clearly aligning vote and seat maximisation.
However, the counterfactual simulation does have some limitations which require discussion. First and most obvious is that I only consider the effect of changes in Labour Party position on vote choice. In practice, such changes would likely produce new information and arguments in the form of media reactions, and new incentives for political actors. It is not even necessarily clear if Johnson would have been willing to call the election had the Labour Party taken a different stance. However, on this front I argue that the purpose of the simulated counterfactual is not to be a full simulation of reality in all its complexity but rather to be sufficiently informative to a particular political debate. I argue that in terms of this goal it has succeeded.
Some further general limitations should also be acknowledged. First, I do not fully account for all the quirks of the election. I do not account for the fact that the Brexit Party stood down in Conservative incumbent seats. The arbitrariness of the 0 point in Bayesian Aldrich McKelvey scaling is a theoretically important point to acknowledge. It is set by assuming the mean point of the political parties to be approximately 0. In practice, insofar as the scale is a reasonably good approximation to a hypothetical ‘true’ ratio scale with a meaningful 0 point, the distance (once unit size is accounted for) is probably a reasonably close match by merit of the fact it will be somewhere between the two groups of parties. The fact that the proximity-alone models do seem to capture this in some of the seat share predictions would seem to lend confirmation to this point.
Substantively, it is not clear to what extent the conditional logit model and thus counterfactual simulation pick up on other, non-EU related ideological dimensions. While given the clear way in which the 2019 general election was a Brexit election, I do not expect this to be a significant problem. However, readers should be conscious of this when interpreting these results for themselves. Likewise, in practice it is not clear that at the time the data were collected the Labour Party could have adjusted its position. Much recent research suggests that voters are slow to adjust their vote choice in response to percieved changes in party positions (Adams et al., 2011, 2014), meaning that to a non-negligible degree that Labour Party’s pro-Remain position may have been ‘locked in’ by the time of the election. The points simulated closest to the ‘true’ position are thus the most realistic, and the simulated positions further from the ‘true’ position may not have been plausible in practice. That said, going beyond the bounds of reality is where the simulation is most interesting, and I hope that readers will find this simulation informative despite this limitation.
Finally, a theoretical point of Downs’ that I do not model is the notion of party brands. Downs taxes as axiomatic that where a party moves to the other ‘side’ of the center point, no one will wish to vote for it because it can no longer be trusted. Insofar as this is true, a move past the center point of the EU integration scale would have resulted in fairly drastic collapse in the Labour Party vote share. If true, this point lends further credence to my conclusion regarding the optimal point for the Labour Party on the scale.
Supplemental Material
Supplemental Material - Social democratic party positions on the EU: The case of Brexit
Supplemental Material for Social democratic party positions on the EU: The case of Brexit by Philip Swatton in Party Politics
Footnotes
Acknowledgements
I thank the anonymous reviewers, Rob Johns, Roi Zur, Ryan Bakker, Saurabh Pant, Samira Diebire, Sarah Wagner, Lorenzo Crippa, Anam Kuraishi, and the audience members at the PhD workshop in Manchester for the various helpful comments and discussions on the contents and ideas in this paper. I thank Roi in particular for introducing me to the simulation method used in this paper. All remaining errors are my own.
Declaration of conflicting interests
The author(s) declared no potential conflicts of interest with respect to the research, authorship, and/or publication of this article.
Funding
The author(s) received no financial support for the research, authorship, and/or publication of this article.
Supplemental Material
Supplemental material for this article is available online.
Note
Author biography
At the time of writing the article, Philip Swatton was a doctoral student at the University of Essex. His main interests include political ideology, measurement, political methodology, spatial models of vote choice, party strategy, and British politics.
References
Supplementary Material
Please find the following supplemental material available below.
For Open Access articles published under a Creative Commons License, all supplemental material carries the same license as the article it is associated with.
For non-Open Access articles published, all supplemental material carries a non-exclusive license, and permission requests for re-use of supplemental material or any part of supplemental material shall be sent directly to the copyright owner as specified in the copyright notice associated with the article.