
Abstract
Are Labour party politicians anti-Semitic, and are Conservative party politicians Islamophobic? In this correspondence study we measure the responsiveness of elected local representatives in the United Kingdom to requests from putative constituents from minority religious groups. We send short email requests to 10,268 local government representatives from each of the main political parties, from stereotypically Islamic, Jewish, and Christian names. Response rates are six to seven percentage points lower to stereotypically Muslim or Jewish names. The two major political parties both show equal bias towards the two minority group names. Results suggest that the bias in response may be implicit. Bias is lower in more dense and diverse locations.
Attention to Islamophobia and anti-Semitism in the main United Kingdom (UK) political parties has increased substantially in recent years. A 2016 inquiry into anti-Semitism in the Labour Party found ‘clear evidence (going back some years) of minority hateful or ignorant attitudes and behaviours festering within a sometimes bitter incivility of discourse’ (Chakrabarti, 2016). However, a cross-party Parliamentary Committee noted, ‘there exists no reliable, empirical evidence to support the notion that there is a higher prevalence of anti-Semitic attitudes within the Labour Party than any other political party’ (House of Commons Home Affairs Committee, 2016). In 2018 the Muslim Council of Britain 1 and Conservative Baroness Sayeeda Warsi 2 called for enquiries into Islamophobia in the Conservative Party. Other critics have accused the Conservative Party of failing to tackle Islamophobia (Dunleavy and Kippin, 2018). The 2017 British Social Attitudes Survey showed that 33 percent of those who identify with the Conservative party would describe themselves as somewhat racist, compared with 18 percent of those who identify with the Labour party (Kelley et al., 2017). Media attention to political debates has been followed by spikes in Google Search interest (Figure A1) and rises in religiously motivated hate crimes against Muslims and Jews (Figure A2).
In this paper we ask whether local politicians of different political parties display systematic bias against constituents with stereotypically Jewish and Muslim names. A growing literature documents discrimination by elected representatives against their constituents, based on race or religion, through their official duties, in the United States (Butler and Broockman, 2011; Costa, 2017; Gell-Redman et al., 2018; Grose, 2014; Lajevardi, 2018; Mendez and Grose, 2018), South Africa (McClendon, 2016), and Sweden (Larsson Taghizadeh et al., 2020). Similar bias is found by unelected officials (Hughes et al., 2019; Adman and Jansson, 2017). This discrimination varies towards different minority groups (Hughes et al., 2019; Pfaff et al., 2018), and by political party affiliation (Lajevardi, 2018).
We replicate these findings in the UK. We test for the prevalence of discrimination by elected local politicians against their constituents based on perceived race or religious identity. We conduct a correspondence study with a series of email requests from stereotypically Muslim, Jewish, or Christian names, documenting systematic bias in response rates. Such discrimination in the provision of services based on race or religion is against UK law. 3 This form of discrimination by councillors may have substantive impacts for constituents. For example councillors set policy on access to the limited supply of social housing, policies which have been documented to disadvantage ethnic minorities (Caney, 2019; Henderson and Karn, 1984; Preece and Bimpson, 2019; Rutter and Latorre, 2009).
We find that response rates to simple requests from purported constituents are 6–7 percentage points lower from stereotypically Muslim or Jewish names. Results generally do not vary when the religion of the sender is explicitly identified, indicating that the bias is driven by names alone, with the exception of Muslim males. Response rates to female constituent names are 2–3 percentage points higher than to male constituent names. Response rates to both Jewish and Muslim names from Labour Party councillors show less bias than from other party councillors, though some bias remains. Responses to Jewish names are higher in places with more dense populations, with larger Jewish populations, and with larger non-white populations. Responses to Muslim names are also higher in places with large non-white populations.
Our study adds to the literature by not only showing the existence of discrimination by elected representatives, but also by demonstrating how these discriminatory behaviours differ depending on political party affiliation and the target of discrimination. The 6–7 percentage point bias we estimate is well within the range of bias estimated in other similar studies, which averages around 5 percentage points (Table A1).
Experimental setting and data
Local government is responsible for around one fifth of public spending in the UK. There are 418 councils, with an average of 50 councillors each, for a total of 20,712 local councillors. Most of these belong to the three major political parties; the Conservatives (9,022), Labour (6,457), and the Liberal Democrats (1,874). Our sample contains 10,268 councillors acquired by web-scraping local council websites that share a standardised layout. These councils are more likely to be urban, with larger, more dense, and more diverse populations.
Obtaining informed consent from our subjects is impractical, so we follow the ethical guidelines outlined in McClendon (2012) and Riach and Rich (2004), and argue that the value of the information obtained (and the lack of alternative methods for obtaining it) outweighs the small cost to the subjects. We aim to minimise burden by keeping the message short, and protect the confidentiality of individuals involved. Evidence from Sweden suggests that neither politicians themselves nor ordinary citizens find survey experiments to be particularly problematic (Naurin and Öhberg, 2019).
Our sample comprises roughly half (198 of 418) the councils in the UK. We select only those councils that use a standardised website format that can be easily scraped. 4 This is therefore a non-random sample of all councils, but still represents a large share. Councils in our sample are in general slightly more urban than other councils – with higher population density, higher incomes, bigger non-white populations, and being more likely to be run by one of the two main parties. 5 We randomly assign councillors within our sample to receive an email from a stereotypical Jewish, Muslim, or Christian resident. 6 We block the randomisation by council.
Our main outcome is simply a binary indicator for whether a response is received or not. We discard automated and ‘out of office’ responses. We use pre-specified control variables to improve the precision of our main estimates and also to assess heterogeneity in effects. At the ward (sub-council) level, we have data on the percentage of the population that are Jewish and Muslim, the proportion of migrants (from the 2011 Census), and the local unemployment rate (from the Department for Work and Pensions Job Seekers Allowance data). 7 On average there are three councillors in each ward. The local unemployment rate is based on the Department for Work and Pensions actual claimant counts as the numerator (August 2017 to May 2018) and the 2011 census population as the denominator.
We estimate the ethnicity of councillors based on their names, using an algorithm developed by Laohaprapanon and Sood (2018) based on data scraped from over 130,000 Wikipedia pages by Ambekar et al. (2009), and gender using an algorithm developed by Vanetta (2015).
Treatment
We randomise each councillor to receive one of two email scripts, from one of six different names. The email scripts are shown in Figure 1 below. The first email script makes a simple request in line with basic councillor responsibilities. The second request explicitly indicates the religion of the emailer. Similar to previous studies, the two email scripts can be seen as different levels of intensity of the treatment (Di Stasio et al., 2019; Pfaff et al., 2018). The six treatment names are Levi Goldstein (male Jewish), Shoshana Goldstein (female Jewish), Mohammad Hussain (male Muslim), Zara Hussain (female Muslim), Harry White (male Christian), and Sarah White (female Christian). 8 Racism in the UK has historically been directed towards three minority groups, Black British groups, which are typically of Caribbean or African descent, Asians, which are typically of South Asian descent and those with a Jewish descent. While Jews and Muslims are not racial identities per se, the religious identities of these two groups have been conflated with race through the process of racialisation in which racial or ethnic identities have been ascribed to these groups by the dominant race (Friedlaender, 1919; Meer, 2013). For the sake of consistency, we label Harry White and Sarah White as ‘Christian’ names. We do, however, acknowledge that these names may not be explicitly associated with being religious, but rather as being associated with membership of the majority population. We conducted an online post-test survey in which 100 respondents rated each name across three dimensions, income, education and occupation. Results showed that the Christian names were seemingly associated with lower income, level of education and occupation rank (Table A2). This suggests that the minority names are not associated with lower socio-economic status.
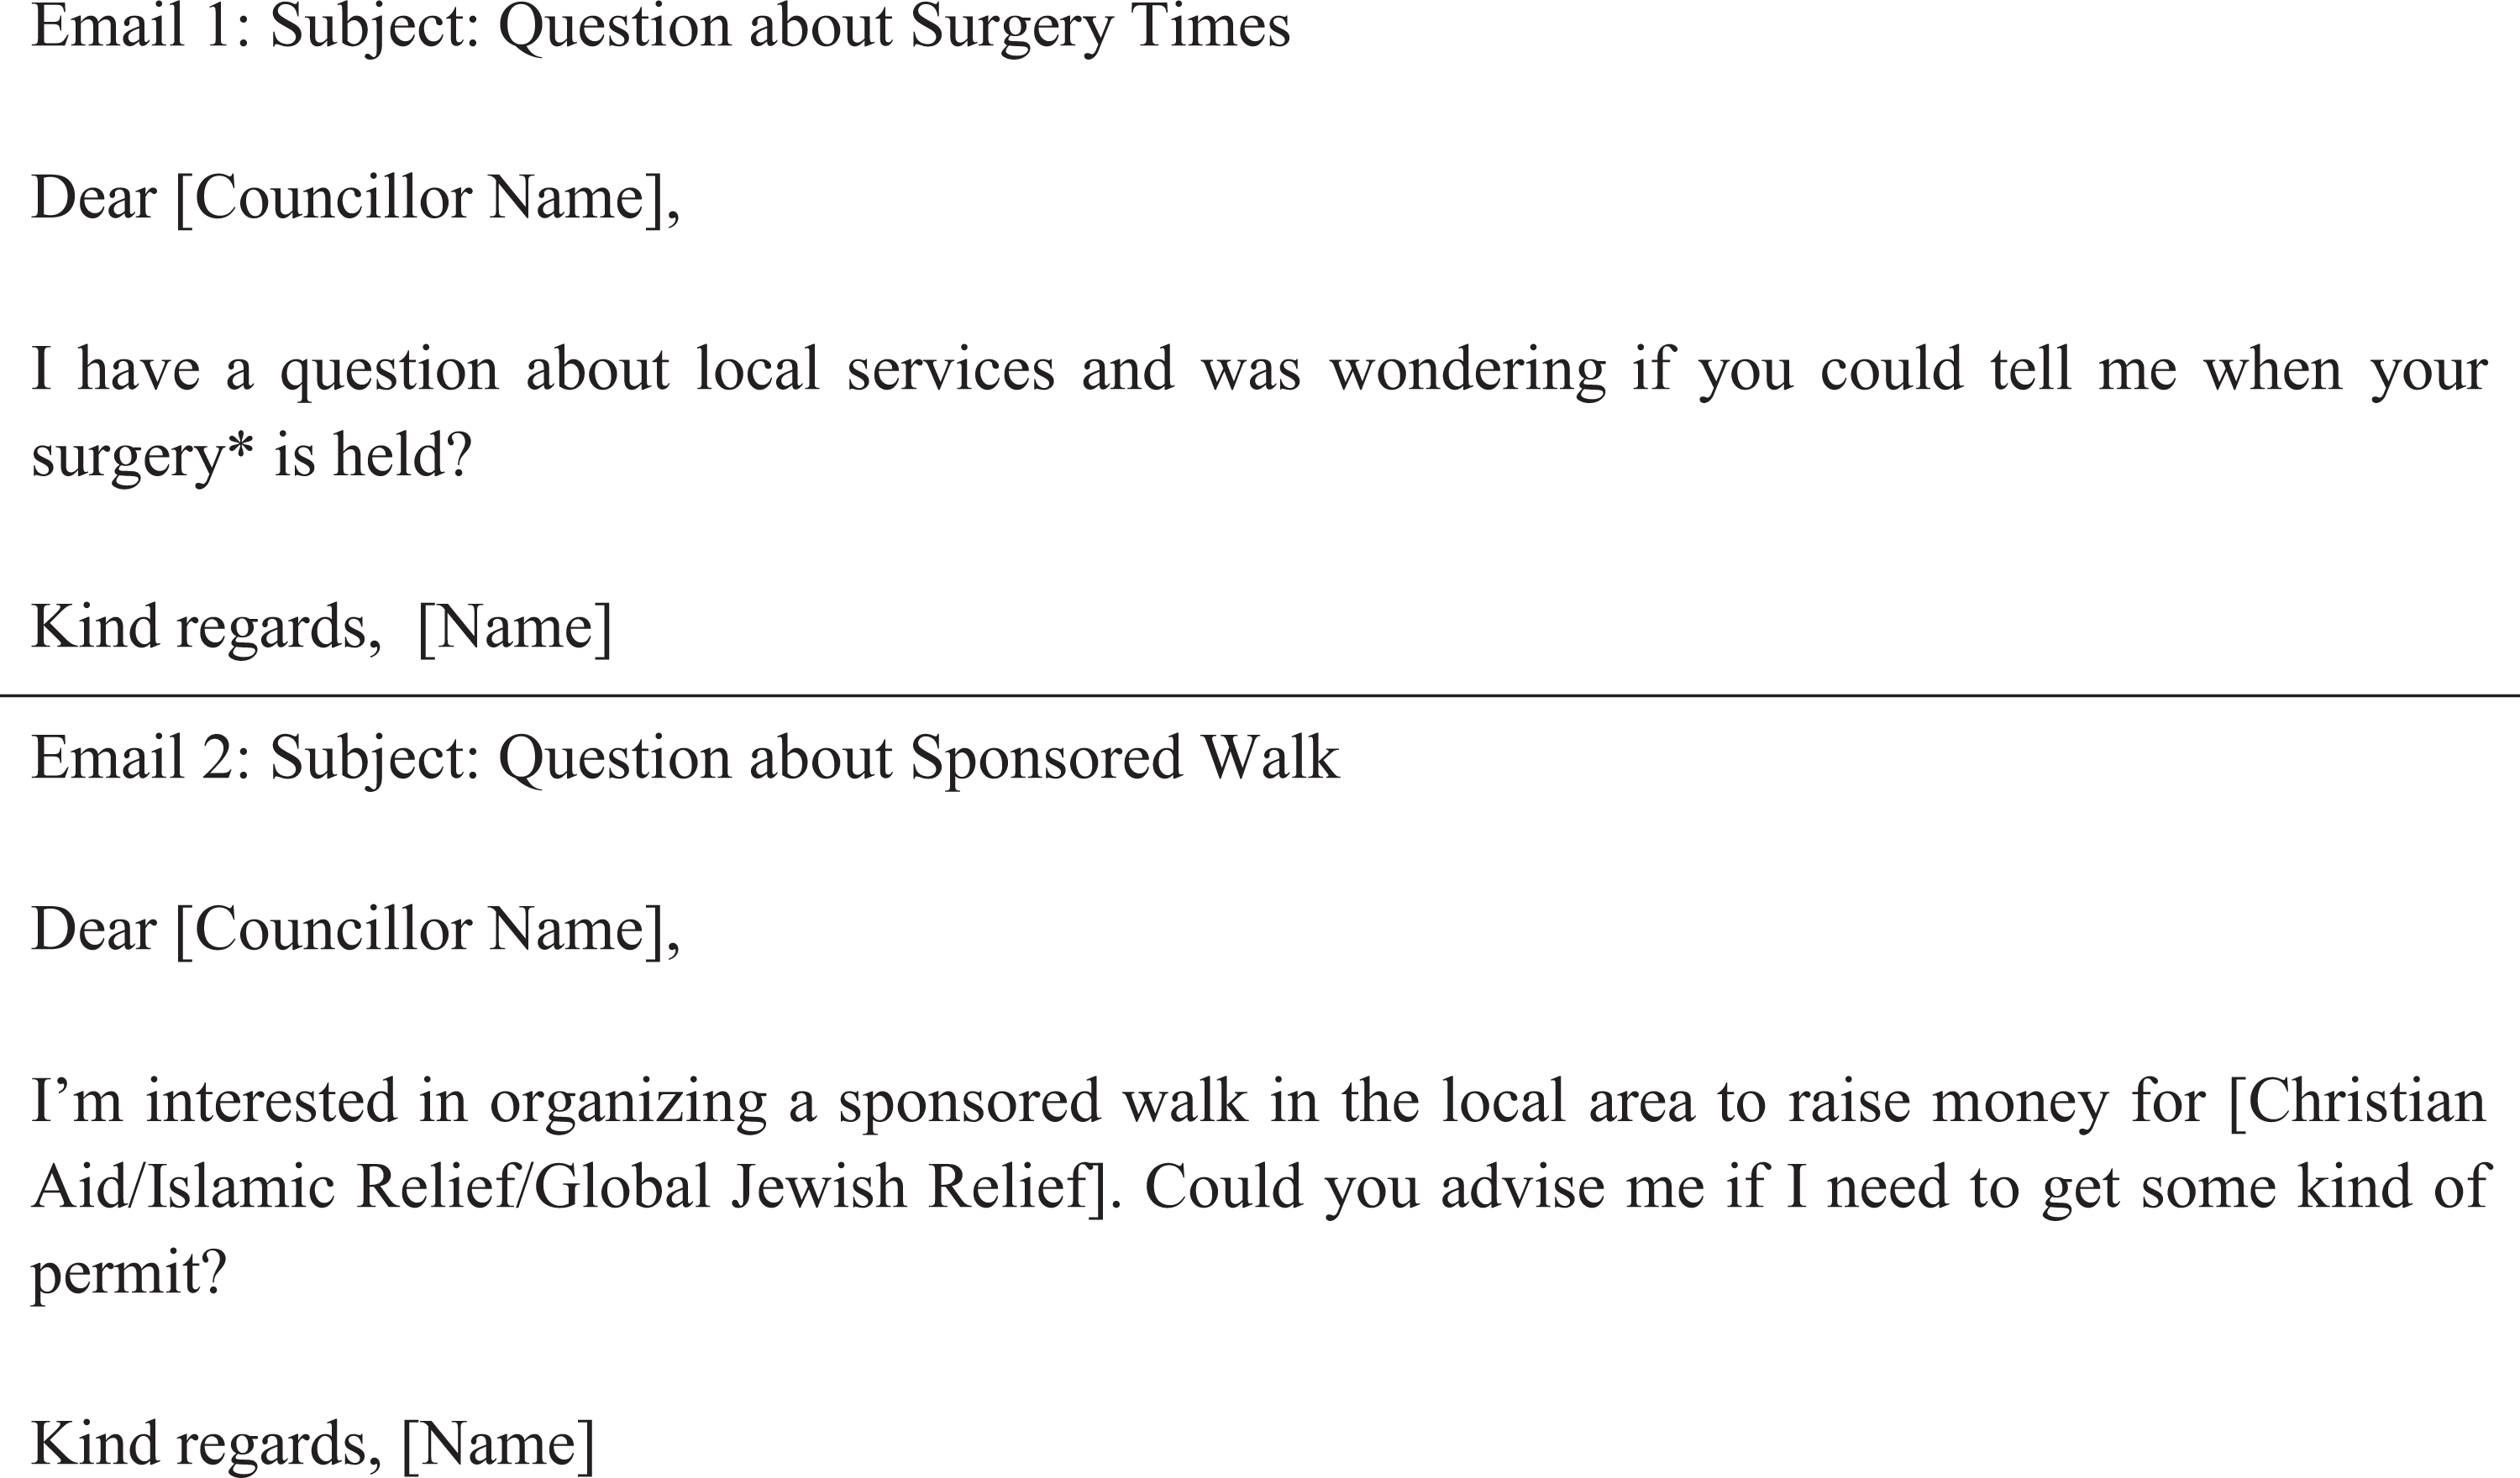
Treatment email scripts. *A ‘surgery’ is a time when politicians hold open office hours in which constituents can come for private one-to-one meetings with their representatives. These ‘advice’ surgeries are common in British, Irish, and Australian politics.
The email addresses used were created to include the full name of treatment (e.g.
Results
The overall response rate to our emails from the male Christian name (Harry White) was 54 percent. This is a similar response rate to that found by a survey of real requests to councillors, in which 51 percent received a response within 2 weeks (see Online Annex). Among those who responded, the median time to response was 12 hours, and the median length of responses was 228 words.
We next estimate linear probability regressions of the form:
where Response is a binary indicator for whether a response was recorded within 2 weeks, Name is a categorical variable for which of the six treatment names was randomly assigned, EmailType is a binary variable for whether Email 1 or 2 was randomly assigned, c are council fixed effects, d are day of the week fixed effects, t are time of day fixed effects, and are individual specific error terms.
Compared to the male Christian name (Harry White), response rates to Jewish names are 5–6 percentage points lower, and 6 to 9 percentage points lower to Muslim names. Response rates are marginally higher to the female Christian name (Sarah) than to the male Christian name (Harry). Response rates are also higher to Zara Hussain than to Mohammad Hussain. Results are robust to the inclusion of council (randomisation strata) fixed effects (Table 1), and to sub-council level control variables (see Online Appendix).
Effect of sender name on email response rate.
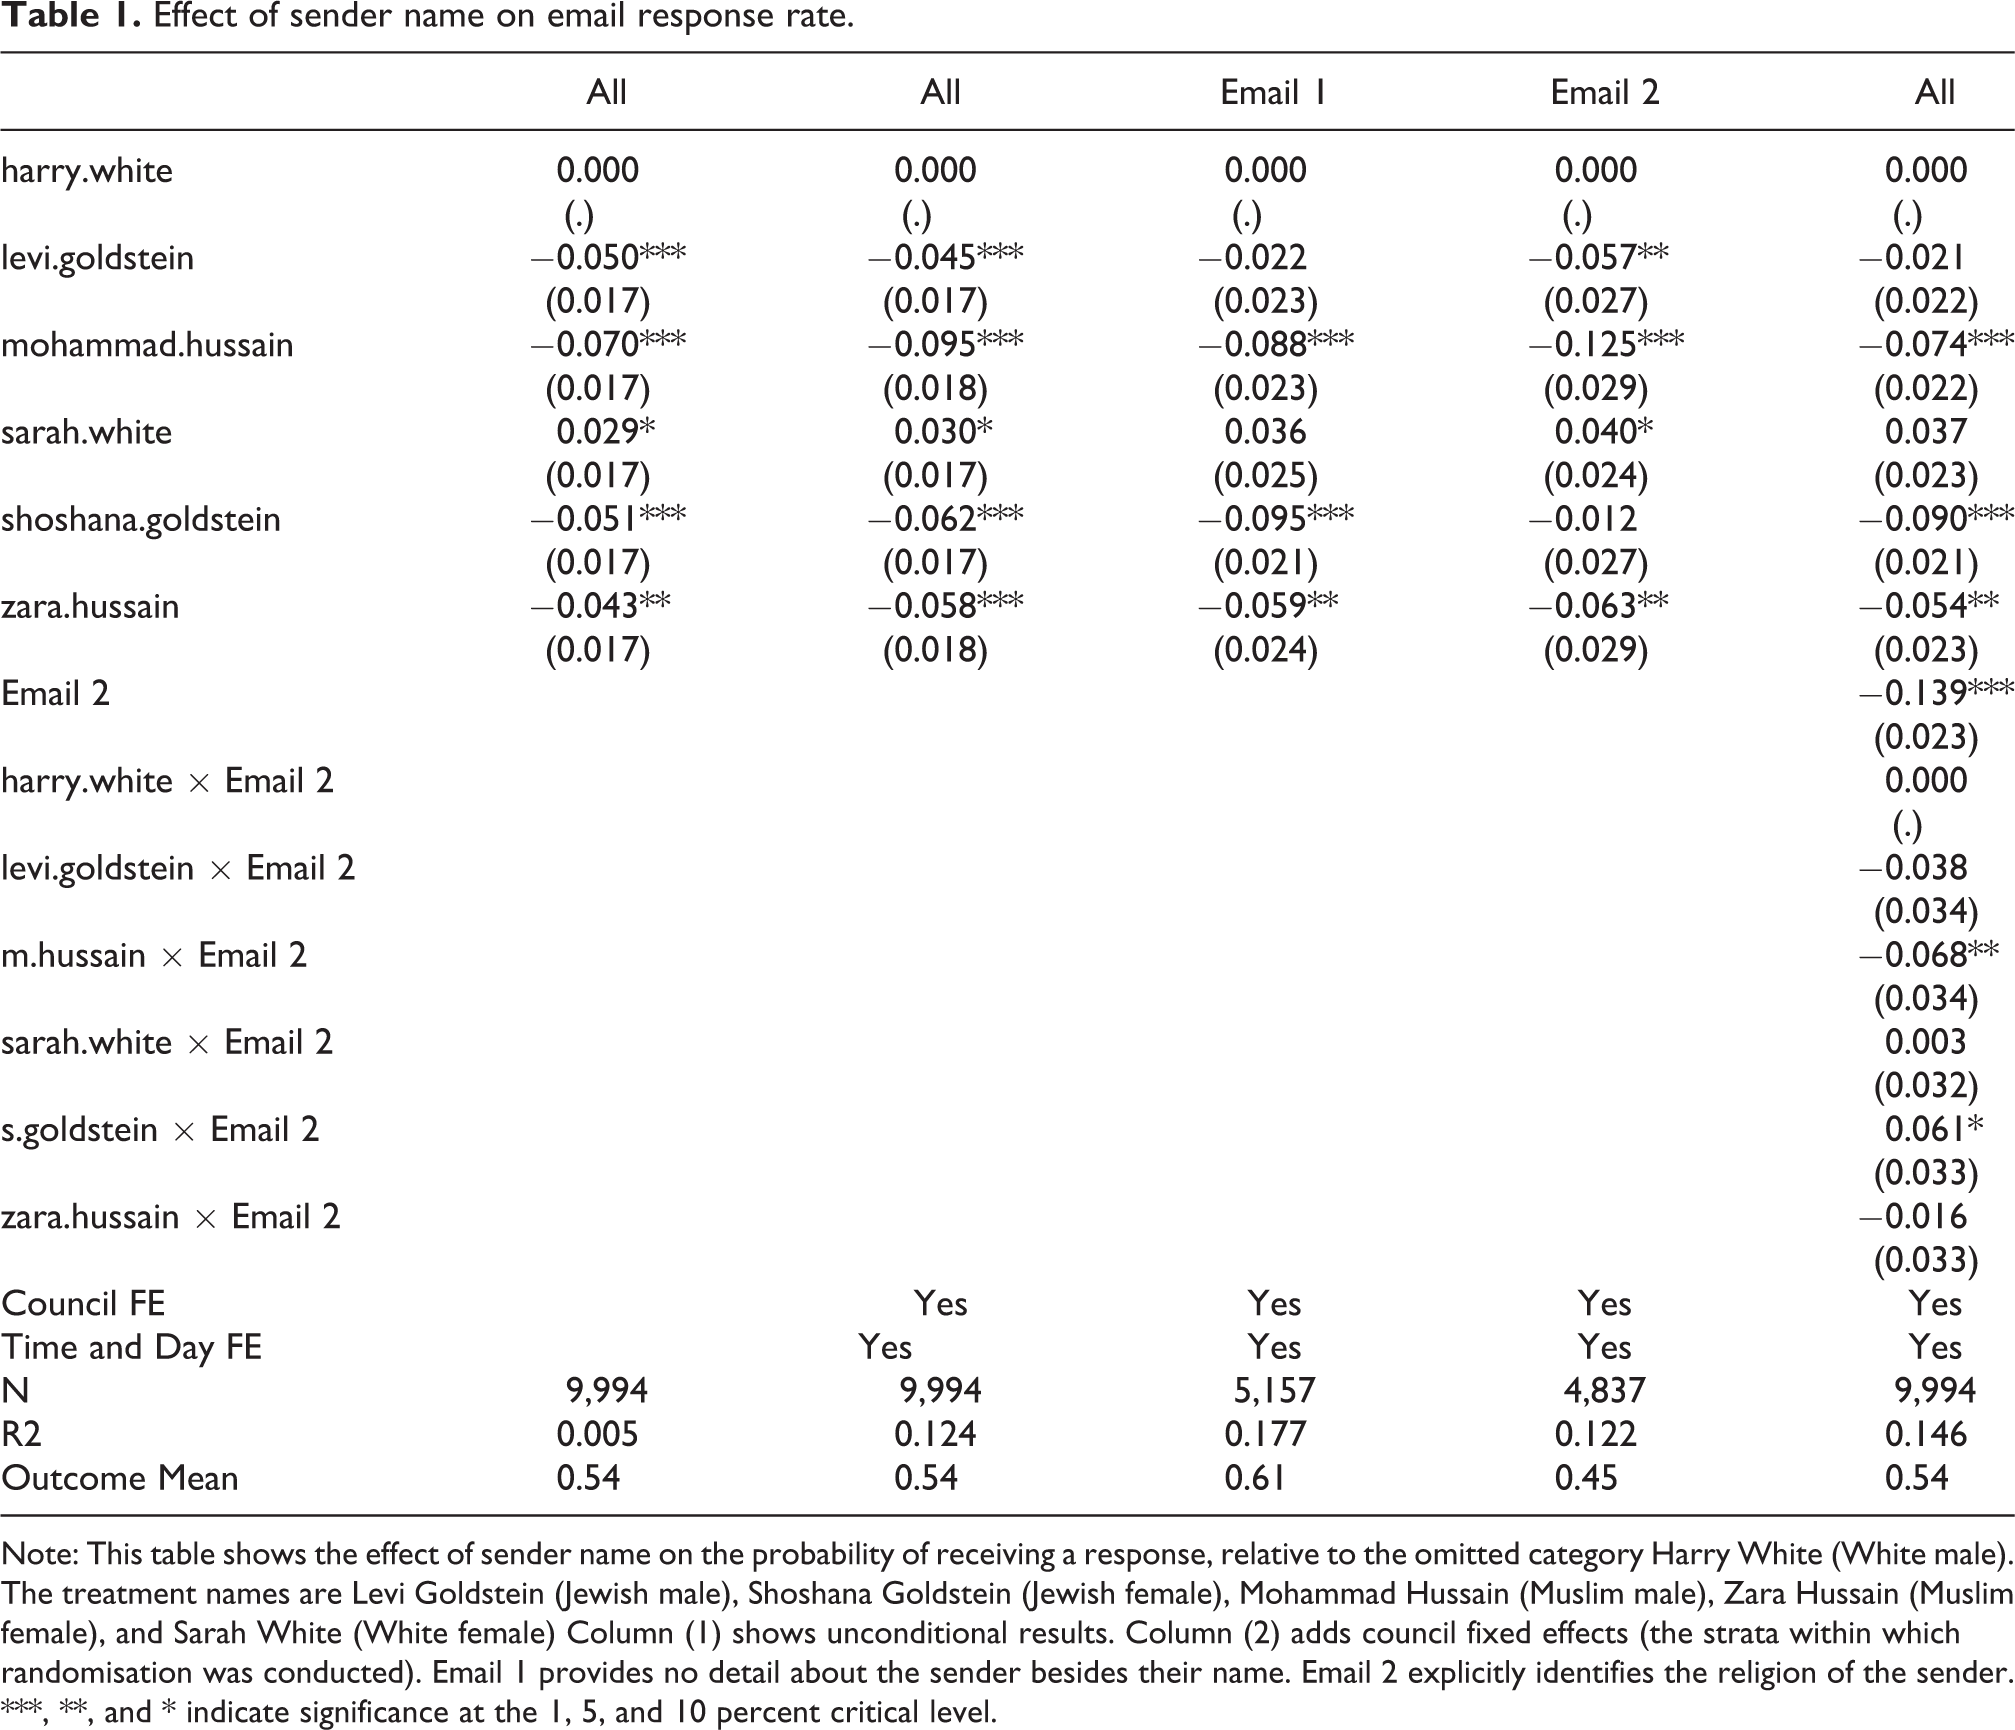
Note: This table shows the effect of sender name on the probability of receiving a response, relative to the omitted category Harry White (White male). The treatment names are Levi Goldstein (Jewish male), Shoshana Goldstein (Jewish female), Mohammad Hussain (Muslim male), Zara Hussain (Muslim female), and Sarah White (White female) Column (1) shows unconditional results. Column (2) adds council fixed effects (the strata within which randomisation was conducted). Email 1 provides no detail about the sender besides their name. Email 2 explicitly identifies the religion of the sender. ***, **, and * indicate significance at the 1, 5, and 10 percent critical level.
Overall, bias in response rates is similar across the two types of emails that represent different levels of religious identification. This suggests that the discrimination occurs based on the name of the sender alone, rather than the explicit identification of the sender’s religion. The differences between bias in response to the two emails are statistically significant at the 5 percent level for just one of the names – Mohammad Hussain.
Understanding sources of bias
In this section we test several possible explanations for the observed bias. First, we estimate differences in bias by political party, directly addressing the public debate about whether there is more anti-Semitism in the Labour Party and Islamophobia in the Conservative Party.
Second, we consider the ‘contact hypothesis’ (Allport, 1954; Paluck et al., 2018). White councillors who have less interpersonal contact with minority groups may display greater bias. We proxy for contact by measuring the share of the local population that is non-white, and the local population density. Our test here is not conclusive, as it could be that less-biased councillors are selected in more dense and diverse locations.
Third, we consider the role of competition in reducing bias. In his theory of discrimination, Becker (1957) noted that discrimination imposes a cost, and so should be reduced in more competitive environments. This has been shown quasi-experimentally to be the case in labour markets (Ashenfelter and Hannan, 1986; Levine et al., 2008; Winter-Ebmer, 1995) and experimentally in consumer markets (Nunley et al., 2011). In our context, we consider whether bias is lower when elections are nearer in time, or when the last election was won by a narrower margin, as would be predicted by theory. To do this we measure the number of days until the next election, and the winning vote margin at the most recent election.
Finally, we assess bias by individual councillor characteristics – sex and race. In both cases we estimate sex and race based on their name, using algorithms developed by algorithm developed by Vanetta (2015) and Laohaprapanon and Sood (2018), respectively.
Bias against Jewish names is statistically significantly higher from Conservative Party councillors than Labour Party councillors (Figure 2). Other differences between parties are not statistically significant. Within each party, bias is similar towards Jewish and Muslim names (none of the differences are statistically significant). Thus contrary to the popular narrative, Labour councillors do not discriminate against Jewish names more than Muslim names, and Conservative councillors do not discriminate against Muslim names more than Jewish names. If anything, it appears that Conservative councillors are more discriminatory towards Jewish names.
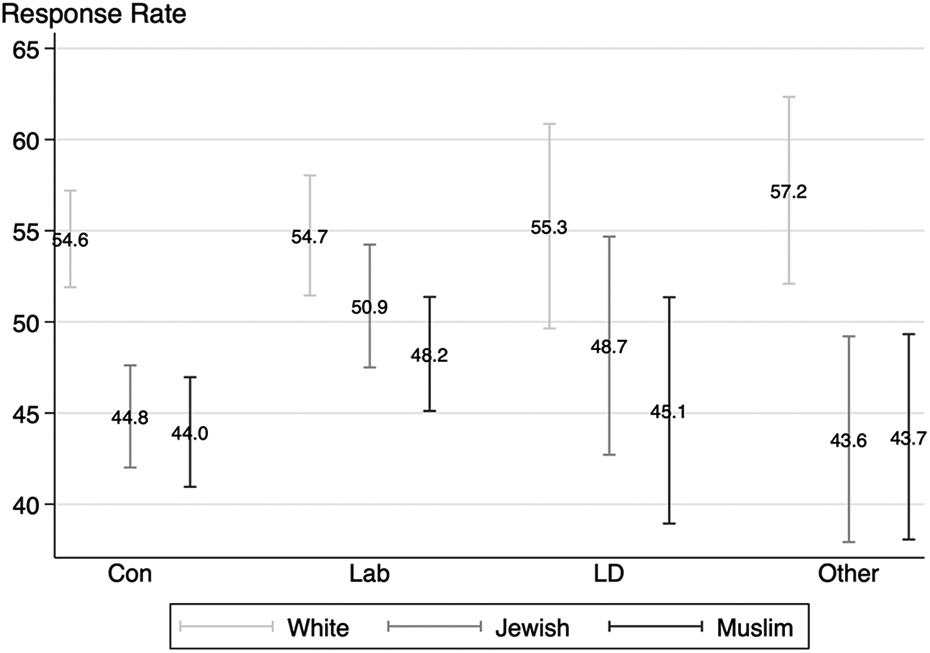
Response rates by political party. Note: Response rates are estimated after removing council fixed effects, and standardising residuals to a response rate equal to the sample average of 55 percent for whites. Bars represent 95 percent confidence intervals. For Conservatives and ‘Other’ councillors, the difference between White and both of the other names is statistically significant. For Labour and the Liberal Democrats, only the difference between White and Muslim is statistically significant.
Overall we do see greater bias against non-Christian names in the least densely populated locations with small non-white populations (Figure 3). This difference remains after controlling for the ethnicity of the councillors themselves. The effect could be driven by councillors in homogenous rural areas being particularly suspicious of emails from a member of a minority that is not well represented in their area. We consider this to be unlikely, as we also see negative bias in the middle quintiles of density and diversity. Alternatively then, councilors living in these small non-white populations may have had less contact with minorities, and, in line with contact theory, would show greater levels of discrimination.
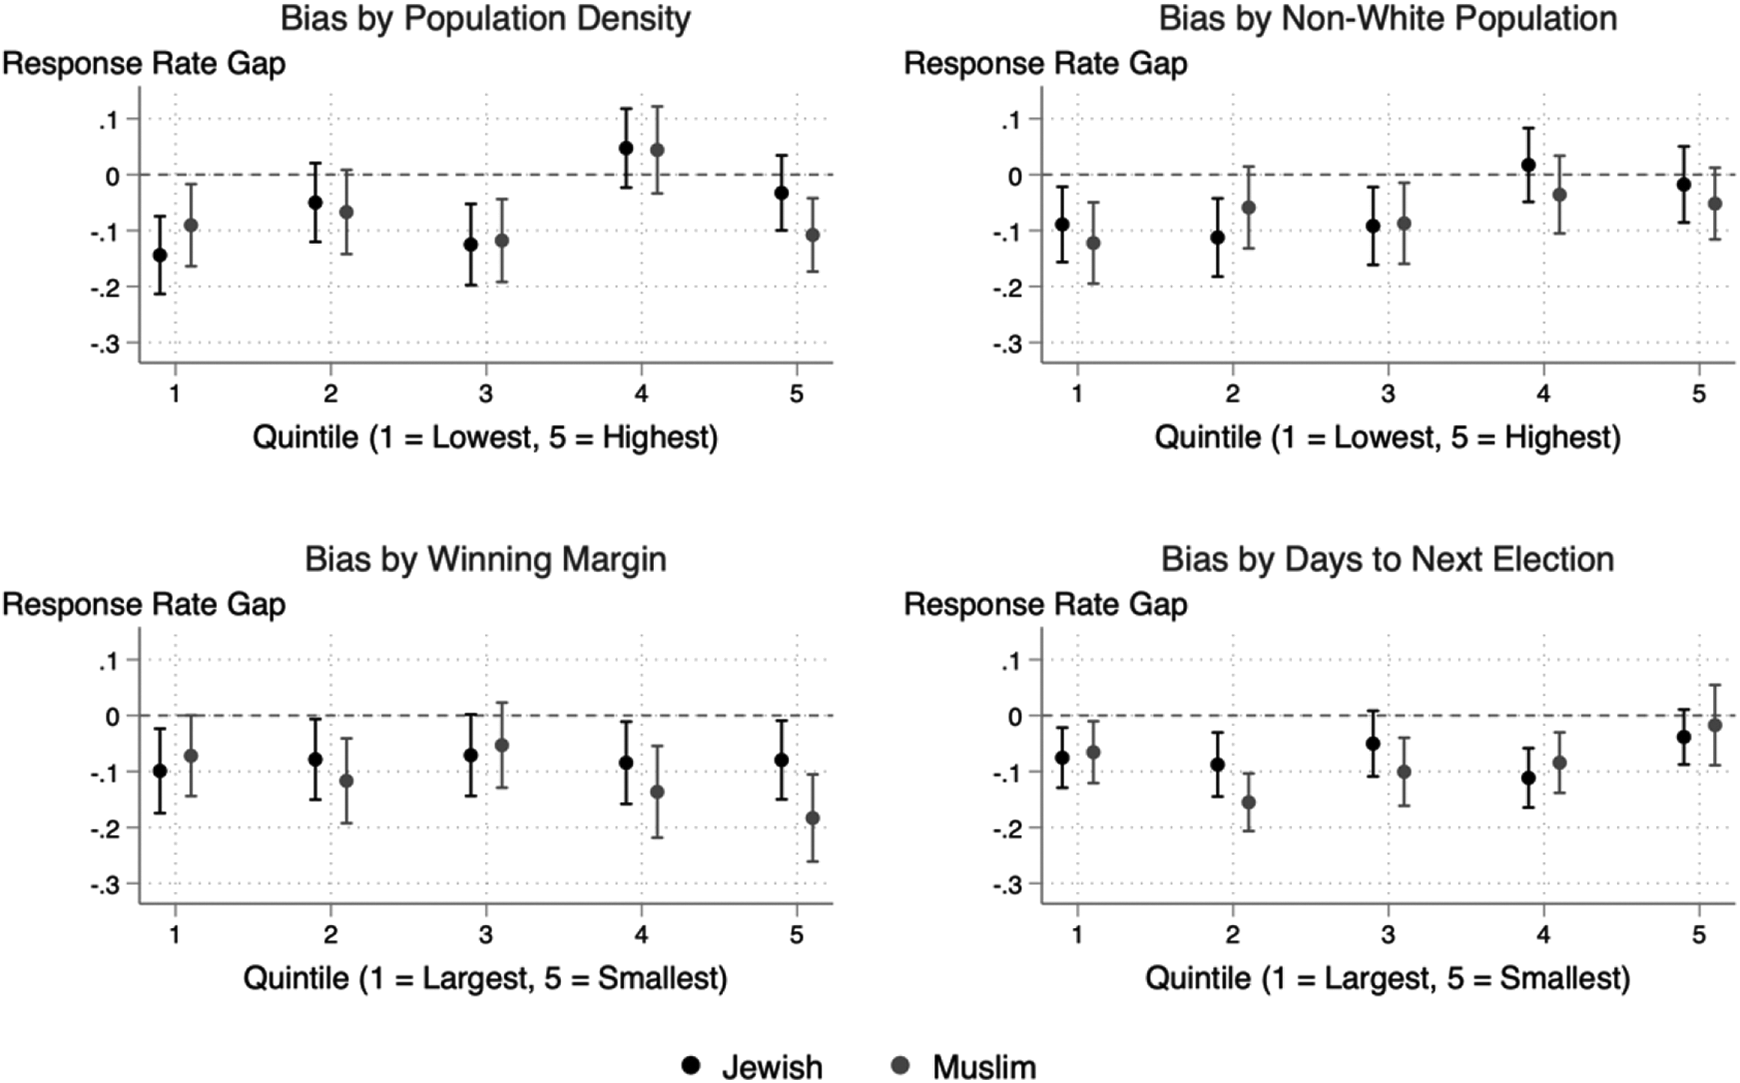
Response rates by location type. Note: The top-left figure shows a binned scatterplot of response rates against population density, by whether the sender name was Christian or non-Christian. The top-right figure shows response rates against the non-white population share. The bottom-left shows the response rate against the winning margin of the elected councillor at the last election. The bottom-right shows the response rate by the number of days until the next election. Fitted lines are polynomial regressions of order three, with bars showing 95 percent confidence intervals. Population density and non-white population shares are calculated at the ward (sub-council) level from 2011 census data. On average there are three councillors in each ward. Population density is expressed as residents per hectare.
We don’t see any systematic relationship between the measures of political competition and the degree of discrimination, suggesting that electoral incentives are not enough to address this bias.
Finally, we unsurprisingly see much lower levels of bias by Jewish or Muslim councillors, though these estimates are imprecise due to the small number of such councillors (Table A10).
Conclusion and discussion
We find evidence for bias from local politicians in response to requests for basic information from putatively ‘Jewish’ or ‘Muslim’ constituents. Despite the media narrative of anti-Semitism in the Labour party and Islamophobia in the Conservative party, our results suggest that both parties are equally discriminatory to both minority groups. This discrimination seems to occur based on names alone, and is unchanged by the explicit identification of religious identity. Due to the high volume and low cognitive effort of checking emails, councilors may be acting unconsciously when exposed to non-Christian/minority group names (Bertrand et al., 2005: 96; Hughes et al., 2019). This may also suggest that the discrimination observed is primarily based on ethnic rather than religious identity, or that ethnicity has in fact been conflated with religious identity by the dominant race and so any explicit signalling does not have any effect. Alternatively, councillors may simply be consciously discriminating against minority constituents, irrespective of their degree of self-identity. Because the identity of the sender is present in the email address itself, councillors may simply choose to not even open the emails from names associated with minority groups. There was a statistically significant difference between the different emails for Mohammad Hussein though, which could suggest a heightened level of discrimination towards Muslim men that signal their religiosity. This finding is in line with previous correspondence study in the Norwegian job market where male applicants from more religiously visible groups experienced greater discrimination (Di Stasio, 2019).
These effects are largest in areas with rural areas (with low population density) and with small non-white populations. Councillors in such areas may have fewer opportunities for positive interactions with minority groups.
There are several limitations in our study. First, our sample may not be representative of all councils in the UK due to the way we acquired the councillor’s email addresses. Since we might expect the urban councils in our sample to have lower levels of discrimination than other councils, our results can be considered a lower bound on the degree of discrimination nationally. Second, our analysis of heterogeneity (on political party, population density, and political competition), though pre-registered, is not randomly assigned.
This work demonstrates that even access to basic services are susceptible to forms of discrimination, and that minority group members may struggle to be heard through this process. Reducing councilor bias could be attempted through training designed to reduce implicit prejudice (Lai et al., 2013). The leader of the Labour Party has announced the party’s commitment to undergoing this type of training, though more research is needed into the effectiveness of such training. 9 Future studies may benefit from further investigating the process through which politicians engage with their community, and identify ways in which to reduce these biases.
Supplemental material
Supplemental Material, sj-docx-1-ppq-10.1177_13540688211021053 - Discrimination by politicians against religious minorities: Experimental evidence from the UK
Supplemental Material, sj-docx-1-ppq-10.1177_13540688211021053 for Discrimination by politicians against religious minorities: Experimental evidence from the UK by Lee Crawfurd and Ukasha Ramli in Party Politics
Footnotes
Authors’ note
A pre-analysis plan for this study is registered at the AEA RCT Registry under registration number 0003876. The study was approved by the LSE Research Ethics Committee (ref. 1014). Lee once ran unsuccessfully for local elections as a Green Party candidate, has voted for the Liberal Democrats, and been a member of the Labour Party. Kash joined the Conservative Party in 2018 when it appeared that only Conservative Party members would have a vote on who the next Prime Minister of the UK would be. In the end there was no vote at all as the challenger to Theresa May dropped out, and so Kash wasted his £25.
Acknowledgement
We thank Stephen Olet for research assistance. Helpful comments were provided by Georgina Turner, Hector Rufrancos, Nicholas Farhi, Vikram Pathania, and Iftikhar Hussain. We also thank all of the councillors who responded (or did not) to our emails. Data on councillors came from http://opencouncildata.co.uk, on local area characteristics from nomisweb.co.uk, and on election results from Andrew Teale ![]() .
.
Declaration of conflicting interests
The author(s) declared no potential conflicts of interest with respect to the research, authorship, and/or publication of this article.
Funding
The author(s) received no financial support for the research, authorship, and/or publication of this article.
Supplemental material
Supplemental material for this article is available online.
Notes
References
Supplementary Material
Please find the following supplemental material available below.
For Open Access articles published under a Creative Commons License, all supplemental material carries the same license as the article it is associated with.
For non-Open Access articles published, all supplemental material carries a non-exclusive license, and permission requests for re-use of supplemental material or any part of supplemental material shall be sent directly to the copyright owner as specified in the copyright notice associated with the article.