
Abstract
It is often claimed that computational methods for examining textual data give good enough party position estimates at a fraction of the costs of many non-computational methods. However, the conclusive testing of these claims is still far from fully accomplished. We compare the performance of two computational methods, Wordscores and Wordfish, and four non-computational methods in estimating the political positions of parties in two dimensions, a left-right dimension and a progressive-conservative dimension. Our data comprise electoral party manifestos written in Finnish and published in Finland. The non-computational estimates are composed of the Chapel Hill Expert Survey estimates, the Manifesto Project estimates, estimates deriving from survey-based data on voter perceptions of party positions, and estimates derived from electoral candidates’ replies to voting advice application questions. Unlike Wordfish, Wordscores generates relatively well-performing estimates for many of the party positions, but despite this does not offer an even match to the non-computational methods.
Introduction
Since the classical works by Downs (1957) and Stokes (1963), the ideological positioning of political parties has been much examined in political science. In empirical work it is common to estimate relative party positions in key political issues or along key ideological dimensions (Benoit and Laver, 2006). More recently, such estimations have often been done using computational methods with machine learning elements to examine such textual data as party manifestos. However, it is unclear whether the performance of computational methods in the estimation tasks offers an even match to the available non-computational methods. We comprehensively compare party position estimates received using computational and non-computational methods in the context of the five consecutive parliamentary elections of 2003, 2007, 2011, 2015 and 2019 in Finland, which is one of Europe’s and the European Union’s multiparty democracies. Our focus is on the quality of the position estimates received when using two common computational methods, Wordscores and Wordfish, in comparison to estimates given by four non-computational methods. More specifically, as party positions in the ideological space are not directly observable, we examine the correlational convergence of the non-computational and the computational party position estimates to assess the validity of the computational methods. In this way we assess to what extent the computational estimates may suffice to replace the estimates received when using the usually more laborious non-computational methods.
The first non-computational method we use relies upon expert judgments, such as survey responses received from political scientists (Benoit and Laver, 2006; Ray, 1999). The second non-computational method type builds upon specialized quantitative content analysis of party electoral manifestos, requiring an initial manual coding of textual elements according to a coding sheet (Budge et al., 1987, 2001). The third non-computational method type derives party positions from voter responses in mass surveys (Trechsel and Mair, 2011; van der Brug, 2001). Using the fourth method type, parties are positioned using data from answers given by electoral candidates to questions in voting advice applications (Gemenis, 2013).
Computational methods have become increasingly popular in party position estimation (Grimmer and Stewart, 2013). There were some early methods (for instance, Monroe and Maeda, 2004), but the first computational method to rise into any prominence was the supervised latent trait scaling method Wordscores (Laver et al., 2003). It uses training texts representing supposedly known political positions of political parties to position other parties along some specific dimension. The unsupervised latent trait scaling method Wordfish is also reasonably well known (Slapin and Proksch, 2008). Wordfish examines aspects of the statistical distribution of words in documents, creating a polar dimension of political positions without researcher intervention. The authors of computational methods have claimed that their methods would give estimates that reasonably correspond to the positions received by means of non-computational methods (Laver et al., 2003; Slapin and Proksch, 2008). What is more, these authors have promised drastic cost-cutting in examining political positions (Grimmer and Stewart, 2013; Hjorth et al., 2015; Laver et al., 2003; Slapin and Proksch, 2008).
We join previous research assessing the comparative performance of computational and non-computational methods of party position estimation. However, the scope of our comparison between different methods is particularly wide. Previously, Wordscores results have been compared to positions calculated using Manifesto Project data (Bräuninger et al., 2013; Budge and Pennings, 2007; Hjorth et al., 2015; Klemmensen et al., 2007; Ruedin, 2013; Slapin and Proksch, 2008), positions acquired from Chapel Hill Expert Surveys (CHES; Hjorth et al., 2015), and positions according to other expert surveys (Klemmensen et al., 2007; Laver et al., 2003; Slapin and Proksch, 2008). Wordfish positions have been compared to Manifesto Project positions (Backlund, 2013; Hjorth et al., 2015; Proksch et al., 2011; Slapin and Proksch, 2008), the CHES results (Hjorth et al., 2015), and to the results of other expert surveys (Backlund, 2013; Slapin and Proksch, 2008). Directly pertinent to our study, Thomas Bräuninger and his colleagues compared Wordscores party positions to the positions given by the Manifesto Project left-right indicator using Finnish electoral manifestos from 1983 to 2007, receiving only a low correlation between the two sets of position estimates (Bräuninger et al., 2013). Recently, Ruedin and Morales (2019) compared the performance of Wordscores and Wordfish with immigration policy positions from the Manifesto project, and with expert survey, keyword and checklist estimates, receiving inconsistent or poor Wordscores and Wordfish results.
We identify a research gap in the dearth of clearly broad-based comparisons between the two distinctively different types of methods of party position estimation—computational and non-computational methods. More specifically, we detect this gap in examining the positioning of parties not only in the substantially researched left-right dimension, but also in the progressive-conservative dimension increasingly emphasized in party positioning research. Secondarily, we contribute to research on party positioning methods using texts written in other than globally leading languages.
We will assess the positioning performance of Wordscores and Wordfish using data comprising parliamentary election manifestos published in Finland related to all parliamentary elections held from the beginning of the 2000s until 2019. For comparators, we use the Chapel Hill (CHES) position estimates representing expert surveys; the Manifesto Project position estimates representing an advanced variant of quantitative content analysis; the aggregated results of the Finnish National Election Study (FNES) representing mass surveys; and the refined results of electoral candidates’ responses in Finland’s two foremost voting advice applications (VAAs). Broadening the scope, we compare positioning not only in the left-right scale (Bräuninger et al., 2013; Hjorth et al., 2015), but also in the socio-cultural progressive-conservative dimension of political positions (Bruinsma and Gemenis, 2019). Our contribution builds and extends upon previous research (such as Bruinsma and Gemenis, 2019; Hjorth et al., 2015; and in this journal, Ruedin and Morales, 2019) in three ways. In our comparisons, we include previously unused data on party positions from voting advice applications and national election studies. Furthermore, we not only examine one dimension of political positions but two dimensions. Finally, we examine manifestos published in a non-Indo-European language, namely the Finno-Ugric language of Finnish.
Our research question is: How do the Wordscores and Wordfish party position estimates perform in the left-right dimension and the progressive-conservative dimension in comparison to the Chapel Hill Expert Survey estimates, the Manifesto Project estimates, estimates aggregated from the survey data of the Finnish National Election Study, and estimates derived from the data of Finland’s two foremost voting advice applications? More specifically, we examine the comparative performance of the two computational methods using the results obtained using the four non-computational methods as benchmarks. Doing this, we examine correlational convergence between estimates acquired using non-computational methods and estimates acquired using computational methods. Our results indicate that Wordscores performs relatively well in party position estimation which may suffice for some tasks, but falls short of the benchmark set by the four non-computational methods. Wordfish by and large fails to perform in delivering estimates which would match the estimates one receives using non-computational methods.
Six methods of party position estimation
The four non-computational methods
The Chapel Hill Expert Survey (CHES) is the longest-running survey in its category concerning Europe’s democracies. In 2014 the CHES was administered to 337 political scientists specializing in political parties and European integration, and the resulting dataset positioned 268 parties in dimensions of political ideology, European integration, and selected policy areas (Polk et al., 2017). Generic problems with expert surveys include the substantial costs of repetition over time and across countries, the lack of possibilities to correct missing or wrong information, and the risk that experts understand and answer questions in different ways across countries and over time (Budge, 2000; Slapin and Proksch, 2008; Steenbergen and Marks, 2007).
The manual coding of the contents of texts according to predetermined categories is firmly established in quantitative content analysis (Krippendorff, 2012). In the Manifesto Project, data acquisition takes place by units called quasi-sentences coded into 56 predefined issue categories (Budge et al., 1987, 2001), which are grouped into seven major policy areas (Werner et al., 2015). Party position estimates are calculated using these data. Problems with the Manifesto data include limited comparability and consistency between countries and time with the possible confounding of right-wing, neutral, and left-wing issues; issues of reliability and robustness; the necessity of revising the coding scheme from time to time; and the costly and tedious replicability of the coding procedures (Benoit and Laver, 2007; Dinas and Gemenis, 2010; Slapin and Proksch, 2008).
Aggregated voter data from mass surveys can also be used to derive party positions based on voters’ perceptions. Data from all respondents is commonly used to catch the views of voters on party positions, but there are other alternatives, such as using only party members’ views. We use data from the Finnish National Election Study (FNES). Challenges with mass survey aggregates include the voters’ varying levels of political information (Tilley and Wlezien, 2008), and the voters’ affection or disaffection toward parties, both of which may affect their perceptions of party positions (Merrill et al., 2001).
With data from voting advice applications (VAAs) for estimating party positions, one can use the median or the mean positions calculated over all candidates for a party as a measure of the party position. However, it is not clear whether one should use the responses from all party candidates or only those elected. Furthermore, there may be VAA questions formulated by people with limited competence in questionnaire development that may compromise the quality of the questions (see, e.g. Gemenis, 2013: 271–276). Finally, regardless of their quality, the VAA questions may not capture the different dimensions of political positions to a sufficient extent if these questions have been designed for other purposes.
The two computational methods
Using Wordscores, researchers first identify training texts representing extremes in a political space, and next estimate the positions of other texts in relation to these training texts. This enables placing party manifestos in a continuum from one extreme to the other (Laver et al., 2003). The utility of Wordscores critically depends on the researchers’ ability properly to recognize the dimension of the policy positions under examination, and to select texts representing extremes in this dimension (Bruinsma and Gemenis, 2019; Slapin and Proksch, 2008). Validation studies to overcome issues of low robustness and inaccuracy have given mixed results concerning the performance of Wordscores in comparison to expert surveys and Manifesto Project estimates, suggesting that Wordscores may not live up its inventors’ claims of fast, easy and accurate party position estimation (Bruinsma and Gemenis, 2019).
Wordfish does not require training texts, but uses frequency distributions of words in political texts to estimate party positions (Slapin and Proksch, 2008). Wordfish assumes that the relative usage of words in a text indicates the placement of this text in relation to other, comparable texts. The inventors of Wordfish, Jonathan B. Slapin and Sven-Oliver Proksch, claim that if the examined texts represent the entirety of parties’ policy positions, Wordfish will extract a left-right dimension from these texts (Slapin and Proksch, 2008).
Wordfish builds on the assumption of the ideological use of language, presupposing that each actor’s ideological leanings determine this actor’s political position (Grimmer and Stewart, 2013). However, Grimmer and Stewart suggest that there are cases where this assumption does not hold. Moreover, research suggests that Wordfish performs better with polarized than other vocabularies (Hjorth et al., 2015). Wordfish assumes that word meanings remain stable over time (Slapin and Proksch, 2008), but may confuse semantic changes with substantial policy shifts, and issue saliency with party positions (Backlund, 2013). Moreover, the Wordfish algorithm is sensitive to the number of texts used, which suggests ensuring that enough manifestos are included in the examination (Slapin and Proksch, 2008).
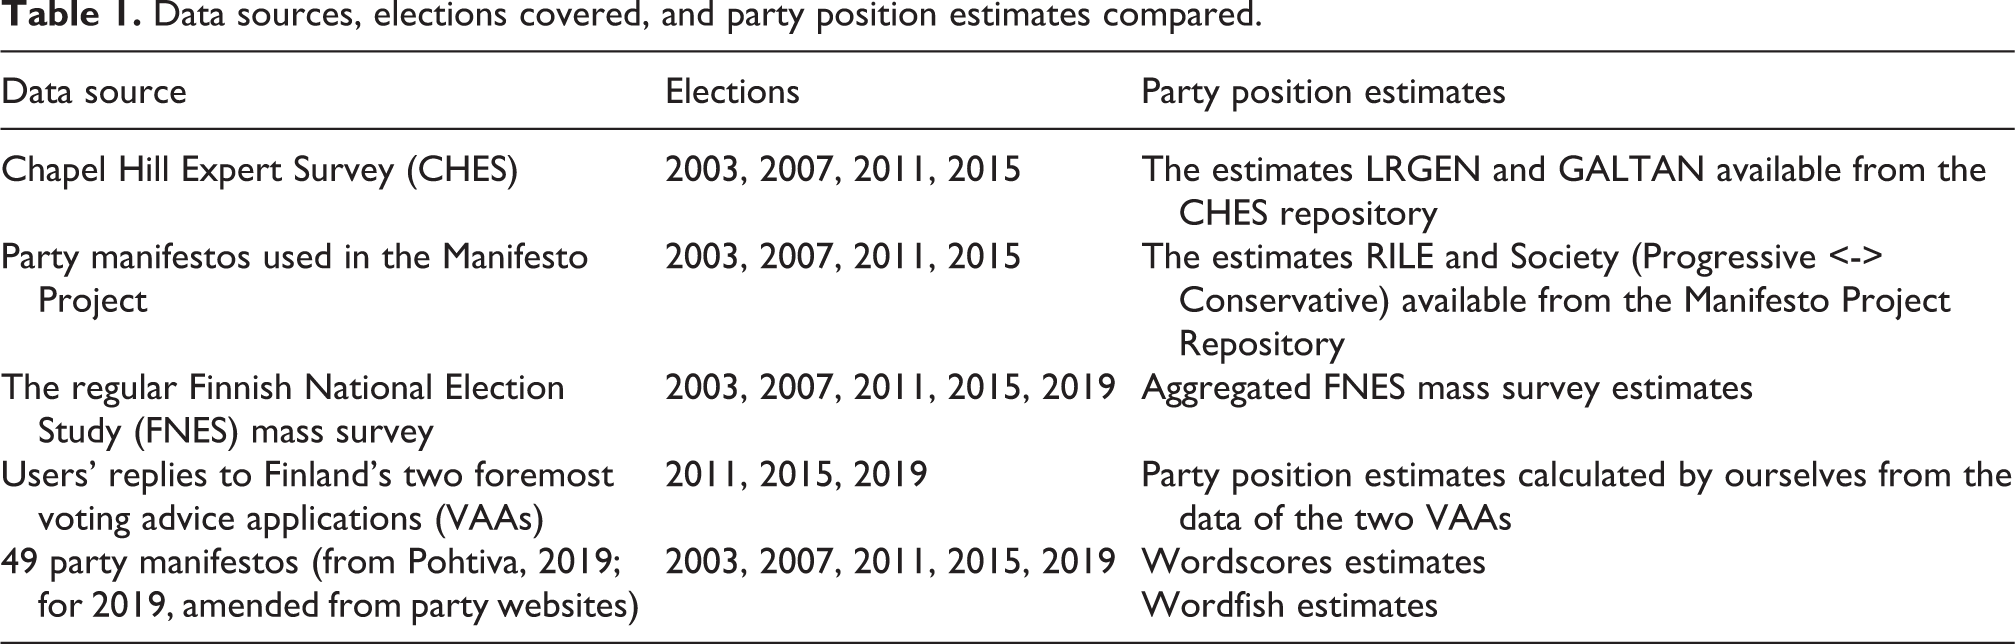
Data
We acquired the CHES and the Manifesto Project party position estimates from the CHES and Manifesto repositories, and we used the available aggregated Finnish National Election (FNES) mass survey estimates of party positions. For the voting advice application-based estimates, we used data from Finland’s two foremost VAAs maintained by the Finnish Broadcasting Company (FBCVAA) and Finland’s highest-circulation newspaper Helsingin Sanomat (HSVAA), and calculated party position estimates from these data. As concerns the two computational methods, we used complete electoral manifestos as the raw data input, pruned these data by means of established data mining procedures, and used the pruned data as input for generating party position estimates using Wordscores and Wordfish. Given that the CHES, Manifesto Project and FNES estimates were available ready-made, we only have to explicate our data preparation procedures for party position estimation when using the two sources of VAA data, and before using the two computational methods Wordscores and Wordfish. Table 1 indicates the data sources and the elections concerning which data were available, and compares the party position estimates.
Data sources, elections covered, and party position estimates compared.
Refining the voting advice application data
Data from two major Finnish voting advice applications (VAAs; FBCVAA, 2011, 2015, 2019; HSVAA, 2015, 2019) allow one to calculate party positions in the left-right and the progressive-conservative dimensions. Analogous to previous research (Isotalo et al., 2020; Reunanen and Suhonen, 2009; Westinen et al., 2016), we use exploratory factor analysis to identify ideological dimensions and calculate factor scores in order to position individual candidates in these dimensions. The party position estimates obtained by means of factor scores are comparable within election years, but do not capture shifts of party positions over time, as the center points of the dimensions comprise the mean values, which may change from election to election.
In some VAAs, voters are directly matched with parties such as in the German Wahl-O-Mat (Marschall, 2011). However, in the Finnish VAAs we use, the voters are matched primarily with individual candidates, and, moreover, no official party answers are acquired for the VAA questions. On these grounds we calculated party-level median candidate positions to represent the party positions.
Refining data for Wordscores and Wordfish
In obtaining party position estimates using Wordscores and Wordfish, our data comprises the same manifestos as the Manifesto Project does for the election years 2003, 2007, 2011 and 2015 (Volkens et al., 2019a) with only a few exceptions (see Online supplemental material 2 for these exceptions). Most party manifestos were available from the national party manifesto database Pohtiva of the Finnish Social Science Data Archive (Pohtiva, 2019); the 2019 electoral manifestos we retrieved from party websites. The total number of party manifestos from 2003 to 2019 in our dataset was 49, the number of separate documents 40, the average manifesto length 5 490 words, and the median manifesto length 3 989 words. The shortest manifesto had 455 and the longest 30 521 words (see Online supplemental material 2 for a detailed description of the manifestos used). Although parties are likely to differ in some respects when emphasizing issues in their manifestos, the main issues they cover tend to be the same, as all parties have incentives to address current political issues relevant during each electoral campaign period.
Methodological procedures
Political positioning in the left-right dimension using the four non-computational methods
The Chapel Hill Expert Survey (CHES) party position estimates are based on judgments acquired from researchers with expertise in party politics in each participating country (Hooghe et al., 2010). The CHES indicator to catch the left-right dimension (LRGEN) receives the value 0 for the extreme left, 5 for the political center point, and 10 for the extreme right. We used the 1999–2014 CHES trend file (Bakker et al., 2015), and selected estimates closest to the Finnish election years as proxies. However, no CHES positions near to the 2019 elections were available.
From among the Manifesto Project estimates (Volkens et al., 2019a) we used the left-right position indicator RILE (Volkens et al., 2019b) for the 2003, 2007, 2011 and 2015 elections. The RILE estimates were not available for the 2019 elections.
The Finnish National Election Study (FNES) data were available for our entire study period. In the FNES questionnaire, respondents are asked to place parties on an 11-point scale, where 0 indicates the position furthest to the left and 10 the position furthest to the right. We used the FNES data on voters’ assessments of the left-right position of the party of their vote choice, and calculated the means of these assessments for this party weighted by post-stratification weights related to the demographic characteristics of the individual respondents. Our post-stratification variables concern language, the district voter count, party vote shares, age, and gender. We calculated the weights using the R package anesrake (Pasek, 2018).
We calculated party positions from the responses parliamentary election candidates had given to questions in the two foremost voting advice applications in Finland (VAAs; FBCVAA, 2011, 2015, 2019; HSVAA, 2015, 2019). These VAA data were available related to the parliamentary elections of 2011, 2015 and 2019, but not the 2003 and 2007 elections. For the elections with available data, we aggregated the candidates’ responses to the VAA questions by means of a two-factor oblimin-rotated solution of exploratory factor analysis, using the R program package psych (see online supplemental material 3 for the results). The VAA question loadings on the two factors—left–right and GAL-TAN—followed our expectations. Next, we calculated factor scores for all candidates in the two dimensions using the regression method. Hence, the computed factor scores have a mean of zero and their standard deviation is the squared multiple correlation between factors and variables. From among the various methods for calculating factors scores, the regression method has been seen as the best performer when validity is used as a benchmark (Distefano et al., 2009). Finally, we calculated median candidate positions for each party to obtain the party positions (see Isotalo et al., 2020, for details).
Political positioning in the progressive-conservative dimension using the four non-computational methods
Examining the progressive-conservative dimension using the Chapel Hill Expert Survey (CHES) data we used the CHES GALTAN indicator concerning party positions on democratic freedoms and rights. “Libertarian” or “postmaterialist” parties favor personal freedoms, accepting abortion, same-sex marriage, and euthanasia. “Traditional” or “authoritarian” parties reject these ideas, supporting order, tradition, stability, and government as a moral authority (Hooghe et al., 2010). The availability of the GALTAN estimates and their timing in relation to the Finnish parliamentary elections is the same as with the CHES indicator LRGEN, considered above.
The progressive-conservative dimension is not included in the core Manifesto Project dataset nor explained in the Manifesto Project documentation. However, Manifesto Project data visualizations include instructions for estimating a Society (Progressive <-> Conservative) indicator (MARPOR, n.d.). We calculated Manifesto Project progressive-conservative position estimates for each party using these instructions. The Society indicator estimates were available for the same years—2003, 2007, 2011 and 2015—as the Manifesto Project RILE indicator estimates.
Unfortunately, there were no suitable survey items in the FNES questionnaires for estimating voter positions on the progressive-conservative dimension, which means that we do not have FNES party positions on this dimension at our disposal. The procedure for constructing party position indicators in the progressive-conservative dimension using data from the two Finnish VAAs was analogous with the one employed in the left-right dimension.
Political positioning in left-right and progressive-conservative dimensions using the two computational methods
Following good practices of computational research (Grimmer and Stewart, 2013; Lucas et al., 2015; Slapin and Proksch, 2008; Wilkerson and Casas 2017), we examined our party manifesto data using the R language programs tm and quanteda (Benoit et al., 2018; Feinerer et al., 2008). We pruned our data by removing punctuation and eliminating stopwords according to the Snowball list, and in addition we removed 15 very common words (see Online supplemental material 5 for list of these words). We did not use stemming given the evidence that stemming may combine words with different meanings (Denny and Spirling, 2018). For our Wordfish analysis, we removed uncommon words that appeared only in one document, and we removed party names, references to persons, and Internet addresses using r code as instructed in the Wordfish manual (Proksch and Slapin, 2009b). We used the Wordfish program in the R language Austin package (Lowe, 2015), and the Wordscores program within the R quanteda program. We used the Centre Party 2003 manifesto and the Green Party 2019 manifesto as direction documents when using Wordfish because they identify both left-right and progressive-conservative dimensions, and in addition catch the temporal difference between the years 2003 and 2019.
The original Wordscores article (Laver et al., 2003) and a later validation study (Bruinsma and Gemenis, 2019) emphasize that Wordscores results are highly dependent on the selection of the training texts. As no superior way for defining the Wordscores training texts exists, we used three different criteria to find the three sets of training texts that we needed. First, we used the Manifesto Project party position estimates to specify appropriate party manifestos for the endpoints and the midpoint of each dimension. The second set of our training texts was based on the CHES party position estimates. The third set of training texts comprises a modification of the second set, determining the positioning of parties in each dimension both by means of the CHES positions and the Manifesto Project positions, and selecting for the reference document for each party the document with the highest numbers of words, as advised by Laver et al. (2003). See Online supplemental material 2. for the training text lengths.
In our first Wordscores examination (MP-RILE) we pinned our training texts on the Manifesto Project RILE (left-right) indicator positions. We used the Left Alliance 2003 manifesto as one extreme with the value −10, the Coalition 2011 manifesto as the other extreme (10), and, given the entrenched position of Centre from among Finland’s parties close to the median of the political spectrum, the 2011 Centre manifesto as the centerpoint (0). The incompleteness should be noted that the Manifesto Projects positions were available only from 2003 to 2015.
For our second Wordscores examination (CHES-LRGEN), we pinned our anchor texts upon the indicator LRGEN of CHES, using the Left Alliance 2015 manifesto as one extreme (−10), the Coalition 2015 manifesto as the other extreme (10), and the Centre 2015 manifesto as the middle point (0). CHES positions were available from 2003 to 2015, thus only excluding 2019. For our third Wordscores examination (CHES-LR-longest), we selected the manifestos with the highest number of words as the training texts as advised by Laver et al. (2003). As both CHES positions and most Manifesto Project positions placed Left Alliance at one end and Coalition at the other end, we selected these parties’ longest manifestos as our training texts. Both estimates positioned Centre close to the center of the left-right dimension. This selection indicates the Left Alliance 2015 manifesto as one extreme (−10), the Coalition 2011 manifesto as the other extreme (10), and the Centre 2011 manifesto as the middle point (0).
Turning to examining the progressive-conservative dimension, we made three Wordscores estimations with the same dataset as the one used when examining the left-right dimension. First, as indicated, we based our examination (MP-Prog-Con) upon the Manifesto Project visualization indicator Society (Progressive <–> Conservative). We used the 2011 Finns manifesto as the training text for one extreme end (10), the Greens 2007 manifesto for the other extreme end (−10), and the SDP 2007 manifesto for the middle point (0). Second, we used Wordscores (CHES-GALTAN) with the CHES party position estimates as the reference, with the Finns 2015 manifesto as one extreme (10), the Greens 2011 manifesto as the other extreme (−10), and the Coalition 2011 manifesto as the centerpoint (0). Third, in a further Wordscores estimation (CHES-PC-longest) we first used the CHES GALTAN indicator to establish the extreme and middle ground parties, and next selected the manifestos with the highest word count, the Finns 2011 manifesto as one extreme (10), the Greens 2011 manifesto as the other extreme (−10), and the Coalition 2011 manifesto as the middle point (0).
To examine the left-right dimension with Wordfish, we made one estimation including all parties in our examination for the entire study period from 2003 to 2019. Wordfish comprises an unsupervised computational method delivering one and only one polar dimension, which is why we use the same estimation results of Wordfish also to examine the comparative performance of this method in respect to the other methods in the progressive-conservative dimension. Seeing as the progressive-conservative dimension comprises a major dimension analogously with the traditional left-right dimension, according to our assessment full manifestos rather than any of their parts were relevant for doing the examination.
Procedures for comparing the performance of the six methods
Following previous studies (Bräuninger et al., 2013; Dinas and Gemenis, 2010; Hjorth et al., 2015; Slapin and Proksch, 2008), we use correlation analysis to compare the performance of the six methods. We calculated both Pearson product moment correlation coefficients and Spearman rank correlation coefficients between the position estimates given by each of the methods. However, the Wordscores training text positions were excluded when calculating correlations.
To establish a comparison benchmark to assess the performance of the computational methods, we first calculated the correlations between the estimates received using each of the four non-computational methods. From among the correlations received we selected the lowest one for the benchmark. Next, we calculated correlations between the computational estimates and the non-computational estimates, and compared these correlations to the non-computational method benchmark. We assume that a computational method performs equally with the non-computational methods if the correlation coefficients of the computational estimates with the non-computational estimates equal our benchmark correlations.
The comparative performance of the computational and non-computational methods in party position estimation
Comparative positioning performance in the left-right dimension
Examining the political left-right dimension, both the Pearson and the Spearman correlation coefficients between the party position estimates given by the four non-computational methods are generally high (Table 2). The highest correlations prevail between the CHES and the FNES, the CHES and the VAAs, and the FNES and the VAAs estimates, namely close to or exceeding 0.90 and also satisfying the p ≤ 0.001 criterion. The Manifesto Project estimates have slightly lower correlations with the CHES, FNES and VAAs estimates than these three estimates have with each other. However, the Spearman correlations of the Manifesto Project estimates with the CHES and FNES positions satisfy the p ≤ 0.001 criterion, and the Manifesto Project Estimates with the VAAs estimates satisfy the p ≤ 0.01 criterion. Given that we have set the benchmarks at the lowest correlations between the non-computational estimates, the correlation benchmarks for the CHES estimates become 0.75 (Pearson) and 0.68 (Spearman), for the Manifesto Project estimates 0.64 (Pearson) and 0.56 (Spearman), for the FNES estimates 0.72 (Pearson) and 0.62 (Spearman), and for the VAAs estimates 0.64 (Pearson) and 0.56 (Spearman).
Pearson and Spearman correlations between the party position estimates acquired using six methods in the left-right dimension.
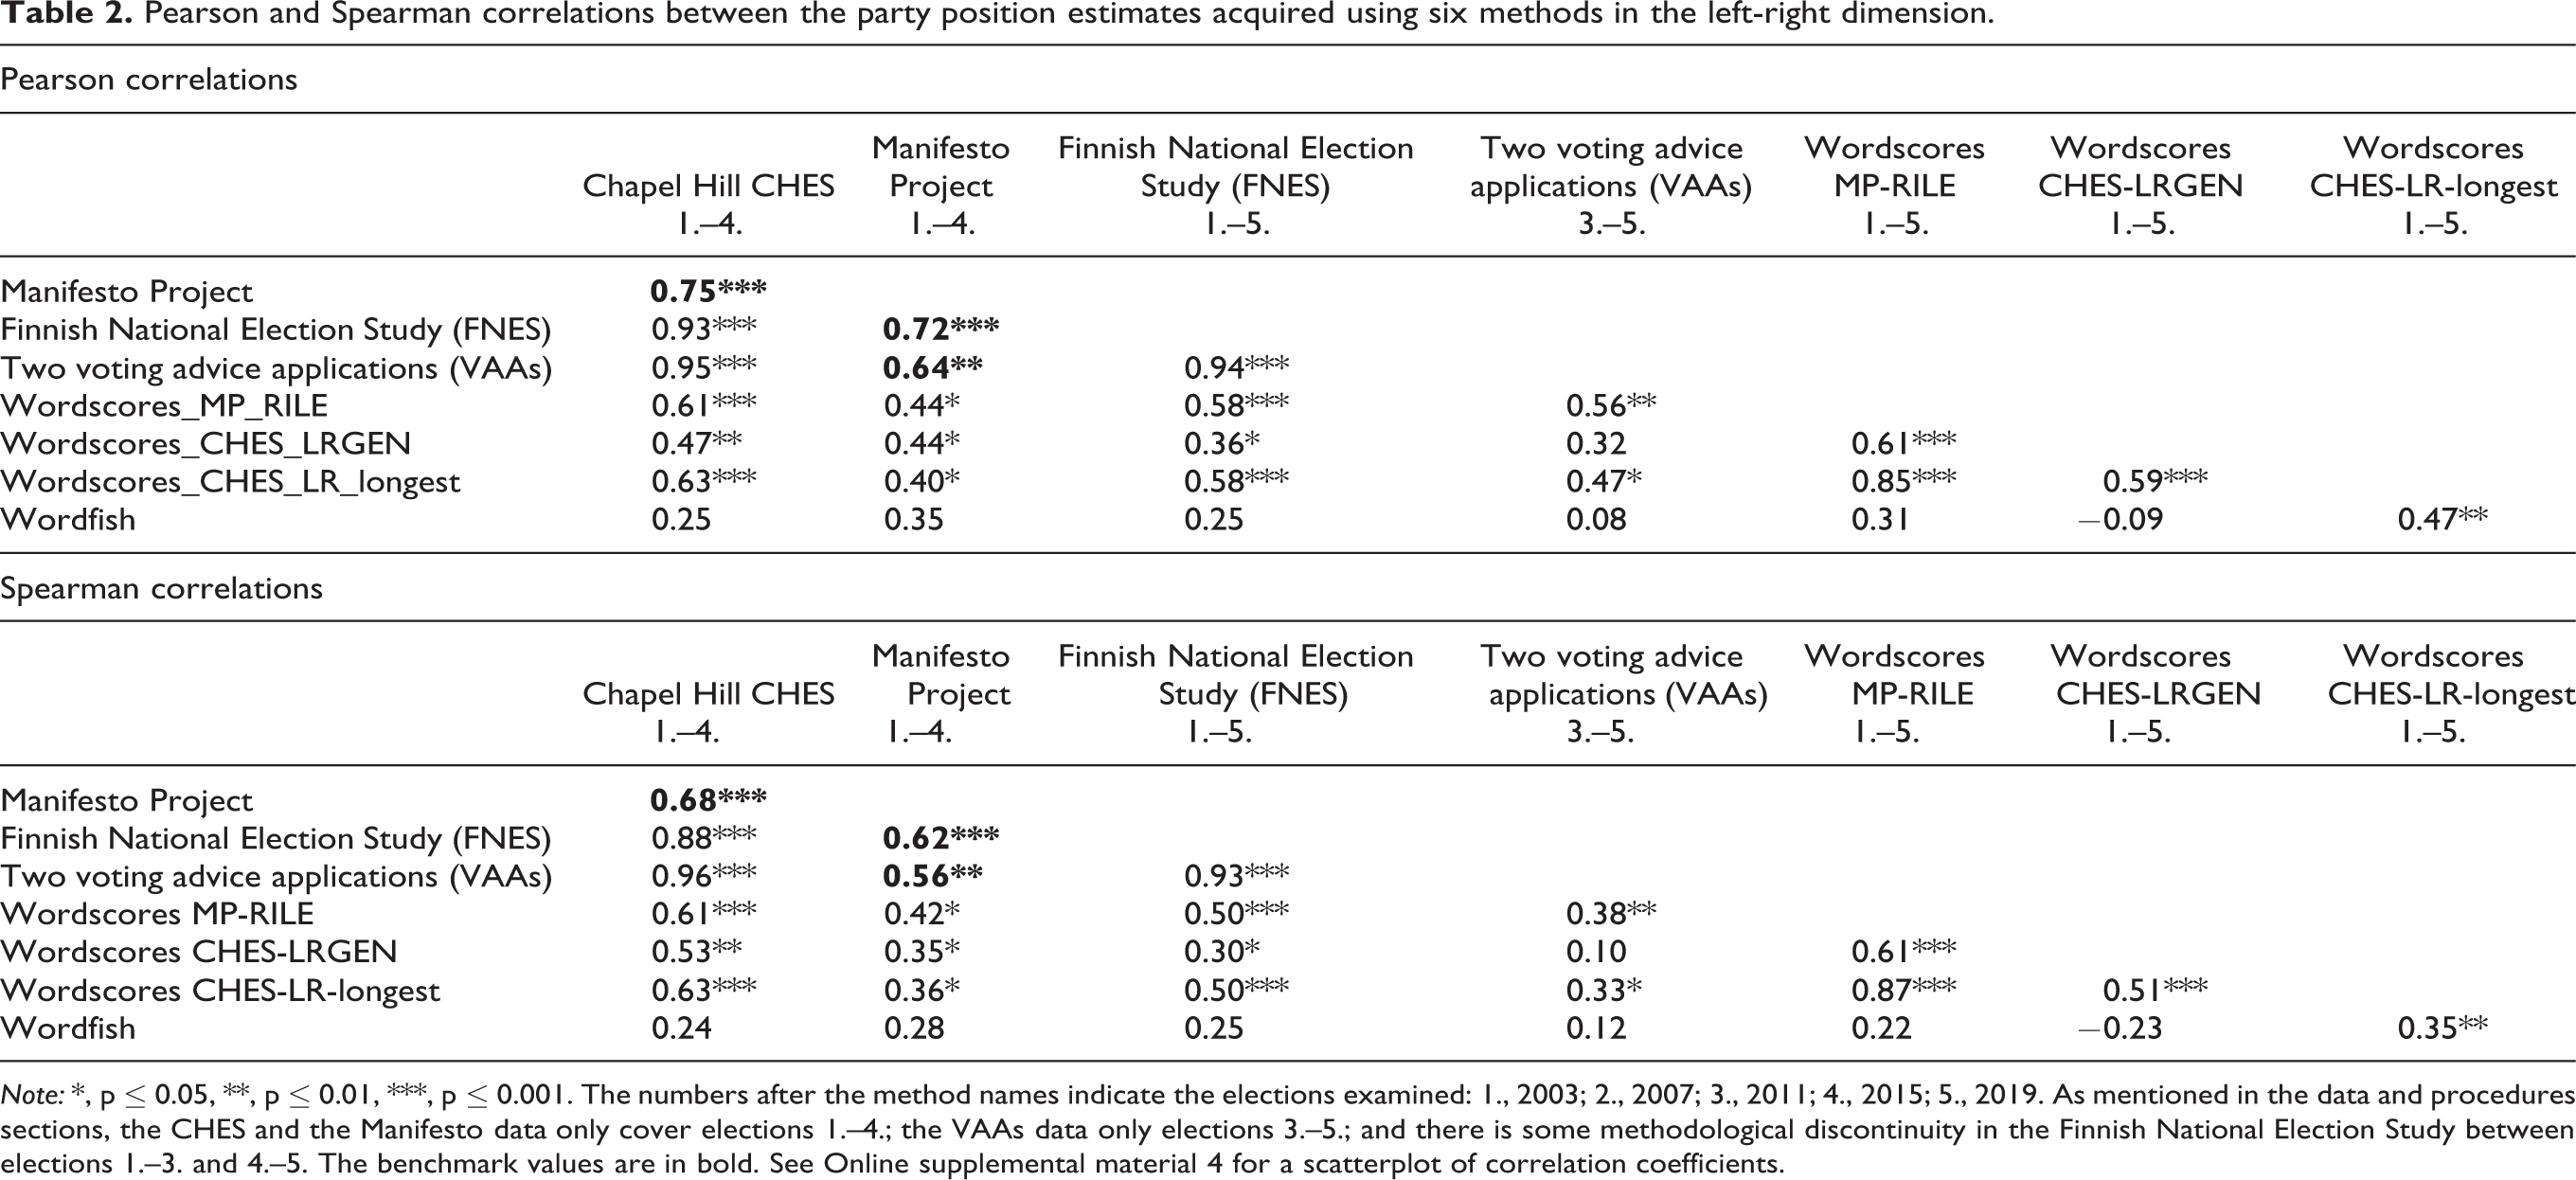
Note: *, p ≤ 0.05, **, p ≤ 0.01, ***, p ≤ 0.001. The numbers after the method names indicate the elections examined: 1., 2003; 2., 2007; 3., 2011; 4., 2015; 5., 2019. As mentioned in the data and procedures sections, the CHES and the Manifesto data only cover elections 1.–4.; the VAAs data only elections 3.–5.; and there is some methodological discontinuity in the Finnish National Election Study between elections 1.–3. and 4.–5. The benchmark values are in bold. See Online supplemental material 4 for a scatterplot of correlation coefficients.
The correlational analysis concerning the political left-right dimension indicates many quite high and statistically significant correlations between the Wordscores estimates and the non-computational estimates. However, the correlations between the Wordscores estimates and the CHES, Manifesto, FNES, and VAAs estimates are slightly lower than the correlation benchmarks, and at no instance does a Wordscores correlation coefficient match a benchmark. Moreover, the correlation between the Wordscores CHES-LRGEN and the VAAs estimates is not statistically significant. The differences between the magnitudes of the Pearson and Spearman correlations between the Wordscores MP-RILE, Wordscores CHES-LRGEN and Wordscores CHES-LR-longest estimates are too small to conclude that any of them would perform better or worse than its counterparts.
Wordfish estimates do not have a statistically significant correlation with any one from among the CHES, the Manifesto, the FNES or the VAAs estimates, and the correlation coefficients between the Wordfish estimates and the non-computational estimates are also generally lower than the other coefficients received (Table 2). Our benchmark test supports the conclusion that the Wordfish estimates do not adequately cover the left-right dimension.
Comparative positioning performance in the progressive-conservative dimension
Examining the progressive-conservative dimension, we compared the performance of the two computational methods—Wordscores and Wordfish—with three non-computational methods only, as the FNES party positions were not available for this dimension (Table 3). All correlations between the CHES, the Manifesto and the VAAs estimates are numerically high and statistically significant. A visible difference between the left-right dimension and the progressive-conservative dimension examinations comprises the two high and statistically significant correlations between the Manifesto and the VAAs estimates, 0.84 and 0.95. On these grounds, the correlation benchmark for CHES becomes 0.84 (both Pearson and Spearman), 0.84 for Manifesto (both Pearson and Spearman), and 0.93 (Pearson) and 0.94 (Spearman) for VAAs.
Pearson and Spearman correlations between the party position estimates acquired using five methods in the progressive-conservative dimension.
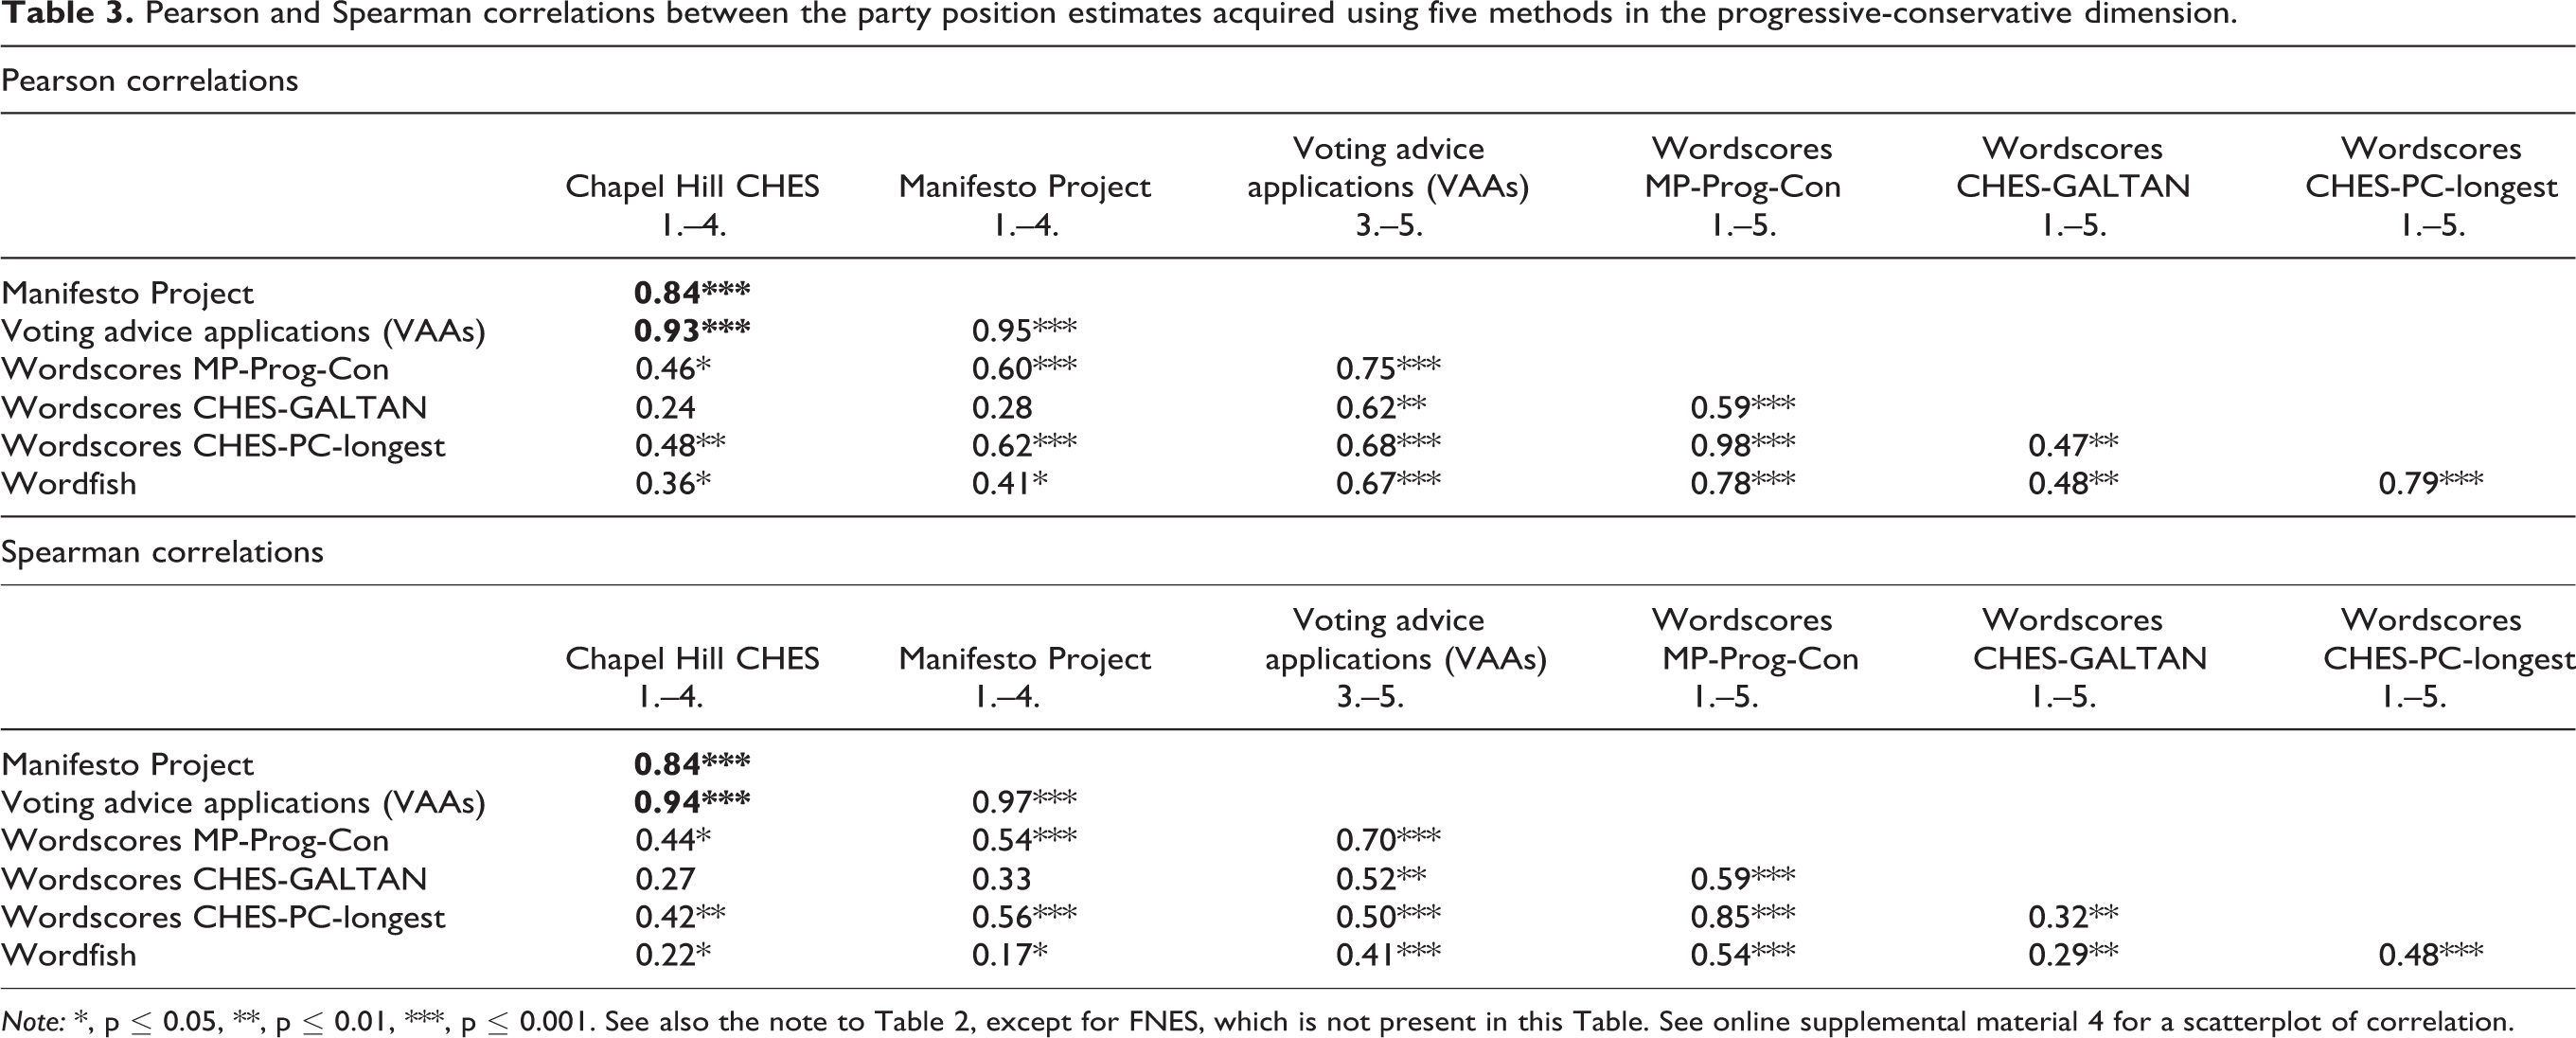
Note: *, p ≤ 0.05, **, p ≤ 0.01, ***, p ≤ 0.001. See also the note to Table 2, except for FNES, which is not present in this Table. See online supplemental material 4 for a scatterplot of correlation.
Resembling the results when examining the left-right dimension, in the progressive-conservative dimension the correlation coefficients between the Wordscores estimates and the non-computational estimates are lower than the benchmark scores. The correlations of the MP-Prog-Con and CHES-PC-longest estimates with CHES, Manifesto and VAAs estimates are statistically significant on the p ≤ 0.05 criterion, whereas the Wordscores CHES-GALTAN estimates—received while using a training text pinned upon CHES—have a statistically significant correlation with the VAAs estimates only. In conclusion, in the progressive-conservative dimension the Wordscores estimates are at instances reasonably high in magnitude and statistically significant, but still fall short of the benchmarks. The lower correlations between the Wordscores CHES-GALTAN estimates with the non-computational estimates and the instances with a lacking statistical significance of these correlations suggest Wordscores underperformance.
The Wordfish estimate is correlated in a statistically significant way with all non-computational estimates. However, the correlation coefficients are lower than the benchmark correlation coefficients and the correlations between the Wordscores estimates and the non-computational estimates. We conclude that the Wordfish results fail to cover adequately the progressive-conservative dimension.
Conclusions and discussion
Conclusions
We have compared the performance of two computational and four non-computational methods in party position estimation, deriving the comparison benchmarks for the computational methods from the positioning results that the non-computational methods give. We deem that the comparative performance of Wordscores deserves to be taken seriously in the estimation task both in the left-right dimension and the progressive-conservative dimension. However, whether to use this method should be considered separately before each application. The Wordscores estimation results generally fall short of our benchmarks. The performance of the other computational method, Wordfish, is substandard in comparison to Wordscores, let alone the four non-computational methods.
In certain respects our results agree with previous results indicating that Wordscores fails (Bruinsma and Gemenis, 2019) to live up to the promises that it would provide no more inferior party position estimates than non-computational methods (Laver et al., 2003). However, our verdict is less severe for such reasons as our correlation coefficients between the Wordscores estimates and the non-computational estimates rise considerably higher than in a previous study (Bräuninger et al., 2013). We conclude that Wordscores suffices to offer at least a quick first look at party positions despite the lower performance of this method than the usually substantially slower-to-use non-computational methods.
Our Wordfish estimates have generally low correlations with the non-computational estimates. We conclude that our Wordfish estimates are hardly related either to the left-right dimension or the progressive-conservative dimension, making us ask whether these estimates are related to some unknown dimension such as one related to the substantive policy issues in hand. When introducing Wordfish, Slapin and Proksch formulated the Wordfish assumptions that the documents examined would be “encyclopedic statements of the parties’ positions” (Slapin and Proksch, 2008: 709), and that each Wordfish dataset should have at least 300 unique words and at least 20 documents (Proksch and Slapin, 2009a: 328). In this respect our dataset was composed of a sufficient number of 49 manifestos with a sufficient median length of 3 989 words, with 9 545 unique words, and only a few manifestos with less than 1 000 words. However, it is unclear if the briefer manifestos suffice for encyclopedic party position statements. Moreover, it has been suggested that Wordfish would need input manifestos of at least 10 000 words to work properly and the vocabulary examined should be ideologically polarized (Hjorth et al., 2015), meaning criteria that many of the Finnish manifestos fail to satisfy.
Our findings generally correspond with the results achieved by Ruedin and Morales (2019). The non-computational methods give party position estimates that all have relatively high correlations with each other, whereas both Wordscores or Wordfish estimates fall short of the benchmark set by the non-computational methods. However, our Wordscores correlations are somewhat higher than those in Ruedin and Morales (2019), which suggests that Wordscores possibly performs better when examining positions on more general dimensions, such as the left-right or the progressive-conservative dimension, than when examining more limited policy dimensions or issue dimensions.
Discussion
In future research, influences upon Wordscores results from three sources deserve more attention, namely the study period, the training texts, and the national conventions of preparing party manifestos. The field is open for further research with different study periods, different anchor texts, and manifestos of different lengths. We also need comparative studies of countries with different conventions of electoral manifesto preparation, and comparisons of the performance of party position estimation methods using party manifesto data written in different languages, including languages that are linguistically unrelated and languages that are members of other groups of languages than the leading Western world languages.
Our results pinpoint Wordfish as a method developed to examine the ideological positions of political parties, but it is still searching for the proper dimensions of examination to prove its talents. It has been suggested that computational methods with elements of machine learning should, like other methods, be assessed from the viewpoint of performing useful tasks (Grimmer and Stewart, 2013). While our results advise leaving Wordfish in abeyance when examining electoral manifestos at least in Finland, Wordscores has more to recommend itself. The laborious Manifesto Project procedures only enable the acquisition of party position estimates years after the elections examined, and the CHES results do not appear soon, either. These observations lead the attention to Wordscores and to methods using voting advice application results to gain a quick first grasp on party positions as soon as party manifestos and VAA results become available to the researcher.
Supplemental material
Supplemental Material, sj-pdf-1-ppq-10.1177_1354068820974609 - Comparing computational and non-computational methods in party position estimation: Finland, 2003–2019
Supplemental Material, sj-pdf-1-ppq-10.1177_1354068820974609 for Comparing computational and non-computational methods in party position estimation: Finland, 2003–2019 by Juha Koljonen, Veikko Isotalo, Pertti Ahonen and Mikko Mattila in Party Politics
Footnotes
Declaration of conflicting interests
The author(s) declared no potential conflicts of interest with respect to the research, authorship, and/or publication of this article.
Funding
The author(s) received no financial support for the research, authorship, and/or publication of this article.
Supplemental material
Supplemental material for this article is available online.
Author biographies
References
Supplementary Material
Please find the following supplemental material available below.
For Open Access articles published under a Creative Commons License, all supplemental material carries the same license as the article it is associated with.
For non-Open Access articles published, all supplemental material carries a non-exclusive license, and permission requests for re-use of supplemental material or any part of supplemental material shall be sent directly to the copyright owner as specified in the copyright notice associated with the article.