
Abstract
Popular consent is an essential element for success and stability of democracies. Research has repeatedly demonstrated that “electoral winners” (i.e. voters casting a ballot for government parties) are more satisfied with democracy than supporters of the opposition parties. However, little is known about the dynamics of satisfaction during the electoral cycle: Do winners become happier and losers even more discontent over time? We approach this question by utilizing an interview date in the European Social Survey (rounds 1–8) to position individuals within the different stages of electoral cycle. The results based on 199,207 responses from 199 surveys in 31 countries suggest that satisfaction with democracy stays relatively stable during the electoral cycle across various electoral systems if the political development is predictable. However, if actions of the parties are uncertain, namely the alternations of governments tend to be frequent, partial, and opened to all parties, and hence neither winners nor losers know how steady their status is with respect to the political development in the country, their satisfaction tend to fluctuate over time. Therefore, the conclusion reached is the more stable West European democracies have limited generalizability to the low-predictable systems in Central and Eastern Europe.
Keywords
Introduction
Voter satisfaction with democracy, an essential element in the sustainability of democratic regimes (Bernhard et al., 2001; Easton, 1965; Mainwaring, 2006), has attracted enduring scholarly attention. A branch of this research examining individual-level correlates has reached the broad consensus that electoral winners (i.e. supporters of a party included in the post-electoral government) are more satisfied with the way democracy works in their country than voters for the opposition parties (Anderson et al., 2005; Bernauer and Vatter, 2012; Blais and Gélineau, 2007; Singh, 2014; Singh et al., 2011). The reason for the winners’ contentment lies in anticipation since voters expect their party to deliver in line with its election pledges once in government (Singh et al., 2012; Thomson et al., 2017).
While this initial pattern of satisfaction has been generally remarked, we know surprisingly little about the change in satisfaction during the electoral cycle (Anderson et al., 2005; Dahlberg and Linde, 2017). Do winners become ever more satisfied as time goes by whereas dissatisfaction swells among losers? This gap in knowledge stems mainly from the survey methodology. Most research in the field relies on national election studies or the Comparative Study of Electoral Systems (CSES) resources (e.g. Aarts and Thomassen, 2008; Bernauer and Vatter, 2012; Chang et al., 2014; Curini et al., 2012; Farrell and McAllister, 2006; Howell and Justwan, 2013; Listhaug et al., 2009; McAllister, 2005), which usually collect data in close proximity to a particular electoral event. Hence, the levels of satisfaction primarily reflect the outcome of the election instead of the actual output of government policies.
To examine the dynamics of satisfaction with democracy throughout the electoral cycle, this study utilizes the European Social Survey (ESS) data (rounds 1–8) in an innovative way. Based on an interview date, we positioned 199,207 individuals (nested in 199 surveys conducted in 31 countries) within the electoral cycle. 1 Mixed models used in analyses also allow us to investigate the extent to which the initial pattern is modified by the institutional and political context (cf. Aarts and Thomassen, 2008; Farrer and Zingher, 2018). For instance, does the difference in satisfaction between voters for government parties and those for opposition parties intensify in majoritarian systems in which the leading party has more room for maneuver and shrink in consensual systems where no single party can dictate the policies implemented by the government coalition (cf. Anderson and Guillory, 1997: 66)? And does the low level of predictability between election result and government composition imply that winners’ high and losers’ low will be lagged, manifesting themselves only after the outcome of government negations has been released? To put it differently, in what conditions does the gap in satisfaction between the winners and losers change as time goes by?
Our findings suggest that the satisfaction levels among winners and losers as well as the gap between these two groups remain relatively stable during the electoral cycle across various kinds of electoral systems. The same applies to those countries in which voters can estimate the actions of parties with respect to the government formation and political future. Voters in these systems do not witness unexpected shifts in politics and therefore are likely to expect that their status as a winner or a loser will probably remain the same until the next election. However, in the systems with frequent changes of government and numerous rapidly emerging parties which can immediately influence the politics and governance, voters cannot be sure about the stability of their winner/loser status. Hence, their satisfaction with democracy tends to fluctuate over time in response to the current political situation and temporary prospects of changing their status from a loser to a winner or the reverse.
This finding constitutes a relevant addition to the literature. So far, satisfaction with democracy has been perceived as stable during the duration of electoral cycles (Anderson et al., 2005; Dahlberg and Linde, 2017; van der Meer and Steenvoorden, 2018). However, we argue that this conclusion, reached in more stable West European democracies, does not apply to the systems with low future political predictability. These are found in many southern, central, and east European countries (Budge et al., 2012; Emanuele et al., 2018; Tavits, 2008).
Satisfaction with democracy: A literature review
Since every democratic system thrives on popular consent and withers in its absence (Easton, 1965; Lipset, 1959), it is hardly surprising that positive evaluations of democratic performance are acknowledged to be essential for the success and stability of democratic regimes (Claassen, 2020). Previous studies have consistently shown that voter satisfaction with democracy is conditioned by most proximate election results. Voters who cast a ballot for a party included in the post-electoral government are more satisfied because they expect the government to implement policies that match with their own interests (Anderson et al., 2005; Bernauer and Vatter, 2012; Blais and Gélineau, 2007; Singh et al., 2011). Losers, by contrast, are less satisfied, given that the country will be governed by a party or coalition that does not represent their preferences or does so only to a limited extent (Singh et al., 2012).
However, winning and losing mean different things in different institutional contexts, implying that satisfaction may vary accordingly. More consensual systems tend to encompass a smaller gap in satisfaction between winners and losers as institutions in these systems offer more opportunities to influence the political decision-making process for the “losing” minorities (Bernauer and Vatter, 2012). Similarly, the fact that minorities can influence the political situation prevent the “winning” majority from complete fulfillment of its demands suppresses the actual level of satisfaction with democracy to below its full potential. Majoritarian systems, in turn, are ruled by winning majorities whose supporters’ degree of satisfaction is efficiently stimulated by the execution of government programs without paying that much attention to a minority’s preferences. At the same time, it is precisely the modest attention paid to the demands of the minority that exacerbates the gap in satisfaction between voters for the winning and losing parties (Anderson and Guillory, 1997).
The studies inspired by Anderson and Guillory’s seminal piece (1997) reached both similar (e.g. Klingemann, 1999) and mixed conclusions (e.g. Aarts and Thomassen, 2008; Berggren et al., 2004; McAllister, 2005). Some of the studies that failed to present evidence of the modifying effect of the electoral system on the satisfaction gap between winners and losers suggested other factors, such as economic inequality (Han and Chang, 2016), the voters’ degree of control over the resulting political representation (Farrell and McAllister, 2006; Pellegata and Memoli, 2018), ideological proximity (Curini et al., 2012; Ezrow and Xezonakis, 2011), the intertemporal dimension of winning (Chang et al., 2014), strategic voting (Singh, 2014), the availability of direct political participation for losers (Bernauer and Vatter, 2012), and electoral margins (Howell and Justwan, 2013).
The political context might also make a difference. Farrer and Zingher (2018: 518) argue that since “the winner-loser gap and ‘losers’ consent’ are concepts that vary systematically around the world,” the theoretical expectations related to satisfaction with democracy are based on “a small cluster of established democracies in Western Europe,” not to be generalized across their borders. An established party system—a factor characteristic of West European democracies—is the main factor that can decrease uncertainty about the political situation. Typically, it includes parties with well-known labels and extensive historical records that enable voters to build expectations on their future actions (Budge et al., 2012; Tavits, 2008). However, that does not apply to many other regions, including Central and Eastern Europe, in which election results come with a great deal of uncertainty (see, e.g. Stokes, 2001). An unstable political landscape without a properly consolidated party system can frequently produce unexpected coalition formations and government agreements (Emanuele et al., 2018; Kitschelt et al., 1999). A winner’s peak in satisfaction observed right after the elections in western Europe might be delayed in other regions simply because it takes a while for the post-electoral bargaining to reveal who the winner is. Since it is precisely the vote choice that distinguishes the electoral winners from losers, the stability of the party system and resulting political predictability represent two major elements within a political context which should influence the overall degree of satisfaction with democracy and its (in)stability over time (Figure 1).
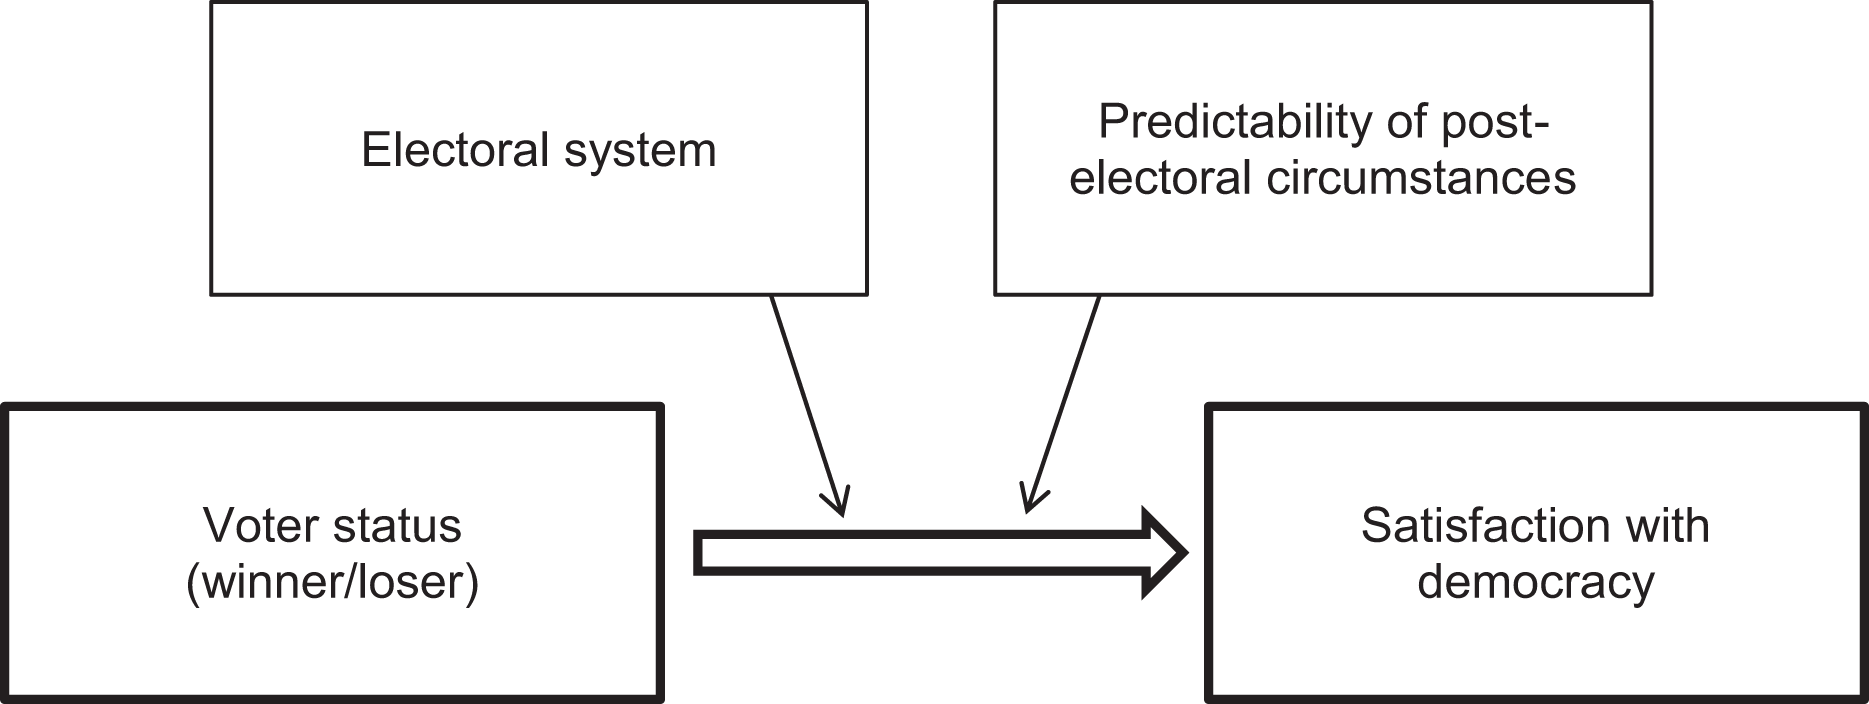
The modifying effects of the electoral system and political context on the relationship between electoral outcome and satisfaction with democracy.
Dynamics of satisfaction with democracy
Mounting evidence suggests that satisfaction with democracy is strongly determined by one’s vote choice (i.e. supporting a winning vs. losing party). However, various components of such choice, including party preference (Fournier et al., 2004; Wlezien et al., 2013), willingness to go the polls (Schakel and Dandoy, 2014), and political knowledge (Andersen et al., 2005; Arceneaux, 2005), might all change throughout the electoral cycle. If a voter’s political preferences can change over time, there is no reason to expect that satisfaction with democracy remains stable and changes only as a result of being a winner or loser on the basis of election results. On the contrary, it seems more plausible to assume that the level of satisfaction is influenced by a government’s ability to deliver in line with electoral pledges (Singh et al., 2012; Thomson et al., 2017) which will only become evident as time goes by.
Nonetheless, there are a few studies that bring the time element into the examination of satisfaction with democracy. Anderson et al. (2005: 68) examined the long-term durability of the influence of elections on satisfaction levels, concluding that election results have “immediate but also lasting effects. […], the new losers—that is, those who were used to being the winners—become less content with the political system” while the opposite holds for the “new winners.” Anderson et al.’s conclusion was observed at the aggregate level, which led Dahlberg and Linde (2017) to reexamine it in terms of the longitudinal individual-level dataset from the 2010 to 2014 electoral cycle in Sweden. In fact, Dahlberg and Linde (2017: 638) arrived at a similar conclusion, remarking that “[i]n Sweden, the experience of losing does not seem to be a temporary disappointment with the election outcome but a relatively long-lasting aspect of how voters regard the functioning of the democratic system,” which “demonstrate[s] that the winner-loser gap is very stable over time.”
However, studies focusing on a shorter time period surrounding elections indicate that the dynamics of satisfaction with democracy may be dependent on the post-electoral circumstances. Van der Meer and Steenvoorden analyzed the political support among Dutch citizens before the 2012 parliamentary elections, discovering that the gap between the winners and losers is considerably smaller before the elections while expanding shortly after in response to the election result (van der Meer and Steenvoorden, 2018: 48). In another study, Han and Chang (2016: 95) used the variation in interview dates included in the CSES data set, finding that as elections move further into the past, the degree of satisfaction with democracy decreases.
The final question is whether satisfaction with democracy changes in the long run, that is, over a period of several elections. Curini et al. (2012) discovered that repeatedly belonging to a winning side increases satisfaction only under specific conditions, such as when there is a proximity between a voter’s and a new government’s policy positions. If that is not the case, the satisfaction level remains stable. Among losers, one setback does not really matter as the level of satisfaction stays roughly the same as the pre-electoral levels (van der Meer and Steenvoorden, 2018). However, a second consecutive electoral loss begins to decrease a voter’s satisfaction with democracy (Anderson et al., 2005: 68). It is worth noting, though, that when revisited by Chang et al. (2014), the effect of a second consecutive electoral loss seemed to apply only to young democracies and even one experience of being a winner in the past can divert such a trend.
Hypotheses
Following the literature that deals with effects of electoral systems on satisfaction with democracy, we can expect that the gap in satisfaction between winners and losers may be wider in majoritarian systems (Anderson and Guillory, 1997; Anderson et al., 2005; Han and Chang, 2016; Klingemann, 1999). Observations from dynamic studies suggest that the satisfaction among losers is stable over time unless they experience consecutive losses, which is seldom the case (Chang et al., 2014; Curini et al., 2012). By combining these two findings, we can expect that (a) winners in majoritarian systems (compared to winners in proportional systems) may experience a more pronounced boost in their satisfaction because they also have higher expectations of the new government and know that it has more room for maneuver, whereas (b) losers should have more modest expectations and therefore their satisfaction remains stable over time (Chang et al., 2014; Curini et al., 2012). However, even a strong majority government has a limited capacity to implement all the policies promised during an electoral campaign. Therefore, as time goes by, winners in majoritarian systems realize that their great expectations will not be met and their satisfaction begins to decrease more than it does among winners in proportional systems whose expectations were lower to begin with (see Figure 2). Based on this reasoning, we expect the following:
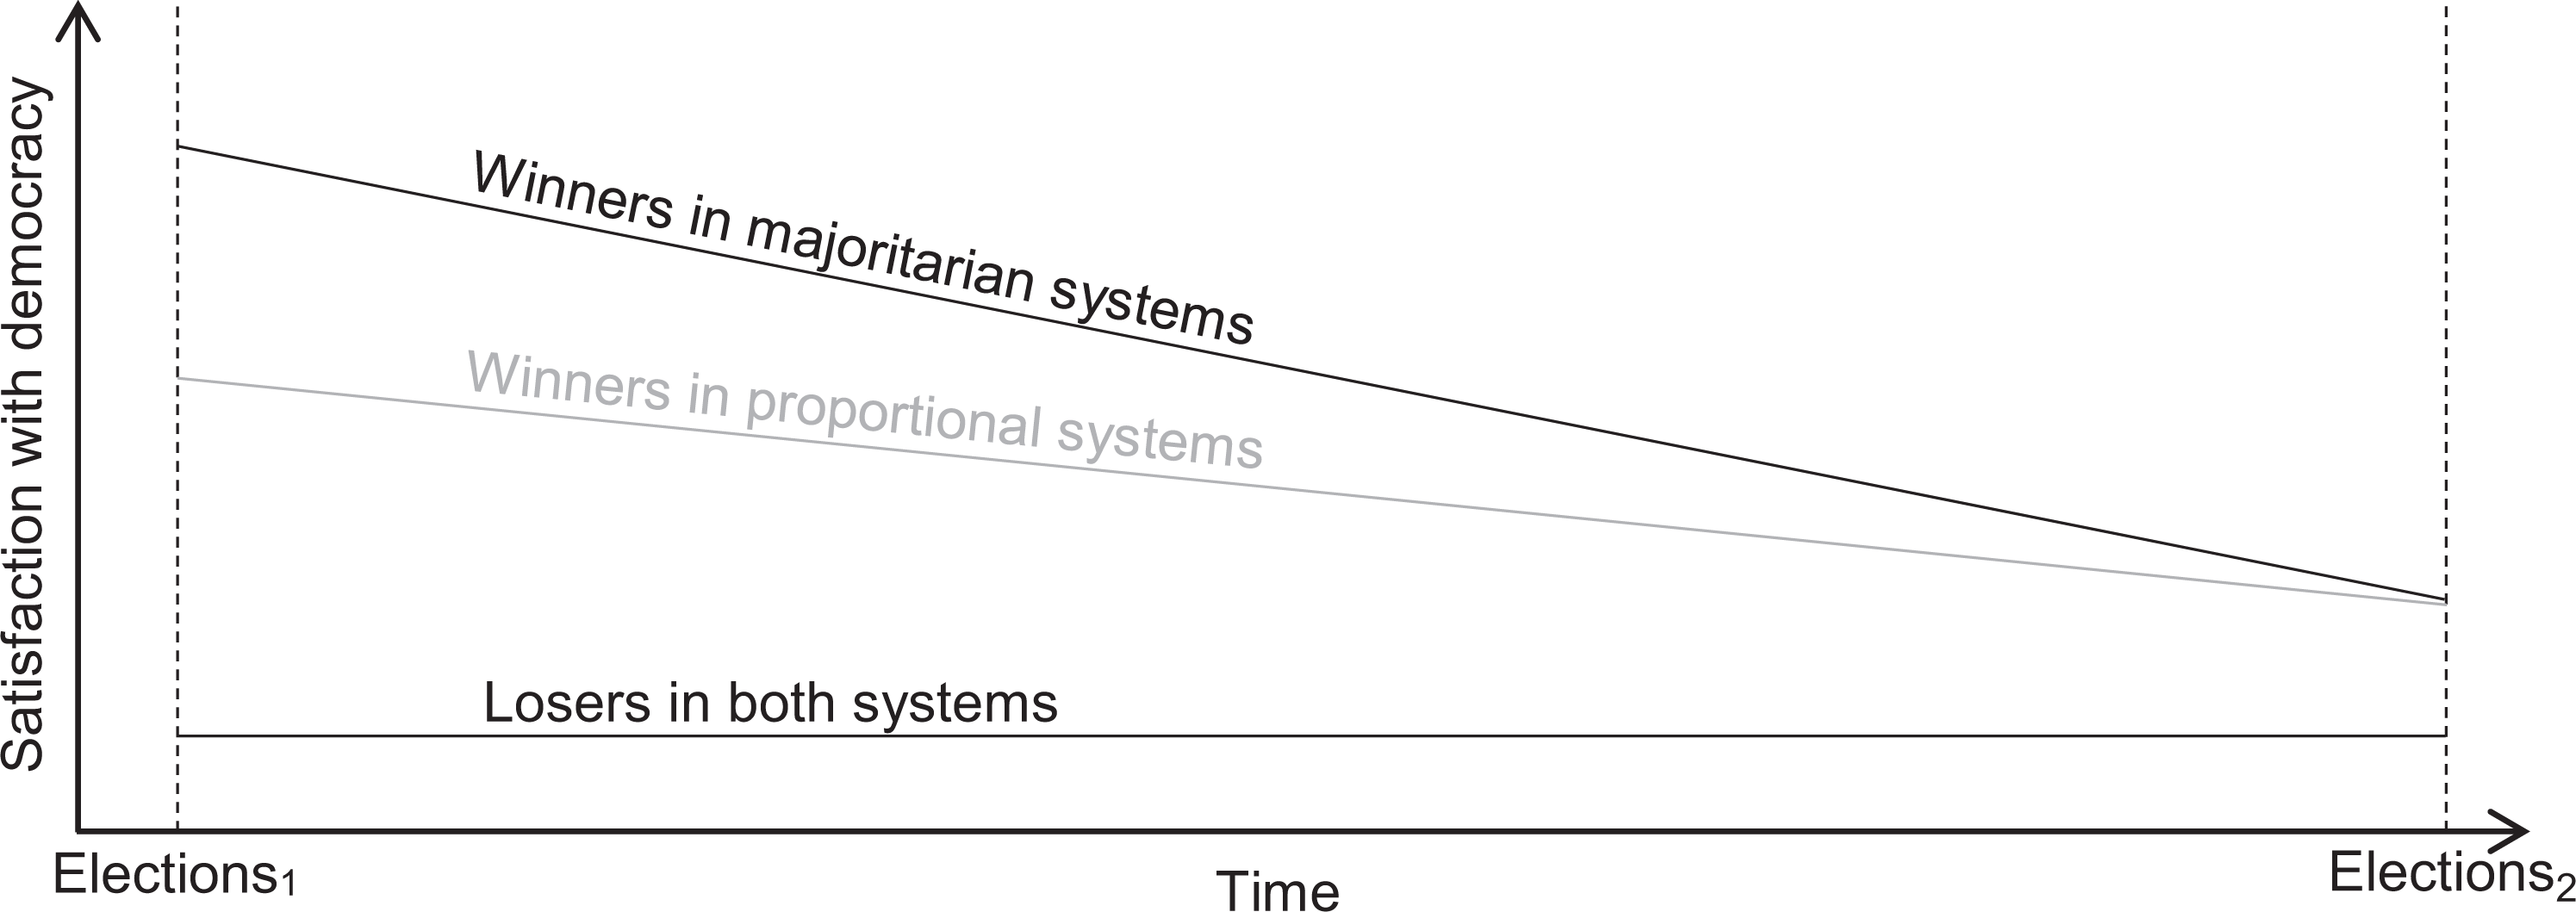
Trend in satisfaction during the electoral cycle in different electoral systems.
As regards the effect of the predictability of post-electoral change, we can distinguish two different patterns. First, in the systems with established patterns of political competition and few unexpected shifts in the government formation and political situation, voters are able to utilize their knowledge of the political context and estimate whether they will belong among the winners or losers immediately after the election result has been declared. Therefore, the winners’ levels of satisfaction are highest shortly after elections (van der Meer and Steenvoorden, 2018) and then slowly decrease with the realization that government capacity is not sufficient to implement all pledges and priorities mentioned during election campaign (Anderson et al., 2005: 68–69; Han and Chang, 2016: 95). Among losers, the low likelihood of unexpected changes in government formation and political change makes it likely that loser satisfaction remains stable until the next opportunity for voters to potentially change their status, that is, the next election (see Figure 3, upper part) (Budge et al., 2012; Chang et al., 2014; Dahlberg and Linde, 2017; van der Meer and Steenvoorden, 2018).
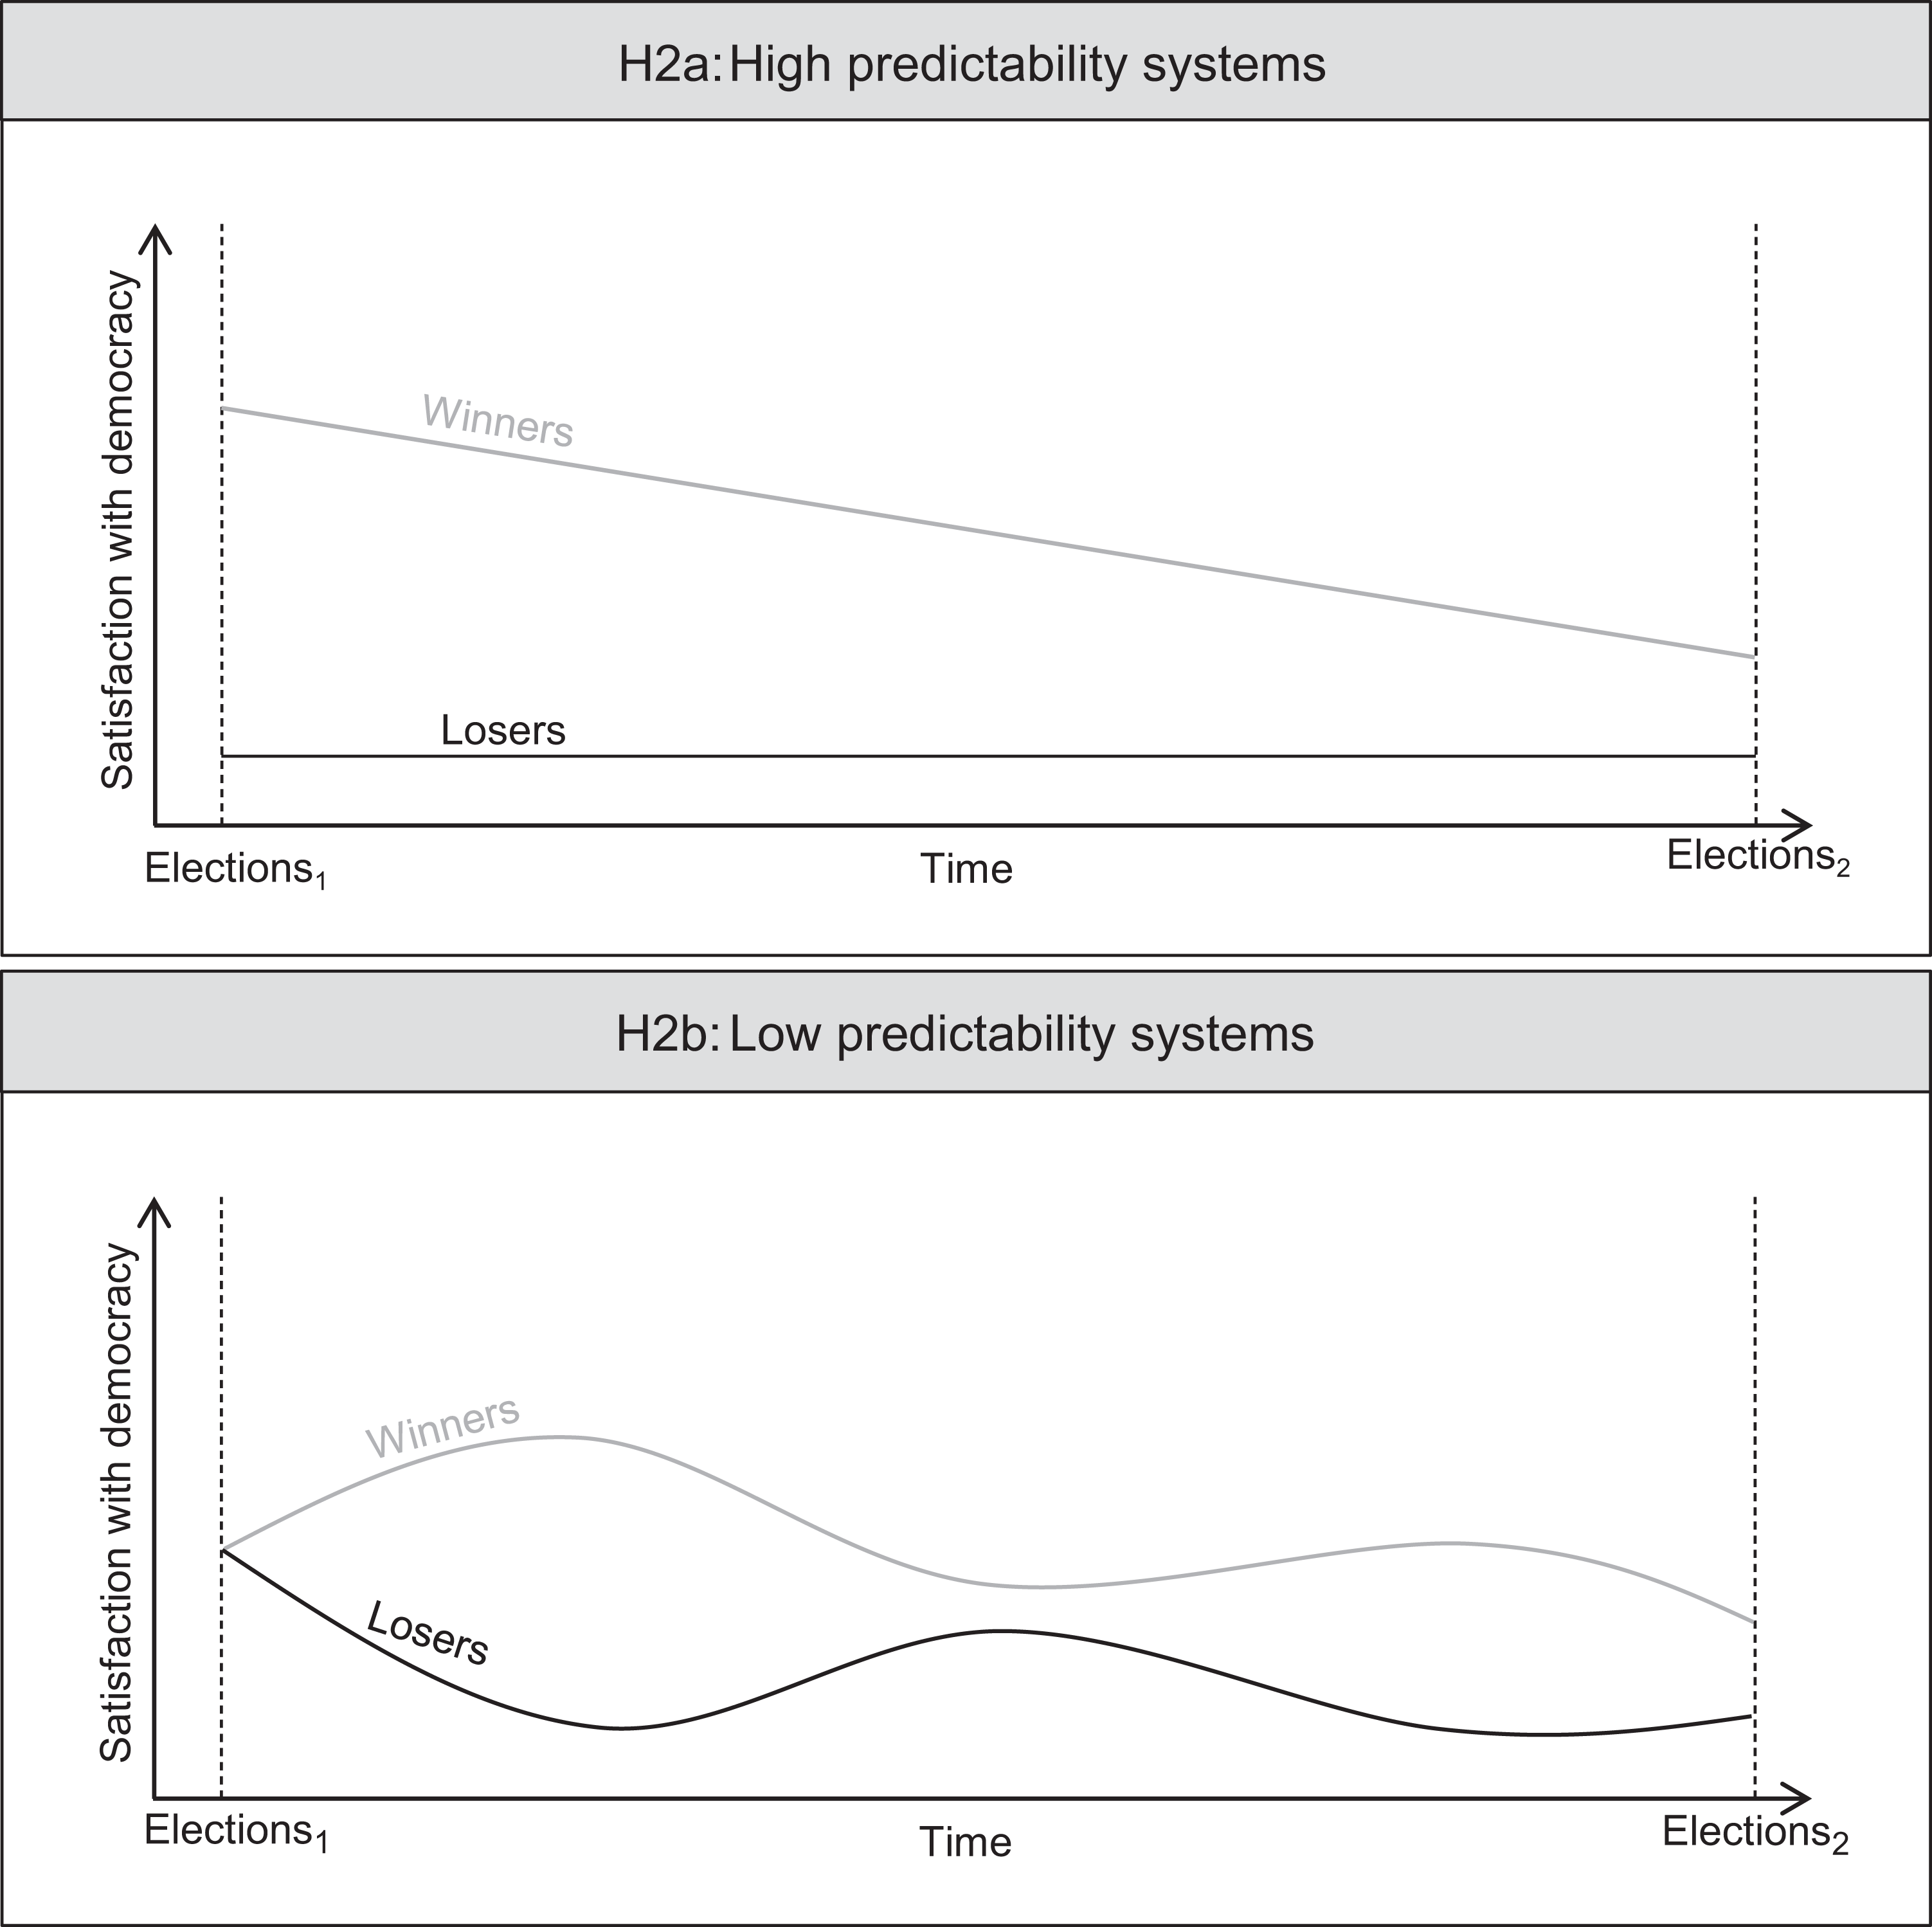
Change in satisfaction during the electoral cycle in different political contexts.
The second pattern could be expected in systems with a low level of predictability. This kind of political environment can bring unexpected governing coalition agreements (Emanuele et al., 2018; Kitschelt et al., 1999; Tavits, 2008) and, since voters cannot be sure whether they belong to a winning or a losing side, there is essentially no gap between winners and losers immediately after elections. As time goes by and government negotiations start to reveal who will become the winner, the winner–loser gap expands with a delay (Aarts and Thomassen, 2008; Farrer and Zingher, 2018). However, voter satisfaction levels can still vary over time. Given the unstable political environment, a little tension among governing parties may already result in change in government and reshuffling the status of winners and losers among voters (Budge et al., 2012; Chang et al., 2014; Curini et al., 2012). Therefore, voter satisfaction is likely to fluctuate over time in response to the current political situation and immediate prospects of changing their status from loser to winner or the other way (see Figure 3, lower part). Following this reasoning, we formulate two hypotheses depending on the level of predictability in a system:
Data and methods
The ESS is a cross-sectional study exploring the attitudes of citizens across countries at roughly the same time every 2 years, regardless of the timing of the elections. Varying proximity between the ESS data collection and previous/forthcoming elections means that ESS captures voter attitudes during various parts of the electoral cycles. Our study utilizes this feature in the ESS Cumulative Data from rounds 1–8 (2002–2016) to study the dynamics of people’s satisfaction with democracy during the electoral cycle. The data summary is presented in Table A1 in Supplemental material Part A.
Our main dependent variable is the satisfaction with democracy measured by a survey item: “And on the whole, how satisfied are you with the way democracy works in [country]?” Respondents were offered an 11-point scale with two anchors (0 = extremely dissatisfied and 10 = extremely satisfied). This question taps voter satisfaction with the performance of democratic institutions rather than support for the general principles of democracy (see Linde and Ekman, 2003). While several authors have demonstrated that this question overlaps conceptually with other indicators such as party preference and executive approval (Canache et al., 2001), “in the absence of a better item […], the satisfaction with democracy measure is a reasonable (albeit imperfect) indicator that we can use to test our theories” (Anderson, 2002: 10).
ESS includes administrative information about the date at which the interview took place, which enables us to position individuals within the electoral cycle. For rounds 1 and 2, ESS specifies an interview date. For rounds 3 to 8, ESS includes both starting and ending dates. We positioned individuals based on the starting date of their interview and used all observations for which the difference between starting and ending date was up to 10 days (to ensure that the final dataset included reliably marked dates). When elections took place during the survey period, all interviews conducted up to the day of the national elections (including the Election Day) were assigned to the previous electoral cycle. This follows the fact that the results are announced only at the end of an election day or later.
Electoral cycles are not equal in length and the literature studying electoral cycles (e.g. Andersen et al., 2005; Arceneaux, 2005; Fournier et al., 2004; Schakel and Dandoy, 2014; Wlezien et al., 2013) suggests that the most eventful time is the pre-electoral period. We cannot, therefore, use the raw number of days because such an approach would not allow us to compare the pre-electoral periods across the electoral cycles lasting 4 and 5 years or any other duration in the case of snap elections. We thus follow Shugart and Taagepera (2017: 198–212) and standardize the elapsed time between the previous elections and interviews. The number of days between an election and an interview was divided by the number of days of the whole electoral cycle. Thus, our measure ranges from 0 (i.e. the interview took place one day after the Election Day concluding the previous electoral cycle) to 1 (i.e. the interview was conducted on the Election Day at the end of an electoral cycle).
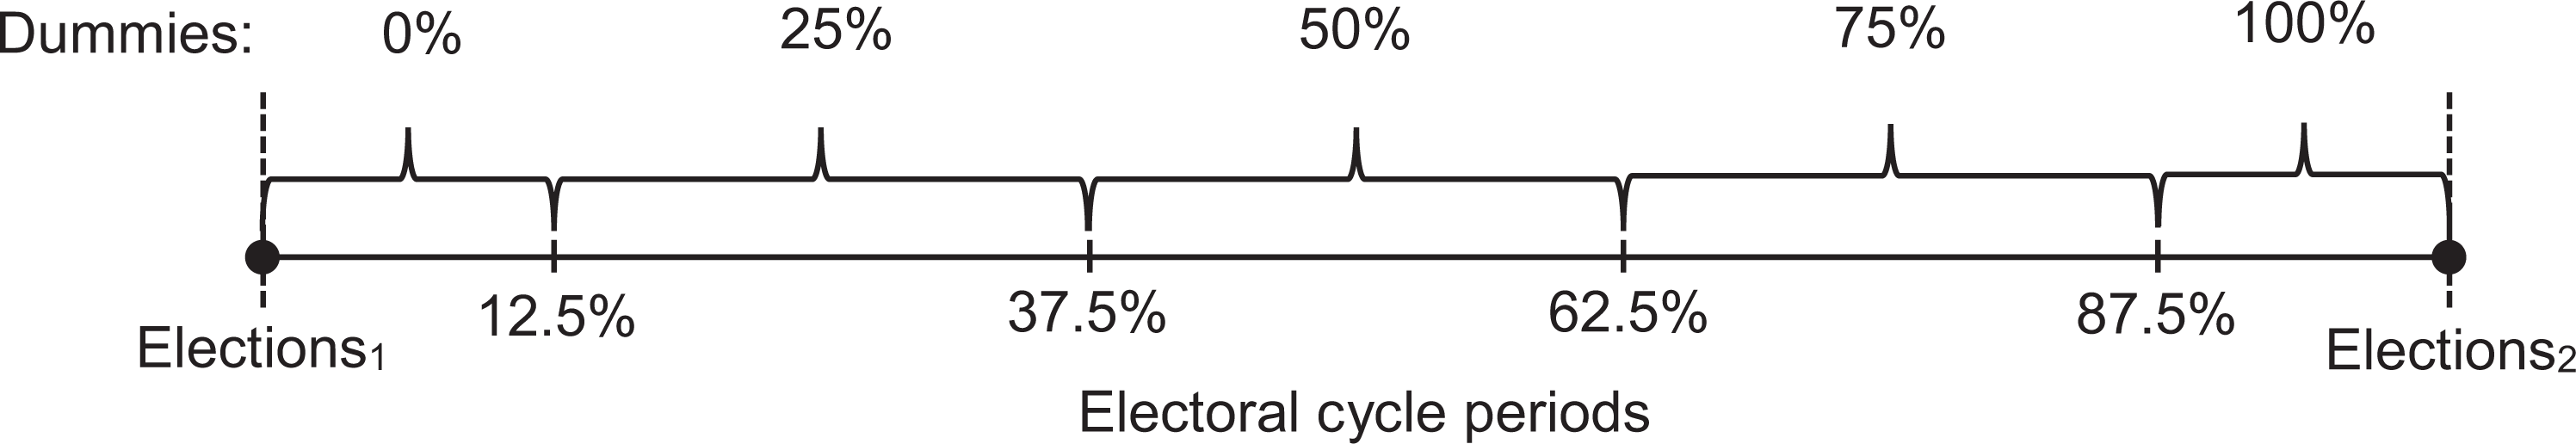
Following the logic described in the theoretical section, we assume a nonlinear change in the satisfaction with democracy. Therefore, we cannot treat time as a continuous variable, because nonparametric regression methods are not yet sufficiently developed to allow the estimation of an extensive multilevel model with a wide set of controls. In the case of a linear multilevel model, inclusion of either polynomials or a nonlinear transformation could allow us to examine other than a linear trend. However, such a strategy would require us to have a clear theoretical expectation about the trend in satisfaction with democracy over time which would justify our methodological choice. Yet there is lack of research that would enable us to make an informed decision about such an expectation and select an appropriate methodological tool. At the same time, we cannot rule out the option that the change in satisfaction with democracy will differ across electoral systems and political contexts. Therefore, we apply a set of dummies evenly spread across the electoral cycle that will capture changes in satisfaction with democracy. The analysis by Andersen et al. (2005) demonstrates that a year-long interval can reasonably reflect the dynamics occurring during the electoral cycle. Given the fact that the most usual length of a parliamentary term across Europe is 4 years, we include a set of five dummies spread across the standardized length of the electoral cycle (see Figure 4). In addition, literature on satisfaction with democracy (Han and Chang, 2016; Singh et al., 2012; van der Meer and Steenvoorden, 2018) indicates that many relevant changes in attitudes take place during the pre- and post-electoral periods. Therefore, dummies 0 and 1 aggregate interviews conducted during the first and last 12.5% of an electoral cycle (i.e. 6 months after and 6 months before elections in most cases).
Electoral cycle dummies.
It could be argued that the dummies should rather be based on the number of days. For that reason, we also ran the models with time dummies based on the number of days as a robustness check. The results support our conclusions (see Tables A4 and A5 and Figures A1 and A2 in supplemental material B) and the decision to treat electoral cycle periods in proportions, because the limited number of observations available for the fifth year make estimates weakly related to the results for the proceeding parts of electoral cycles.
When it comes to the operationalization of winners, the discussions in the literature are all closely tied to results of particular elections (e.g. see Stiers et al., 2018; van der Meer and Steenvoorden, 2018). Since we focus on the entire electoral cycle, these definitions are not suitable because they would determine winners based on results of the past elections. Therefore, we defined winners as those respondents who voted for a party which was part of the government on the date the interview was conducted. 2 Abstainers were excluded from the analysis. Data for governing coalitions were obtained from the Government Composition—Supplement to the Comparative Political Data Set (Armingeon et al., 2017).
Individual-level controls
The selection of individual-level controls reflects the fact that this study examines the effect of winning on satisfaction with democracy as a function of time. Therefore, we follow two main studies that include individual-level correlates in a similar way. First, Dahlberg and Linde (2017) studied the dynamics of the winner–loser gap in satisfaction with democracy during the almost the full 2010–2014 electoral cycle in Sweden, finding that gender and education constitute a statistically significant factor among their respondents. Second, Banducci and Stevens (2015) examined how timing in the electoral cycle influences survey response, and their results suggest the influence of age and education. The ESS permits us to control all three of these variables: age (in years), gender (0 = male and 1 = female), and education (completed 1 = less than lower secondary education, 2 = lower secondary education, 3 = upper secondary education, 4 = postsecondary non-tertiary education, and 5 = tertiary education). At the same time, these three personal background characteristics are frequently found to be related to political support (e.g. see Zmerli and van der Meer, 2017).
Lastly, we follow the ESS recommendation (European Social Survey, 2014) and include the post-stratification weights to reduce potential sampling error and nonresponse bias.
Second-level factors
The hierarchical nature of the ESS data requires a multilevel specification (Wells and Krieckhaus, 2006). We thus estimated three-level hierarchical mixed models with random intercepts in which individuals are treated as nested in the individual ESS surveys (i.e. the main ESS data unit), while these surveys are nested in countries. If elections took place during the survey period, the survey is divided into two separate parts. This procedure follows the literature suggesting that the election results have an impact on trends in satisfaction with democracy (e.g. Singh, 2014; Singh et al., 2012; van der Meer and Steenvoorden, 2018).
One of the major questions in the research on satisfaction with democracy concerns how far the satisfaction gap between winners and losers is influenced by the characteristics of the electoral system (Aarts and Thomassen, 2008; Anderson and Guillory, 1997; Bernauer and Vatter, 2012). The main distinction between categories of electoral system is the (dis)proportionality of their outcomes when proportions of votes are compared to the distribution of seats (Gallagher and Mitchell, 2008). Therefore, we use the Least Square index proposed by Gallagher (1991) which ranges from 0 (i.e. maximum proportionality between vote shares and seat shares for parties) to 100 (i.e. maximum disproportionality). The values are derived from Gallagher’s database (2019) for the most recent elections before the ESS data collection takes place in a country. Since we will need to facilitate a comparison across the systems, we will visualize the marginal effects of variables for three levels of (dis)proportionality—4.11, 7.35, and 17.01—which are the average values of the Least Square index for (1) proportional, (2) mixed, and (3) majoritarian systems, respectively, included in ESS (for details about groups and country averages see Table A2 in supplemental material A).
Furthermore, a study by Farrer and Zingher (2018) suggests that the link between institutions, elections, and satisfaction with democracy varies across political contexts. The literature suggests that it is the patterns established in a party system that enable voters to predict the political future (Budge et al., 2012; Emanuele et al., 2018; Kitschelt et al., 1999; Tavits, 2008). To measure the level of predictability, we employed the Party System Closure indicator developed by Casal Bértoa and Enyedi (2016: 268), who describe the conceptual boundaries of the index as follows:
Party systems are considered to be open when (1) the alternations of governments tend to be partial, (2) no stable configuration of governing alternatives exists, and (3) access to government is granted to all relevant parties, including newly established ones. It is closed when (1) alternations of governments are wholesale or none, (2) the governing alternatives are stable over a long period of time, and (3) governments are confined to a narrow circle of parties.
The index equals 100 when a party system is fully closed and, as the value decreases, the measure indicates growing changes in the party system. Annual data were provided directly by Fernando Casal Bértoa from the Who Governs Europe database (Casal Bértoa, 2019). To facilitate comparison among systems with varying degrees of predictability, we will visualize marginal effects for low, medium, and high predictability of the political future. These levels are based on the minimum, median, and maximum national average from the data set utilized for this study. The corresponding party system closure values are 70.34, 90.70, and 98.99 for Ukraine, Belgium, and Switzerland, respectively (for all national averages see Table A3 in supplemental material A).
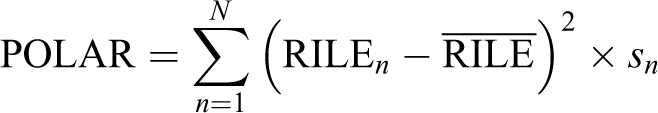
With respect to the second-level controls, party system polarization has been found to be related to electoral disproportionality (Dow, 2011; Matakos et al., 2016) as well as to the effect of winning on satisfaction with democracy (e.g. Curini et al., 2012; Curini and Jou, 2016; Singh and Thornton, 2016). For these reasons, we control for political polarization in all models. It has been computed from the left–right (i.e. RILE) placement of parties included in the Manifesto Project database (Volkens et al., 2019). From these placements, we derive the systemic party polarization as the weighted sum of each party’s squared deviation from the average placement on RILE, using the party’s proportion of the vote as weights. If we consider that there are N parties on the spectrum and their proportion of the vote is sn, then polarization is computed as
In addition, since calling snap elections can be a sign of political instability, we include a dummy coded as 1 if the elections held at the end of an electoral cycle were called before the originally scheduled election date.
In addition, we acknowledge, as Aarts and Thomassen (2008) suggest, that the ability of voters to familiarize themselves with democratic institutions and utilize them to their own advantage gradually improves with experience. We thus control for the length of democratic tradition. This counts the number of years (before the survey) during which the index of institutionalized democracy (i.e. e_democ), based on the Polity IV scale included in the V-Dem data set (Coppedge et al., 2018), was six or higher (originally ranging from 0 = least democratic to 10 = most democratic). This follows the arbitrarily-set threshold by Farrer and Zingher (2018: 6), applied directly to the Polity IV scale. Additionally, we controlled for a country’s overall democratic development for which V-Dem merges the Freedom House and the Polity indices (i.e. e_fh_ipolity2). This measure ranges from 0 = least democratic to 10 = most democratic. If an ESS survey exceeds December and continues into the next year, the value for the first year is used.
Results
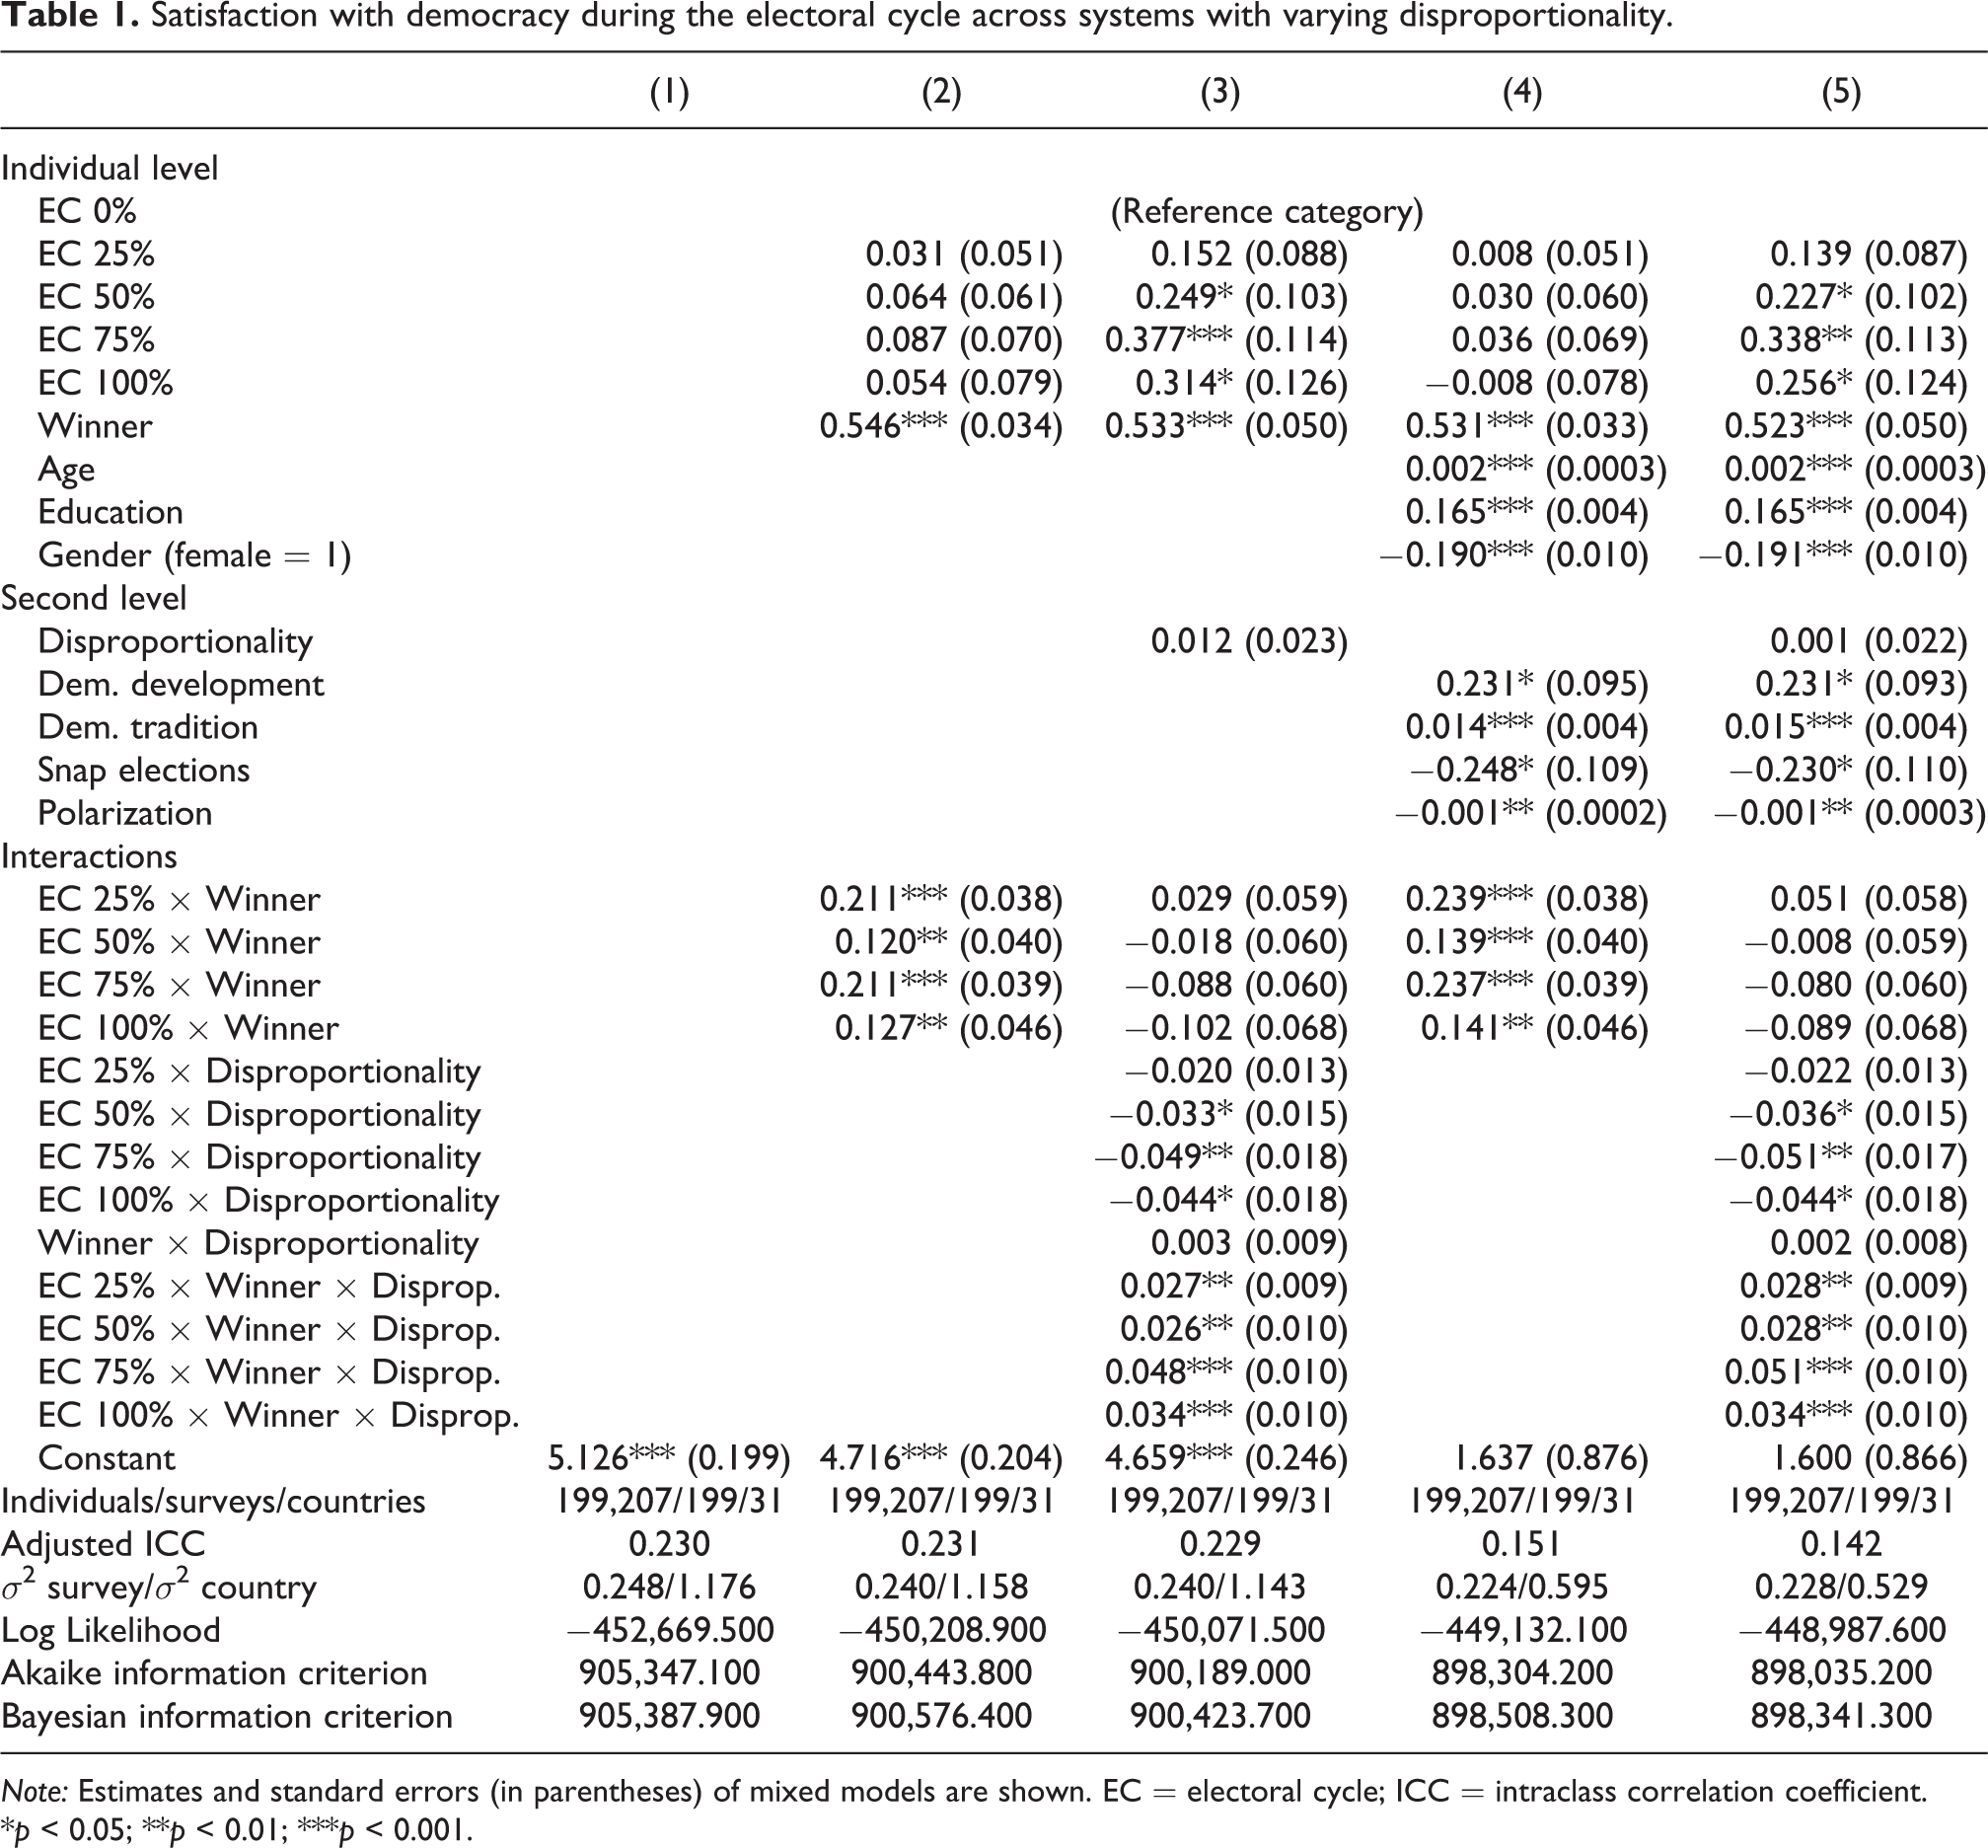
The point of departure for the analysis is a null model estimating the intercept only. Model 2 includes only the dummies for elapsed time of the electoral cycle, the dummy for winners, and interactions between the time dummies and the winner dummy (see Table 1). The coefficient for winners is highly statistically significant (p < 0.001), supporting the notion that winners, on average, tend to be more satisfied with the democratic performance in their country. The statistically significant interaction terms indicate that such a trend applies to most of the duration of the electoral cycle. This suggests that the gap in satisfaction between winners and losers remains throughout the electoral cycle. The same observations also hold for model 3, which adds electoral system disproportionality and three-way interactions between (a) electoral cycle dummies, (b) the status of a winner, and (c) electoral system disproportionality. These results suggest that winners are still significantly more satisfied than losers and the gap tends to expand with increasing electoral system disproportionality (based on statistically significant coefficients for three-way interactions in model 3); however, after controlling for other potential confounders, the individual and survey level in model 5, the effect of disproportionality loses statistical significance. The predicted values of interaction terms from model 5 are visualized in Figure 5.
Satisfaction with democracy during the electoral cycle across systems with varying disproportionality.
Note: Estimates and standard errors (in parentheses) of mixed models are shown. EC = electoral cycle; ICC = intraclass correlation coefficient.
*p < 0.05; **p < 0.01; ***p < 0.001.
Satisfaction with democracy during the electoral cycle across different electoral systems. Visualized are predicted values of satisfaction with democracy among winners and losers during various parts of electoral cycle based on interaction terms included in model 5.
According to hypothesis 1, the decrease in winner satisfaction and hence the gap in satisfaction between winners and losers should be steeper and less stable during the electoral cycle in majoritarian systems than proportional ones. Our findings suggest that the gap between winners and losers tend to remain stable as time passes, regardless of the degree of electoral system disproportionality and electoral cycle period. The same also applies to the separate levels of satisfaction among winners and losers. Hence, our results are inconclusive, and hypothesis 1 is not confirmed.
The second stage of our analysis examines the dynamics of the citizen satisfaction with democracy during the electoral cycle across systems with varying predictability of the political future (see Table 2). The number of observations is slightly lower, which is due to the unavailability of the party system closure data for all ESS rounds.
Satisfaction with democracy during the electoral cycle across systems with varying predictability of the political future.
Note: Estimates and standard errors (in parentheses) of mixed models are shown. EC = electoral cycle; ICC = intraclass correlation coefficient.
*p < 0.05; **p < 0.01; ***p < 0.001.
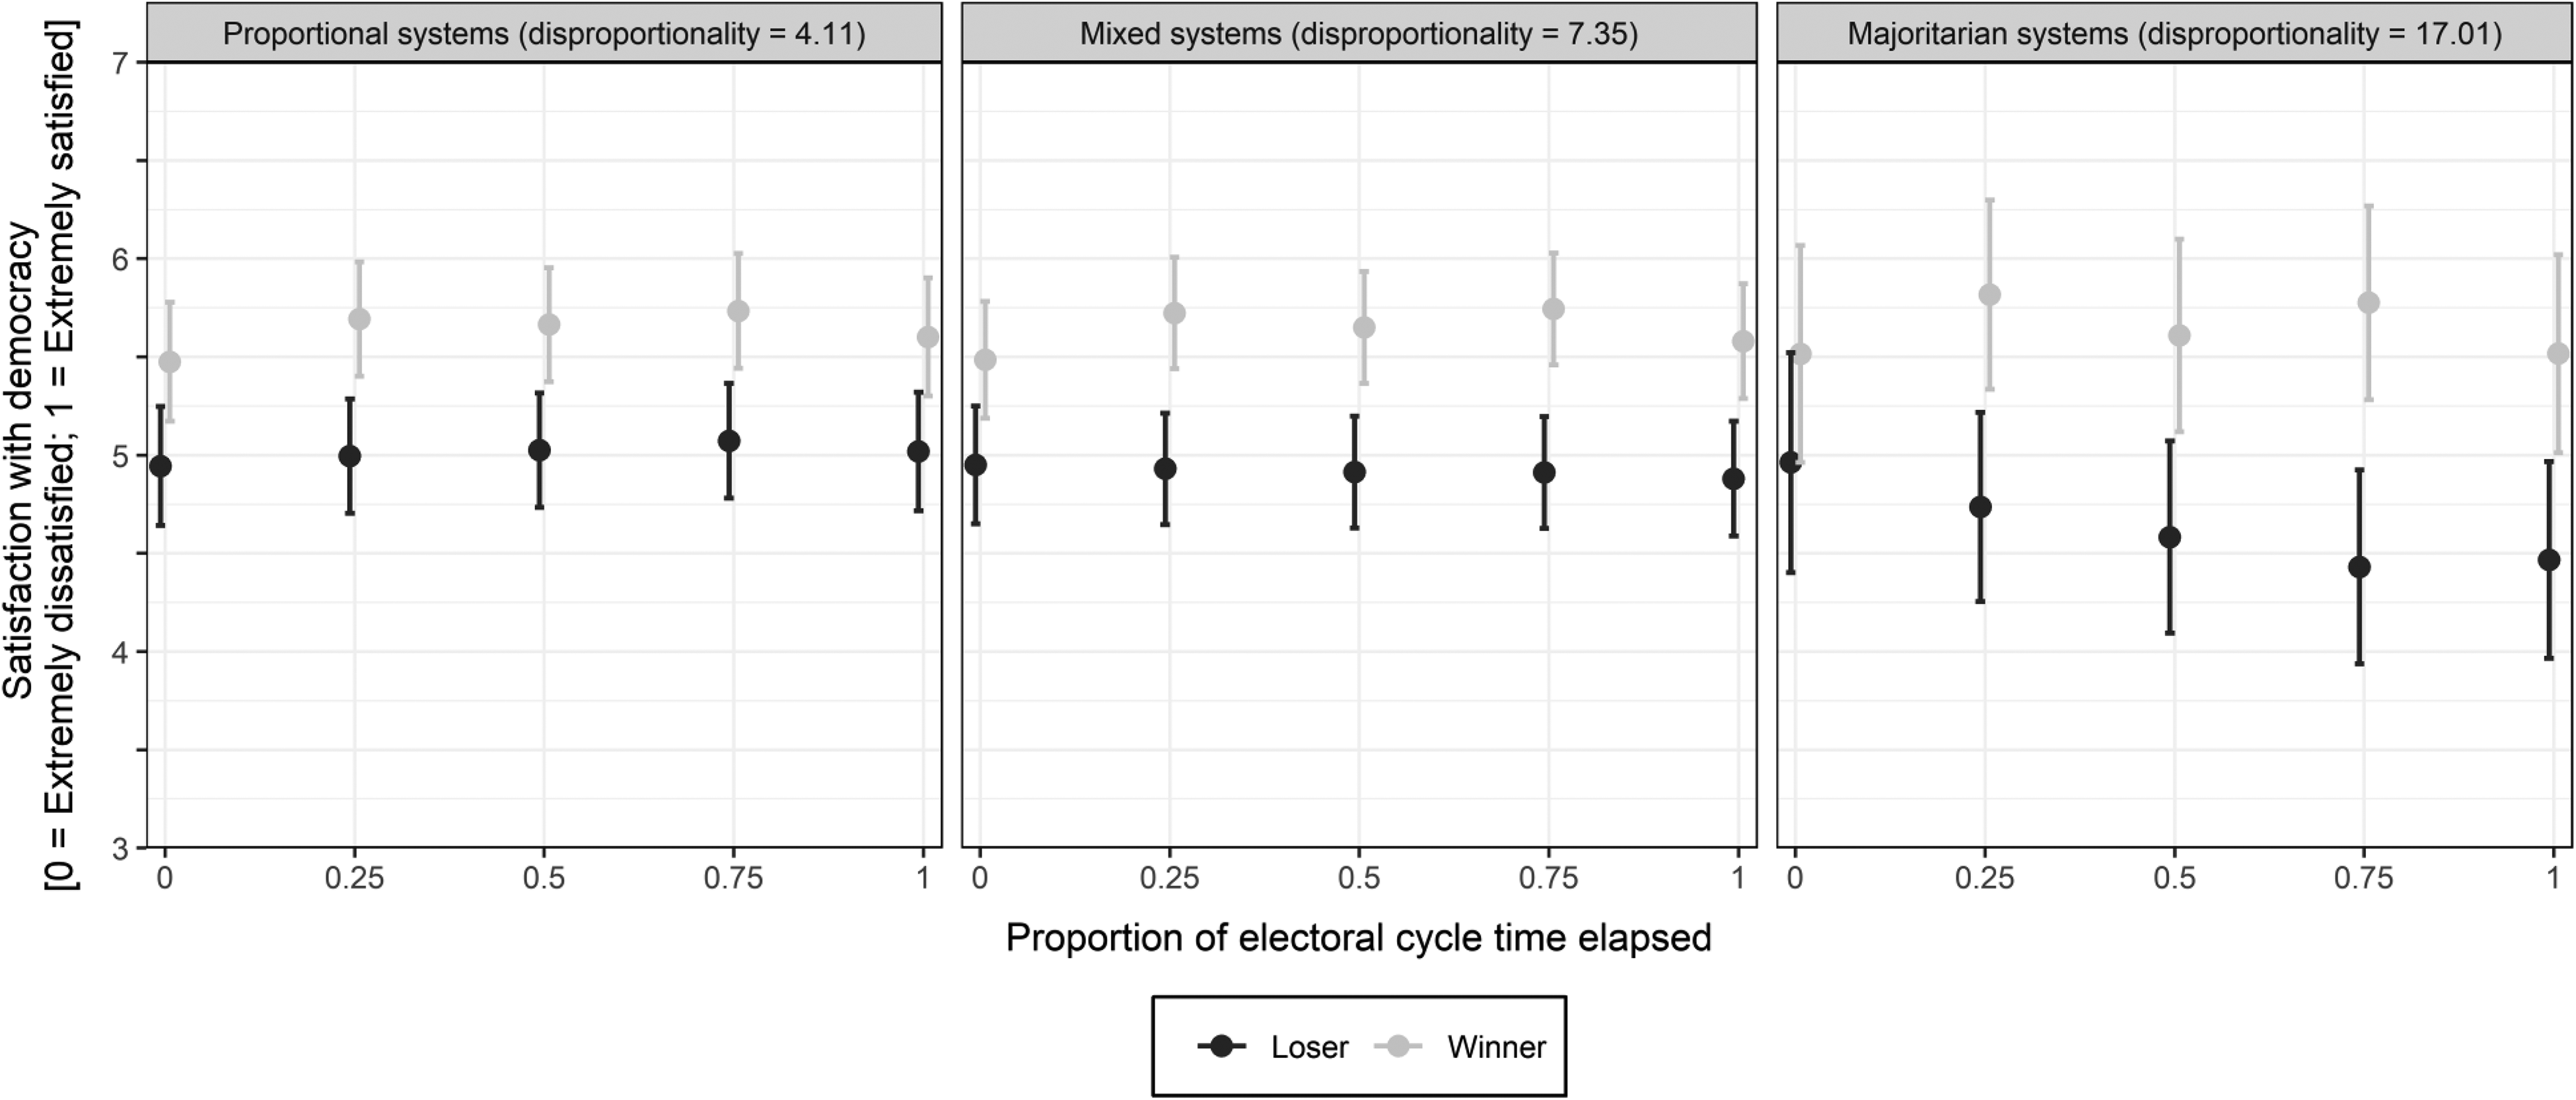
Therefore, the analysis again begins with a null model (model 6). We then estimate model 7, which enters only dummies for elapsed time of the electoral cycle, the dummy for winners, and interactions between the time dummies and the winner dummy. The coefficient for winners is highly statistically significant (p < 0.001) and indicates that winners are, on average, more satisfied with the way democracy works in their country. Moreover, the difference holds for the entire electoral cycle (indicated by statistically significant interaction terms between electoral cycle periods and winner status). These results seem to be robust to the inclusion of potential confounders at the individual level (model 9) and the second level (model 10).
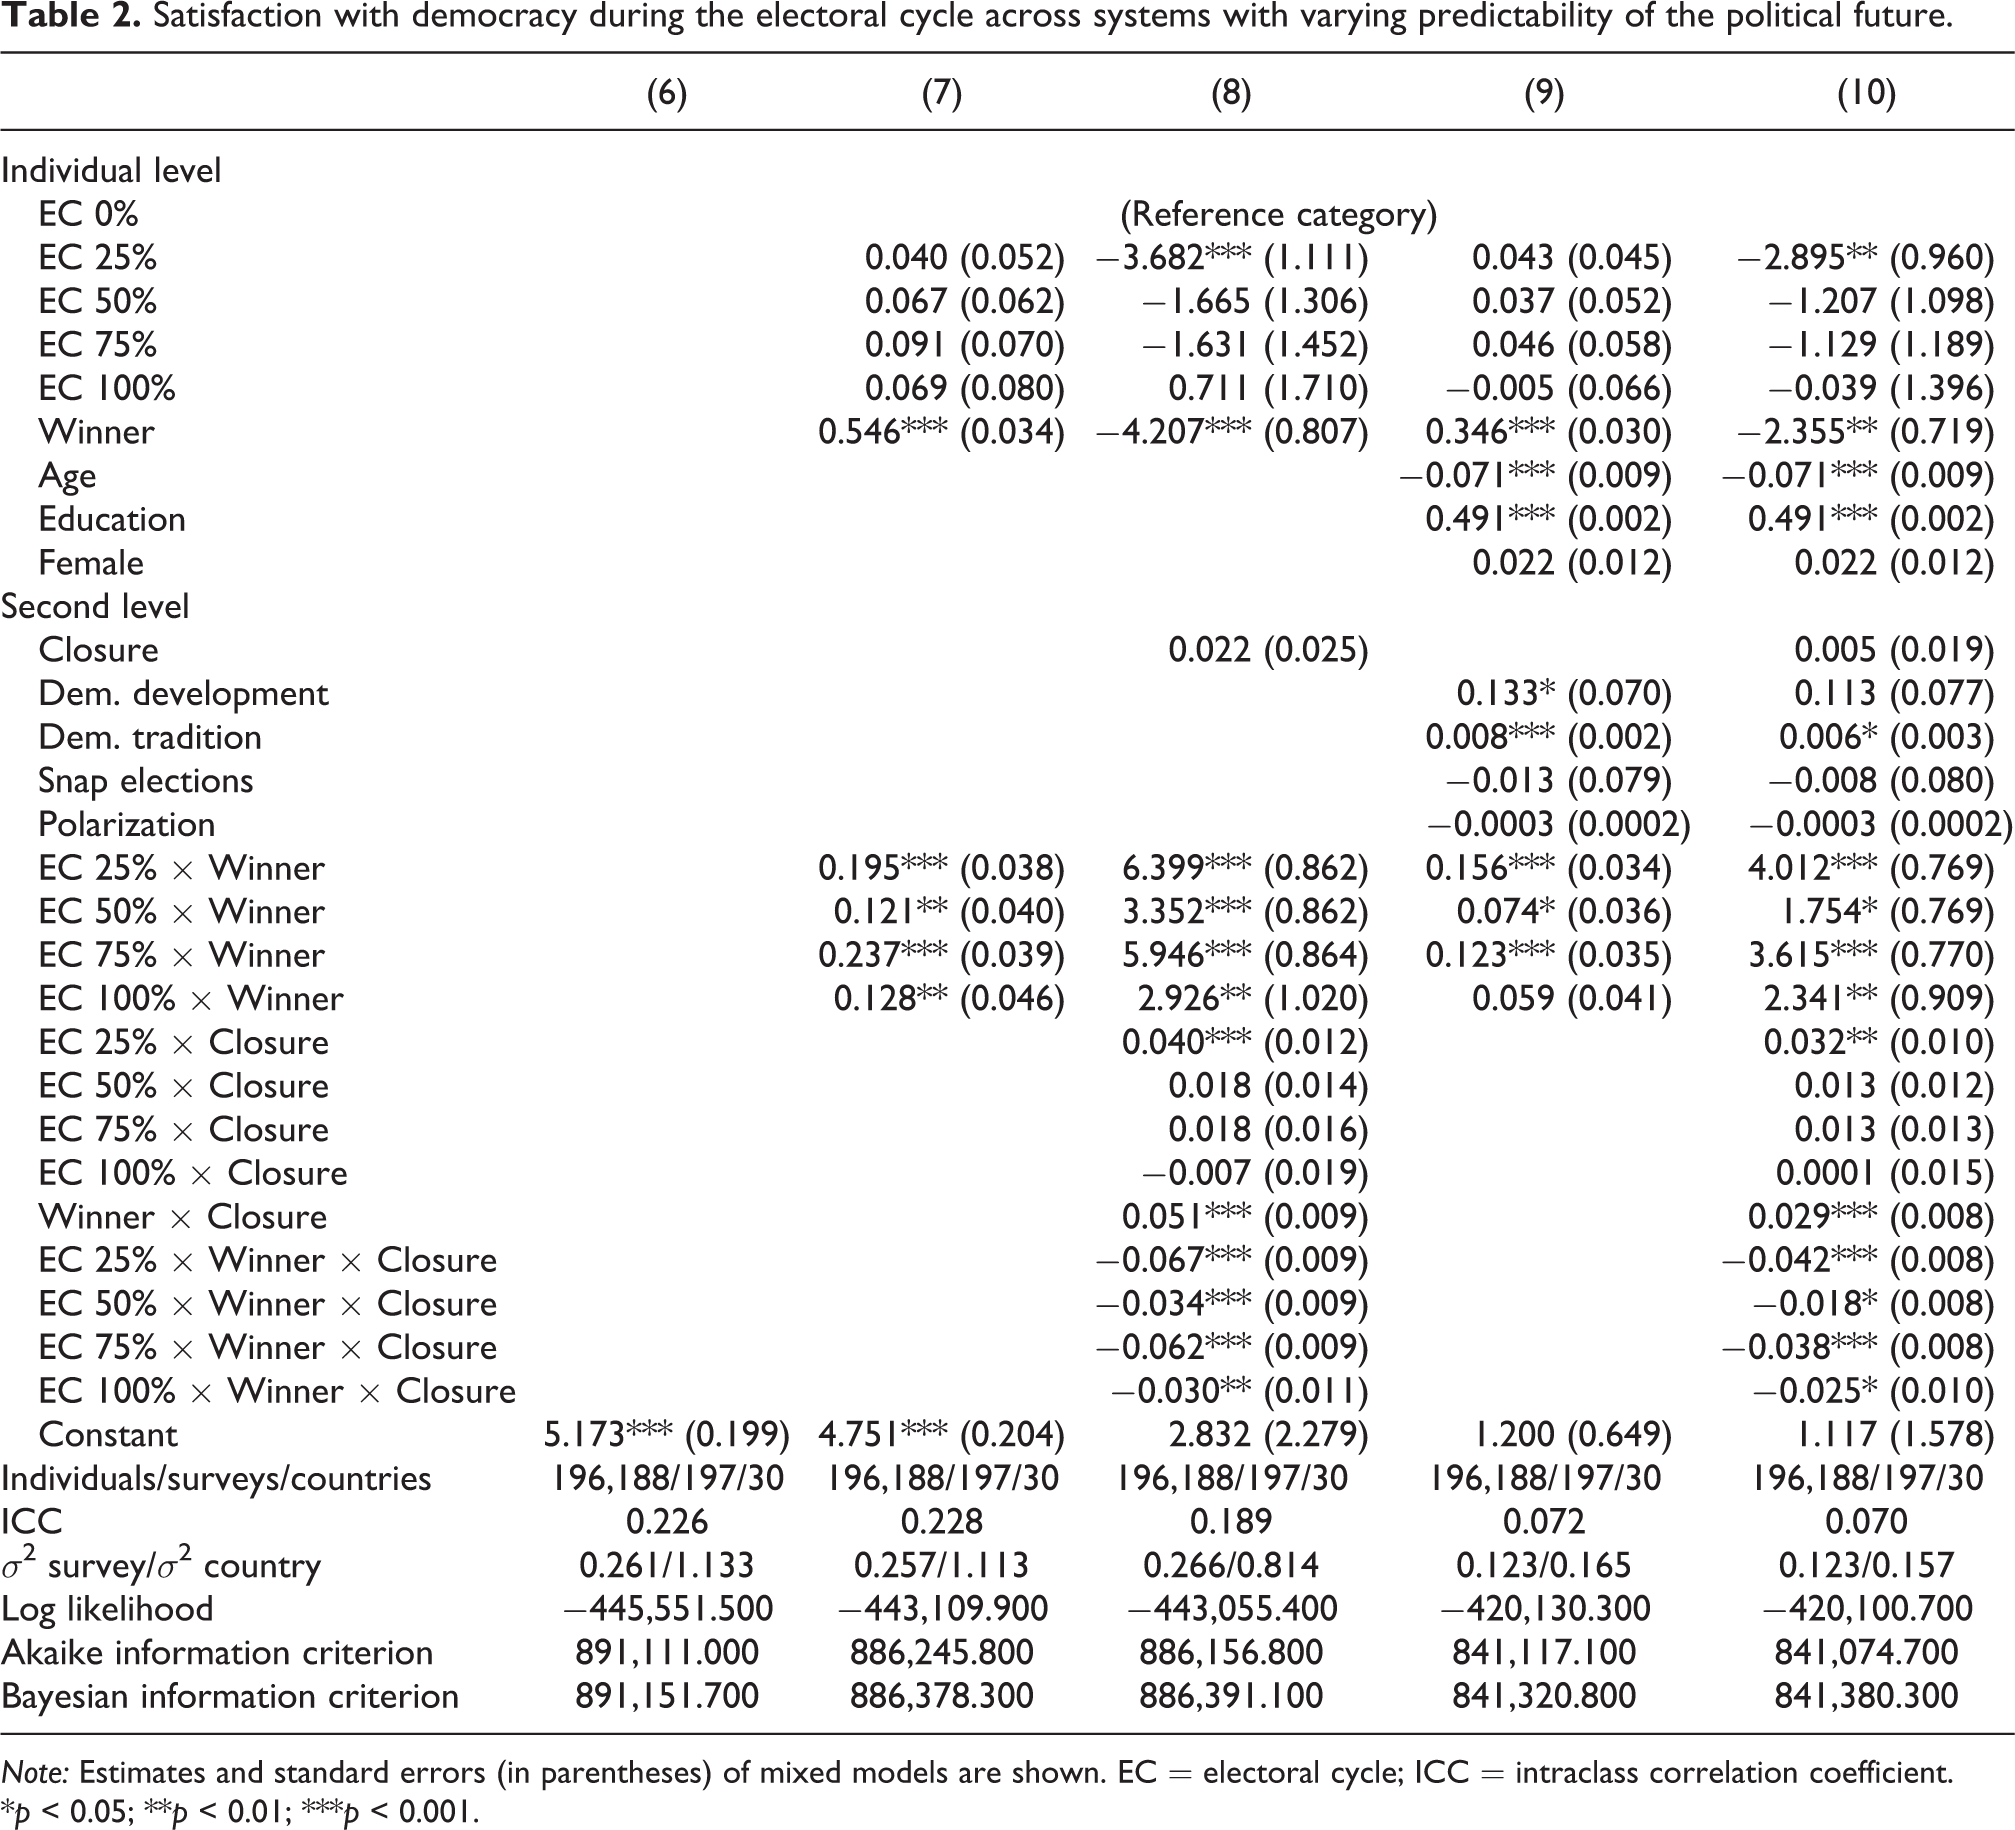
Model 8 includes the party system closure index (and model 10 adds individual and second-level controls on top of that) and thus these allow us to examine hypotheses 2a and 2b. The predicted values of interaction terms from the full model 10 appear in Figure 6, which displays the dynamics of satisfaction with democracy during electoral cycle for three levels of predictability—minimum (closure = 70.34; average for Ukraine), median (closure = 90.70; average for Belgium), and maximum (closure = 98.99; average for Switzerland)—taken from the national averages included in our dataset (see Table A3 in supplemental material A).
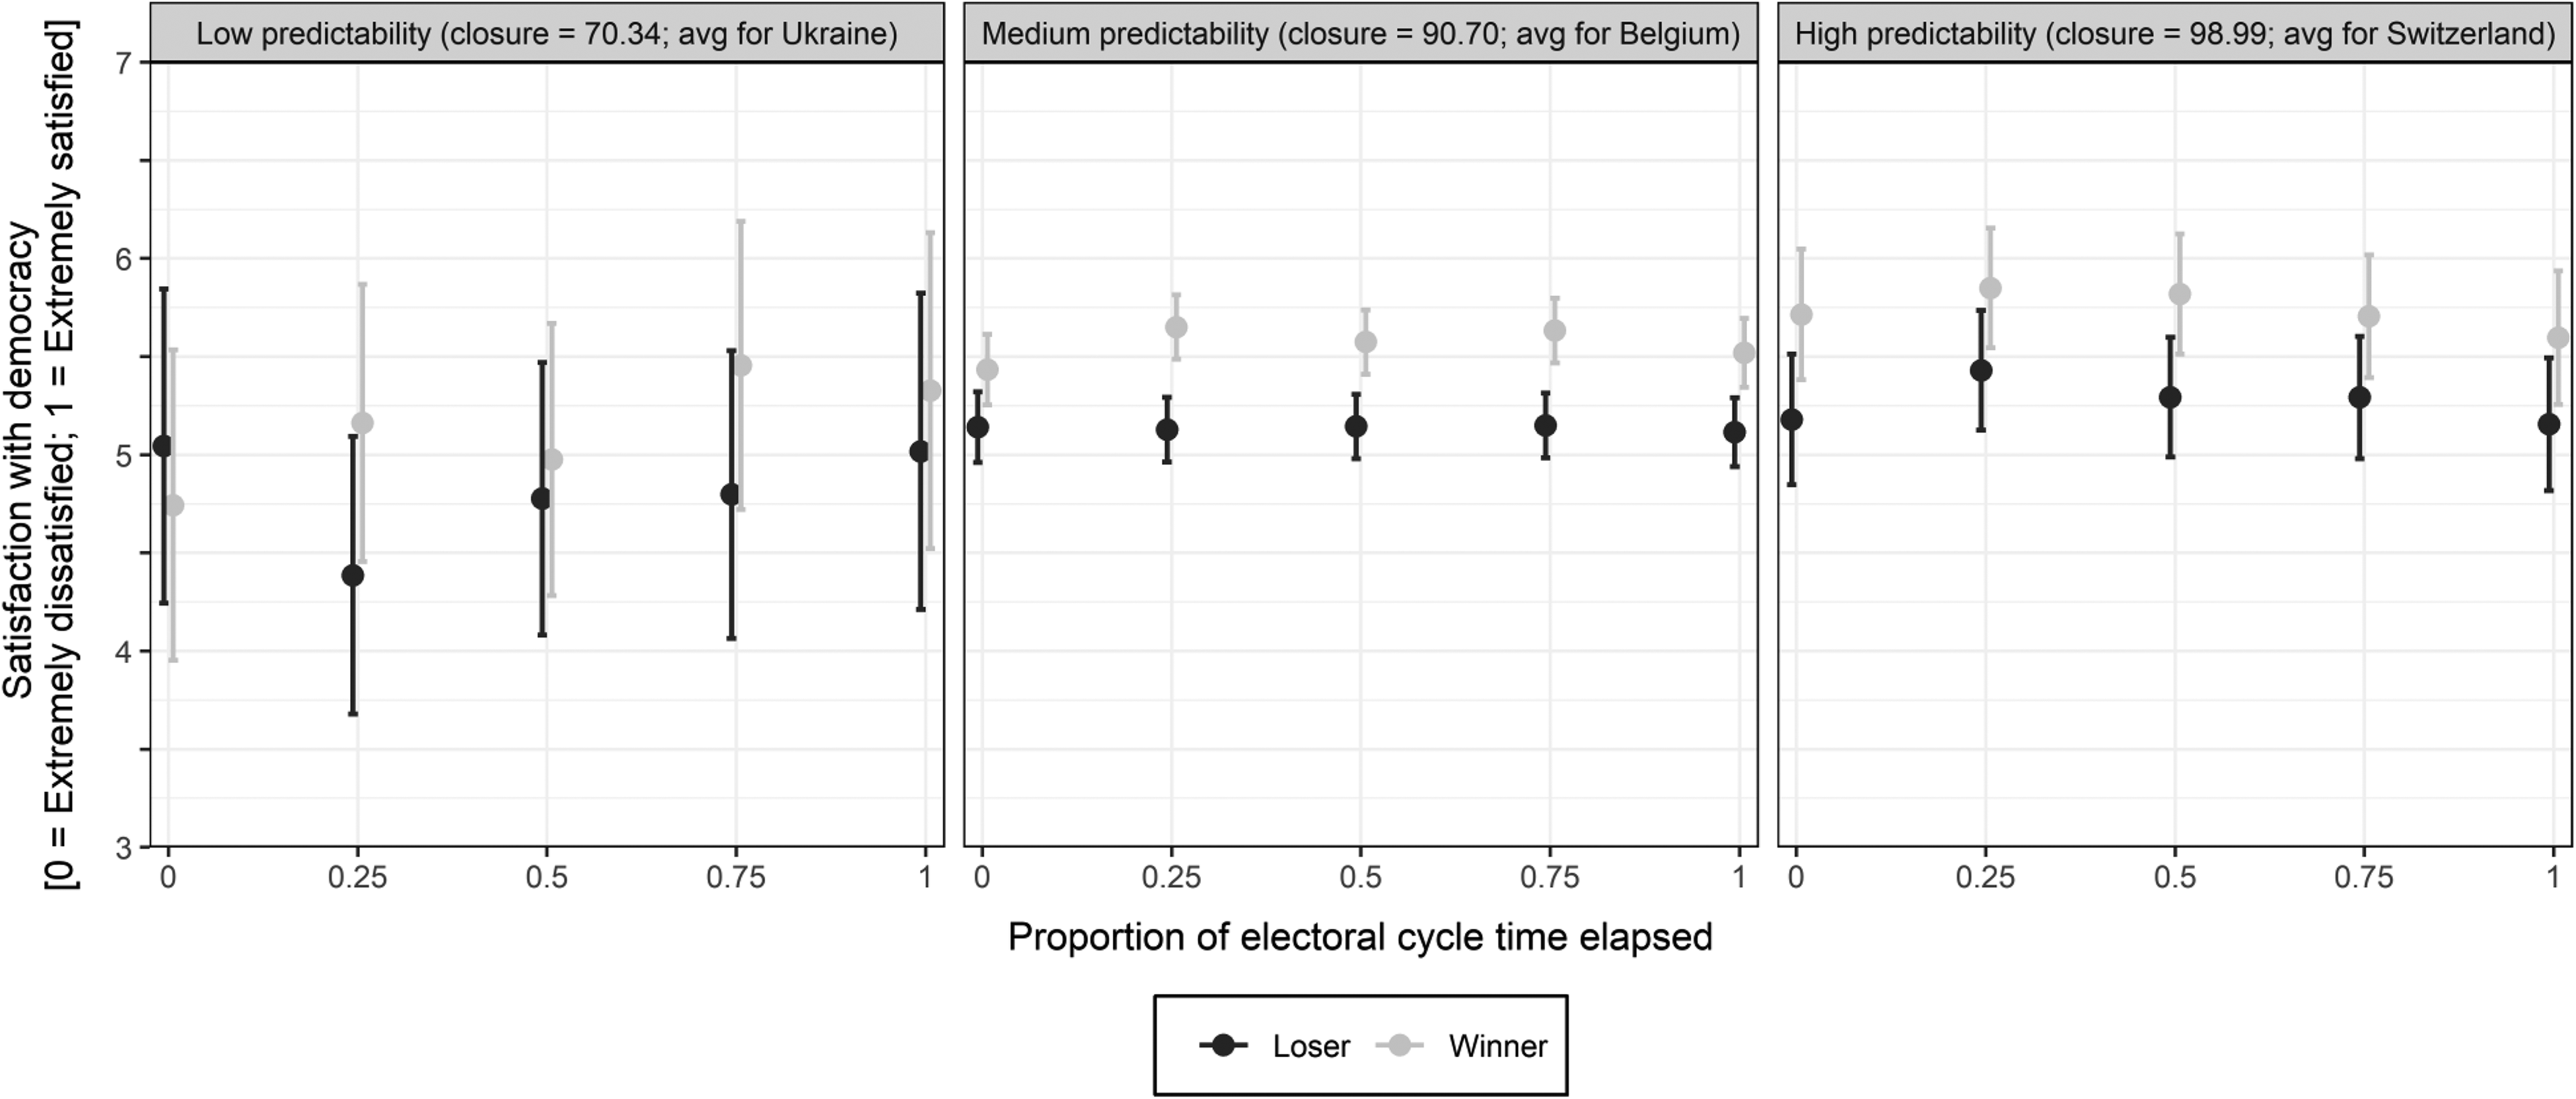
Satisfaction with democracy during the electoral cycle across systems with varying political predictability. Visualized are predicted values of satisfaction with democracy among winners and losers during various parts of electoral cycle based on interaction terms included in model 10.
Figure 6 suggests that while the winners–losers gap holds steadily in the systems with medium- and high-level predictability, this is not the case of countries with an unstable party system which prevents voters from reliably estimating future political trends. Getting back to the hypotheses, H2a assumed that the winners–losers gap was more stable in systems with high predictability and decreased only moderately over time. Our results suggest that, in these systems, satisfaction with democracy is steady and does not decrease over time. Therefore, our research supports only the part of H2a, which anticipates stable levels of satisfaction. We found no support for the notion that the level of satisfaction among winners might decrease over time.
The H2b expects that the gap in satisfaction between winners and losers in low-predictable systems appears with a delay and remains unstable over time. Figure 6 shows cases in which losers are actually more satisfied than winners shortly after elections (even though the difference between the winners and losers in low-predictable systems is not statistically significant) and the situation switches in the succeeding period. However, the change during the remaining period of the electoral cycle is apparently unstable as well. This trend could be connected to the low predictability of the political situation and government formation in some parts of Europe (Emanuele et al., 2018; Epperly, 2011). Frequent major changes in party systems and constantly emerging and disappearing parties decrease the ability of citizens to predict political trends (Casal Bértoa and Mair, 2012; Enyedi and Casal Bértoa, 2018; Tavits, 2008). Both immediately after the election results are announced and throughout the electoral cycle, voters cannot be sure whether the party they voted for will take part in the government. Moreover, given the sudden and frequent government replacements during electoral cycles, levels of voter satisfaction seem to respond to the ongoing political development and temporary prospects of changing their status from loser to winner, or vice versa. To conclude, these results provide support for hypothesis 2b.
Conclusions
An objective of this study was to test the claim that satisfaction is a relatively stable phenomenon (Anderson et al., 2005; Dahlberg and Linde, 2017) that has been based on limited data sets collected in only a few West European countries. Moreover, such stability seemed inconsistent with the fact that trends in satisfaction seem to vary across various contexts (Aarts and Thomassen, 2008; Farrer and Zingher, 2018). To do that, we used the interview date in the ESS and positioned 199,207 individuals altogether nested in 199 surveys conducted in 31 European countries within the electoral cycle in their systems.
First, we examined the dynamics in satisfaction with democracy during the electoral cycle under three different categories of electoral system. We conclude that the overall levels of voter satisfaction remain stable throughout the cycle. The trends are comparable across the systems with disproportionality levels typical of countries implementing proportional, mixed, and majoritarian electoral rules included in our sample. Therefore, the institutional setup of electoral systems seems to have only negligible influence on stability in voter satisfaction with democracy over longer periods of time.
Second, our findings indicate that the overall levels of satisfaction with democracy vary over time in contexts with low predictability of the political future. We argue that it is likely to be the frequent changes in party systems—unexpected coalition formations, sudden government replacements, and new parties with immediate impact on the dynamics of party systems appearing often (Emanuele et al., 2018; Tavits, 2008)—which limits voter ability to predict the political future. Therefore, voters cannot be sure how steady their winner/loser status is and in response, their degree of satisfaction fluctuates depending on the immediate political situation and the voters’ prospects of changing their status from a loser to a winner, or vice versa. On the other hand, voters in the medium- and high-predictability systems exhibit steady levels of satisfaction. We argue that this is because they do not witness unexpected shifts in politics and therefore are likely to expect their status as a winner or loser likely to remain the same until the next election.
Thus, our research confirmed the notion by Farrer and Zingher (2018: 518) that “the winner–loser gap and ‘losers’ consent’ are concepts that vary systematically around the world” within the restricted European context covered by ESS. Hence, the conclusions drawn by Anderson et al. (2005: 68–69), Dahlberg and Linde (Dahlberg and Linde, 2017), and van der Meer and Steenvoorden (2018) in the cluster of “Western democracies” have limited generalizability and should not be expected in political systems which do not include parties with well-known labels and extensive historical records that enable voters to build expectations about their future action.
Our findings suggest that the predictability of the actions of political parties constitutes a relevant attribute in the stability of voter satisfaction with the way democracy works in their country. If political systems shield voters from unexpected shifts in the behavior of political actors, voters tend to exhibit a stable degree of satisfaction with democracy as time goes by. Therefore, institutional designs should try to decrease incentives for overly precarious political negotiations which will force political actors to disregard their initial pledges in order to build a foundation for the post-electoral governance.
Research should examine the differences in satisfaction with democracy during the election periods and the remaining parts of electoral cycles. The research suggests that people’s satisfaction with democracy is volatile in election times and stable in the remainder of the cycle. However, we know very little about the influence of these two on each other.
Supplemental material
Supplemental_Material_A_and_B - As time goes by, the same sentiments apply? Stability of voter satisfaction with democracy during the electoral cycle in 31 countries
Supplemental_Material_A_and_B for As time goes by, the same sentiments apply? Stability of voter satisfaction with democracy during the electoral cycle in 31 countries by Miroslav Nemčok and Hanna Wass in Party Politics
Footnotes
Acknowledgements
This research would not be possible without Fernando Casal Bértoa who generously provided the yearly data for Party System Closure from the whogoverns.eu database. We would like to thankfully acknowledge the comments made by two anonymous reviewers. In addition, this research has benefitted from the comments made by participants at the 2020 ECPR General Conference (4 – 7 September, 2019) in Wrocław, Poland and at the 10th LCSR (Laboratory for Comparative Social Research) International Workshop (6 – 10 April 2019) in Moscow, Russia, where the earlier drafts of this paper were presented.
Declaration of conflicting interests
The author(s) declared no potential conflicts of interest with respect to the research, authorship, and/or publication of this article.
Funding
The author(s) disclosed receipt of the following financial support for the research, authorship, and/or publication of this article: The authors acknowledge the funding provided by the Strategic Research Council of the Academy of Finland [Grant Number 312710]. Miroslav Nemčok would also like to acknowledge the funding provided by the Finnish Cultural Foundation (Suomen Kulttuurirahasto).
Supplemental material
Supplemental material for this article is available online.
Notes
Author biographies
References
Supplementary Material
Please find the following supplemental material available below.
For Open Access articles published under a Creative Commons License, all supplemental material carries the same license as the article it is associated with.
For non-Open Access articles published, all supplemental material carries a non-exclusive license, and permission requests for re-use of supplemental material or any part of supplemental material shall be sent directly to the copyright owner as specified in the copyright notice associated with the article.