
Abstract
This study compares the spatial positioning of over 200 political parties across 28 European Union (EU) member states in two cross-national voting advice applications (VAAs) developed for the 2014 European elections: EUvox and euandi. We find that the two VAAs show highly similar results in terms of party positioning on the cultural liberal-conservative and pro-anti EU dimensions, while economic left–right placements converge less, especially concerning right-wing parties. Our analyses reveal that the higher overlap on the cultural and EU dimensions is a result, at least partially, of the inclusion of similar items used to measure these concepts, while most of the systematic divergence between the two VAAs in left–right placements stems from problematic issue-statements used in the dimensional calculations. We demonstrate how certain items can cause bias in the placements of specific party families by (1) not aligning with other statements that measure the same latent construct; (2) tapping into other latent constructs, in addition to the one they are supposed to measure; and (3) not inducing sufficient polarization between parties.
Introduction
As voting advice applications (VAAs) appear in more and more electoral contexts and their usage is on the rise, the quality of such online platforms has increasingly become the focus of academic interest and scrutiny (Cedroni and Garzia, 2010; Garzia and Marschall, 2014; Kleinnijenhuis et al., 2017; Wall et al., 2014). While initially VAAs provided simple agreement scores between voters and parties, during the last decade, a new generation of VAAs has emerged; the latter attach issue-statements to the deeper lying divisions or cleavages of the political system and generate low-dimensional spatial maps on which voters and parties/candidates are positioned (Garzia and Marschall, 2012; Krouwel and Wall, 2014). By placing political parties on overarching political dimensions, such as socio-economic left–right or cultural liberal–conservative, VAAs partake in the same endeavour as other more conventional methods of party positioning like manifesto coding, expert surveys and public opinion aggregation (see Krouwel, 2012; Krouwel and van Elfrinkhof, 2014; Marks, 2007). As we still lack a so-called ‘gold standard’ of party positioning (Garzia et al., 2017; Pennings, 2011), it is important to study the strengths and weaknesses of the VAA method and outline possibilities to improve the quality of party placement in VAAs.
As Garzia and Marschall (2012: 214) contend, the ‘party dimension’ of VAA research remains largely unexplored, since most scholars focus on analysing user data. This is likely because most national VAAs include no more than five to ten parties which is insufficient to adequately assess the quality of party positioning using statistical methods (Germann et al., 2015). Thus, although there have been some articles that compare the VAA estimates of party positions with other methods of party placement (see Gemenis, 2013; Wagner and Ruusuvirta, 2012), there is a lack of studies that compare the positions of the same political parties at the same point of time in different VAAs. This is a significant gap, as it is problematic to evaluate the reliability of the VAA method of party positioning if we do not know whether different VAAs locate the same parties similarly in the political space. VAAs developed for cross-national elections, like the ones for the European Parliament (EP), can remedy this problem, as they generate large data sets on the policy positions of political parties valuable for comparative party research.
The goal of this study is to address this gap and compare party positioning in the low-dimensional political space in cross-national VAAs. We use the party position data of two pan-European VAAs developed prior to the 2014 EP elections: EUvox 1 and euandi. 2 As both VAAs use the same three-dimensional spatial model comprised of ‘left–right’, ‘liberal–conservative/traditionalist’ and ‘pro–anti-European Union’ dimensions, these cross-national data sets provide a unique opportunity to compare the positioning of over 200 political parties across the European Union (EU). To the best of our knowledge, this is the most large-scale comparison of VAA party placements that has been conducted so far. Our study is exploratory in its nature – we analyse the results that the comparison of the two data sets reveals, without setting a priori expectations. We compare the aggregate party placements of both data sets and analyse the differences in party positioning across various party families to determine whether the positioning of parties belonging to certain groups diverges to a greater extent.
In addition to comparing, we also seek to explain the (in)consistencies between the party positions in EUvox and euandi. We focus on the element deemed the most crucial part of any VAA – the issue-statements (Garzia et al., 2017; Louwerse and Otjes, 2012; Van Camp et al., 2014). The way statements are selected, formulated and assigned to dimensions is decisive for the correct party placement in a low-dimensional political space, as answers to the statements are used for calculating the spatial positions (Germann et al., 2015; Otjes and Louwerse, 2014). Thus, any notable divergence between the party placements is likely to be caused by suboptimal statements in one or both of the studied VAAs. However, the main aim of the article is to evaluate how similar the party placements in EUvox and euandi are, and, subsequently, explain the findings. We will not provide a detailed analysis of every single issue-statement, but rather concentrate on the problematic items that are possibly causing placement divergence between the two VAAs. Therefore, this article should be considered a general comparison of two party data sets, not an exhaustive judgement on the reliability and validity of all three ideological scales in both applications.
Low-dimensional spatial models, party placement methodology and statement selection in VAAs
The most widely used spatial framework in VAAs is the two-dimensional model consisting of socio-economic and cultural axes (Germann et al., 2015; Louwerse and Otjes, 2014). This corresponds to the main findings of party system research from the last few decades: Although Downs (1957) – the pioneer of party system spatial modelling – distributed parties on a single left–right axis, more recent studies have shown that the left–right dimension, based on the extent of state intervention in the economy, is cross-cut by a cultural liberal-conservative dimension that deals with issues related to moral values (Kitschelt and McGann, 1997; Kriesi et al., 2008). This cultural axis has often been referred to as a Green/Alternative/Libertarian (GAL) – Traditional/Authoritarian/Nationalist (TAN) dimension (Hooghe et al., 2002). We will use the terms ‘GAL-TAN’, ‘cultural’ and ‘liberal-conservative/traditional’ dimension interchangeably in this article, as the exact wording often varies among different authors and VAAs. 3 The VAAs under review in this article also include a third dimension: A pro/anti-European (Union) integration axis related to the nature of the electoral competition for which these VAAs were designed – the EP elections.
The way VAAs estimate party positions on the previously described latent ideological dimensions is rather different from other methods of party placement. VAAs use an indirect approach, as they place parties on a number of issues considered partial indicators of each policy dimension (Gemenis, 2013). On these issues, parties are positioned on the basis of their perceived (dis)agreement with the proposed statement. Some VAAs use a simple three-point agree/disagree/neutral answer pattern, whereas more elaborate ones employ five-point Likert-type scales which capture not just the (dis)agreement with any specific proposition, but also the degree of (dis)agreement (Garzia and Marschall, 2012). The parties’ dimensional positions signify their average aggregate scores on all items assigned to the respective dimension. This method was developed by the Dutch Kieskompas in 2006 (see Kleinnijenhuis et al., 2007) and has been subsequently applied to many other VAAs (Trechsel and Mair, 2011), including the two we compare in this study.
There are certain differences among VAAs regarding the procedure of coding the party positions on the issues that are chosen to indicate the ideological dimensions. Although some VAAs let parties determine their own positions without any scrutiny (Garzia and Marschall, 2012), most of them also rely on the input of experts. The so-called Kieskompas method combines the two approaches, as the party self-placements are reviewed and – if necessary – corrected by experts who use parties’ election manifestos, other campaign material or the speeches and media appearances of their leaders to validate party positions (Krouwel et al., 2012; Trechsel and Mair, 2011). The Delphi method relies exclusively on expert judgements (Garzia and Marschall, 2012) and uses the process of ‘structured behavioural aggregation’ to reach consensus over party positions among a panel of experts (Gemenis, 2015).
Regardless of the way in which the party positions are coded or the dimensions of the political space defined, the selection of issue-statements has a decisive impact on the resulting VAA spatial maps (Garzia et al., 2017; Lefevere and Walgrave, 2014; Louwerse and Rosema, 2014; Walgrave et al., 2009). Party placements on the ideological dimensions are derived from aggregate positions on single issue-statements; thus, if the statements are not selected, formulated and assigned to the dimensions equitably, the composite score will also be inaccurate. In this article, we evaluate the VAA statements on criteria that can be directly measured and compared in a quantitative way. We focus on the dimensionality of the statements and assess whether the statements succeed in discriminating/polarizing between the parties sufficiently.
Regarding dimensionality, two sub-criteria should be considered. First, it is crucial that the statement taps into the expected policy dimension – it has to align with the other items that measure the same dimension. Violating this criterion results in dimensional scales that do not meet basic scalability requirements, and therefore, in spatial models that misrepresent the differences between political parties (Otjes and Louwerse, 2014: 264; 268–270). Second, the statements should not tap into any other latent construct(s), that is, they must be unidimensional. This criterion is breached, for instance, when an issue-statement measures party position on both the economic left–right and the cultural liberal-conservative dimension. Such items tend to induce ambiguity in the composite score and result in imprecise VAA spatial maps. Therefore, the statements that are assigned to indicate a certain policy dimension should be unidimensional in their content (Germann et al., 2015).
Second, the statements should involve some controversy, so that there are parties in favour as well as parties against. VAA developers should not include so-called valence issues, that is, issues on which (almost) the entire electorate either agrees or disagrees (Garzia et al., 2017: 336). The other way a statement can fail in terms of sufficiently discriminating between parties is if parties are highly concentrated to the centre of the coding scale, taking a neutral or an unclear stance on an issue. To avoid that, the statements should have high salience in the election campaign, which makes it more likely for parties to have a clear stance (ibid.). As De Sio and Weber (2014: 872) point out, there can be a large cross-national variation in policy support: An issue that is divisive in one country can have almost unified support/opposition in another context. The same applies to the salience of different topics. Thus, coming up with issue-statements that are divisive and salient in all or most European party systems can be considerably challenging.
It is crucial for VAA developers to ensure that the dimensional scales they construct meet the aforementioned criteria. In this study, we elaborate this argument and demonstrate how statements that violate these conditions can bias the placements of parties, depending on the latter’s ideological inclinations.
The EUvox and euandi data sets
We utilize data from two pan-European VAAs developed for the 2014 EP elections: EUvox and euandi. Both were accessible to the citizens of all 28 EU member states and use the same three-dimensional spatial model for placing users and parties, consisting of economic left–right, cultural liberal-traditional/conservative and pro/more-against/less EU integration dimensions. To ensure data comparability, we only analyse the placements of the 205 parties that were included in both VAAs.
Both VAAs employed five-point Likert-type scales as statement answer categories – a party could be coded as either in complete or partial (dis)agreement with the proposed statement or as neutral. Both VAAs also have a ‘no opinion’ option, used when parties do not have any stance on a given issue. To make the interpretation of results more convenient, the statements are scaled to range from 0 to 1: Complete disagreement corresponds to ‘0’; complete agreement to ‘1’; partial (dis)agreement to ‘0.25’ or ‘0.75’ and the neutral position to ‘0.5’. The dimensions are scaled as follows: left–right: 0 = left, 1 = right; cultural: 0 = liberal, 1 = conservative/traditional and EU: 0 = anti, 1 = pro.
The dimension score of each party is the arithmetic mean of its placement on all the statements that were assigned to each respective dimension. If a party was coded as having “no opinion” on a statement, this statement was left out of the calculation for the respective party. Some statement scores were reversed to ensure that each item has the same polarity. As issue salience is not taken into account, all statements have the same relative weight.
Although both EUvox and euandi use a questionnaire with 30 issue-statements, the proportion of cross-national and country-specific statements differs. While euandi has a questionnaire with 28 cross-national and two country-specific statements, EUvox contains 21 items identical for all countries and 9 country- or region-specific statements. Replicating the original party placements in euandi was simple, as they have clearly indicated which statements are assigned to which dimension. According to the euandi website, they use 27 of 28 cross-national statements in their dimensional calculations and country-specific items are not included. EUvox, conversely, has not explained how the three-dimensional political space was calculated. Based on information obtained from the developers of EUvox, it appears that they used both the cross-national and country-specific statements to calculate the dimensions and that some items were removed in the countries where initial user results proved that they do not align with the expected dimension (indicating that the method of dynamic scale validation was used; see Germann and Mendez, 2016 and Germann et al., 2015). As we are conducting a cross-national comparison, we use only the common statements to calculate party positions. Consequently, the party placements we use do not completely mirror the ones which were visible to users after completing the 30-statement EUvox survey. According to our information, 20 of 21 EUvox cross-national statements were at least initially used in dimensional calculations. 4 The statements used to calculate the dimension scores and their respective polarities are presented in the Online supplemental appendix A.
There is also a difference between the party coding methodologies of EUvox and euandi, as the former uses the Kieskompas method, whereas the latter employs the Delphi method. The general comparison of the two VAAs is presented in Table 1.
General comparison of euandi and Euvox.
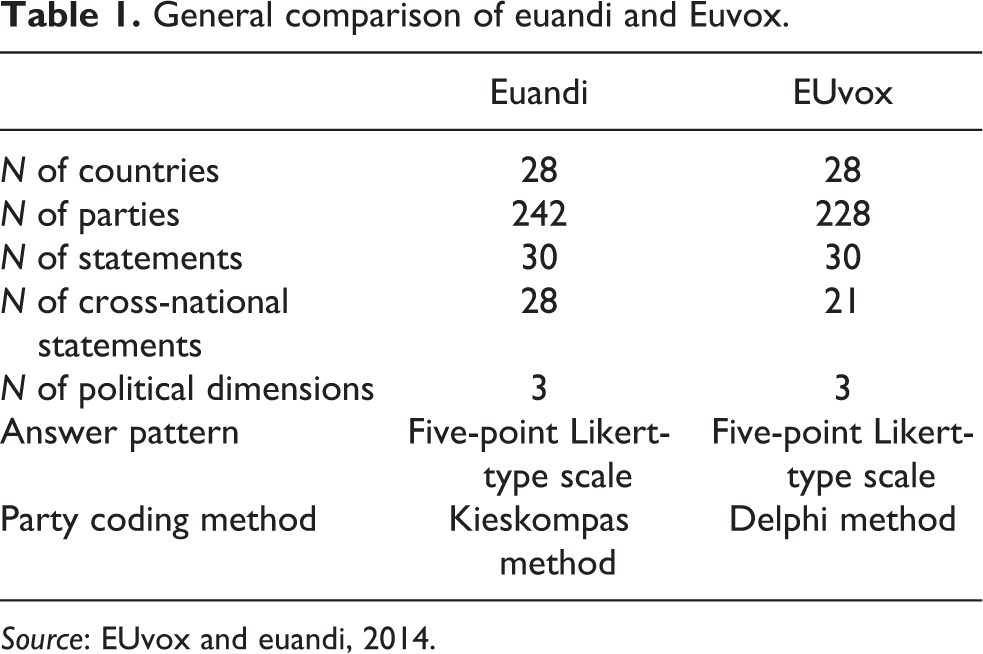
Source: EUvox and euandi, 2014.
Results and analyses
Overlap between EUvox and EUandi party placements
We start by assessing the general overlap between the EUvox and euandi party placements on the three political dimensions. Figure 1 plots euandi placements (x-axis) against EUvox placements (y-axis), each data point representing a political party. As Figure 1 indicates, party placements are strongly and positively correlated on all dimensions. However, clear differences in terms of the strength of correlation can also be observed. The linear relationship is strongest on the cultural dimension (R 2 = 0.71) and most of the data points are gathered closely around the regression diagonal. On the EU dimension, most parties are located on the pro-EU side of the scale in both VAAs, and the parties’ EU dimension placement in one VAA explains 70% of the variance in the positioning in the other (R 2 = 0.70). On the left–right dimension, the convergence between the placements in the two VAAs is notably weaker than the two other scales (R 2 = 0.61).
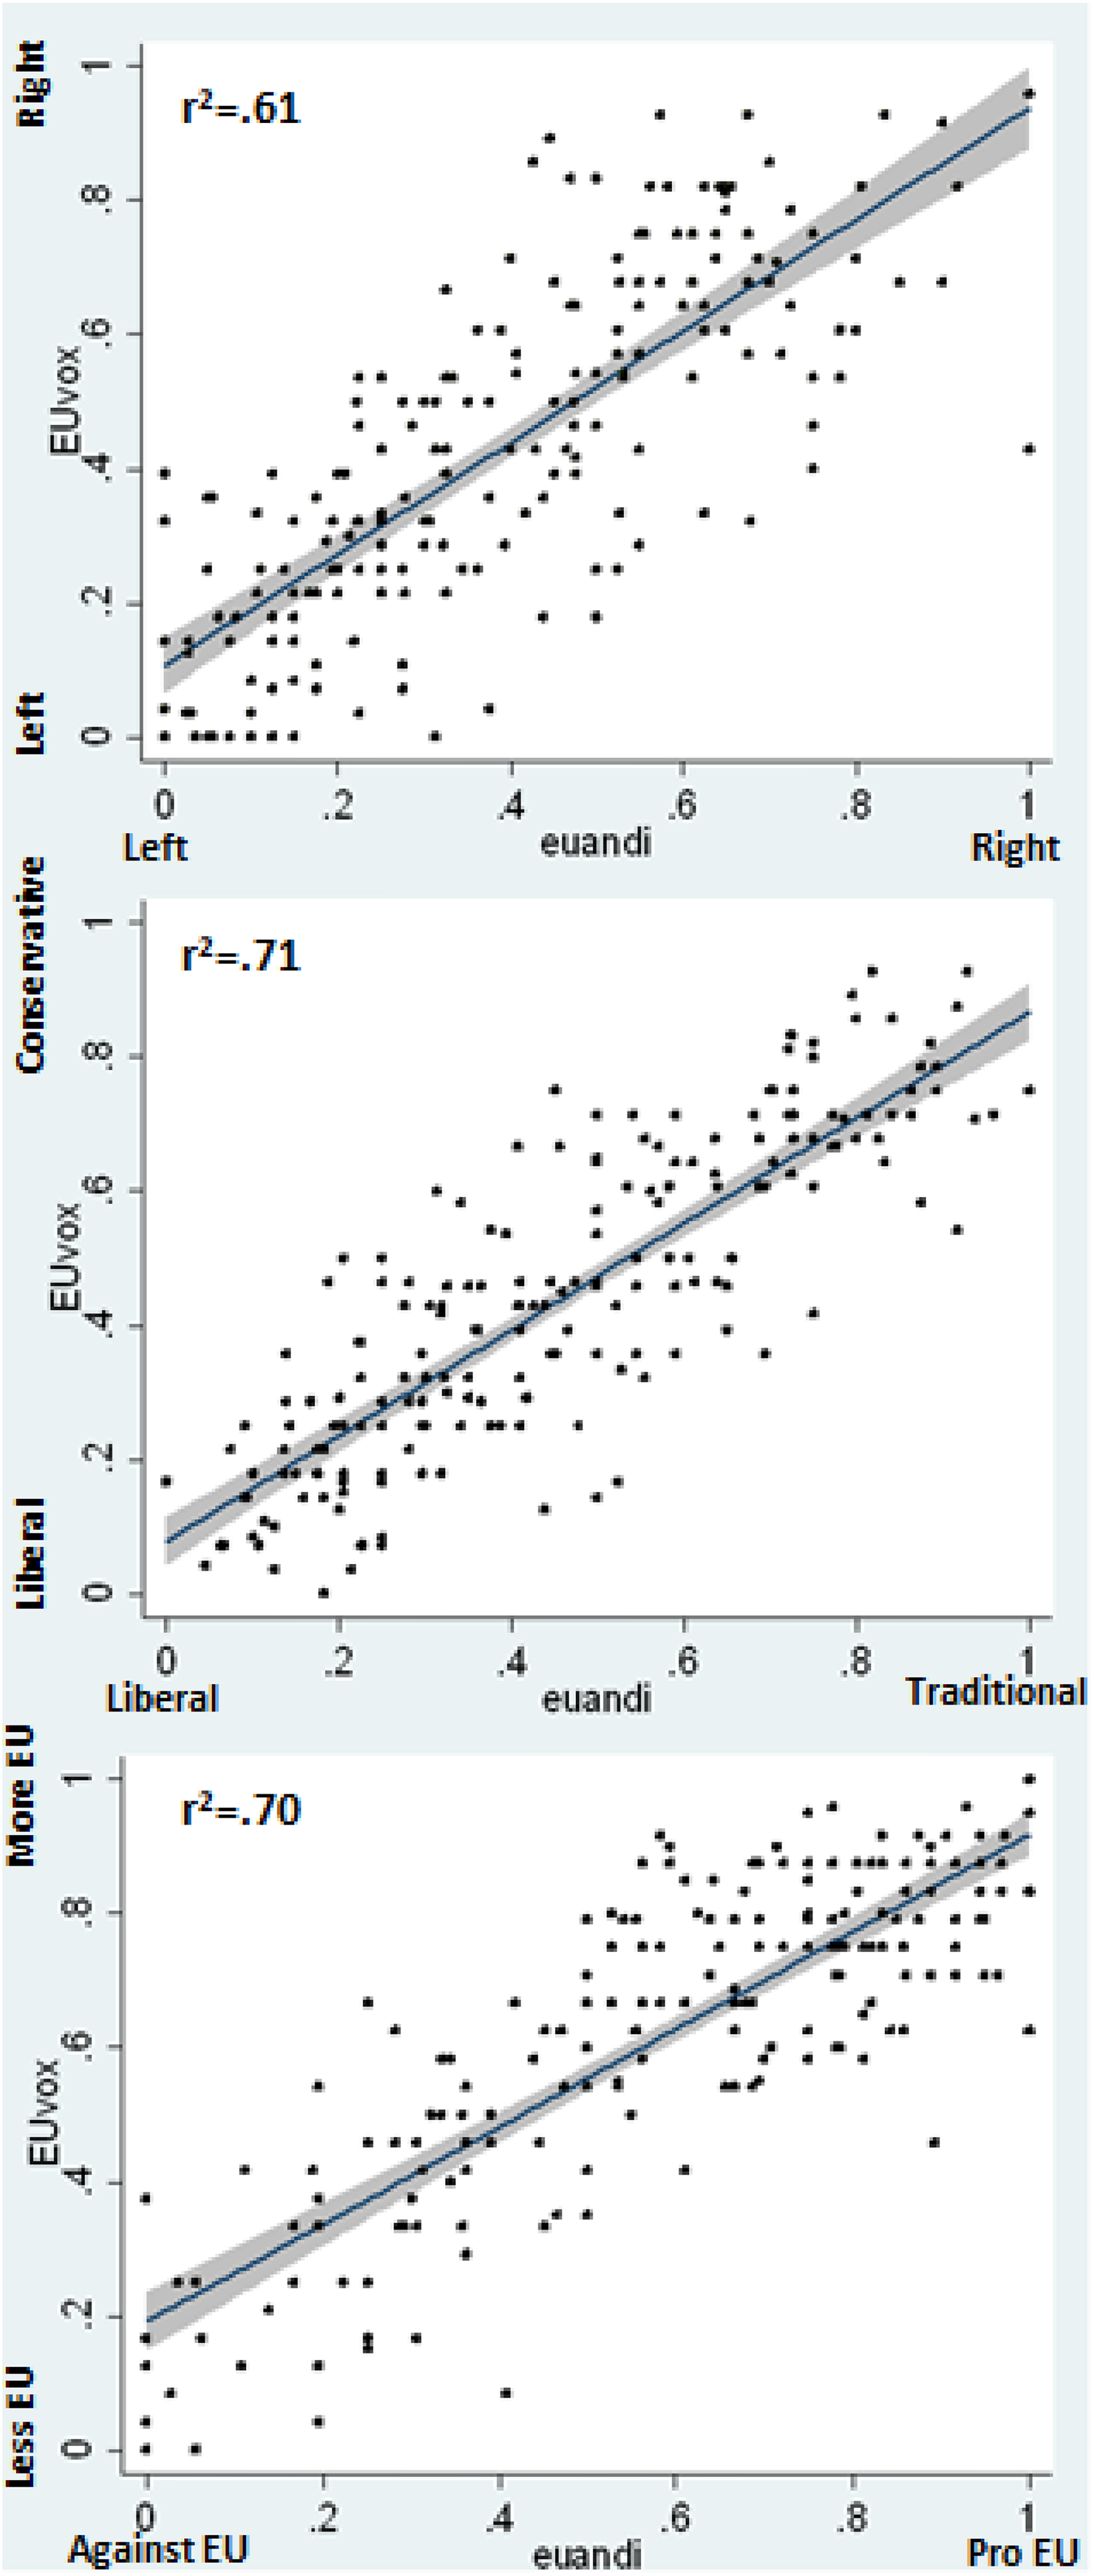
Scatterplots of party placement convergence in euandi and EUvox on left–right, cultural and EU dimensions. Source: EUvox and euandi, 2014. EU: European Union.
It is possible that, although the party placement scores correlate strongly, they are still systematically different. Therefore, we also compare the mean dimensional scores for the entire party set. Figure 2 demonstrates that the slight differences in party placements tend to balance out, lacking notable systematic inconsistencies. For some parties, the euandi score is slightly more right-wing, conservative or pro-EU than in EUvox, whereas for others it is the other way around. Thus, when the average scores of the entire party data sets for each dimension are compared, the highest statistically significant difference is on the economic dimension: in EUvox, the parties are, on average, placed 4% more to the right than in euandi. On the EU dimension, we can also detect a statistically significant divergence, as in EUvox, the average score is almost 3% more pro-EU. On the cultural axis, the average scores of the full party data sets are almost indistinguishable, with the difference being less than 2% and statistically insignificant.
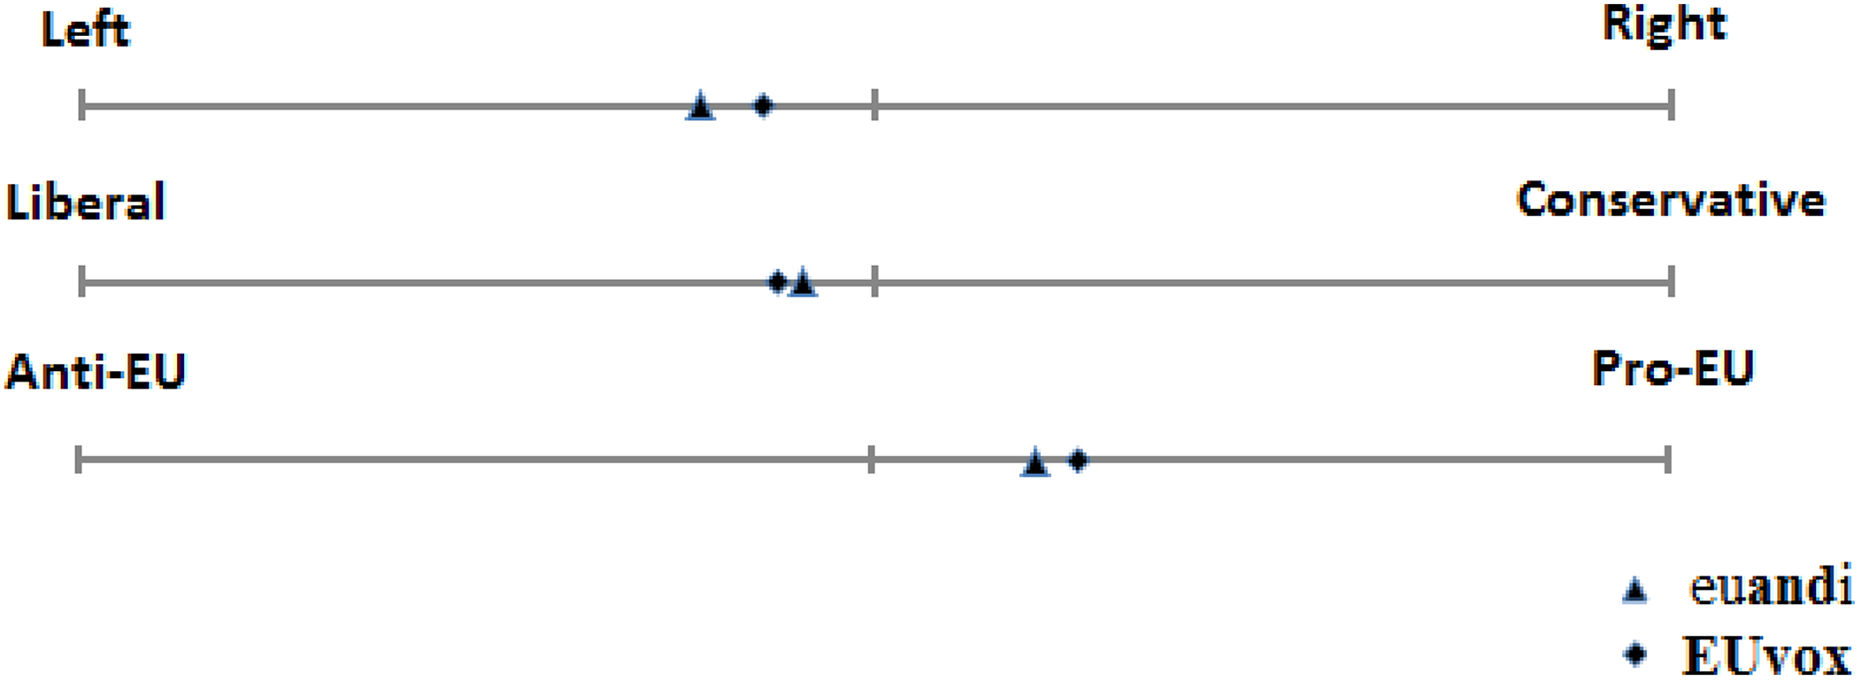
Mean dimensional scores of EUvox and euandi. Source: EUvox and euandi, 2014.
The indicators presented on Figures 1 and 2 demonstrate that the economic left–right dimension clearly has the lowest degree of convergence between EUvox and euandi. On the EU dimension, there is a statistically significant difference between the average placement of the parties, yet, overall, the match between party placements is still very high. The cultural dimension placements converge best according to both indicators, as they have the strongest correlation and no statistically significant difference in the average placements of the party sets. This result is rather surprising considering the findings of Otjes and Louwerse (2014) which indicate that the liberal-conservative dimension performs rather weakly compared to the economic dimension, in terms of scaling reliability. Although we study the external validity of the two VAAs, while Otjes and Louwerse analyse the internal coherence of the scales, it is reasonable to expect that the two are correlated: If the scales are less consistent internally, one would also assume that the overlap with other VAA placements is lower, unless both use invalid, but similar scales.
To provide a more detailed comparison of the party placements in the two VAAs, we also examine the party placement divergence for different party families to assess whether some parties are more problematic for placement in VAA generated spatial maps. We distinguish seven party families, mostly based on their affiliations with EP party groups and other international networks. The Online supplemental appendix B contains the lists of parties in each of the groups and the exact classification criteria. To analyse the convergence between EUvox and euandi placements within party families, we compare the dimensional mean scores, as we previously did for the whole party sample (see Figure 2). The means comparison reveals whether there is any systematic bias between the EUvox and euandi placements among different party groups. Correlation coefficients are not used for this analysis, as there is significantly less variation within party families compared to the whole party sample, which makes it difficult to detect covariation.
Figure 3 depicts the two-dimensional political maps of the average positions of party families in EUvox and euandi. In the upper part of the figure, the left–right dimension is plotted against the cultural and on the lower part against the EU axis. The ellipses represent the standard deviations (SDs) of the party placements within each group on both axes, with the average party group position located in the centre of the ellipse. Figure 3 confirms that the most divergent dimension between the two VAAs is the economic one. EUvox gives a clearly more polarized perception of the European party landscape in terms of left–right placements, as it puts the most right-wing party groups more to the right, while placing radical left parties closer to the left extreme. On a scale from 0 (left) to 1 (right), the distance between the two furthest groups in euandi is 0.46 (far left parties are, on average, placed at 0.12; European Conservatives and Reformists [ECR] parties at 0.58), while in EUvox, it is 0.59 (far left at 0.06; liberals 0.65).
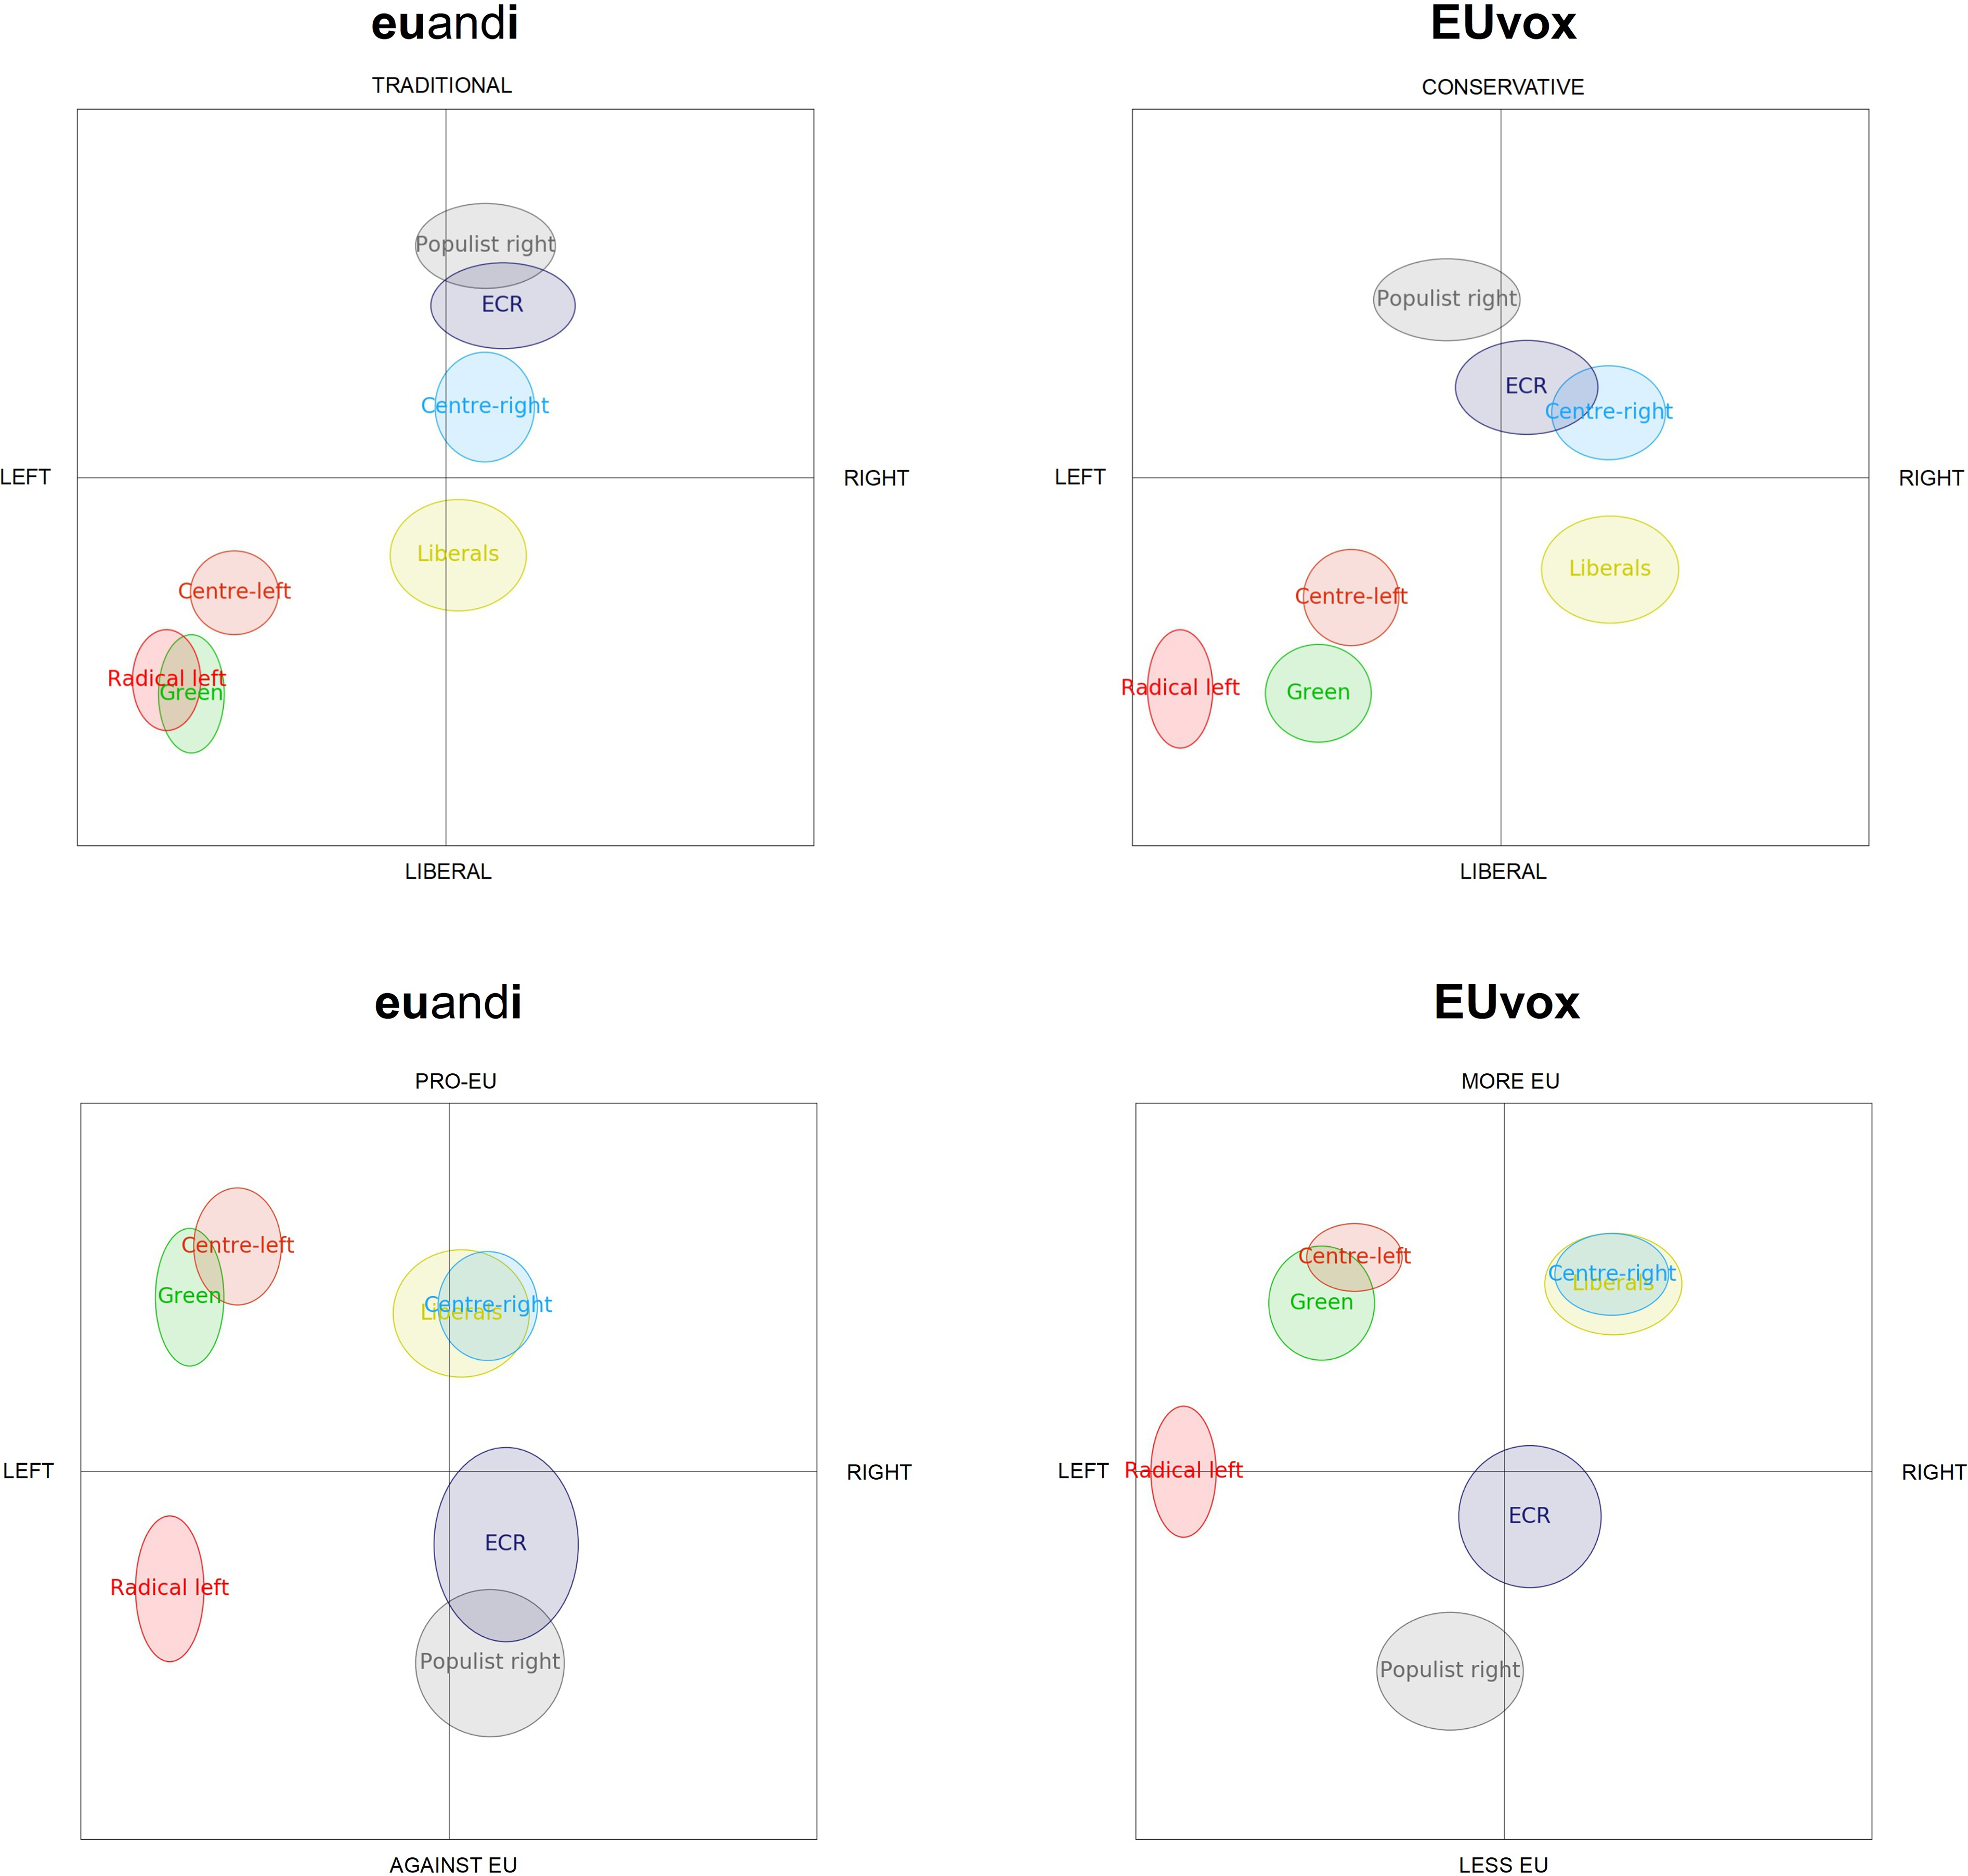
Two-dimensional political landscapes in euandi and EUvox according to average party family placements. Note: The average party positions are in the centres of the ellipses. The ellipses represent the SDs of party placements within groups. The width of the ellipse indicates one SD on the economic left–right axes, while the height of the ellipse indicates one SD on the liberal-conservative/pro-anti EU axis. SD: standard deviation; EU: European Union.
If for the whole party data set these differences almost balance out, significantly higher discrepancies are visible across party families on the economic dimension, as the placement bias is not unidirectional across party groups: Some groups are more right-wing in EUvox, while others in euandi. In a nutshell, parties that are closer to the political centre (centre-right (European People’s Party [EPP]), centre-left (Progressive Alliance of Socialists and Democrats [PES]) 5 and liberals (Alliance of Liberals and Democrats for Europe [ALDE])), as well as green parties, have a significantly more right-wing placement in EUvox, whereas both populist right and radical left parties are significantly more to the right in euandi. The largest difference is observed among populist right and liberal parties, which are both positioned 13% more to the right in euandi and EUvox, respectively. Right-populist parties are the only group for which the average placement is on different sides of the centre-point in the two VAAs (left in EUvox and right in euandi). For green parties, the divergence is over 10% as well, while centre-right and centre-left parties are positioned slightly less than 10% more to the left in euandi compared to EUvox. Altogether, six of seven party groups have a statistically significant difference in their average left–right placement. Since political parties are often described as being either left- or right-wing, such discrepancies can cause notable confusion. For example, 8 of 41 centre-right (EPP) and 6 of 29 liberal (ALDE) parties are positioned as economically left-wing in euandi, while occupying a right-wing position in EUvox. Left-wing parties, however, are consistently placed on the left side of the political landscape.
Regarding the EU dimension, Figure 3 reveals that the convergence between party family positions in the two VAAs is generally much higher compared to the left–right axis. Centre-left, liberal, green and centre-right party families are placed conveniently at the pro-EU side of the continuum in both VAAs, where they are usually presumed to be. Right-populist and ECR parties are also positioned at the expected against EU side in both applications, and placement divergence is almost non-existent. Very notable outliers from this pattern of high convergence are far-left parties which are, on average, 16% more pro-EU in EUvox. This is the highest divergence in party family placements across all three dimensions and is very problematic in substantive terms. While in EUvox, the average left-radical party placement on EU dimension is precisely in the middle of the axis (0.50), indicating a neutral take on EU integration, in euandi, the average placement is 0.34, which is clearly an anti-EU position, not very distant from the Eurosceptic right-populist parties (average placement 0.24).
Finally, on the cultural dimension, the placements are highly consistent across the two VAAs, the only exception being ECR parties. As Figure 3 demonstrates, these parties are significantly closer to the conservative endpoint of the cultural scale in euandi. Such a discrepancy is rather surprising, given that these parties often employ rigid conservative positions and should not be too difficult to place on this dimension. However, the problem is not very dramatic, as most ECR parties are consistently placed on the conservative side of the continuum in each VAA, corresponding to the general intuition of where they should reside in the political space.
In sum, the comparison of the EUvox and euandi data sets reveals that both VAAs manage to place most parties similarly and to the quadrants in the political space where these parties are usually perceived to be. However, there is still some confusion and systematic differences evident (mostly on socio-economic left–right dimension), and this finding cannot be overlooked.
Explaining the overlap and divergences in party placements
This section deals with a more thorough focus into the previously described findings, indicating that the lowest convergence between the EUvox and euandi party placements is on the economic dimension, while the highest is on the cultural issue-dimension. As indicated in the introduction, we focus on the issue-statements used to calculate the dimensional positions.
A first notable observation is that the statements assigned to the cultural and EU dimensions are much more similar between the two VAAs compared to the left–right axis. On the cultural dimension, there are six survey items that address the same or almost the same issue. 6 These statements concern cannabis/soft drugs legalization, same sex marriage, abortion, immigration, citizen privacy and punishment of criminals (see the Online supplemental appendix A). On the EU dimension, there are four items that address the same or a very similar issue: Both VAAs have included a statement about the euro currency; member state veto powers; common EU foreign policy, and a general statement on whether EU integration is a good thing (euandi) or whether EU membership has been bad for the country (EUvox). Contrary to the other two dimensions, the economic left–right positions are measured by almost entirely different statements in both VAAs. The statement ‘Governments should reduce workers’ protection regulations in order to fight unemployment’ is included in euandi, while in EUvox, a similar statement is framed as ‘It should be easy for companies to fire people’. This goes closest to an item overlap on the left–right dimension. Thus, we can conclude that there is a much higher degree of consensus between the two VAA developers regarding which statements best capture the cultural and the EU dimensions. Regarding some similar statements, party placements diverge due to formulation differences 7 but, generally, parties are coded very similarly on matching statements in the two VAAs. Based on this, we can argue that the high overlap between party placements on the cultural and (slightly less) on the EU dimension can, at least partially, be attributed to the similar items used by the two VAAs to measure these constructs.
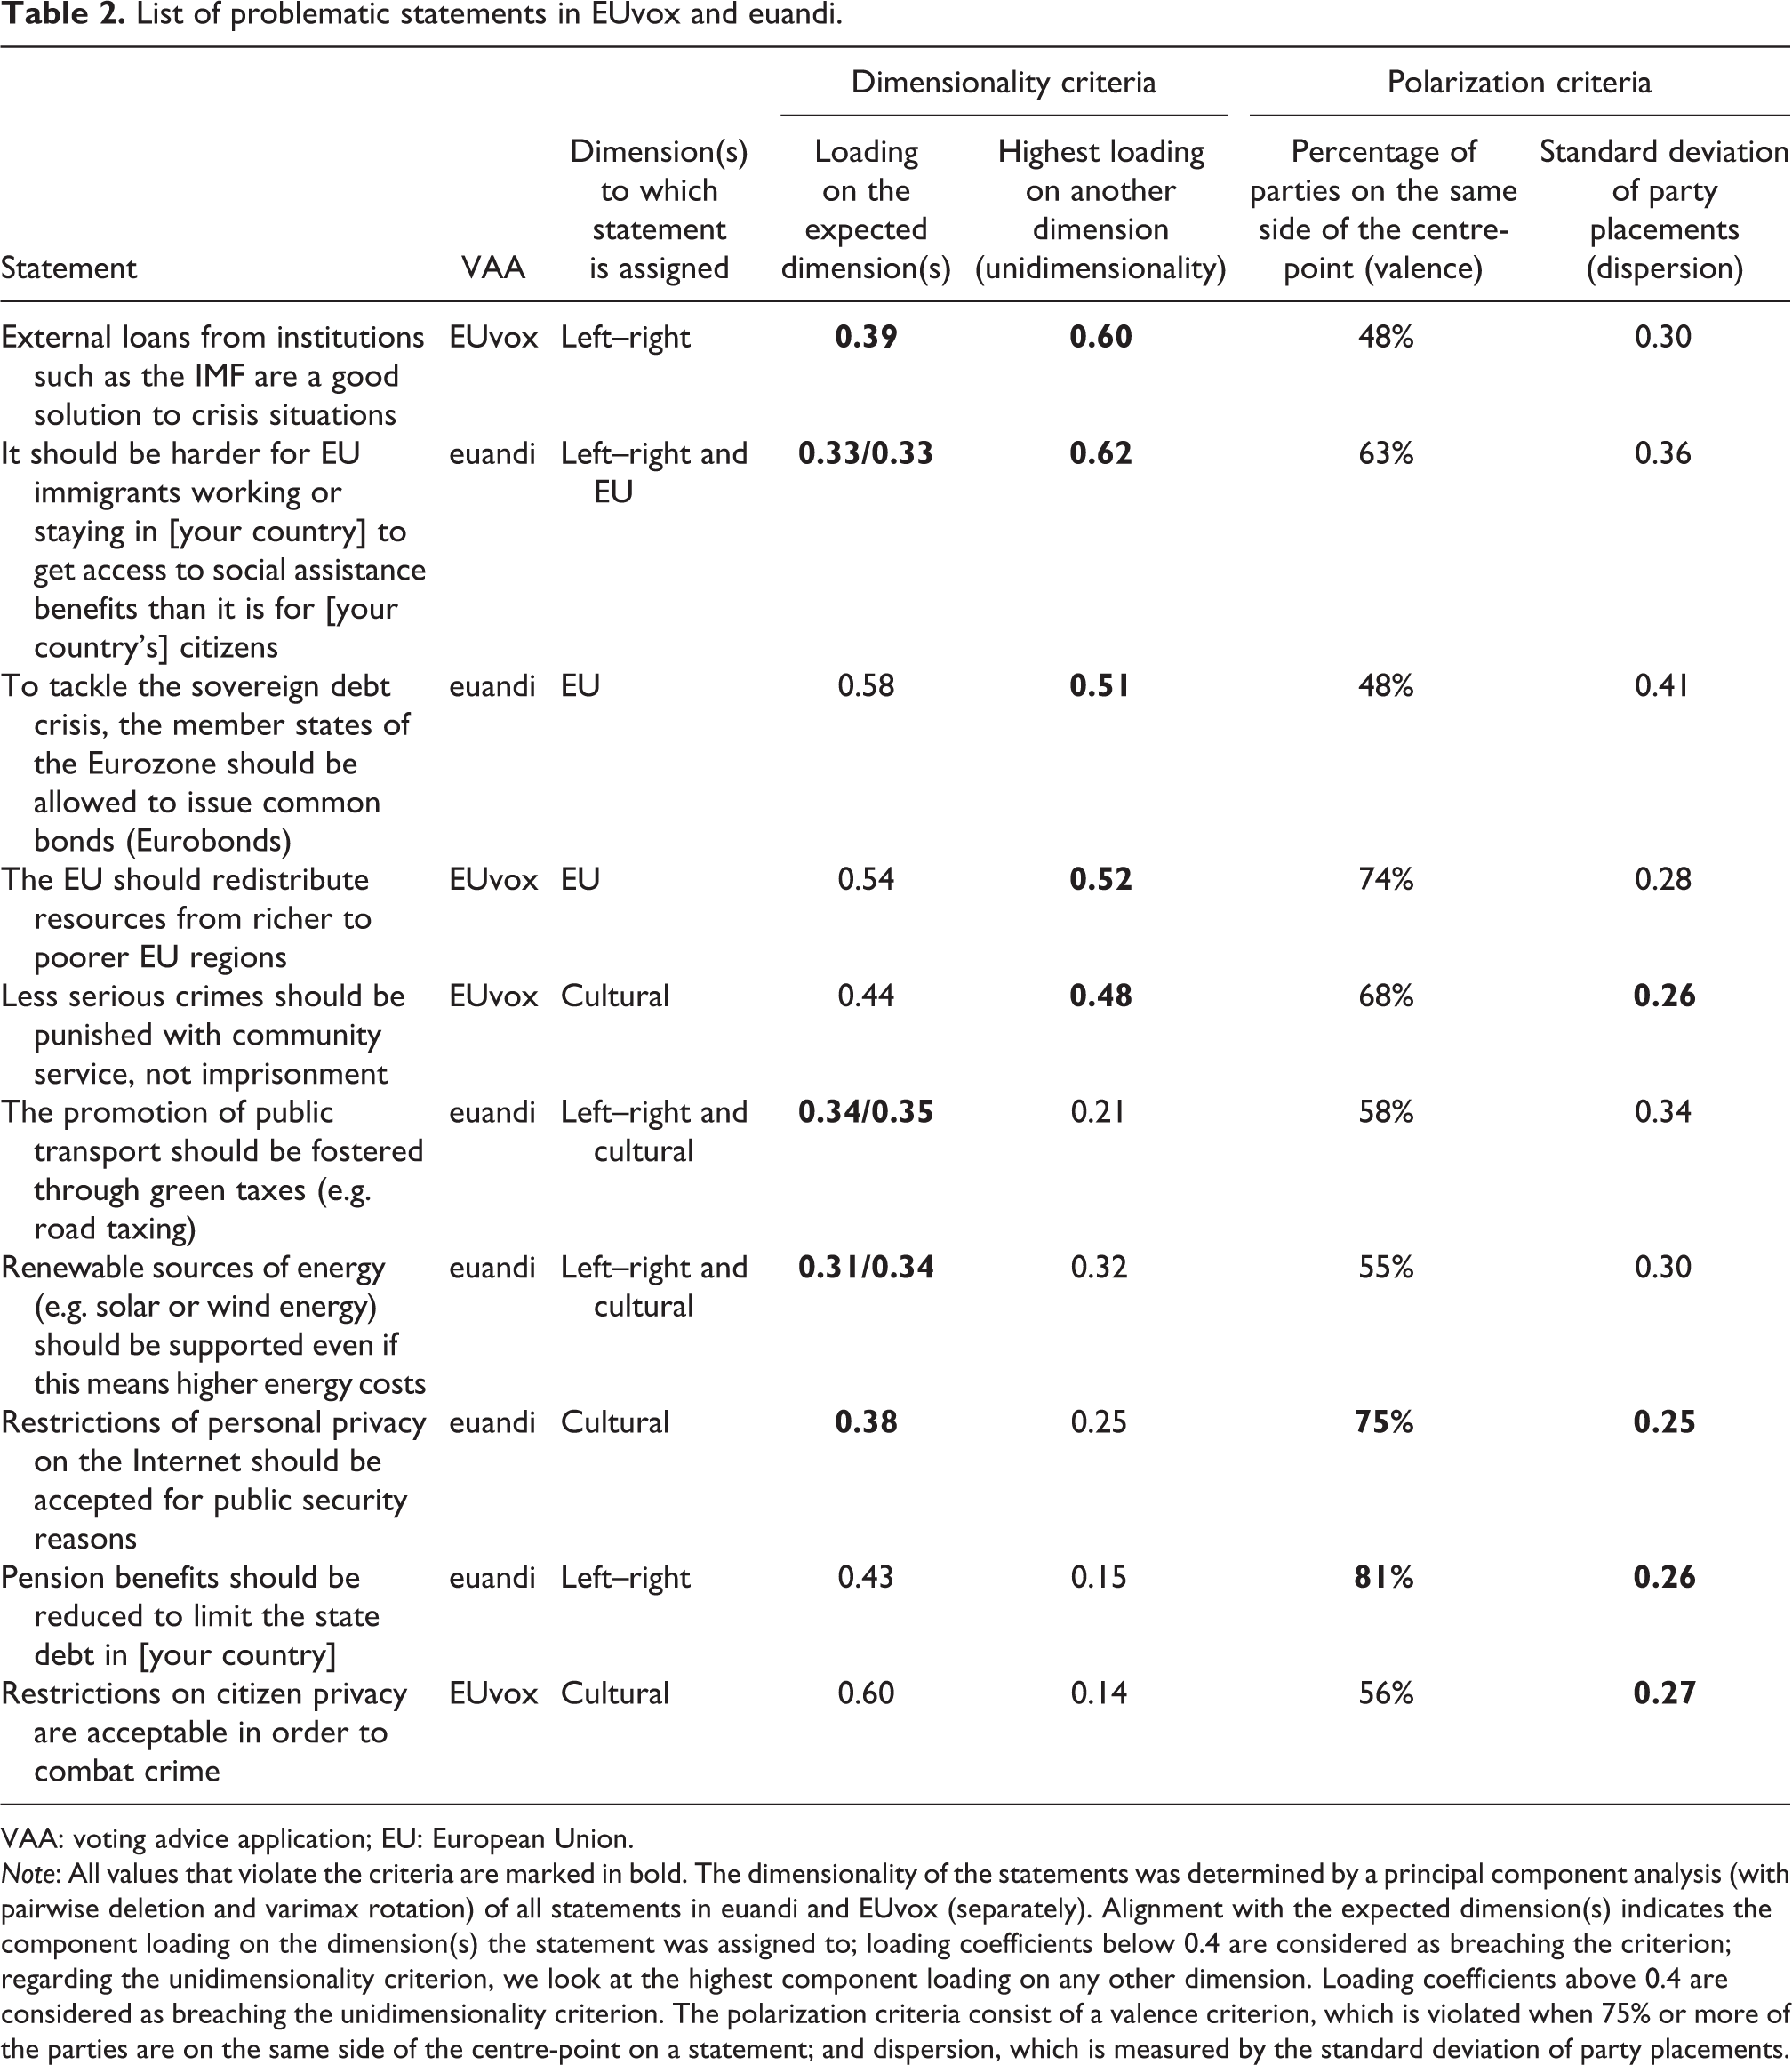
However, this addresses only one part of the empirical puzzle, as it tells nothing about the systematic party placement differences between the two VAAs – most notably on the economic left–right dimension. If all the items successfully measure the same latent concept (while not tapping into any other dimension) and manage to discriminate between the parties sufficiently, it should not matter that the specific content of the statements differs: Dimensional party placements should still be similar. Thus, to uncover what could cause the systematic differences between the two VAAs, we single out statements that we deem to be in violation of these criteria. Table 2 lists all the statements that fail in terms of dimensionality or sufficient polarization between parties. Altogether, we have identified 10 suboptimal statements (6 in euandi and 4 in EUvox) of a total of 47 (27 in euandi and 20 in EUvox).
List of problematic statements in EUvox and euandi.
VAA: voting advice application; EU: European Union.
Note: All values that violate the criteria are marked in bold. The dimensionality of the statements was determined by a principal component analysis (with pairwise deletion and varimax rotation) of all statements in euandi and EUvox (separately). Alignment with the expected dimension(s) indicates the component loading on the dimension(s) the statement was assigned to; loading coefficients below 0.4 are considered as breaching the criterion; regarding the unidimensionality criterion, we look at the highest component loading on any other dimension. Loading coefficients above 0.4 are considered as breaching the unidimensionality criterion. The polarization criteria consist of a valence criterion, which is violated when 75% or more of the parties are on the same side of the centre-point on a statement; and dispersion, which is measured by the standard deviation of party placements.
To evaluate the performance of different statements regarding dimensionality, we ran a principal component analysis (PCA) with pairwise deletion (to avoid losing too many cases due to missing codings) and varimax rotation. In Table 2, we list the component loadings of the statements on the expected dimension(s) and the highest loading on any of the other two components (the loadings on each dimension for all statements in both VAAs are presented in the Online supplemental appendix C). Following the suggestion of Hair et al. (1998), we draw the threshold of a sufficient loading coefficient at 0.4, considering that our sample size is approximately 200. We have, therefore, singled out statements that either have a loading of less than 0.4 on the expected construct, have a loading of 0.4 or more on any of the two other dimensions, or both.
As Table 2 indicates, eight statements (five in euandi and three in EUvox) have problems with dimensionality. Two items are at odds with both sub-criteria by not loading sufficiently on the expected dimension, while showing a significantly higher alignment with another component. The first of these statements proposes that external loans are a good solution to crisis situations – it is assigned to the economic left–right dimension in EUvox. According to PCA, this item aligns better with the EU dimension (component loading 0.60), while falling short on the 0.4 criterion on the left–right dimension (0.39). Another statement that fails in terms of both dimensionality criteria concerns access to welfare benefits of EU immigrants. This euandi statement breaches the unidimensionality criterion already a priori, as it is assigned to left–right and EU dimensions. However, its loadings on the expected constructs are insufficient, whereas it aligns strongly with the items that capture the parties’ cultural liberal-conservative position.
There are six more statements that violate one of the two dimensionality criteria. As for undimensionality, the EUvox statement on whether the EU should redistribute its resources from richer to poorer countries and the euandi statement proposing Eurobonds as an option to solve the debt crisis load sufficiently on the expected EU dimension, but are also attached to the left–right component, as left-wing parties are more prone to agree to such proposals. Somewhat surprisingly, the EUvox cultural dimension statement regarding punishing criminals aligns too strongly with EU issues. In this formulation, only right-populist parties, on average, take the conservative (tougher punishments) position on that issue, which probably causes the violation in terms of unidimensionality, although the wording does not suggest that the statement also measures attitudes towards EU. Three statements do not align sufficiently with any of the three dimensions. Two of these items, both included in euandi, address green/ecological issues. Regarding these items, the unidimensionality criterion was, again, already a priori breached, as they are assigned to both the economic and cultural dimensions. This is a questionable decision, as green issues are usually considered part of the cultural GAL-TAN dimension, and there seems to be no clear reason to also include them in the economic left–right calculation. However, the PCA indicates that the two items do not load sufficiently on either the economic or cultural component. Finally, the euandi statement on Internet privacy restrictions narrowly misses the 0.4 loading coefficient threshold on the cultural dimension, while not aligning with any other construct.
To assess whether statements polarize sufficiently between parties, we lack such widely accepted benchmarks as with dimensionality. Regarding the valence criterion, we follow the approach of De Sio (2010) and De Sio and Weber (2014) who contend that whether a specific political issue in a given context can be considered as positional or valence in its nature, should be determined on empirical grounds, based on the level of support a particular policy currently has among the population. Following the suggestion of De Sio (2010), we drew the line of valence criterion to 75%: If more than 75% of the party sample (which in our study is the population) are on the same side regarding a proposal, we consider that it breaches the valence criterion. As Table 2 reveals, both VAAs have been quite successful in avoiding valence issues: Just two statements (both in euandi) of 47 have more than 75% of the whole party sample on the same side (see the Online supplemental appendix C for the respective percentages of all statements). The most clear-cut case of a valence criterion violation is the euandi left–right dimension statement ‘Pension benefits should be reduced to limit the state debt in [country]’; 81% of the parties that have been coded on that issue completely disagree (56%) or tend to disagree (25%) with the proposal, while only 10% support it. A previously mentioned euandi statement on Internet privacy restrictions also breaches the threshold, as 75.3% of the coded parties are against the proposition and only 12% support it. However, there is a high amount of missing codings (25%) on this statement. If the missing cases are included, the percentage of parties on the ‘against’ side of the scale is much lower. Also considering that on this item the modal category is ‘tend to disagree’, we find that the ‘internet privacy’ statement is actually more problematic in terms of dispersion, not the valence criterion.
As for the condition of sufficient dispersion between parties, we compare the SDs on each statement. Euandi coders have more frequently used complete agreement/disagreement categories, making the average SD higher in euandi (0.35, compared to 0.31 in EUvox). 8 Although we lack a particular benchmark, several items clearly stand out (see the SDs of all statements in the Online supplemental appendix C). Unsurprisingly, the SD of the pension reduction statement is very low (0.26), as most parties are strongly against the proposal. However, the SD of the previously mentioned Internet privacy statement is even lower: 0.25 – the lowest value among the 47 statements. A very similar statement in EUvox (‘Restrictions on citizen privacy are acceptable in order to combat crime’) also has one of the lowest SDs in the whole sample (0.27) and is listed as problematic in terms of dispersion, although it manages to meet all other criteria. Only 3% of the parties in EUvox completely agree with restricting privacy and 14% are completely against this proposition, while 83% of the parties are placed into the three middle categories (no other statement in either VAA has less parties in the complete dis(agreement) categories). Thus, although the Internet privacy issue is highly salient, it is difficult to determine the party positions on the topic. A similar problem is evident with the EUvox statement on punishing criminals. It has an SD of 0.26, 21% of parties have been coded as ‘neutral’ (highest value in the sample) and 79% are in the three middle categories.
To elaborate on the difference between the valence and dispersion criteria, we briefly discuss five other statements – all concerning European integration/EU issues – that come very close to violating the valence criteria, as 72–74% of the parties are on one side of the scale (see the Online supplemental appendix C). Substantively, there is not much difference whether a statement is supported/rejected by 74% or 75% of the party sample, yet the situation regarding these statements is actually different compared to the ones described in the two previous paragraphs. Statements like ‘On foreign policy issues the EU should speak with one voice’ or ‘Overall, EU membership has been a bad thing for (Country)’ divide parties asymmetrically, as most are on the pro-EU side of the continuum, but still invoke polarization. Although fewer in number than the pro-EU camp, there is a considerable amount of parties that take a strong anti-EU stance (i.e. complete (dis)agreement with the proposal). These parties usually belong to the right-populist group, but the average placement of far-left and ECR parties is usually also on the anti-EU side. On the ‘pension reduction’ and ‘internet privacy’ statements, we do not see such systematic polarization, as no party family consistently occupies the more unpopular side (supporting pension cuts and privacy restrictions) of the scale. This difference is reflected in the SDs, which are much higher for these EU statements (see the Online supplemental appendix C). Thus, these statements meet the polarization criteria, although there is a clear majority of parties that are supportive of European integration.
In sum, Table 2 demonstrates that there are problematic statements in both VAAs and on all three dimensions. However, two observations indicate that these flawed items affect mostly the convergence between EUvox and euandi on the left–right dimension. First, there is a clear imbalance between the two VAAs in terms of problematic statements on the left–right dimension: in euandi, there are four, while in EUvox only one left–right item that violates any of the outlined criteria. This suggests that the euandi left–right placements might be more inaccurate, which also corresponds to the observations from the previous section – several parties that are usually perceived to be right-wing are placed as left-wing in euandi. On the cultural dimension, the ratio of problematic statements is 3 in euandi to 2 in EUvox, and on the EU dimension, it is 2 to 1, respectively. Second, the statements that are most gravely in violation of the dimensionality and polarization criteria are all assigned to the economic dimension. Subsequently, we demonstrate how these statements distort party placements depending on party ideology.
Figure 4 displays the average party family placements on the two euandi left–right statements which constitute the most vivid examples of violating the two main criteria we have outlined: dimensionality and polarization. The statement ‘It should be harder for EU immigrants working or staying in (country) to get access to social assistance benefits than it is for (country’s) citizens’ is assigned to both left–right and EU dimensions and supporting this proposal moves the party towards the right and anti-EU poles. However, in reality, the statement aligns best with the liberal-conservative component. Problems with dimensionality seem to derive from the formulation of the statement, as it bundles together too many different ideological attitudes by mentioning the EU, immigrants and social benefits in one sentence. As Figure 4 demonstrates, only the two most conservative and Eurosceptic party groups – right-populists and ECR – are supportive of such measure, thus obtaining a right-wing position on that item. Centre-left, far left, green and liberal (ALDE) parties are gathered into the most leftist quarter of the scale, while centre-right parties are also positioned left-of-centre. The two groups that diverge from their average euandi left–right position most are right-populist (overall left–right mean score of 0.55; mean score on that issue 0.83) and liberals (0.52 and 0.25). It appears that the right-populist’s strong support for such a proposal rather expresses the anti-immigrant and anti-EU views of those parties, while the clearly left-wing stance of ALDE parties probably stems from the socially liberal ideology that is generally supportive of universal rights. This is an example of why it is important that statements do not measure any other latent construct except the one they are supposed to measure. We urge VAA developers to not assign one statement to several ideological dimensions simultaneously and leave multidimensional statements out of the dimensional calculations.
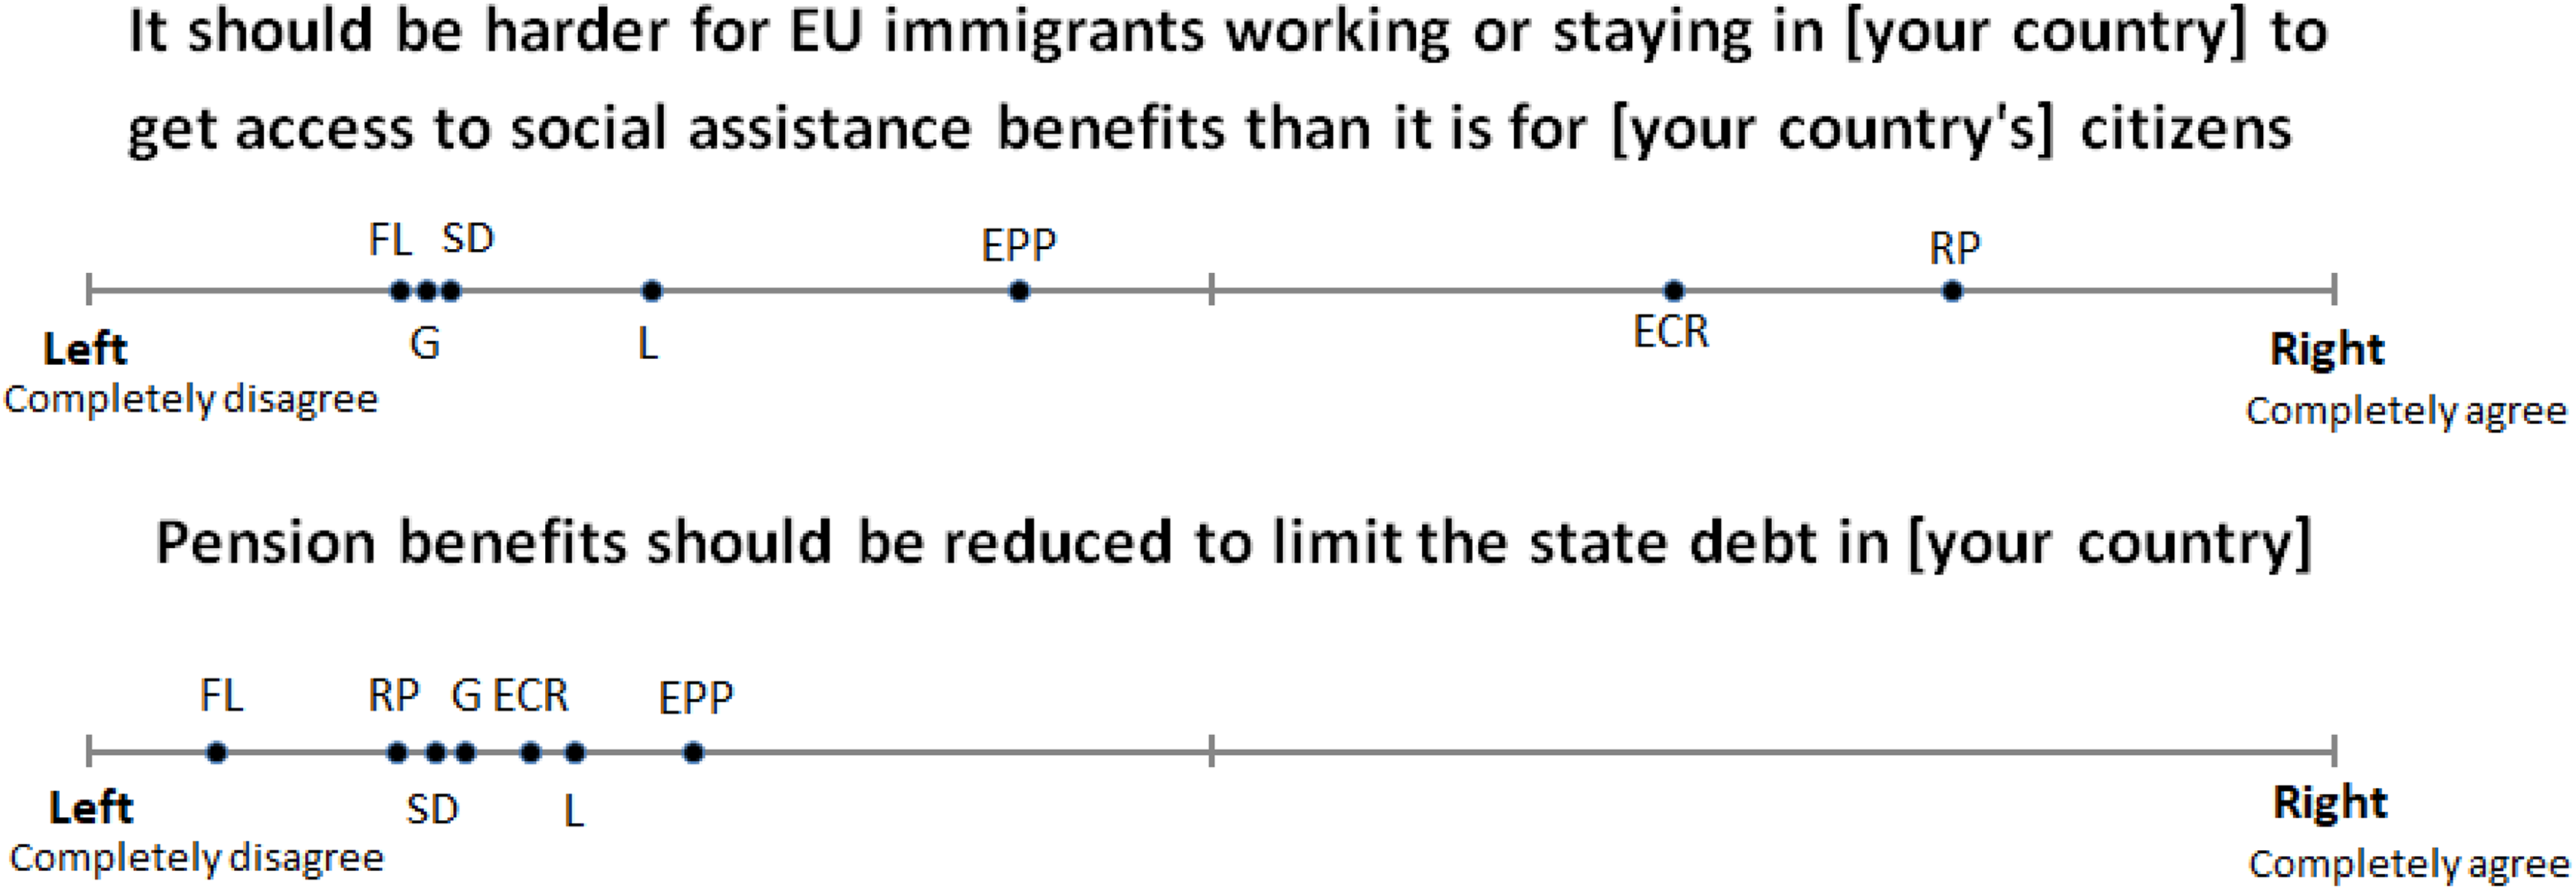
Average party family placements on two problematic euandi left–right statements. Note: FL – far/radical left, G – greens, SD – centre-left, L – liberals (ALDE), EPP – centre-right, ECR – conservatives/eurosceptics and RP – right-populist/far right.
The second statement displayed on Figure 4 demonstrates how breaching the valence criterion can distort party positions. Parties are clearly very reluctant to support pension reductions and all party families are on the left side of the scale. Differentiation between parties is very small, as the most leftist party family (far left) is placed at 0.06, while the most ‘rightist’ group (EPP) is at 0.27. No other statement in either VAA has all seven party families gathered in such a short segment of the continuum. This statement, again, has a stronger distorting effect on the presumably right-wing parties that are pushed significantly towards the left in the composite score. It remains questionable whether all party families have really taken a very similar and leftist stance on the pension issue, or if the statement was simply composed in a suboptimal way. We tend to incline towards the latter option. Possibly, just reversing the statement (propose increasing the pension benefits instead of reducing) could bring out the ideological differences between parties more clearly. In sum, the two statements displayed in Figure 4 significantly distort the placements of especially centre-right (EPP) and liberal (ALDE) parties, pushing them towards the left side of the continuum in euandi calculations.
To test whether problematic/flawed statements are responsible for the divergences between EUvox and euandi party placements, we recalculated all the placements without the items brought out in Table 2. Indeed, the recalculations show a significant increase in convergence between EUvox and euandi placements on the left–right dimension, mostly on the account of presumably right-wing parties moving more to the right in euandi (see the Online supplemental appendix D for the comparison of the initial and modified dimensional calculations). For the whole party sample, the 4% bias has been reduced to 1%, with the difference being statistically insignificant. For centre-right parties, the 9% bias disappears completely, and the divergence of liberal parties is now also much less severe, as only a 5% discrepancy remains, compared to the initial 13. For radical left parties, the 6% bias has decreased to 0 and for the populist right from 13% to 9%. The difference has also decreased for green and centre-left parties, yet not significantly. Moreover, the correlation between EUvox and euandi placements for the whole party sample is now much stronger, as the R 2 has increased to 0.72, compared to the initial 0.61 (see Figure 1). On the cultural and EU dimensions, removing the problematic statements does not cause such significant changes in convergence between the two VAAs. In fact, on the cultural dimension, the difference between the placements increases, although not substantially. The correlation between the placements remains roughly the same on other two dimensions after the recalculation. These results again suggest that the high overlap especially on the cultural dimension owes much to a similarity in the items used to measure the concept, whereas the systematic differences on the left–right placements seem to be mostly the result of some suboptimal statements included in the calculations.
Eventually, there is confusion regarding just one party group on one dimension in terms of which side of the centre-point it should be placed: right-populist parties on the left–right dimension. Even after removing the problematic statements, the average placement of this group remains left-of-centre in EUvox and right-of-centre in euandi, with nearly a 10% gap between the VAAs (see the Online supplemental appendix D). Another very significant difference in party placements that also remains after the recalculations pertains to far-left parties on the EU dimension: in euandi, these parties are now placed as even more Eurosceptic (0.26), while in EUvox, the average position is 17% more towards the centre-point of the scale (0.43), indicating just a mildly negative attitude towards the EU. The similarity between these two party groups is that both seem to have an issue-based approach towards the respective dimensions. For example, populist right parties support increasing the taxation on bank and stock market gains and relaxing EU austerity policy – leftist policy proposals. On the other hand, they also support cutting government spending and reducing the number of public sector employees, while being against maintaining social programmes at the cost of higher taxes – all rightist policy stances. This indicates that right-populist parties lack a coherent economic policy and seem to be approaching each issue separately, aiming to resonate with public opinion. This finding conforms to some previous research that has shown how populist right parties rely on a strategy of issue ‘blurring’ (see Rovny, 2013) to appeal to as many voters as possible (de Lange, 2007). As for left-radical parties, their issue-based approach to European integration appears to be more ideologically motivated and does not necessarily correspond to the public opinion. For example, these parties are firmly against common EU foreign and defence policies, while supporting distribution of resources from richer to poorer EU regions and the workers’ right to work in other EU countries. Thus, it is evident that because of such issue-based approach, it is difficult to place right-populist parties on the left–right and far-left parties on the EU dimension, using VAA party placement methodology.
Discussion
The results presented in this article reveal that, overall, the two cross-national VAAs – EUvox and euandi – have managed to place more than 200 parties from 28 EU countries in a highly similar way on each of the three main issue-dimensions structuring European politics. However, we also found some systematic divergence between the two applications, which is mostly evident on the economic left–right dimension and particularly with regard to right-wing parties. We demonstrated that such divergences are largely caused by suboptimal statements that violate the dimensionality criteria or do not manage to polarize sufficiently between parties. Excluding these problematic statements significantly improves the party placement convergence. This indicates that if statements are selected and coded appropriately, different VAAs place most of the parties in the European political space consistently, even if the specific content of the issue-statements differs. The only notable divergences in placement that remain even after removing the problematic items from the calculations pertain to right-populist parties on the left–right and far-left parties on the pro-anti-EU dimension. Due to the issue-based approach of these parties, it is genuinely difficult to place them on these dimensions of political competition, suggesting that, in this case, VAA developers are not to blame for the divergence of party positioning.
These findings corroborate with Germann et al. (2015) and Germann and Mendez (2016) who advocate for the use of dynamic scale validation based on the early user data to improve the quality of VAA spatial maps after the initial tool launch. However, regarding cross-national VAAs, we would suggest that the scales are validated before the application is launched to the wider public, using the party placements on all issue-statements. Validating national VAAs in such way would not be feasible due to the small number of parties, but with data of over 200 European parties, one could implement basic statistical procedures to detect items that do not meet the criteria and distort the scales. It would have been possible to exclude the problematic statements that we singled out in this article, based on party-level data. Regarding cross-national comparison, it would be better if the validation is performed on the entire VAA party data, not separately in each country.
Finally, our findings show that VAAs should not only be considered as educational tools, but also as a legitimate and accurate method of party placement on the underlying ideological dimensions structuring party systems. EUvox and euandi have provided a reliable estimate of where parties stand in a cross-national EU-wide political space. Both VAAs have managed to position most of the parties where they are usually perceived to be, in terms of economic left–right standpoints, cultural/moral values and pro/anti-EU stances. To provide additional proof of the accuracy of these party placements, future research could compare EUvox and euandi positions with other more established measures of party placements, such as expert surveys, different methods of manifesto coding, public opinion data aggregation and parliamentary roll-call votes (see Krouwel, 2012). As the VAA method is clearly distinct from all other approaches, it can provide a valuable addition into the debate over the validity and reliability of different party positioning methods. We see no reason for VAAs not to be considered among the most prominent methodologies to estimate party positions and as measures to analyse party competition in multidimensional issue-spaces.
Supplemental Material
Supplemental Material, sj-docx-1-ppq-10.1177_1354068818812209 - Mapping parties in a multidimensional European political space: A comparative study of the EUvox and euandi party position data sets
Supplemental Material, sj-docx-1-ppq-10.1177_1354068818812209 for Mapping parties in a multidimensional European political space: A comparative study of the EUvox and euandi party position data sets by Andres Reiljan, Yordan Kutiyski and André Krouwel in Party Politics
Supplemental Material
Supplemental Material, sj-pdf-1-ppq-10.1177_1354068818812209 - Mapping parties in a multidimensional European political space: A comparative study of the EUvox and euandi party position data sets
Supplemental Material, sj-pdf-1-ppq-10.1177_1354068818812209 for Mapping parties in a multidimensional European political space: A comparative study of the EUvox and euandi party position data sets by Andres Reiljan, Yordan Kutiyski and André Krouwel in Party Politics
Supplemental Material
Supplemental Material, sj-pdf-2-ppq-10.1177_1354068818812209 - Mapping parties in a multidimensional European political space: A comparative study of the EUvox and euandi party position data sets
Supplemental Material, sj-pdf-2-ppq-10.1177_1354068818812209 for Mapping parties in a multidimensional European political space: A comparative study of the EUvox and euandi party position data sets by Andres Reiljan, Yordan Kutiyski and André Krouwel in Party Politics
Supplemental Material
Supplemental Material, sj-pdf-3-ppq-10.1177_1354068818812209 - Mapping parties in a multidimensional European political space: A comparative study of the EUvox and euandi party position data sets
Supplemental Material, sj-pdf-3-ppq-10.1177_1354068818812209 for Mapping parties in a multidimensional European political space: A comparative study of the EUvox and euandi party position data sets by Andres Reiljan, Yordan Kutiyski and André Krouwel in Party Politics
Footnotes
Declaration of Conflicting Interests
The authors declared the following potential conflicts of interest with respect to the research, authorship, and/or publication of this article: Yordan Kutiyski and Andre Krouwel were among the developers of EUvox, while Andres Reiljan was a coder of party positions in both EUvox and EUandI.
Funding
The authors received no financial support for the research, authorship, and/or publication of this article.
Supplemental Material
Supplemental material for this article is available online.
Notes
References
Supplementary Material
Please find the following supplemental material available below.
For Open Access articles published under a Creative Commons License, all supplemental material carries the same license as the article it is associated with.
For non-Open Access articles published, all supplemental material carries a non-exclusive license, and permission requests for re-use of supplemental material or any part of supplemental material shall be sent directly to the copyright owner as specified in the copyright notice associated with the article.