
Abstract
Background:
MS imaging studies have demonstrated an ependymal “surface-in” distribution of white matter damage. The origin of this effect and how it impacts myelinated axons in people with MS (PwMS) is poorly understood.
Objectives:
To investigate (1) whether there is clear evidence of tract-wise, periventricular damage, based on fractional anisotropy, mean diffusivity, axonal water fraction (AWF) and myelin volume fraction (MVF), in PwMS, (2) if such tissue damage is associated with T1-“black-hole” (T1-BH) and/or non-BH lesions, and (3) if periventricular quantitative MRI abnormalities are correlated with lateral ventricle (LV) and choroid plexus (CP) enlargement.
Methods:
We applied structural, MT-weighted, and multi-shell diffusion MRI in healthy controls and PwMS to quantify periventricular gradient damage to axons and myelin. We also evaluated the correlation between such gradient damage and both non-BH and T1-BH lesion loads, and brain volume changes.
Results:
Clear periventricular gradients exist in both AWF and MVF measures in the Association and Projection Tracts. They are strongly correlated with T1-BH lesion load, and with LV and CP enlargement in PwMS with EDSS > 2.
Conclusions:
Tract-specific, periventricular gradients in PwMS exist prominently in AWF and MVF, are strongly associated with T1-BH lesion loads, and correlate with LV and CP enlargement.
Introduction
MS is an inflammatory disease partially characterized by myelin breakdown, often resulting in the formation of characteristic white matter (WM) lesions. Such lesions generally have a higher rate of occurrence in proximity to the lateral ventricles (LV). 1 Recent studies have also revealed more severe normal appearing white matter (NAWM) damage in periventricular regions. 1 Although the precise cause of this regional damage is unknown, post-mortem histopathology evidence suggests that soluble, toxic, and proinflammatory cytokines may enter the cerebrospinal fluid (CSF) via the choroid plexus (CP). 1 These inflammatory factors then may release due to meningeal and ependymal inflammation, possibly contributing to inhibited remyelination and tissue repair mechanisms. 2
An MS-specific, ependymal “surface-in” distribution of WM abnormality has previously been detected non-invasively with MRI using magnetization transfer ratio (MTR) imaging3–6 and T1 relaxometry. 7 Related work has also evaluated the distribution of WM lesions in periventricular bands, showing CP enlargement is associated with future periventricular neurodegeneration, as indicated by atrophied T2-lesion volume. 8 A comparatively smaller number of studies have applied scalar diffusion-derived markers to study MS periventricular gradients.9–11 Diffusion-weighted MRI (DWI) techniques offer additional insights into axonal integrity. 12 For example, diffusion tensor imaging (DTI) can be applied to measure fractional anisotropy (FA) and mean diffusivity (MD) in periventricular WM. Reductions in FA and increases in MD may indicate reduced axonal structural integrity. 13
However, a major limitation of existing DTI studies of MS periventricular WM damage is that they have not accounted for the influence of microstructure, including crossing and splaying fibers. 14 An alternative to DTI is Neurite Orientation Dispersion and Density Imaging (NODDI). NODDI models water molecule diffusion in three tissue compartments: intracellular (restricted diffusion), extracellular (hindered diffusion), and CSF (free diffusion). 15 Compared to DTI, NODDI is less influenced by fiber orientation distributions and more specific as a biophysical model of brain WM tissue microstructure. 12 Moreover, axonal water fraction (AWF) can be derived from NODDI to provide estimates of axonal loss in MS. 16 In combination, MTR and AWF provide a measure of myelin volume fraction (MVF). 17
In this work we applied, for the first time, AWF and MVF MRI measurements to evaluate WM damage in periventricular bands of relapsing and progressive MS participants. We leveraged the NODDI model 15 to evaluate extra-lesional, NAWM properties in major WM Fiber Tracts of people with MS (PwMS) and compared the NODDI results to those derived from DTI. We further applied segmentation of T1-hypointense “black-hole” (T1-BH) lesions to study their influence on periventricular band-wise damage. T1-BH lesions are commonly applied as radiological markers of irreversible tissue damage with loss of myelin and axons. 12 By comparison, early T2-hyperintense (non-BH) lesions often exhibit demyelination with relatively preserved axonal content. 12
Our particular aims were to investigate (1) whether there is clear evidence of tract-wise periventricular band-wise damage, based on FA, MD, AWF, and MVF, in PwMS, (2) if such tissue damage is associated with non-BH and/or T1-BH lesions, and (3) if periventricular quantitative MRI (qMRI) abnormalities are correlated with WM and gray matter (GM) atrophy and/or LV and CP enlargement.
Methods
Participants
Participants in our study were retrospectively selected from a collaborative study between McGill University and Western University. Exclusion criteria included incomplete scans and MRI artifacts. Demographics are summarized in Table 1.
Demographic and clinical characterization of study participants.
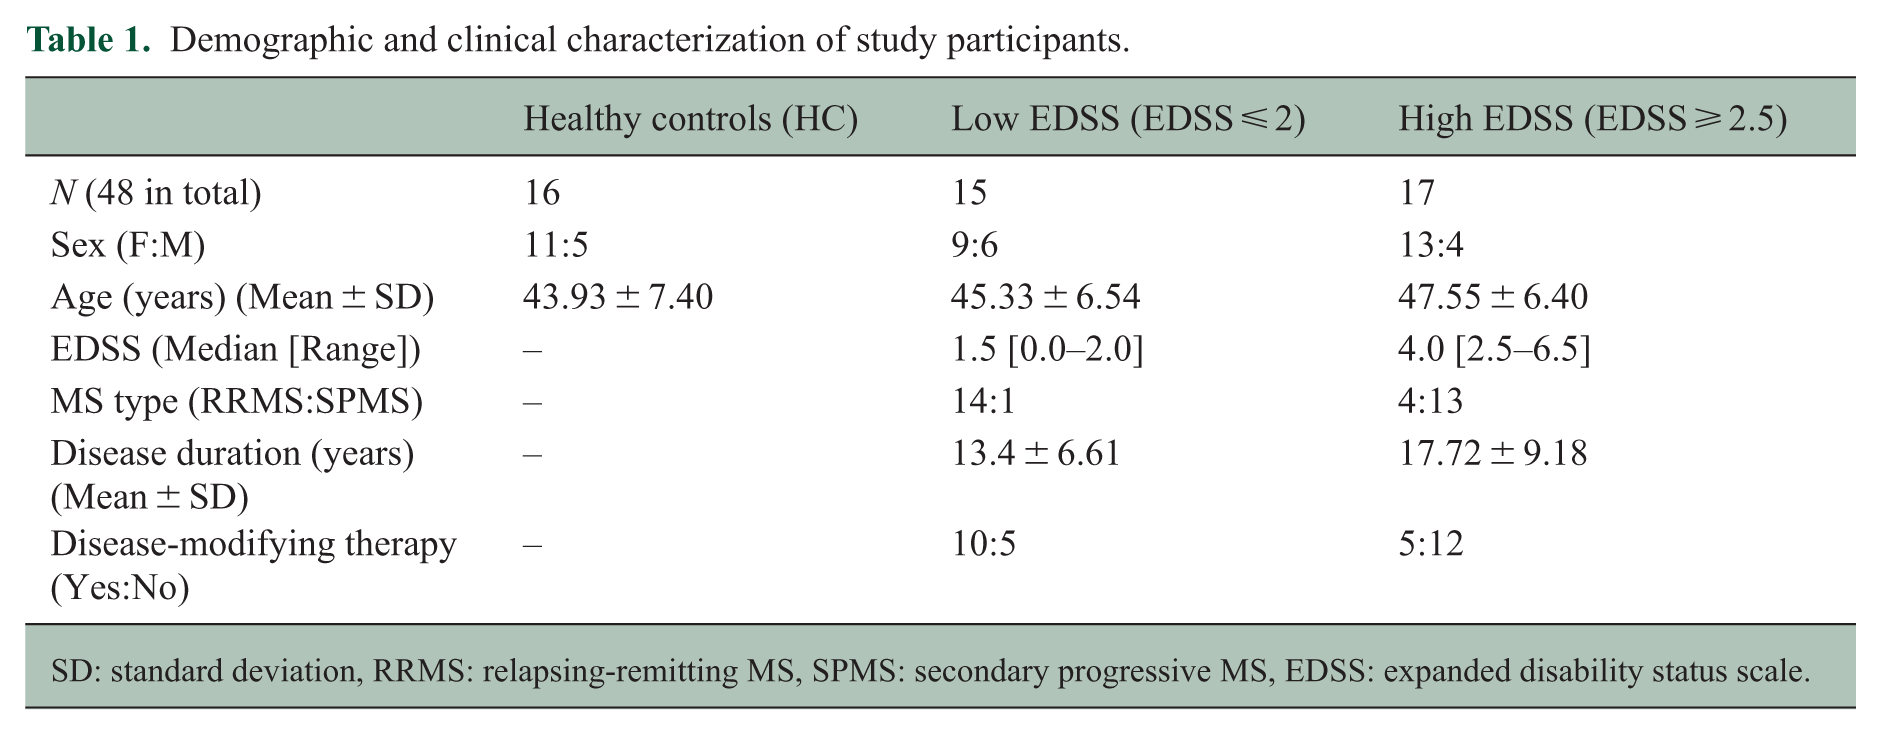
SD: standard deviation, RRMS: relapsing-remitting MS, SPMS: secondary progressive MS, EDSS: expanded disability status scale.
All PwMS (N = 32) were diagnosed according to the 2010 McDonald criteria as Relapsing-Remitting (RR) or Secondary Progressive (SP) and assessed using the Expanded Disability Status Scale (EDSS). Healthy Controls (HC) (N = 16) were matched to PwMS according to age, sex, and education, with no previous history of neurological disease. The study was approved by the local ethics committee, and each participant gave written informed consent.
For the purpose of stratified analyses, all PwMS were classified into one of two groups: Low EDSS (EDSS ⩽ 2), meaning at most, “minimal disability in one functional system,” and High EDSS (EDSS ⩾ 2.5), meaning at minimum, “mild disability in one functional system or minimal disability in two functional systems.” 18 This cutoff was selected to have PwMS with minimal disability in the Low EDSS group and create approximately equivalent group sizes. The Low EDSS participants were predominantly RR (14RR:1SP), while the High EDSS participants were predominantly SP (4RR:13SP).
MRI acquisition
All images were acquired on a 3T Prisma Siemens MRI System (Erlangen, Germany) with a 32-channel head coil. The MRI protocol included: (1) a standard 3D T1-weighted magnetization-prepared 2 rapid acquisition gradient echo (MP2RAGE) acquisition (1 mm3 resolution, TR/TE/FA1, FA2/TI1, TI2: 5000 ms/2.98 ms/4°, 5°/700 ms, 2500 ms), (2) a 3D fluid-attenuated inversion recovery (FLAIR) sequence (1 mm3 resolution, TR/TE/TI/FA: 6000 ms/356 ms/2200 ms/120°), (3) MT imaging with two spoiled gradient echo acquisitions, consecutively acquired with and without an MT saturation pulse (1 mm3 resolution, TR/TE/FA: 36 ms/3.86 ms/10°; MT preparation pulse: FA 500°, offset frequency + 1500 Hz, pulse width 15 ms), and (4) a multi-shell DWI sequence (2 mm3 resolution, TR/TE/FA: 2800 ms/66.8 ms/ 90°, 10 directions at b = 0, 26 directions at b = 1000, 104 directions at b = 2000 s/mm2).
Image processing
Uniform contrast T1-w brain images were skull-stripped using FSL-BET 19 and N4 bias field corrected using ANTs. 20 FLAIR images were pre-processed and co-registered to the T1-w brain image using SPM12. 21 Tissue and WM lesion segmentations were carried out on the T1-w and co-registered FLAIR images, respectively, using SAMSEG 22 and LST: Lesion Segmentation Tool’s Lesion Growth Algorithm (LST-LGA). 21 The two lesion segmentations were additively combined to decrease the likelihood of unidentified lesions, leveraging SAMSEG for higher sensitivity and LST-LGA for higher precision, 23 increasing the overall sensitivity of the lesion segmentations.
SAMSEG was applied to segment the T1-w image, providing GM, WM, CP, CSF, and ventricular volumes. The WM, GM, and lesion segmentations were summed to calculate total brain volume (TBV) and additionally summed with the CSF mask to calculate intracranial volume (ICV). 24 This is further described in the Supplementary Document.
Lesion masks were separated into two types: T1-BH and non-BH. 12 Specifically, for each PwMS, lesion voxels with signal intensities below the median cortical GM intensity in a T1-w image were classified as T1-BH. Otherwise, they were classified as non-BH.
Using the lateral and third ventricles as reference tissue boundaries, 11 geodesic band maps projecting away from the ventricles were created using NIST-MNI’s FALCON. 25 Bands were first created at 1 mm distance increments from the ventricles, based on the T1-w 1 mm3 structural image in the native space of each participant. These bands were then downsampled to 2 mm distance increments to be directly compatible with the DWI 2 mm3 images. The first 12 periventricular bands were extracted for each participant. To minimize partial volume effects (PVE) in proximity to the ventricles, the first band (0–2 mm immediately surrounding the ventricles) was excluded from all analyses. The included bands were, effectively, 2–24 mm away from the ventricles along geodesic boundaries (Figure 1(a)).
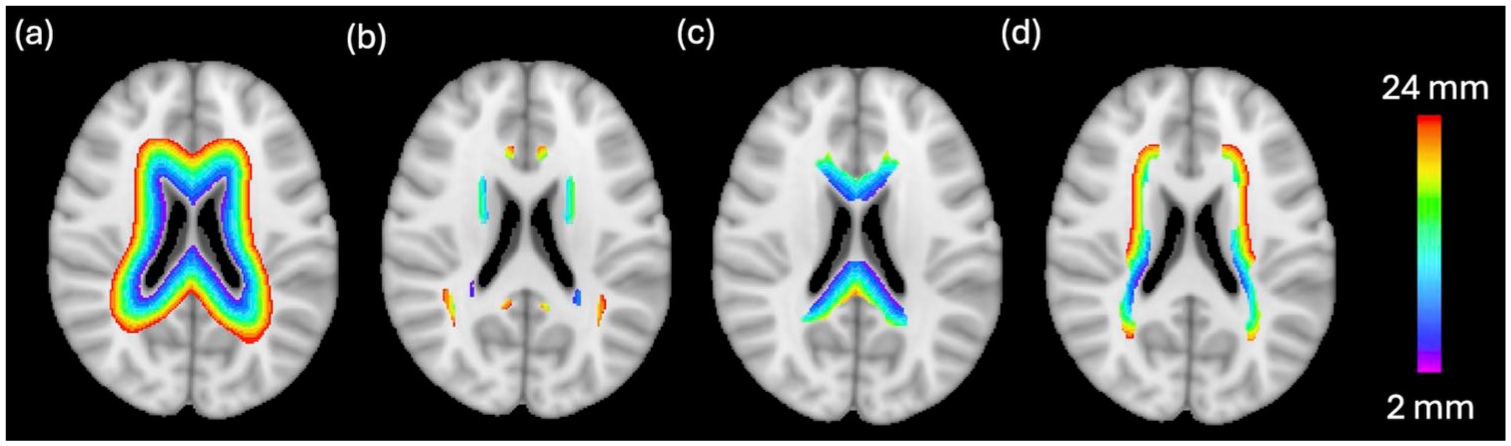
(a) Periventricular bands overlayed on the MNI 152 T1-w 2 mm3 brain in a single axial brain slice. (b)–(d) show the periventricular bands that exist in the JHU White Matter Fiber Tract labels for the (b) Association, (c) Commissural and (d) Projection Fiber Tract Groups. The bands start 2 mm away from the ventricles (purple) and extend to 24 mm away from the ventricles (red).
To eliminate PVE resulting from the presence of lesions in the NAWM, a 2 mm perilesional band was additionally excluded from the NAWM mask for each participant. 5
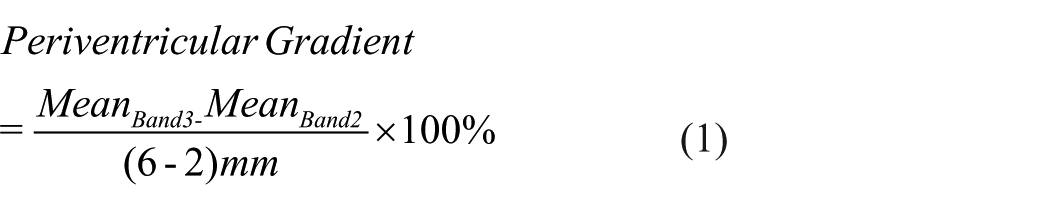
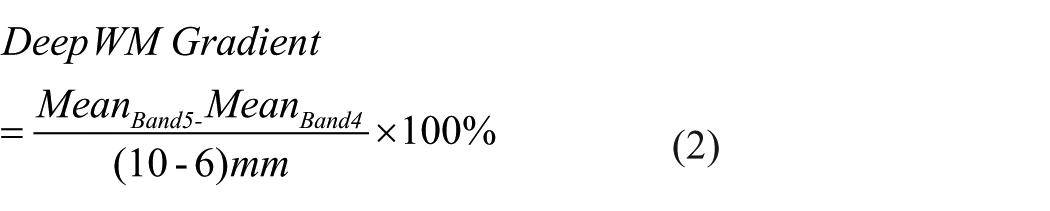
In accordance with previous literature,4,5 two gradients were defined: (1) Periventricular Gradients (bands 2–3) and (2) Deep WM Gradients (bands 4–5), defined by equations (1) and (2) below. These gradients were spatially 2–6 mm and 6–10 mm away from the ventricles, respectively.
DWI data were denoised using the Marchenko-Pastur PCA algorithm, followed by Gibbs ringing removal with DIPY.26,27 DIPY was further applied with the DWI data to produce FA and MD maps. 27 The AMICO NODDI toolbox 28 was next applied to produce maps of intracellular volume fraction (ICVF) and isotropic volume fraction (ISOVF). AWF maps were calculated using fslmaths 29 following equation (3): 16

The 48 Johns Hopkins University (JHU) WM tract labels in MNI T1-w 2 mm3 space (https://identifiers.org/neurovault.image:1408) were then grouped into binary masks corresponding to the Association, Commissural, and Projection Tract Groups 33 (Supplementary Table S1 and Figure 1(b)-(d)). This allowed comparison of microstructural MRI parameters of NAWM in specific JHU WM Tracts. To perform statistical comparisons of band-wise FA, MD, AWF, and MVF values between HC and PwMS, all images were registered to the native, DWI 2 mm3 space using a pairwise registration with ANTs. This was repeated to bring all images into MNI space.
Statistical analysis
All statistical analyses were performed in DWI 2 mm3 native space. Binary masks for all WM regions of interest (ROIs) were applied to measure the mean and standard deviation of FA, MD, AWF, and MVF in non-zero voxels for every participant. ROIs included the NAWM Tracts in each periventricular band. Z-scores were calculated to normalize the qMRI metrics of PwMS to those of HC.
Between-group differences for each qMRI metric, structural volume (%ICV), and lesion load were assessed with a Student’s t-test or Mann–Whitney U-test (if not normally distributed) and Cohen’s d. This was repeated within each band, Tract group and gradient region.
Pearson’s correlation coefficient was used to test for relationships between (1) the Z-score of each metric and non-BH and T1-BH lesion load and (2) the Z-score of each metric in Periventricular and Deep WM Gradients and each structural volume. This was repeated for the Low and High EDSS groups. To account for multiple comparisons, the Benjamini–Hochberg False Discovery Rate (FDR) approach was applied, considering q < 0.05 as significant.
Results
Between-group differences in quantitative MRI metrics in specific WM bands and tracts
In accordance with previous literature,10,34 we hypothesized AWF, MVF, and FA would be decreased in periventricular NAWM of PwMS compared to HC. We also hypothesized MD would be increased in periventricular NAWM of PwMS compared to HC. Based on previous studies, we expected larger evidence of WM damage closer to the ventricles.
Across all geodesic bands and tracts, NAWM AWF of PwMS was significantly reduced compared to the corresponding AWF of HC (at least q < 0.01 for both MS groups). The same was true for MVF only in the High EDSS participants (q < 0.01).
The periventricular NAWM MVF of Low EDSS participants was not as significantly impacted. For example, NAWM MVF in the Low EDSS cohort was only significantly lower than that of controls in bands 2 (q < 0.01), 4 and 5 (q < 0.05) of the Association Tracts, bands 2–4, 7 and 9 (q < 0.05) of the Commissural Tracts, and bands 2–3 (q < 0.01) and 4–5 (q < 0.05) for the Projection Tracts.
NAWM FA of Low EDSS participants was significantly lower than corresponding FA of controls in all bands of the Association and Projection Tracts, and in bands 3–9 of the Commissural Tracts. NAWM FA of High EDSS participants was significantly lower than corresponding FA of controls only in bands 2–7 and 11–12 of the Association Tracts, bands 2–5 and 9–12 of the Projection Tracts, and in all bands of the Commissural Tracts. NAWM MD of PwMS was significantly elevated compared to the corresponding WM MD of HC in all Tracts.
In the Association and Projection Tracts, AWF and MVF were lower in proximity to the ventricles. In deep WM, AWF and MVF increased. MD was found to be higher in proximity to the ventricles, as expected. MD decreased in deep WM. FA was higher closer to the ventricles and decreased in deeper WM.
Figure 2 shows qMRI measures in NAWM in all bands and tracts. Supplementary Figure S1 shows the Z-score of each measure with respect to HC.
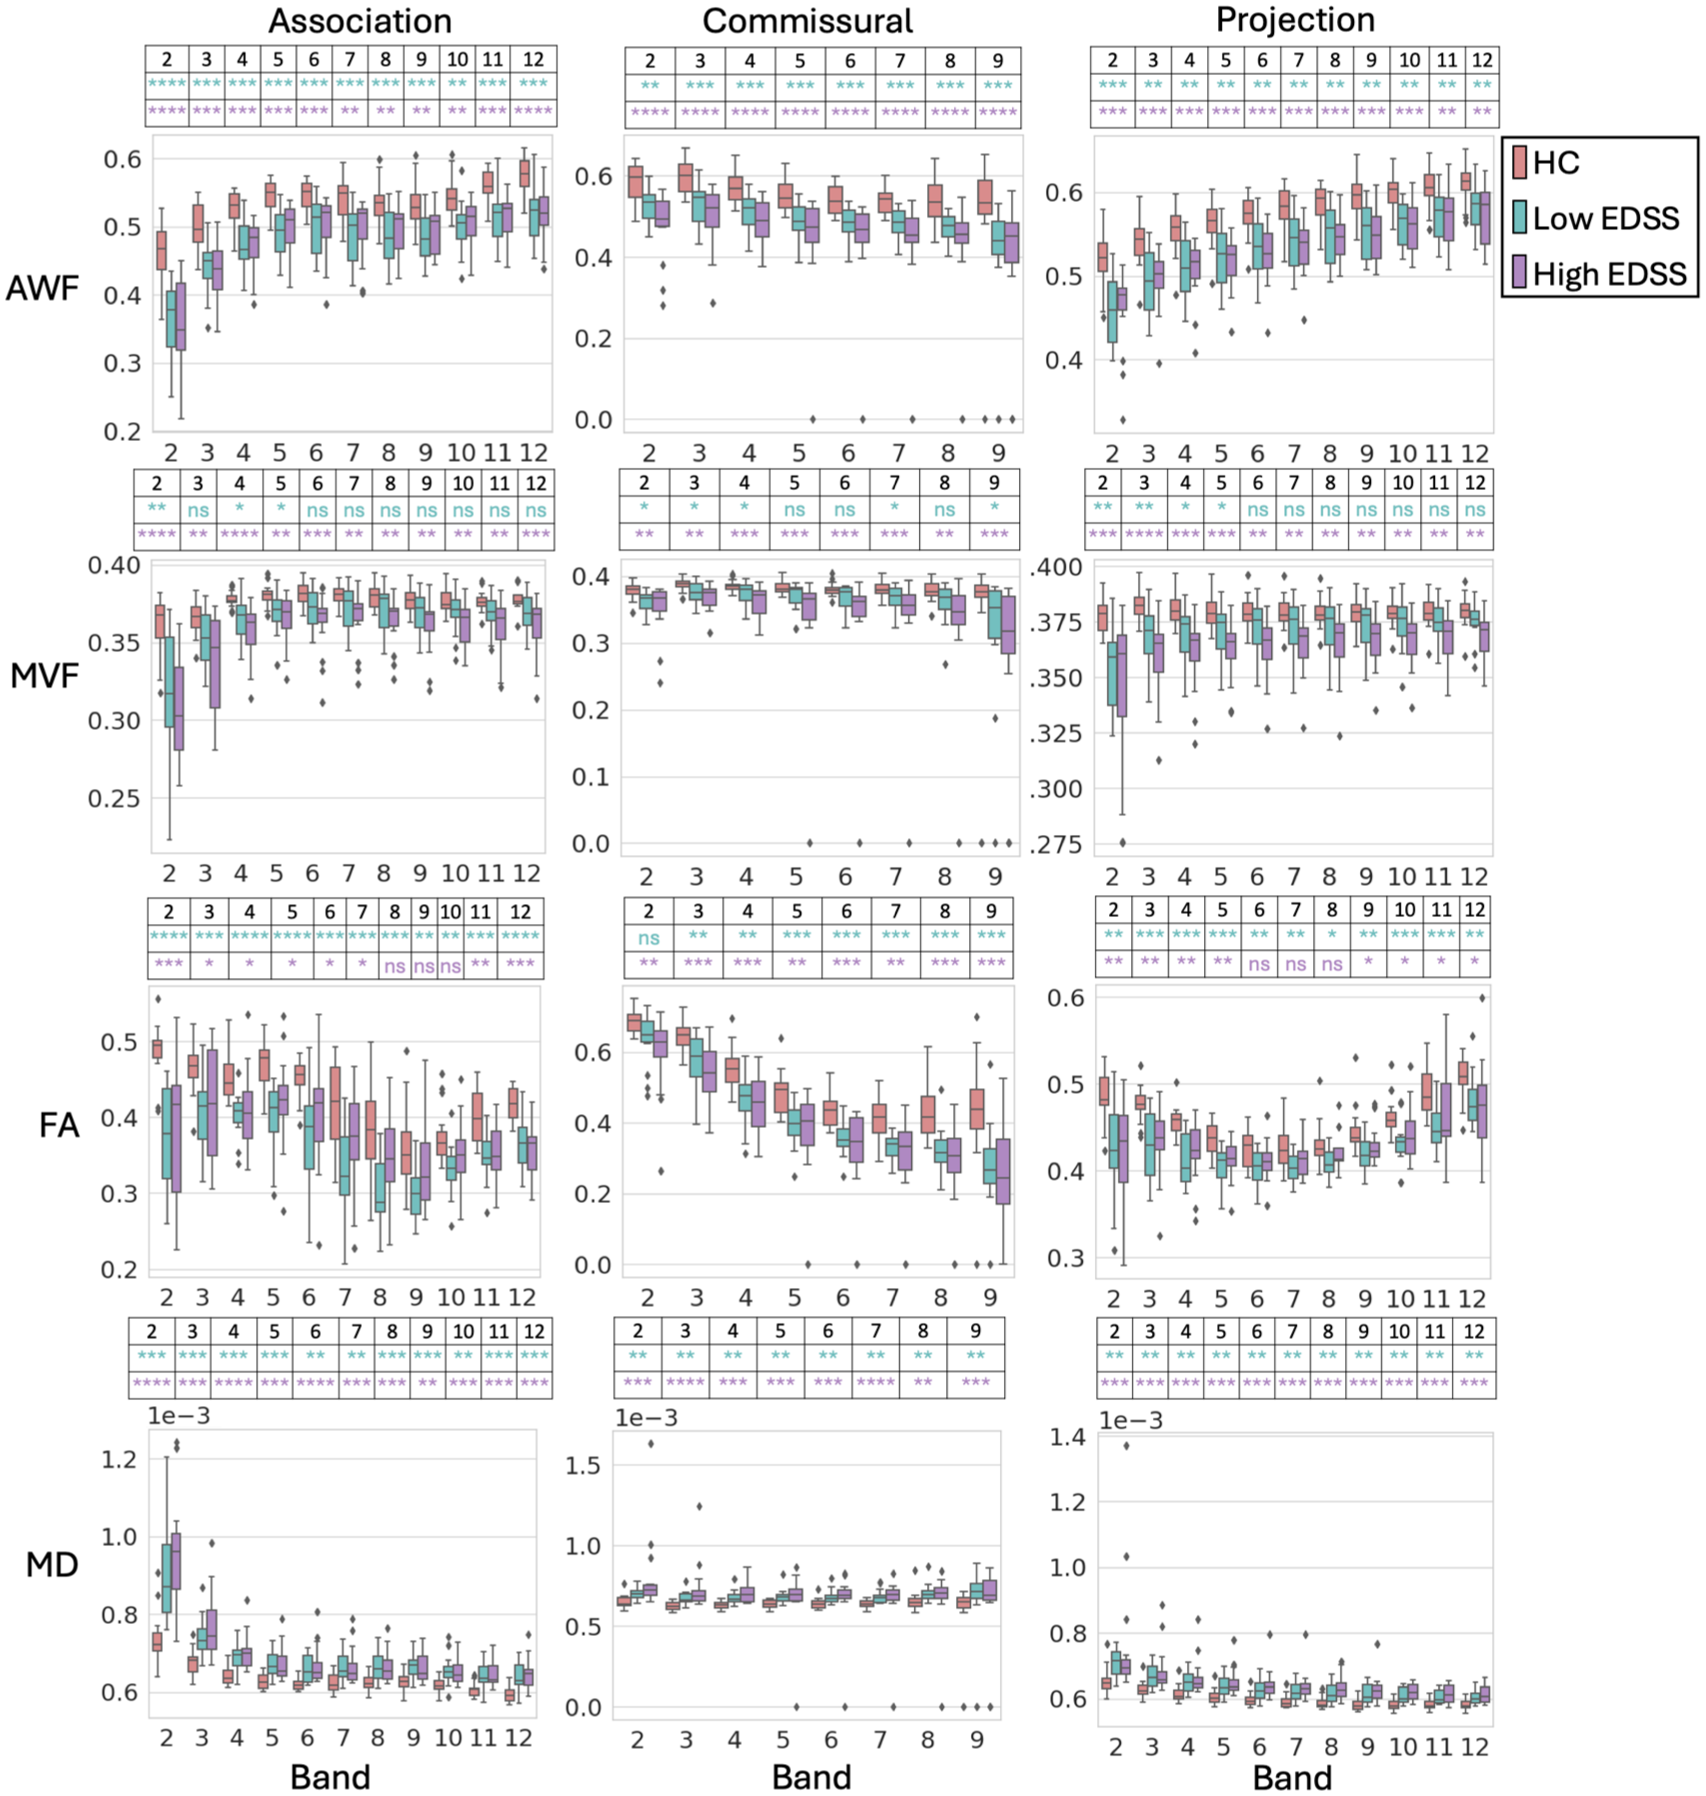
AWF, MVF, FA, and MD in the NAWM of the Association, Commissural, and Projection tracts in periventricular bands. Error bars represent the 95% confidence interval. Diamonds represent outliers. FDR corrections were carried out separately for each of the 24 comparisons: separately for HC versus Low and HC versus High comparisons, separately in each of the three Tract groups, and separately in each of the four MRI-derived metrics. The asterisks show the significance of the FDR-adjusted p-values (q) for the HC versus Low EDSS (turquoise) and for the HC versus High EDSS (purple). ns for q ≥ 0.05, *for q < 0.05, ** for q < 0.01, *** q < 0.001, **** q < 0.0001. Bands 10-12 were excluded from investigation of the Commissural Tracts as they included negligible voxels.
Tract-wise evidence of microstructural damage
Figure 3 displays axial views of tract-wise microstructural damage. For all NAWM tracts, Z-scores were visually reduced in the High EDSS group compared to the Low EDSS group for AWF, MVF, and FA measures. MD-based Z-scores were visually elevated in the High EDSS group compared to the Low EDSS group.
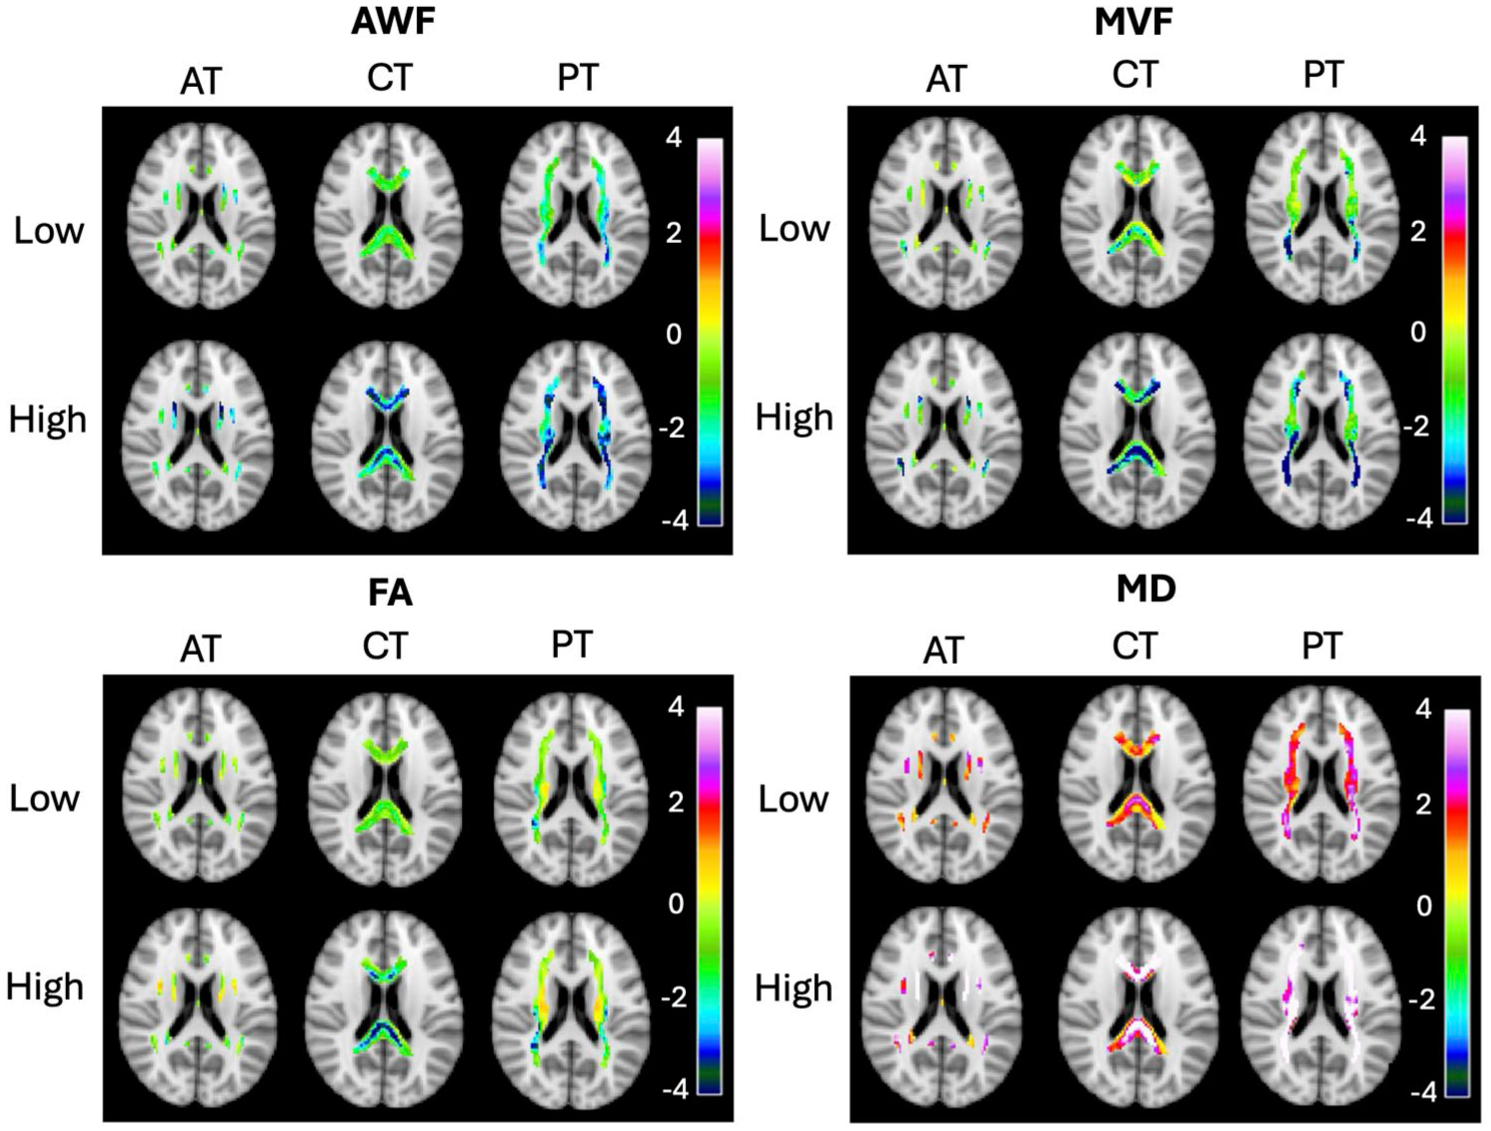
Axial Z-score maps of tract-wise damage displayed based on AWF, MVF, FA, and MD in the Association (AT), Commissural (CT) and Projection (PT) Tracts for the Low EDSS (Low) and High EDSS (High) groups. Z-score maps are overlayed on the MNI 152 T1-w 2 mm3 brain.
Periventricular and deep WM gradient evaluation
In general, Periventricular Gradients showed larger evidence of demyelination and axonal loss compared to Deep WM Gradients. For example, the AWF gradient in the Association Tracts of High EDSS participants was 2.10 p.u./mm in Periventricular WM and only 0.59 p.u./mm in Deep WM. Our results, notably, support that Periventricular Gradients in AWF, MVF and MD of PwMS are steeper than corresponding gradients in HC (Table 2).
Summary of statistical test results comparing periventricular and deep white matter (WM) gradients between healthy controls (HC) and MS participants.
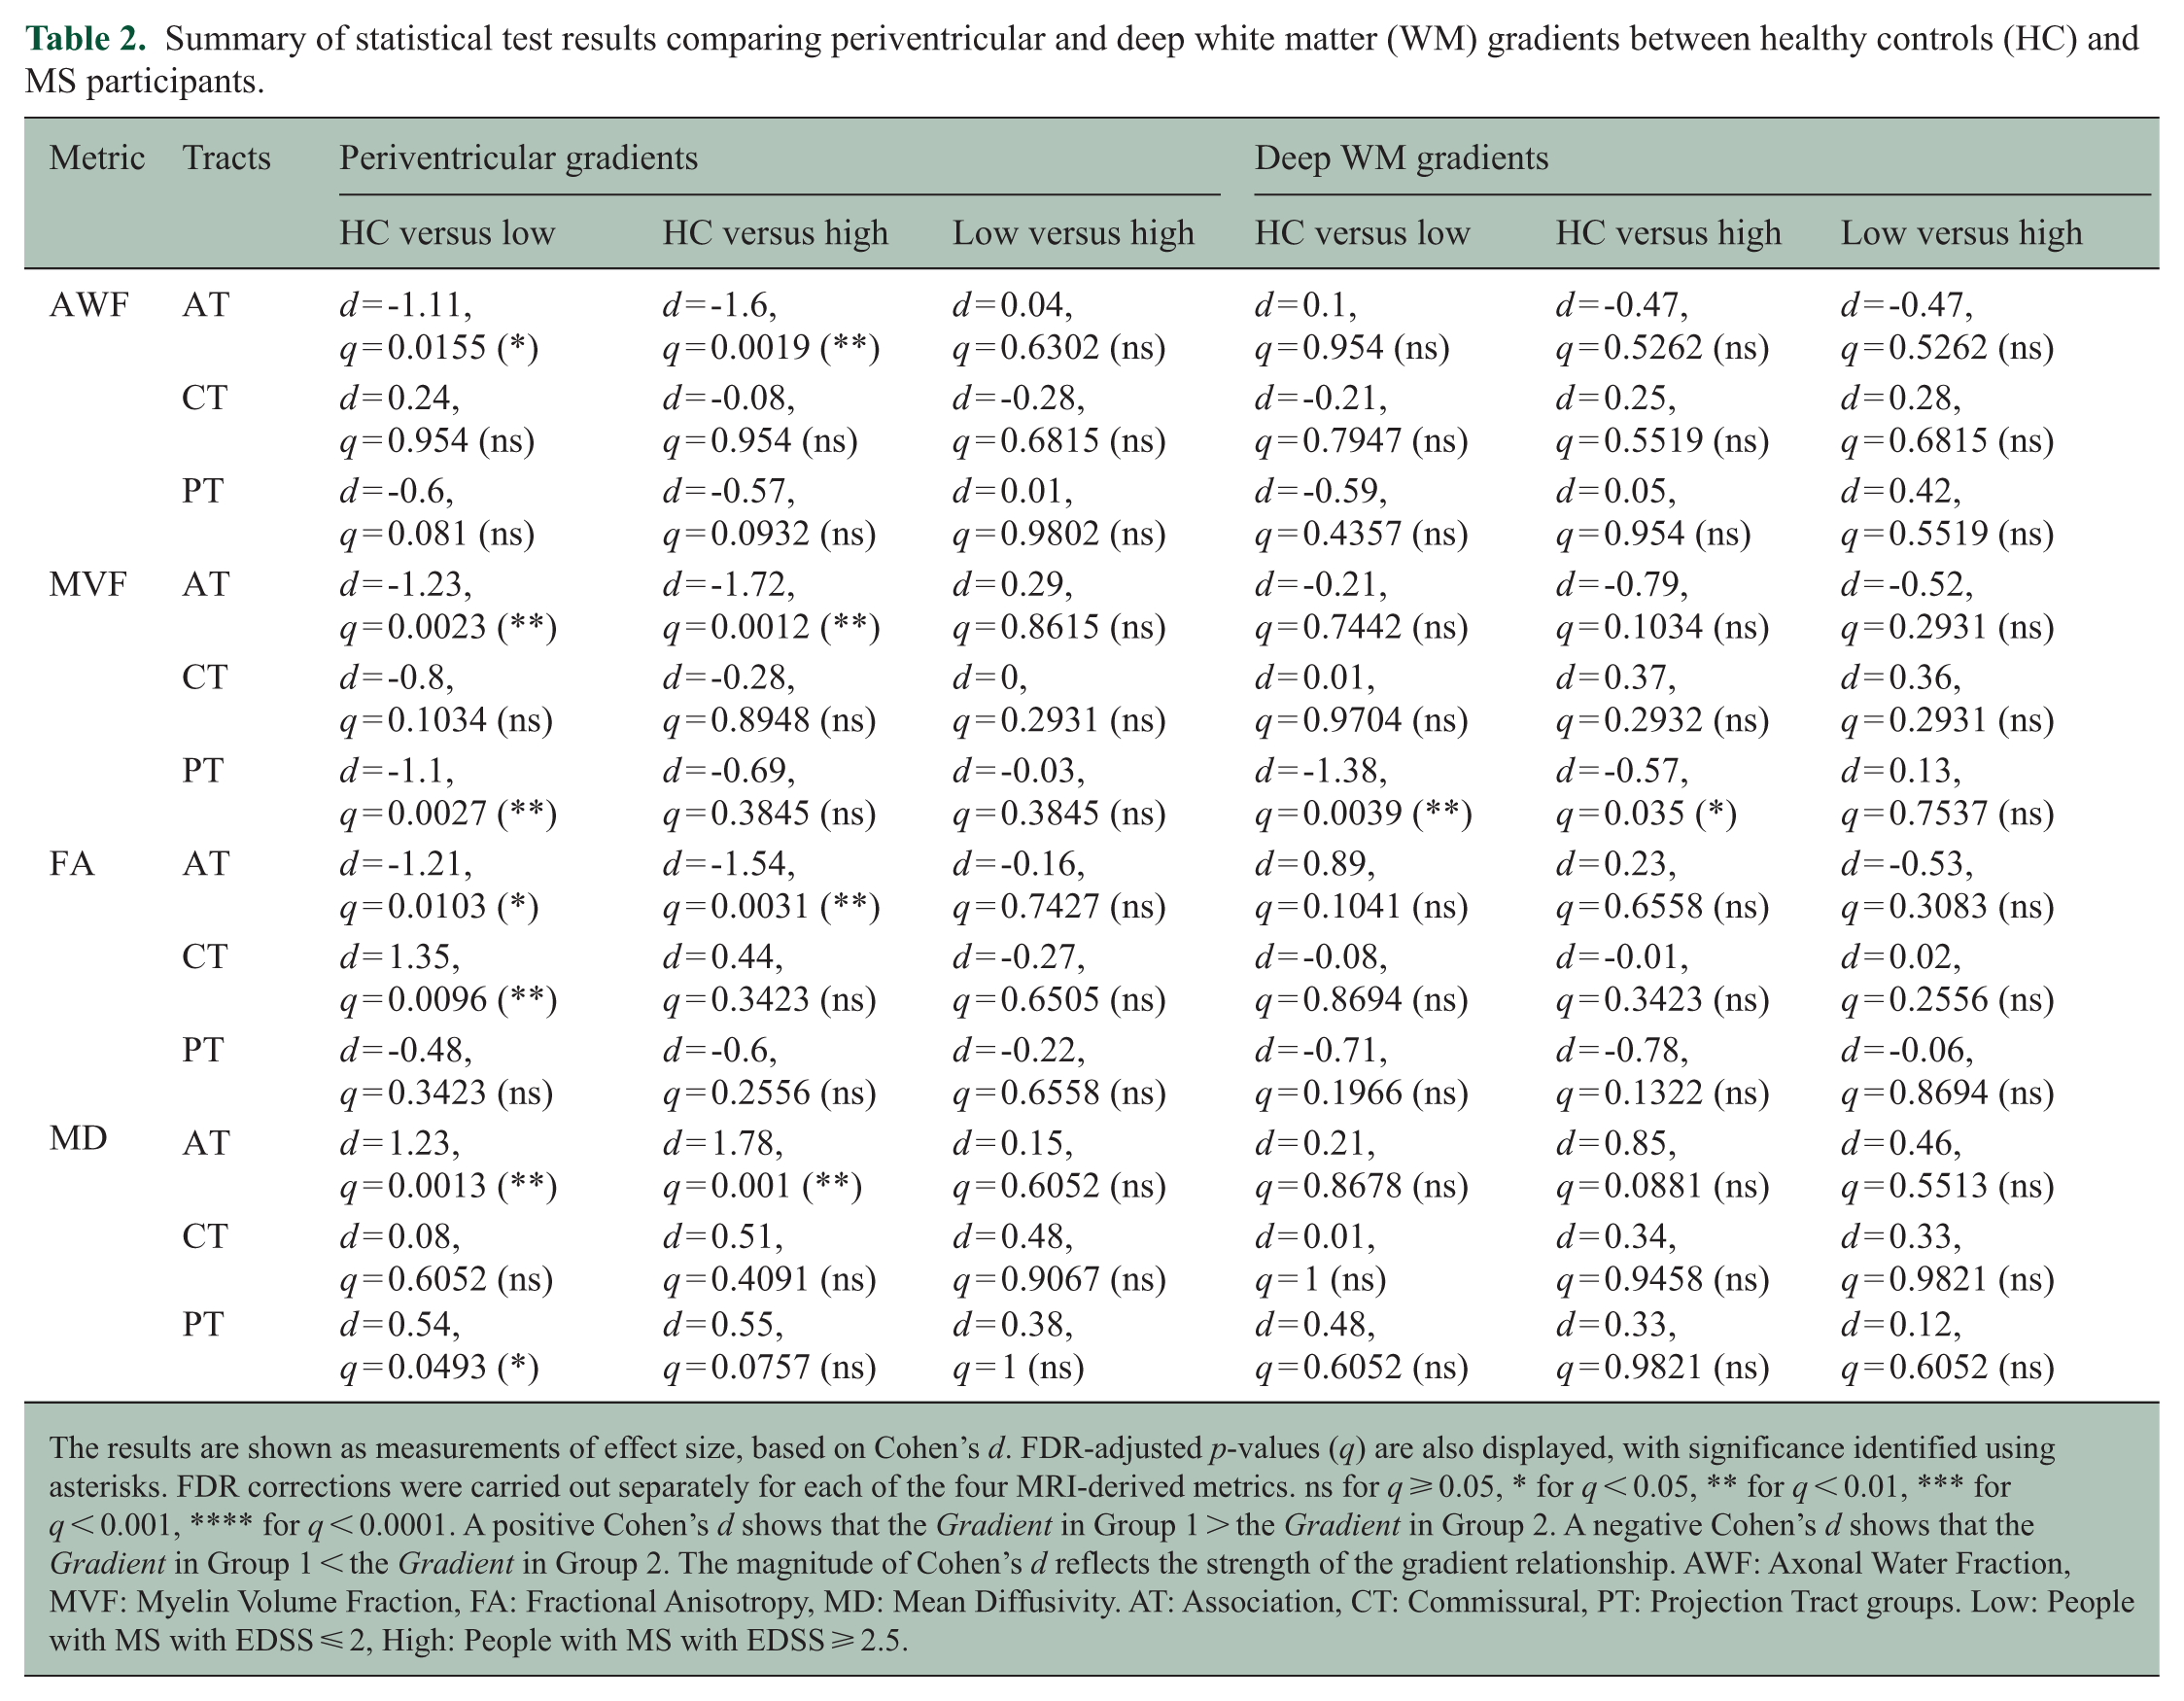
The results are shown as measurements of effect size, based on Cohen’s d. FDR-adjusted p-values (q) are also displayed, with significance identified using asterisks. FDR corrections were carried out separately for each of the four MRI-derived metrics. ns for q ⩾ 0.05, * for q < 0.05, ** for q < 0.01, *** for q < 0.001, **** for q < 0.0001. A positive Cohen’s d shows that the Gradient in Group 1 > the Gradient in Group 2. A negative Cohen’s d shows that the Gradient in Group 1 < the Gradient in Group 2. The magnitude of Cohen’s d reflects the strength of the gradient relationship. AWF: Axonal Water Fraction, MVF: Myelin Volume Fraction, FA: Fractional Anisotropy, MD: Mean Diffusivity. AT: Association, CT: Commissural, PT: Projection Tract groups. Low: People with MS with EDSS ⩽ 2, High: People with MS with EDSS ⩾ 2.5.
Periventricular Gradients showed positive slopes in AWF and MVF, and negative slopes in MD. FA gradients were not as consistent. This may be a result of crossing, splaying, and bending fibers.
Periventricular and Deep WM Gradients are summarized in Supplementary Table S2. A corresponding statistical comparison of these gradients, between HC and PwMS, is given in Table 2.
Associations between periventricular tissue damage and lesion loads
Our results support a larger number of band-wise correlations between NAWM damage and lesion load in the High EDSS group. In the Low EDSS group, there were 33 bands with significant correlations (27 with non-BH load, 6 with T1-BH load), and in the High EDSS group, there were 101 bands with significant correlations (42 with non-BH load, 59 with T1-BH load). The High EDSS group particularly showed significant associations between gradient damage and T1-BH lesion load in periventricular bands (14 in bands 2–3, 12 in bands 4–5).
Supplementary Figure S2 also shows the lesion loads within each band and tract. Figure 4 identifies correlations between tissue damage and WM lesion loads for each band and tract. Moreover, the number of bands showing significant correlations in each group are summarized in Supplementary Tables S3 (all bands) and S4 (bands 2–5).
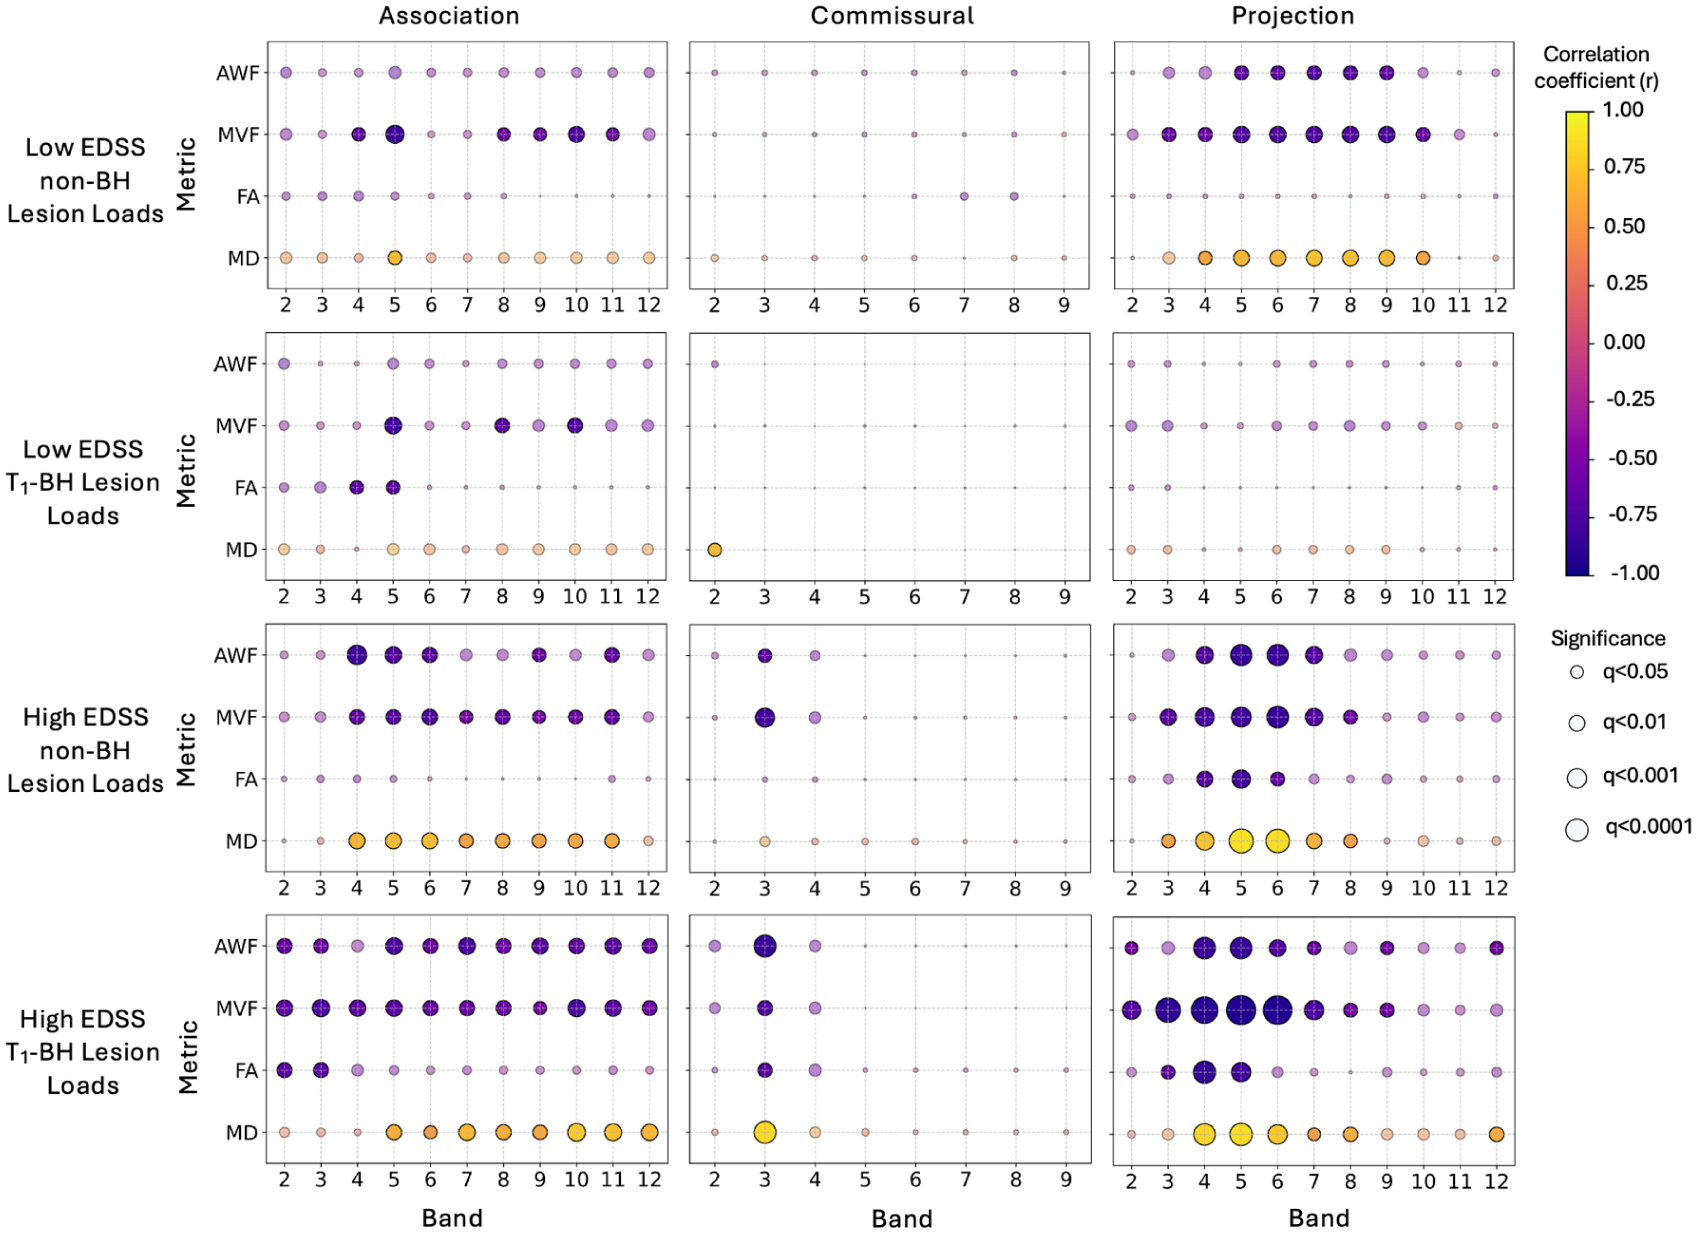
Correlations between periventricular NAWM damage and lesion loads. Columns from left to right denote Association, Commissural, and Projection Tracts. The rows from top to bottom are Low EDSS non-BH Lesion Loads, Low EDSS T1-BH Lesion Loads, High EDSS non-BH Lesion Loads, and High EDSS T1-BH Lesion Loads. The y-axis of each plot shows AWF, MVF, FA, and MD, and the x-axis shows the bands. Each dot represents the result of the Pearson Correlation Test for a Lesion Load and a metric within a band and tract for a given group. The color represents the correlation coefficient (r), with yellow for positive correlations, and purple for negative correlations. The size of the dot represents the significance of the correlation. Significant correlations are opaque. Non-significant correlations are semi-transparent. FDR corrections were carried out separately for each of the 48 separate comparisons: separately for each of the three Tract groups, for each of the four MRI-derived metrics, for each of the two groups, and for each of the two lesion load types. Bands 10–12 were excluded from investigation of the Commissural Tracts as they included negligible voxels.
Associations between periventricular tissue damage and brain structural volumes
For the High EDSS group, we observed unique correlations between AWF, MVF, FA, and MD-derived Periventricular and Deep WM Gradient Damage with atrophy of TBV, GM, and WM. Such measures were also associated with enlargement of the LV and CP (Figure 5). More specifically, for AWF, we observed correlations based on Periventricular Gradient damage in the Projection Tracts with TBV and WM atrophy, and with LV enlargement. Whereas for MVF, we observed correlations based on Periventricular Gradient Damage in the Commissural and Projection Tracts with all structural volumes.
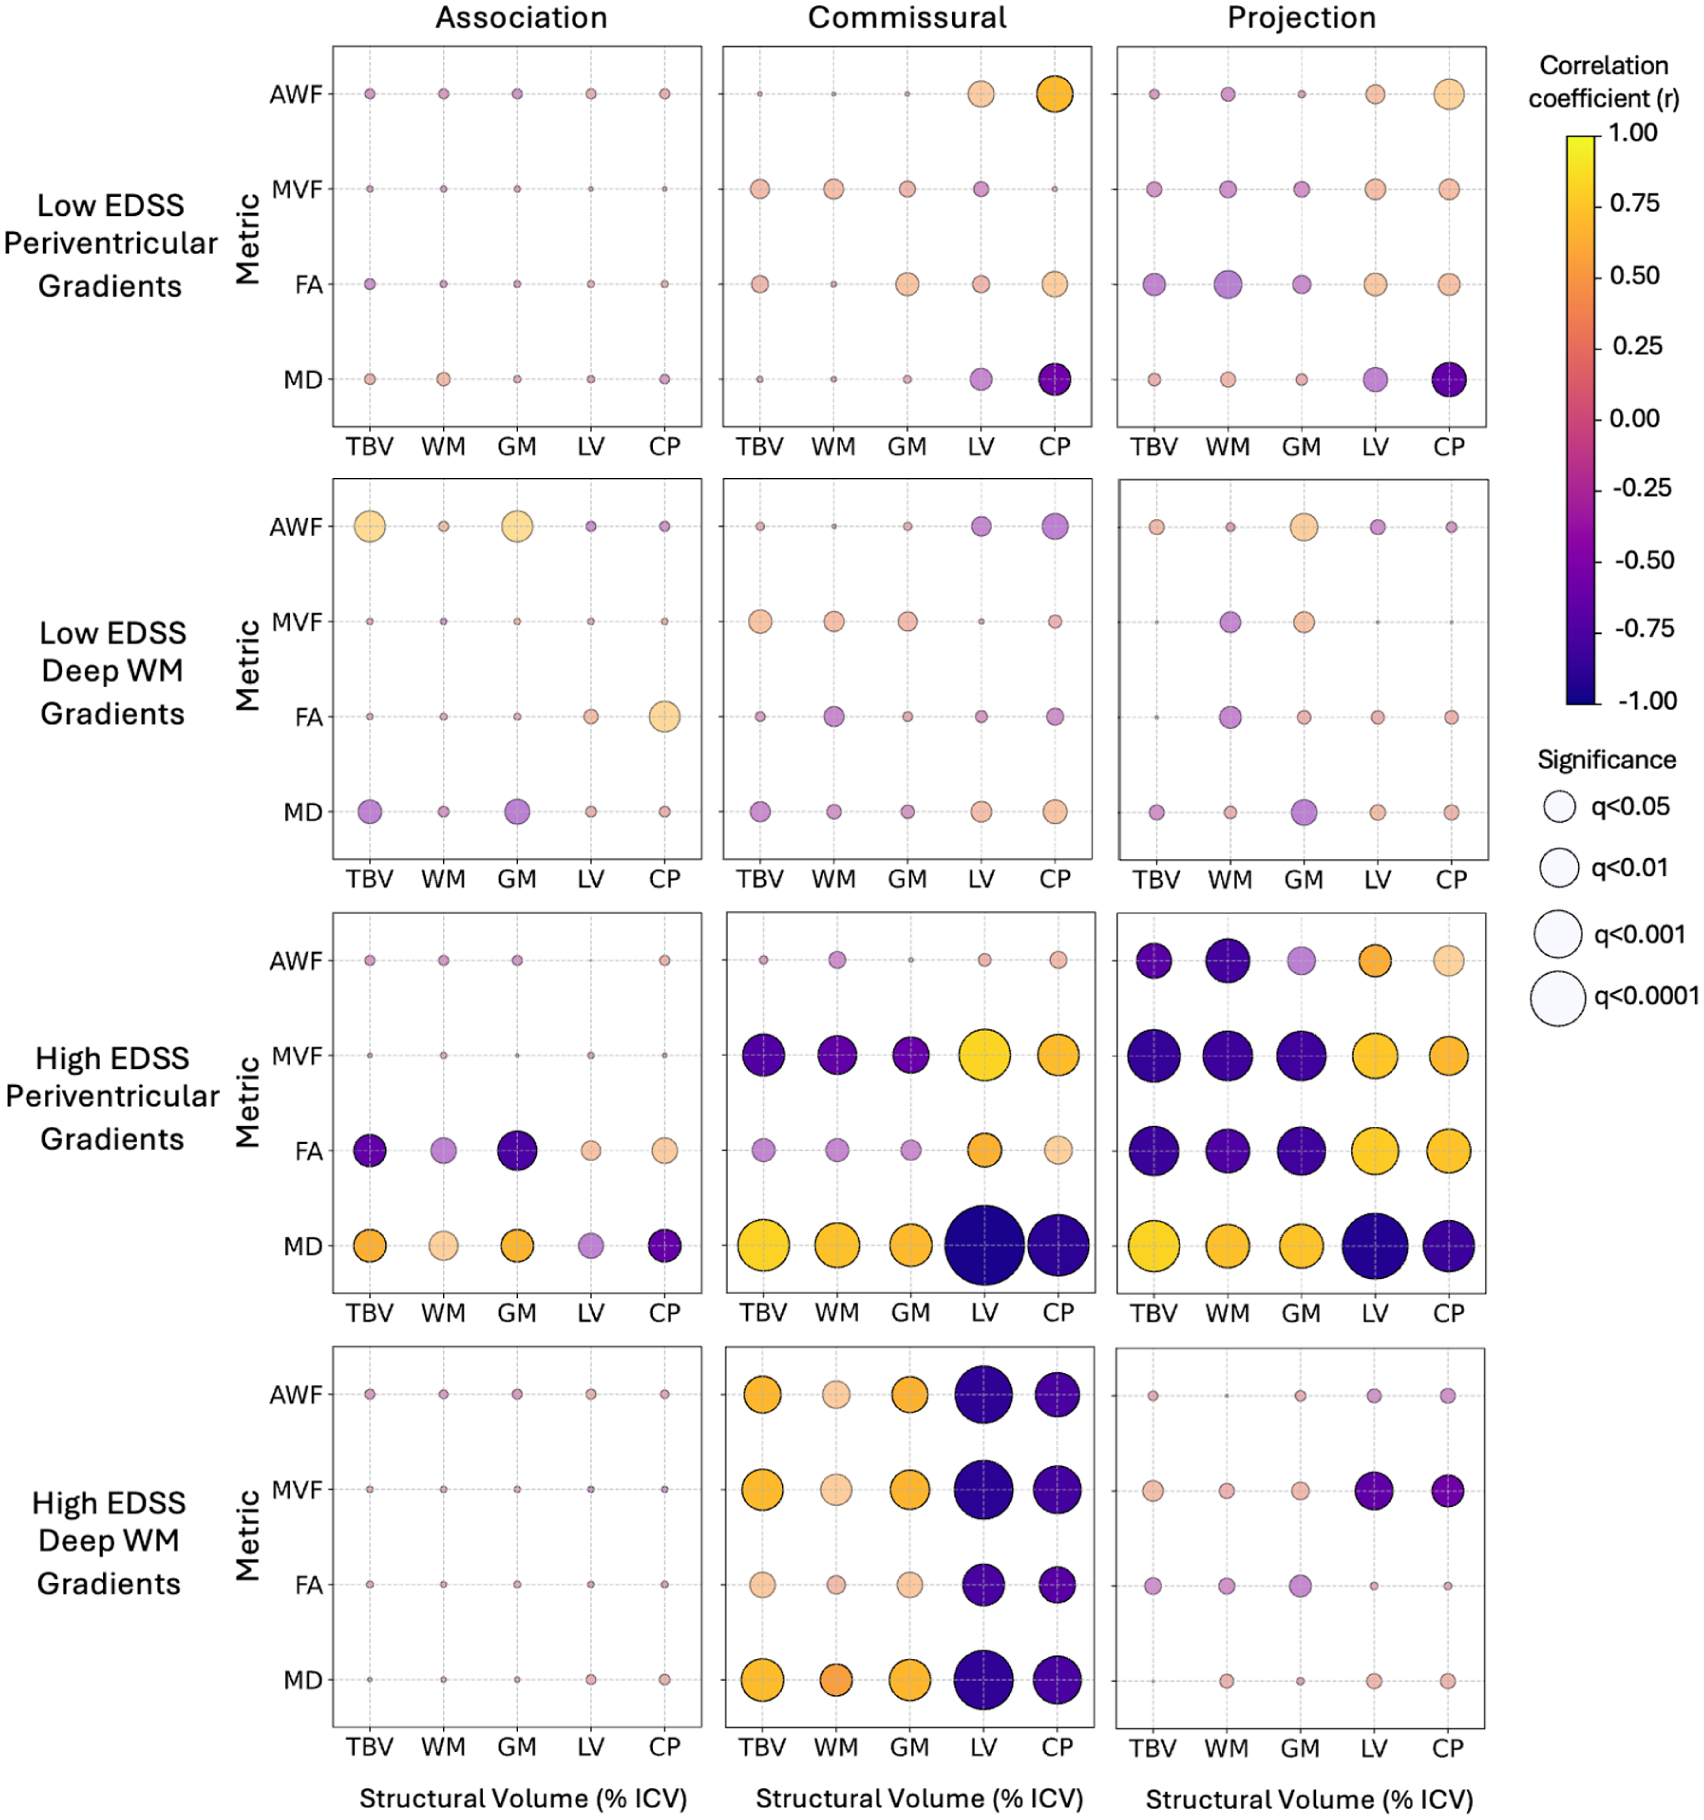
Correlations between periventricular NAWM damage and brain structural volumes. Columns from left to right denote Association, Commissural, and Projection Tracts. The rows from top to bottom are Low EDSS Periventricular Gradients, Low EDSS Deep WM Gradients, High EDSS Periventricular Gradients, and High EDSS Deep WM Gradients. The y-axis of each plot shows AWF, MVF, FA, and MD. The x-axis shows the Structural Volumes (%ICV) from left to right: total brain volume (TBV), white matter (WM), gray matter (GM), lateral ventricles (LV), and choroid plexus (CP). Each dot represents the result of the Pearson Correlation Test for a Lesion Load and a metric within a band and tract for a given group. The color represents the correlation coefficient (r), with yellow for positive correlations, and purple for negative correlations. The size of the dot represents the significance. Significant correlations are opaque. Non-significant correlations are semi-transparent. FDR corrections were carried out separately for each of the 12 comparisons: separately in each of the three Tract groups, separately in each of the four MRI-derived metrics.
In the Low EDSS group, limited correlations between Periventricular Gradient damage and volumetric changes were observed: AWF in the Commissural Tracts with CP enlargement (q < 0.05), and MD in the Commissural and Projection Tracts with CP enlargement (q < 0.05 for both).
Figure 5 identifies correlations between MRI-measured periventricular gradient damage and local brain volume measures (%ICV) for PwMS. For reference, corresponding local brain volume measures (%ICV) are displayed in Supplementary Table S5.
Discussion
The evaluation of MRI-derived periventricular gradients provides important insight into disease pathogenesis in MS. Previous studies have shown the presence of periventricular gradient damage in MS using myelin-sensitive MTR.3–6 In the present study, we measured periventricular NAWM tissue damage using AWF, which is sensitive to axonal integrity, and MVF, which is sensitive to myelin. Our findings support that band- and tract-wise WM damage in MS is correlated with band- and tract-wise lesion load and selected structural volume changes. In PwMS with higher disability, the amount of axonal loss was consistent with levels of MRI-measured demyelination. This was not true for PwMS with lower disability. These findings support potential utility of periventricular gradients as biomarkers of disease progression.
Observed associations between tract-wise AWF and MVF reductions and lesion load were notably stronger in PwMS with increased disability. Furthermore, there was convincing evidence that existence of a T1-BH within WM tracts contributed to reduced NAWM AWF within those tracts, consistent with degeneration of axons transected within T1-BH lesions. 35 Previous MRI studies have shown NAWM abnormalities can precede lesion formation, 12 and that NAWM surrounding T1-BH lesions may be markedly more susceptible to MS pathology compared to more distal NAWM. 36 In people with SPMS, the rate at which T1-BH lesions accumulate has been significantly associated with the rate of disease progression. 37 Our results support these findings, suggesting tract-wise accumulation of T1-BH lesions may drive key aspects of neuroinflammation and neurodegeneration in NAWM of PwMS. This appears particularly true in PwMS with higher disability.
Significant reductions in AWF of PwMS compared to HC were present in all our calculated, geodesic NAWM bands. MVF was significantly lower in High EDSS participants compared to HC in all bands and only reduced for Low EDSS participants closer to the ventricles. This supports the notion that periventricular myelin damage begins in proximity to the ventricles, likely due to inflammatory cytokines leaking out from the ventricles, and may progress spatially outward during MS progression. A common molecular pattern of proinflammatory cytokines has been found in the CSF of PwMS. 1
In our study, periventricular gradient damage was also detectable when applying regional measurements of MD, but not FA. This may indicate FA measures in NAWM damage in MS are less robust for NAWM integrity quantification.
In PwMS with increased disability, we observed periventricular axonal damage in the Projection Tracts was associated with LV enlargement, and TBV and WM atrophy. Periventricular damage to myelin in the Commissural and Projection Tracts was correlated with CP and LV enlargement, as well as with TBV, GM, and WM atrophy. This was not the case for the Low EDSS group. These findings are in line with the only previous periventricular NODDI study of MS, which reported periventricular gradients of ISOVF were correlated with WM and GM atrophy. 11 Our findings are also corroborated by previous studies that showed CP enlargement is correlated with future periventricular neurodegeneration, with higher correlations present for people with progressive MS. 8 CP enlargement has also been associated with both WM and GM atrophy. 38
LV enlargement may be a secondary phenomenon to the GM and WM atrophy, 8 whereas CP enlargement in SPMS may reflect ongoing inflammation that contributes to tissue damage. 39 The association of CP enlargement with this regional periventricular damage supports the ependymal “surface-in” theory of proinflammatory cytokines entering the CSF via the CP.
The results of this study revealed that Periventricular NAWM tissue damage in MS differs between WM Tracts. In particular, the Association and Projection Tracts exhibited more prominent periventricular gradients of NAWM damage, based on the AWF, MVF and MD measures, compared to the Commissural Tracts. Further, there were a larger number of strong correlations between periventricular NAWM damage and lesion load in the Association and Projection Tracts. Based on the observed tract-wise differences in periventricular gradients, our findings suggest that “surface-in” pathology in MS may be more prominent along a lateral, left-right brain axis compared to similar gradients existing along the anterior-posterior direction. It has been reported that, at the level of the lateral ventricular body, perivascular spaces run along a dominant left-right axis of the brain and align with medullary veins. 40 Thus, there is a potential link between surface-in damage and the glymphatic system of the brain. The glymphatic circulation is a CSF waste clearance pathway that passes through the interstitial and perivascular spaces. 41 Studies applying DTI analysis along the perivascular space (DTI-ALPS) have postulated decreased Brownian motion of water molecules radially outward from the lateral ventricles (“decreased ALPS-index”) in PwMS compared to HC. 40 Furthermore, there is evidence of a reduced ALPS-index in people with advanced MS compared to those with RRMS. 40
Limitations and future work
We acknowledge that our study has some limitations. Our method for AWF computation relied on assumptions made in the NODDI model. 32 These included seeding fixed, equal values for parallel diffusivity in the intra- and extra-axonal spaces, and fixed, equal T2 relaxation times for all tissues. Such assumptions may have led to a slight overestimation of the intra-axonal compartment size and the ISOVF. Their full influence requires further, detailed investigation.
We did not collect diffusion-weighted images with reverse phase encoding. Therefore, we could not directly apply reverse phase-encoded data to correct for possible susceptibility-induced distortions. Our ongoing and future studies include reverse phase encoding to address this issue.
We acknowledge that lesions may contribute to surrounding NAWM damage, in addition to the CSF-driven processes we discuss in this study. In our imaging cohort, it is likely that the two processes co-exist, but it is not possible to disentangle their respective influences based solely on cross-sectional MRI data.
Lesions were separated into T1-BH and non-BH lesions, using a threshold derived from the median cortical GM T1-w image intensity of each participant. Nonetheless, there may still be subtle, relevant differences in lesion damage that could, in future, be explored using the quantitative T1 relaxation times (ms) of lesions. Although SAMSEG and LST-LGA are well-established methods for automatic MS WM lesion segmentation, there is still a possible influence of false positive and false negative lesions in our segmentations, as they were not manually corrected.
Our future research will also seek to evaluate tract-wise, longitudinal changes in AWF and MVF gradients, in relation to longitudinal measures of Functional Systems Scores and cognitive performance in our cohort of PwMS. This work is currently underway.
Conclusion
Our study demonstrates that AWF and MVF are sensitive to tract-wise periventricular pathology in both RR and SPMS. It further reveals that periventricular gradients are associated with higher T1-BH lesion loads and CP enlargement in people with EDSS > 2. Previous work has suggested that inflammatory cytokines in the CSF can introduce ependymal cell reactivity which is linked to significant changes in ventricular wall permeability. 42 Such changes in permeability may ultimately result in downstream AWF and MVF periventricular gradient damage due to diffusion of soluble factors into the brain from CSF. 2 AWF and MVF gradient damage in MS may also precede formation of chronic T1-BH lesions. Future longitudinal studies have the potential to evaluate how tissue gradient damage is involved in distinct aspects of lesion formation and increased MS disability.
Supplemental Material
sj-docx-1-msj-10.1177_13524585251396439 – Supplemental material for Periventricular gradients in axonal and myelin microstructure are present in people with multiple sclerosis having low and high disability
Supplemental material, sj-docx-1-msj-10.1177_13524585251396439 for Periventricular gradients in axonal and myelin microstructure are present in people with multiple sclerosis having low and high disability by Hannah R Bernstein, Vladimir Grouza, Joseph S Gati, Sarah A Morrow, Ravi S Menon, Sridar Narayanan, Douglas L Arnold and David A Rudko in Multiple Sclerosis Journal
Footnotes
Acknowledgements
The authors wish to thank the staff involved in the CLMS SPACE Study conducted through the MS Clinic at Western University. They also offer sincere appreciation to all the people who participated in the study.
Data Availability Statement
The anonymized dataset used and analyzed in the current study is available from the corresponding author upon reasonable request.
Declaration of Conflicting Interests
The authors declared the following potential conflicts of interest with respect to the research, authorship, and/or publication of this article: S.N. has received research funding from the International Progressive MS Alliance, the Myelin Repair Foundation, Immunotec, and F. Hoffman-La Roche Ltd. He is a consultant for Sana Biotech, has received a speaker’s honorarium from Novartis Canada, and is a part-time employee of NeuroRx Research. D.L.A. reports consulting fees from Biogen, Biohaven, BMS, Eli Lilly, EMD Serono, Find Therapeutics, Frequency Therapeutics, GSK, Idorsia Pharmaceuticals, Kiniksa Pharmaceuticals, Merck, Novartis, Race to Erase MS, Roche, Sanofi-Aventis, Shionogi, and Xfacto Communications, as well as an equity interest in NeuroRx.
Funding
The authors disclosed receipt of the following financial support for the research, authorship, and/or publication of this article: This study was supported, in part, by a Natural Sciences and Engineering Research Council of Canada (NSERC) Undergraduate Student Research Award (H.R.B.), Canadian Institutes of Health Research (CIHR) Master’s Program (H.R.B.) and Doctoral Program Awards (FRN 199441: H.R.B.), as well as a Fonds de Recherche du Québec Santé (FRQS) Master’s Training Scholarship (H.R.B.). Principal funding for the study was provided by an NSERC Discovery Grant (RGPIN-2018-05047: D.A.R.), MS Canada Biomedical Research Operating Grant (Fund #3613: D.A.R.) and a Canada First Research Excellence Fund (CFREF) Healthy Brains for Healthy Lives Innovative Ideas Project Grant (D.A.R.). Additional support was provided by a CIHR Operating Grant (FRN# MOP-84367: D.L.A., S.N.).
ORCID iDs
Supplemental Material
Supplemental material for this article is available online.
References
Supplementary Material
Please find the following supplemental material available below.
For Open Access articles published under a Creative Commons License, all supplemental material carries the same license as the article it is associated with.
For non-Open Access articles published, all supplemental material carries a non-exclusive license, and permission requests for re-use of supplemental material or any part of supplemental material shall be sent directly to the copyright owner as specified in the copyright notice associated with the article.