
Abstract
Background:
The selective inversion recovery quantitative magnetization transfer imaging-derived macromolecular-to-free pool size ratio (PSR) and the magnetization transfer imaging-derived magnetization transfer ratio (MTR) are both indirect indicators of myelin integrity. However, it remains unknown whether the two measures perform equally in clinical studies.
Objectives:
To compare the accuracy and effect size (ES) of PSR and MTR in assessing white matter (WM) injury in the brain of people with multiple sclerosis (PwMS).
Methods:
MTR and PSR were measured in lesions and normal-appearing white matter (NAWM) of 40 PwMS and in the normal white matter (NWM) of 16 healthy controls (HCs).
Results:
In total, 231 T2-lesions, 257 chronic black holes (cBHs), 450 regions of interest (ROIs) in NAWM proximal (pNAWM) and distant (dNAWM) to lesions of PwMS, and 150 NWM ROIs of HCs were assessed. PSR was more accurate (p ⩽ 0.046) and had higher ES (p < 0.001) than MTR in differentiating T2-lesions from pNAWM, dNAWM, or NWM. PSR was more accurate (p = 0.006) than MTR in differentiating cBHs from NWM and showed higher ES (p = 0.003) when comparing cBHs with pNAWM and dNAWM.
Conclusions:
PSR has greater accuracy and ES than MTR in distinguishing WM areas with different degrees of tissue injury.
Keywords
Introduction
Demyelination is a key pathological feature of multiple sclerosis (MS). 1 Myelin injury is present in focal lesions and extends over non-lesional tissue, in areas of normal-appearing white matter (NAWM). 1
The magnetization transfer imaging (MTI)-derived magnetization transfer ratio (MTR) is a semi-quantitative index that represents the ratio between the magnetization of macromolecule-bound protons in tissue and that of free water protons. 2 As myelin damage occurs, protons move from the macromolecular pool to that of the free water. 2 This generates a signal drop and translates into lower MTR values. 2 Combined magnetic resonance imaging (MRI)-histopathology studies showed that MTR relates to myelin content. 3 However, MTR does not directly compare the quantity of bound protons to that of the free ones but rather depends on the signal drop associated with changes in their proportions.4,5 As such, aside from pathological changes, several technical factors4,5 (e.g. sequence timing, scanner hardware, and the MRI irradiation power,4,5 among others) can affect MTR, limiting its utilization in large-scale multi-site clinical trials. 6 Despite these limitations, MTR is a clinically appealing method given the simplicity of its post-processing scheme. 2
Differently, quantitative MT (qMT) methods assume a two-pool model of the protons, for example, one pool bound to myelin and the other one in the free water.7,8 The macromolecular-to-free pool size ratio (PSR) derived from qMT directly measures the proton in each pool and estimates the ratio between them.7,8 As a result, when myelin damage occurs and protons move from the bound pool to the free one, PSR values decrease.7,8 Due to these premises, PSR is considered more specific to myelin injury compared to MTR. qMT, however, requires a complicated image analysis pipeline and relatively long acquisition times which hinder its clinical translation.9,10 Selective inversion recovery quantitative magnetization transfer imaging (SIR-qMT)9,10 overcomes both these limitations, because it contains all qMT parameters within the SIR acquisition.
Thus, the physics premises suggest that PSR is a more accurate metric. Whether technical differences translate into different suitability for clinical studies remains to be addressed.
To fill this knowledge gap, we measured MTR and PSR in different WM regions of the brain of people with newly diagnosed MS (PwMS) and age- and sex-matched healthy controls (HCs). We tested the hypothesis that PSR provides a more accurate and powerful assessment than MTR in differentiating tissues with different degrees of MS induced myelin injury.
Methods
Study design and cohort
Our study was conducted in alignment with the Declaration of Helsinki at Vanderbilt University Medical Center and the Nashville Veterans Affairs MS clinic. Approvals were obtained from the Institutional Review Boards of both institutions, and an informed consent was signed by all participants. We consecutively enrolled 43 newly diagnosed treatment-naïve PwMS, 11 clinically isolated syndrome (PwCIS) 11 and radiologically isolated syndrome (PwRIS). 12 Eighteen HCs matched for 36 patients in sex and age (1:2) were also enrolled. Each participant underwent a brain MRI. Patients were clinically assessed using the Expanded Disability Status Scale (EDSS), 13 the Timed 25-Foot Walking Test (T25-FW), 14 the 9-Hole Peg Test (9-HPT),14,15 and the Minimal Assessment of Cognitive Function in MS (MACFIMS). 16 All clinical tests were performed within 60 days from the MRI scan.
Inclusion criteria were age ⩾18 years, newly diagnosed MS, CIS, or RIS, and no previous exposure to disease-modifying agents other than glucocorticoids for relapses. Exclusion criteria listed contraindications to an MRI, history of ischemic or hemorrhagic stroke, other systemic or neurological autoimmune diseases, neoplastic or infectious illnesses, uncontrolled hypertension, hyperlipemia or diabetes, cardiac diseases, and any clinical changes between assessment and MRI.
Imaging
MRI acquisition protocol, post-processing, and registration
A 3.0 Tesla Achieva scanner (Philips Healthcare, Best, The Netherlands) equipped with a volume transmit and a 32-channel receive head coil (NOVA Medical, Wilmington, MA, USA) was used to obtain brain MRIs. The MRI protocol included the following whole-brain sequences: a T1-weighted turbo spin echo (T1-w TSE, performed in 32 patients only due to time constraint), a T2-w fluid-attenuated inversion recovery (FLAIR), SIR-qMT, and MTI. To identify contrast-enhancing lesions (CELs), post-gadolinium diethylenetriamine penta-acetic acid (Gd-DTPA) three-dimensional magnetization-prepared rapid gradient echo (MPRAGE) sequences were obtained in 19 subjects. Due to time constraints and personal choice, we could not obtain a post-Gd-DTPA in the remaining 24 subjects. In those patients, CELs were assessed on the post-Gd-DTPA T1-w clinical that was done within a median of 60 days from the research scan. Pulse sequence parameters are reported in Table 1.
Pulse sequence parameters.
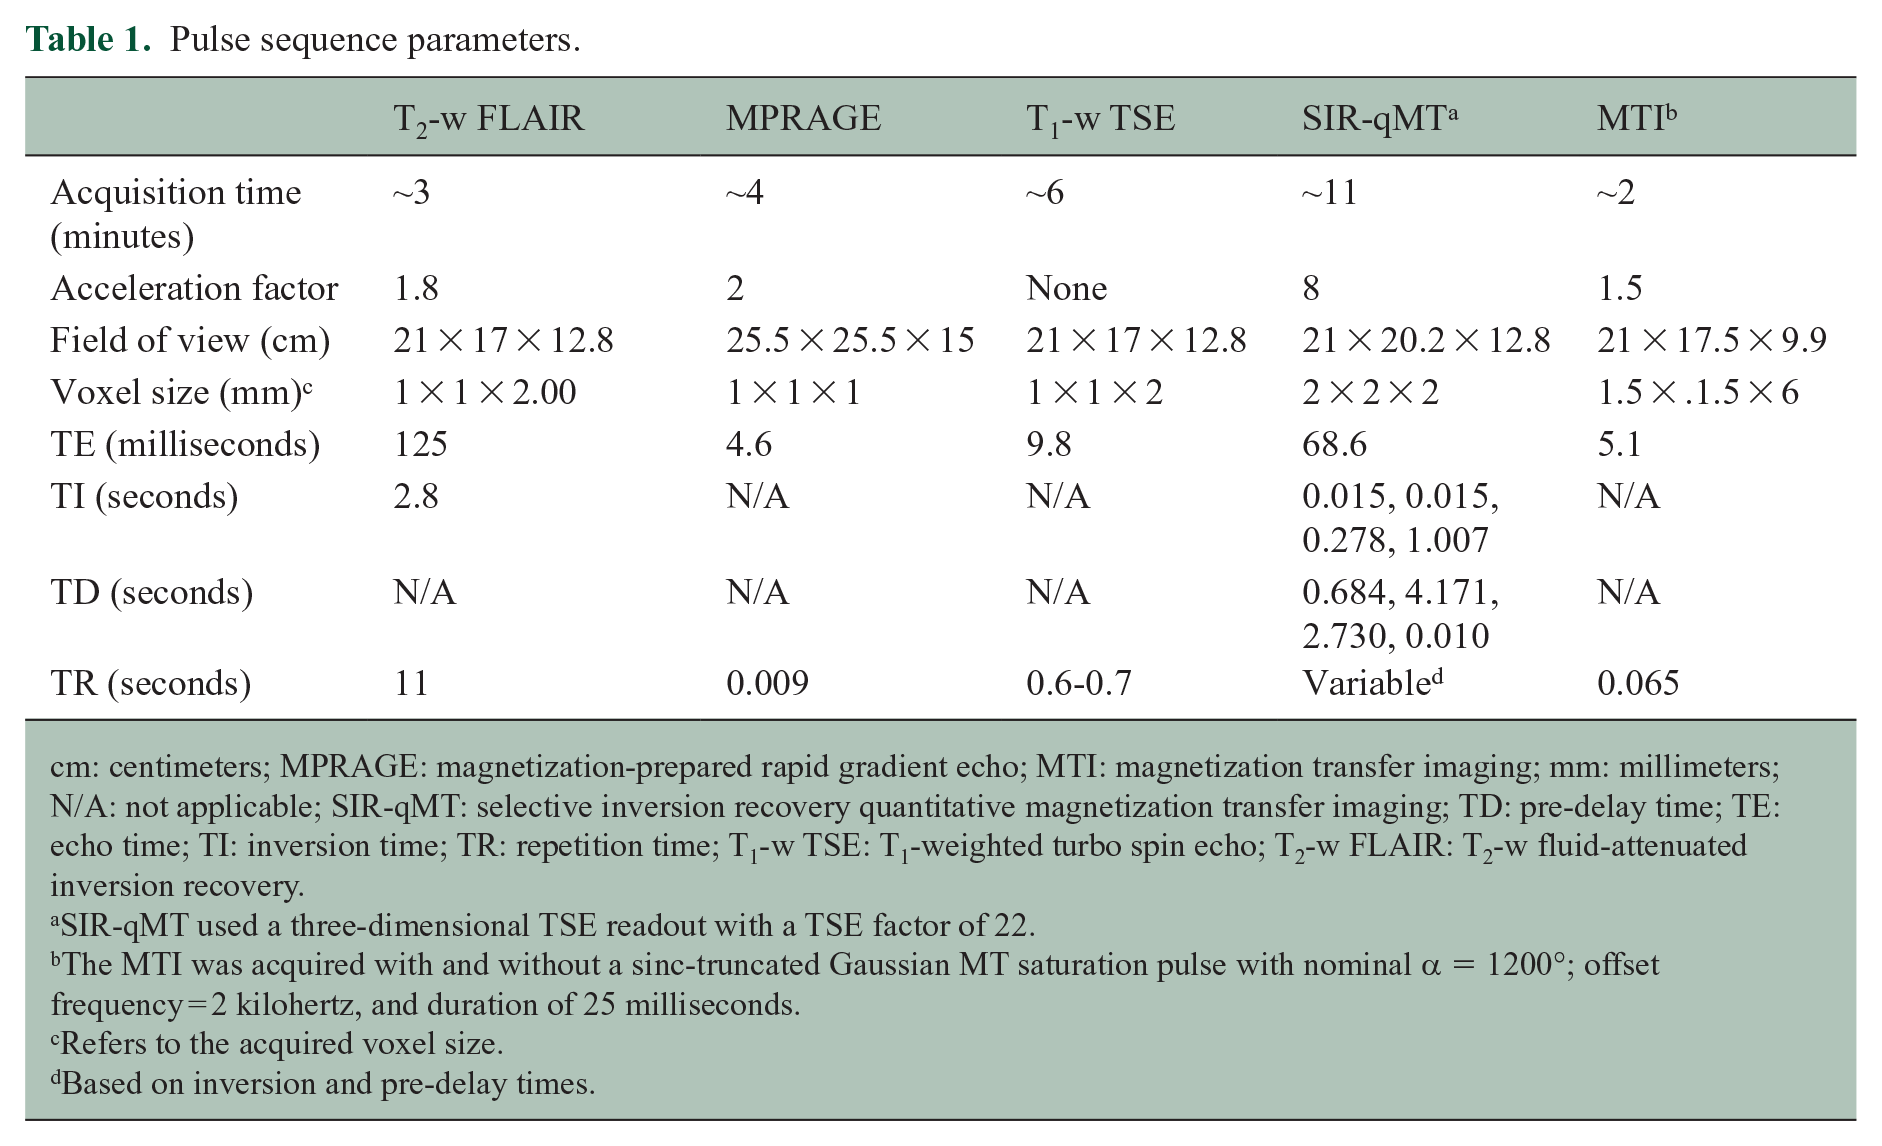
cm: centimeters; MPRAGE: magnetization-prepared rapid gradient echo; MTI: magnetization transfer imaging; mm: millimeters; N/A: not applicable; SIR-qMT: selective inversion recovery quantitative magnetization transfer imaging; TD: pre-delay time; TE: echo time; TI: inversion time; TR: repetition time; T1-w TSE: T1-weighted turbo spin echo; T2-w FLAIR: T2-w fluid-attenuated inversion recovery.
SIR-qMT used a three-dimensional TSE readout with a TSE factor of 22.
The MTI was acquired with and without a sinc-truncated Gaussian MT saturation pulse with nominal α = 1200°; offset frequency = 2 kilohertz, and duration of 25 milliseconds.
Refers to the acquired voxel size.
Based on inversion and pre-delay times.
SIR-qMT derived PSR (%)17–19 and MTI derived MTR (%) 20 were calculated using previously established algorithms.17–20 Thereafter, T1-w TSE images, PSR, and MTR parametric maps were co-registered to the T2-w FLAIR image using FMRIB’s Linear Image Registration Tool (FLIRT) in FMRIB Software Library (FSL). An affine registration scheme with 12 degrees of freedom and the mutual information cost function was used. The quality of all registrations was visually inspected by two authors (A.A.T. and J.W.).
Image analyses
Image analyses were performed using visualization, graphic, and statistical tools available in the Medical Imaging Processing, Analysis, and Visualization (MIPAV) software version 7.3.
The senior author (F.B.) began the analyses with the identification and exclusion of CELs to avoid potential biases related to free water content due to vasogenic edema and inflammation. Next, T2-lesions 21 and chronic black holes (cBHs) 22 were identified based on previous recommendations.21,22 For the purpose of our analyses, T2-lesions corresponded to WM hyperintense lesions visible on T2-w FLAIR images in the absence of a CEL or a cBH. When a T2-lesion had a hypointense portion on the T1-w TSE sequence, the lesion was considered a cBH, and its mask was modified to include only the T1 hypointense area. T2-lesions and cBHs were manually delineated by A.A.T. and J.Z. and reviewed by F.B., and their corresponding volumes were calculated. In PwMS, regions of interest (ROIs) were delineated in NAWM areas proximally (pNAWM), for example, situated anteriorly and posteriorly to T2-lesions and cBHs, and distant (dNAWM), for example, NAWM contralateral to T2-lesions and cBHs.
In each patient, each T2-lesion was paired with a contralateral cBH and with anatomically matched NAWM ROIs. In each HC, normal WM (NWM) ROIs were paired with anatomically matched lesions or NAWM ROIs in patients. The placement of the NAWM and NWM ROIs was done manually. Careful attention was taken to place each ROI as close as possible to the paired lesion without directly touching it or being distant from gray matter, unrelated MS lesions (in patients) or incidental non-specific T2-hyperintensities (in HCs). Consequently, the size and distance from lesions varied depending on individual lesion burden and location. However, all ROIs needed to encompass at least 10 voxels of the parametric map with the largest acquired voxel size, for example, MTI (135 mm3 in volume). This criterion was established to prevent biases from the partial volume effect. 23
Lesions and ROIs masks were then overlaid onto the PSR and MTR parametric maps to extract the mean values of the metrics for each ROI.
Statistical analyses
Data are presented as mean ± standard deviations (SD), median [interquartile range], as appropriate. Chi-square (χ2) tests and independent sample t-tests evaluated differences in demographic and clinical measures between patients and HCs.
We computed the mean PSR and MTR across all voxels of each ROI, computed mean differences (MDs), and assessed the differences between these MDs using paired t-tests. Paired tests were preferred to preserve the anatomical matching within patients and between patients and HCs.
We used the receiver operating characteristic curves (ROCs) to assess the accuracy of PSR and MTR in distinguishing different tissue classes. Accuracy was measured as the area under the curve (AUC). The metrics were considered accurate if the 95% confidence intervals (CIs) did not include the 50% value, that is to say, both ends were higher than 50%. The DeLong test, 24 which measures the degree of overlap between ROCs, was employed to compare the AUCs of PSR and MTR.
We calculated the effect sizes (ESs) of PSR and MTR using Cohen’s d and assessed differences between these metrics using the paired t-test. For each pair, the PSR or MTR ES was calculated using the ratio of the differences of the mean values over the pooled SD. Thereafter, for each pair, we compared the PSR ES and MTR ES using the paired t-test. As an example, in the comparison between T2-lesions and dNAWM, the average PSR of each T2-lesion was subtracted from the average PSR of its corresponding dNAWM and divided by the SD of PSR of both dNAWM and T2-lesions. The same process was done for MTR. Then, a paired t-test was conducted to compare the ES of PSR and MTR. We present the 95% CI and MD. The Bland-Altman plots 25 were generated for each of the comparisons with a significantly different ES between PSR and MTR.
Spearman’s correlation coefficients were used to evaluate the associations between MRI and clinical metrics.
A p-value < 0.050 was considered significant in all the analyses except for correlation analyses where multiple corrections using the Bonferroni method were performed. For each radiological metric, 14 correlations were performed, yielding a level of significant p-value < 0.003 (0.050/14). All statistical analyses were performed using the Statistical Package for Social Sciences (SPSS) Statistics for Windows, Version 24.0 (IBM Corp., Armonk, NY, USA).
Results
We enrolled in a total of 61 participants. Three PwMS and two HCs were excluded from subsequent analyses due to SIR-qMT artifacts leaving 56 subjects (40 patients and 16 HCs). Of these, only 32 patients had a T1-w TSE sequence for the detection of cBHs. Table 2 details clinical, demographic, and MRI features of the final study cohort.
Demographic, clinical, and MRI characteristics of the study cohort.
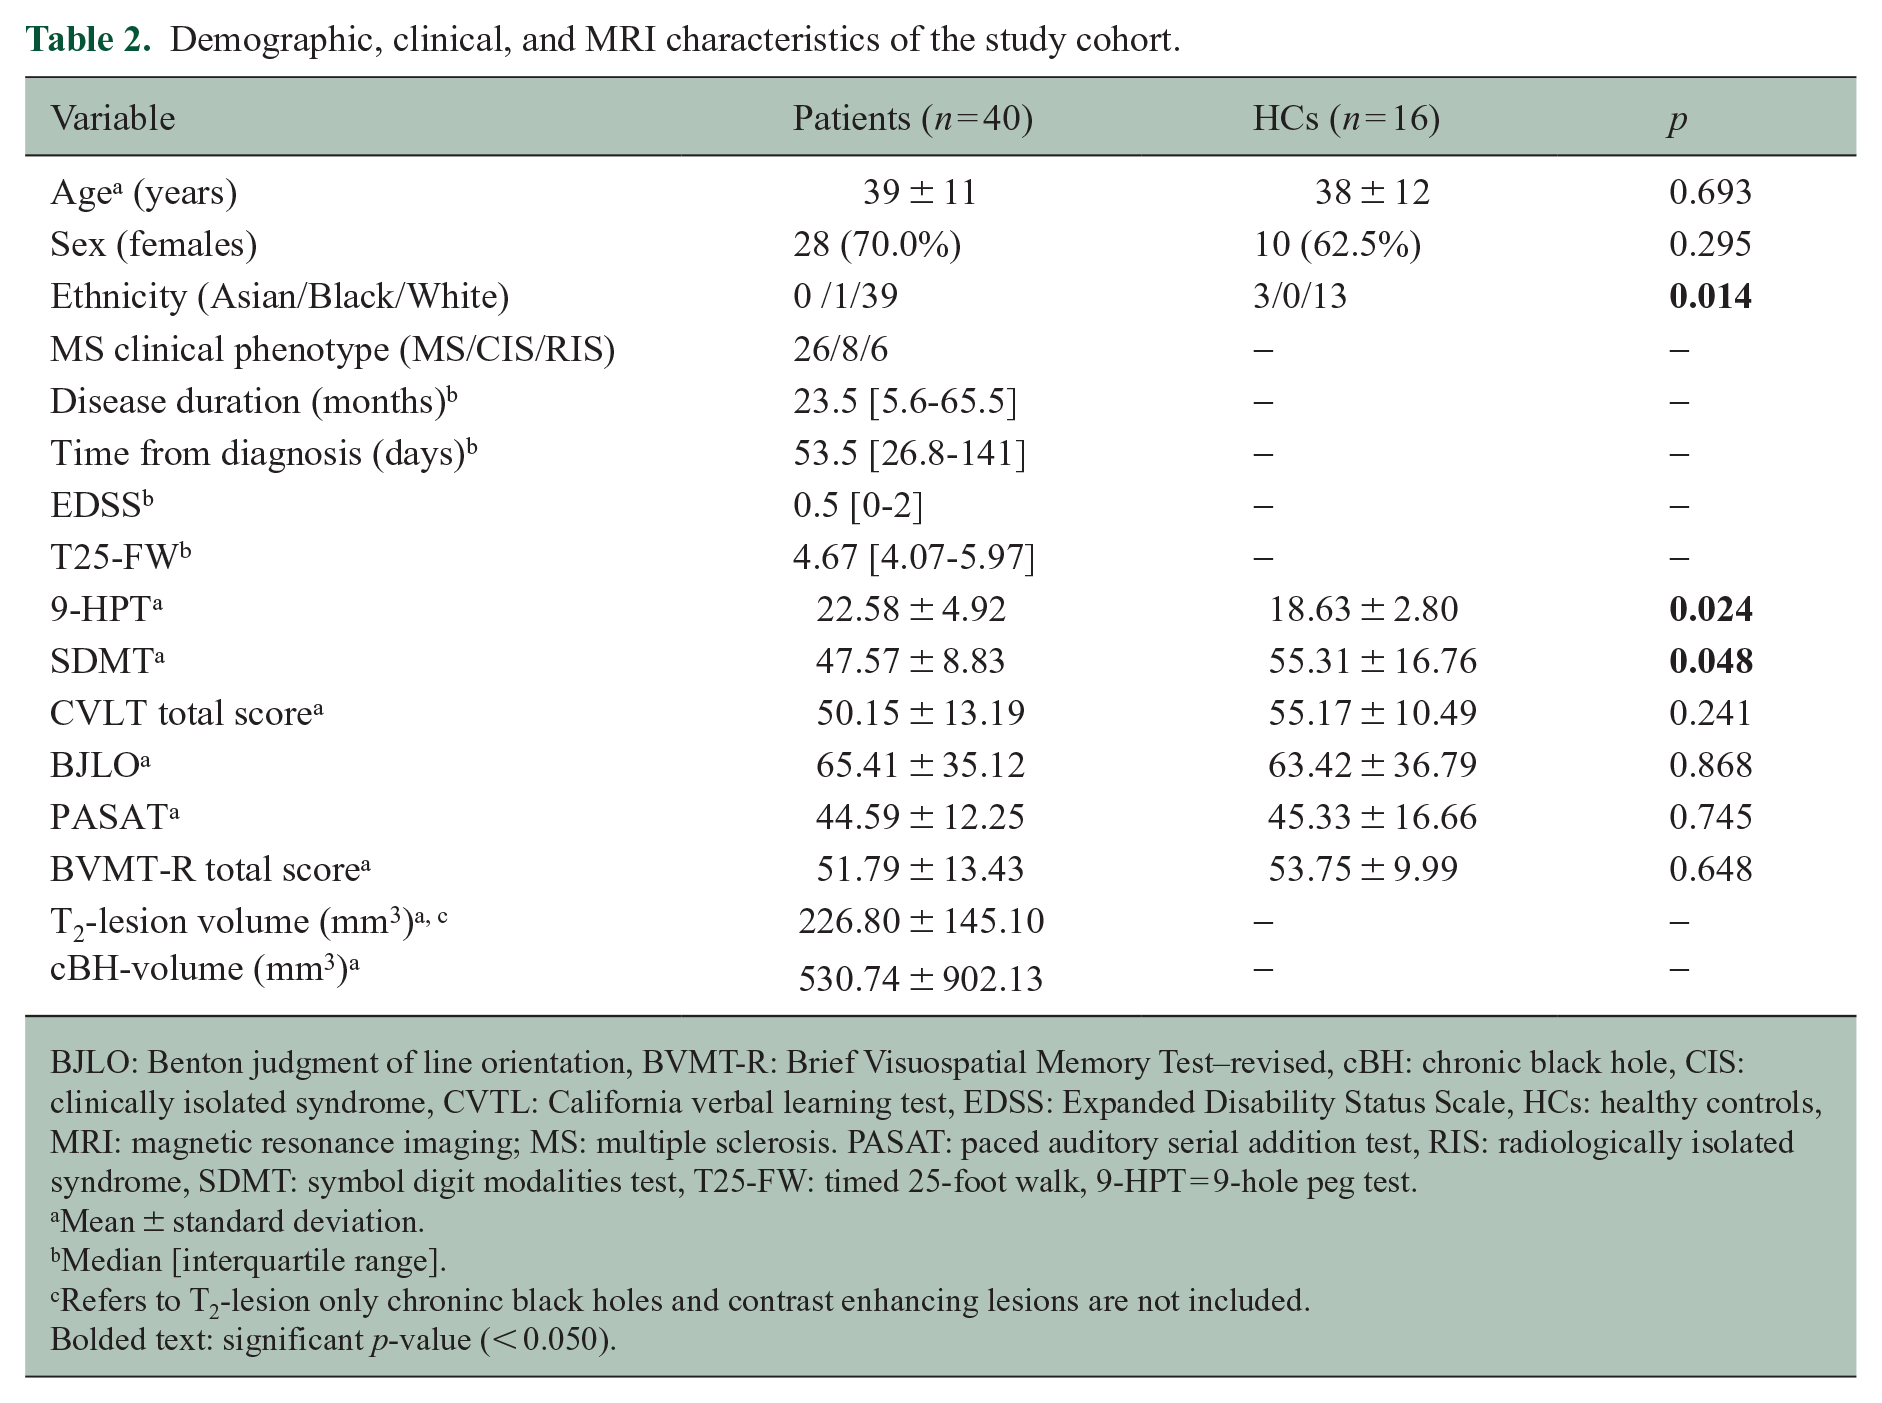
BJLO: Benton judgment of line orientation, BVMT-R: Brief Visuospatial Memory Test–revised, cBH: chronic black hole, CIS: clinically isolated syndrome, CVTL: California verbal learning test, EDSS: Expanded Disability Status Scale, HCs: healthy controls, MRI: magnetic resonance imaging; MS: multiple sclerosis. PASAT: paced auditory serial addition test, RIS: radiologically isolated syndrome, SDMT: symbol digit modalities test, T25-FW: timed 25-foot walk, 9-HPT = 9-hole peg test.
Mean ± standard deviation.
Median [interquartile range].
Refers to T2-lesion only chroninc black holes and contrast enhancing lesions are not included.
Bolded text: significant p-value (< 0.050).
All PwMS had T2-lesions, 28/32 had cBHs, and 5/40 had CELs. In total, 823 T2-lesions, 392 cBHs, and 9 CELs were identified. Along with all CELs, 592 T2-lesions and 135 cBHs were excluded due to their volume being < 135 mm3 (correspodning to 10 MTI-acquired voxels), leaving 231 T2-lesions and 257 cBHs for the subsequent analyses.
PSR and MTR data
Comparisons between T2-lesions and cBHs
For this set of comparisons, 33 T2-lesions and 33 anatomically matched cBHs were identified and analyzed in 32 PwMS. cBHs had significantly lower PSR and MTR compared to T2-lesions (Table 3). PSR (p = 0.003) and MTR (p = 0.009) were both accurate in differentiating T2-lesions from cBHs with a similar degree of accuracy (p = 0.700) and ES (p = 0.240) (Table 4).
PSR and MTR values and mean differences.
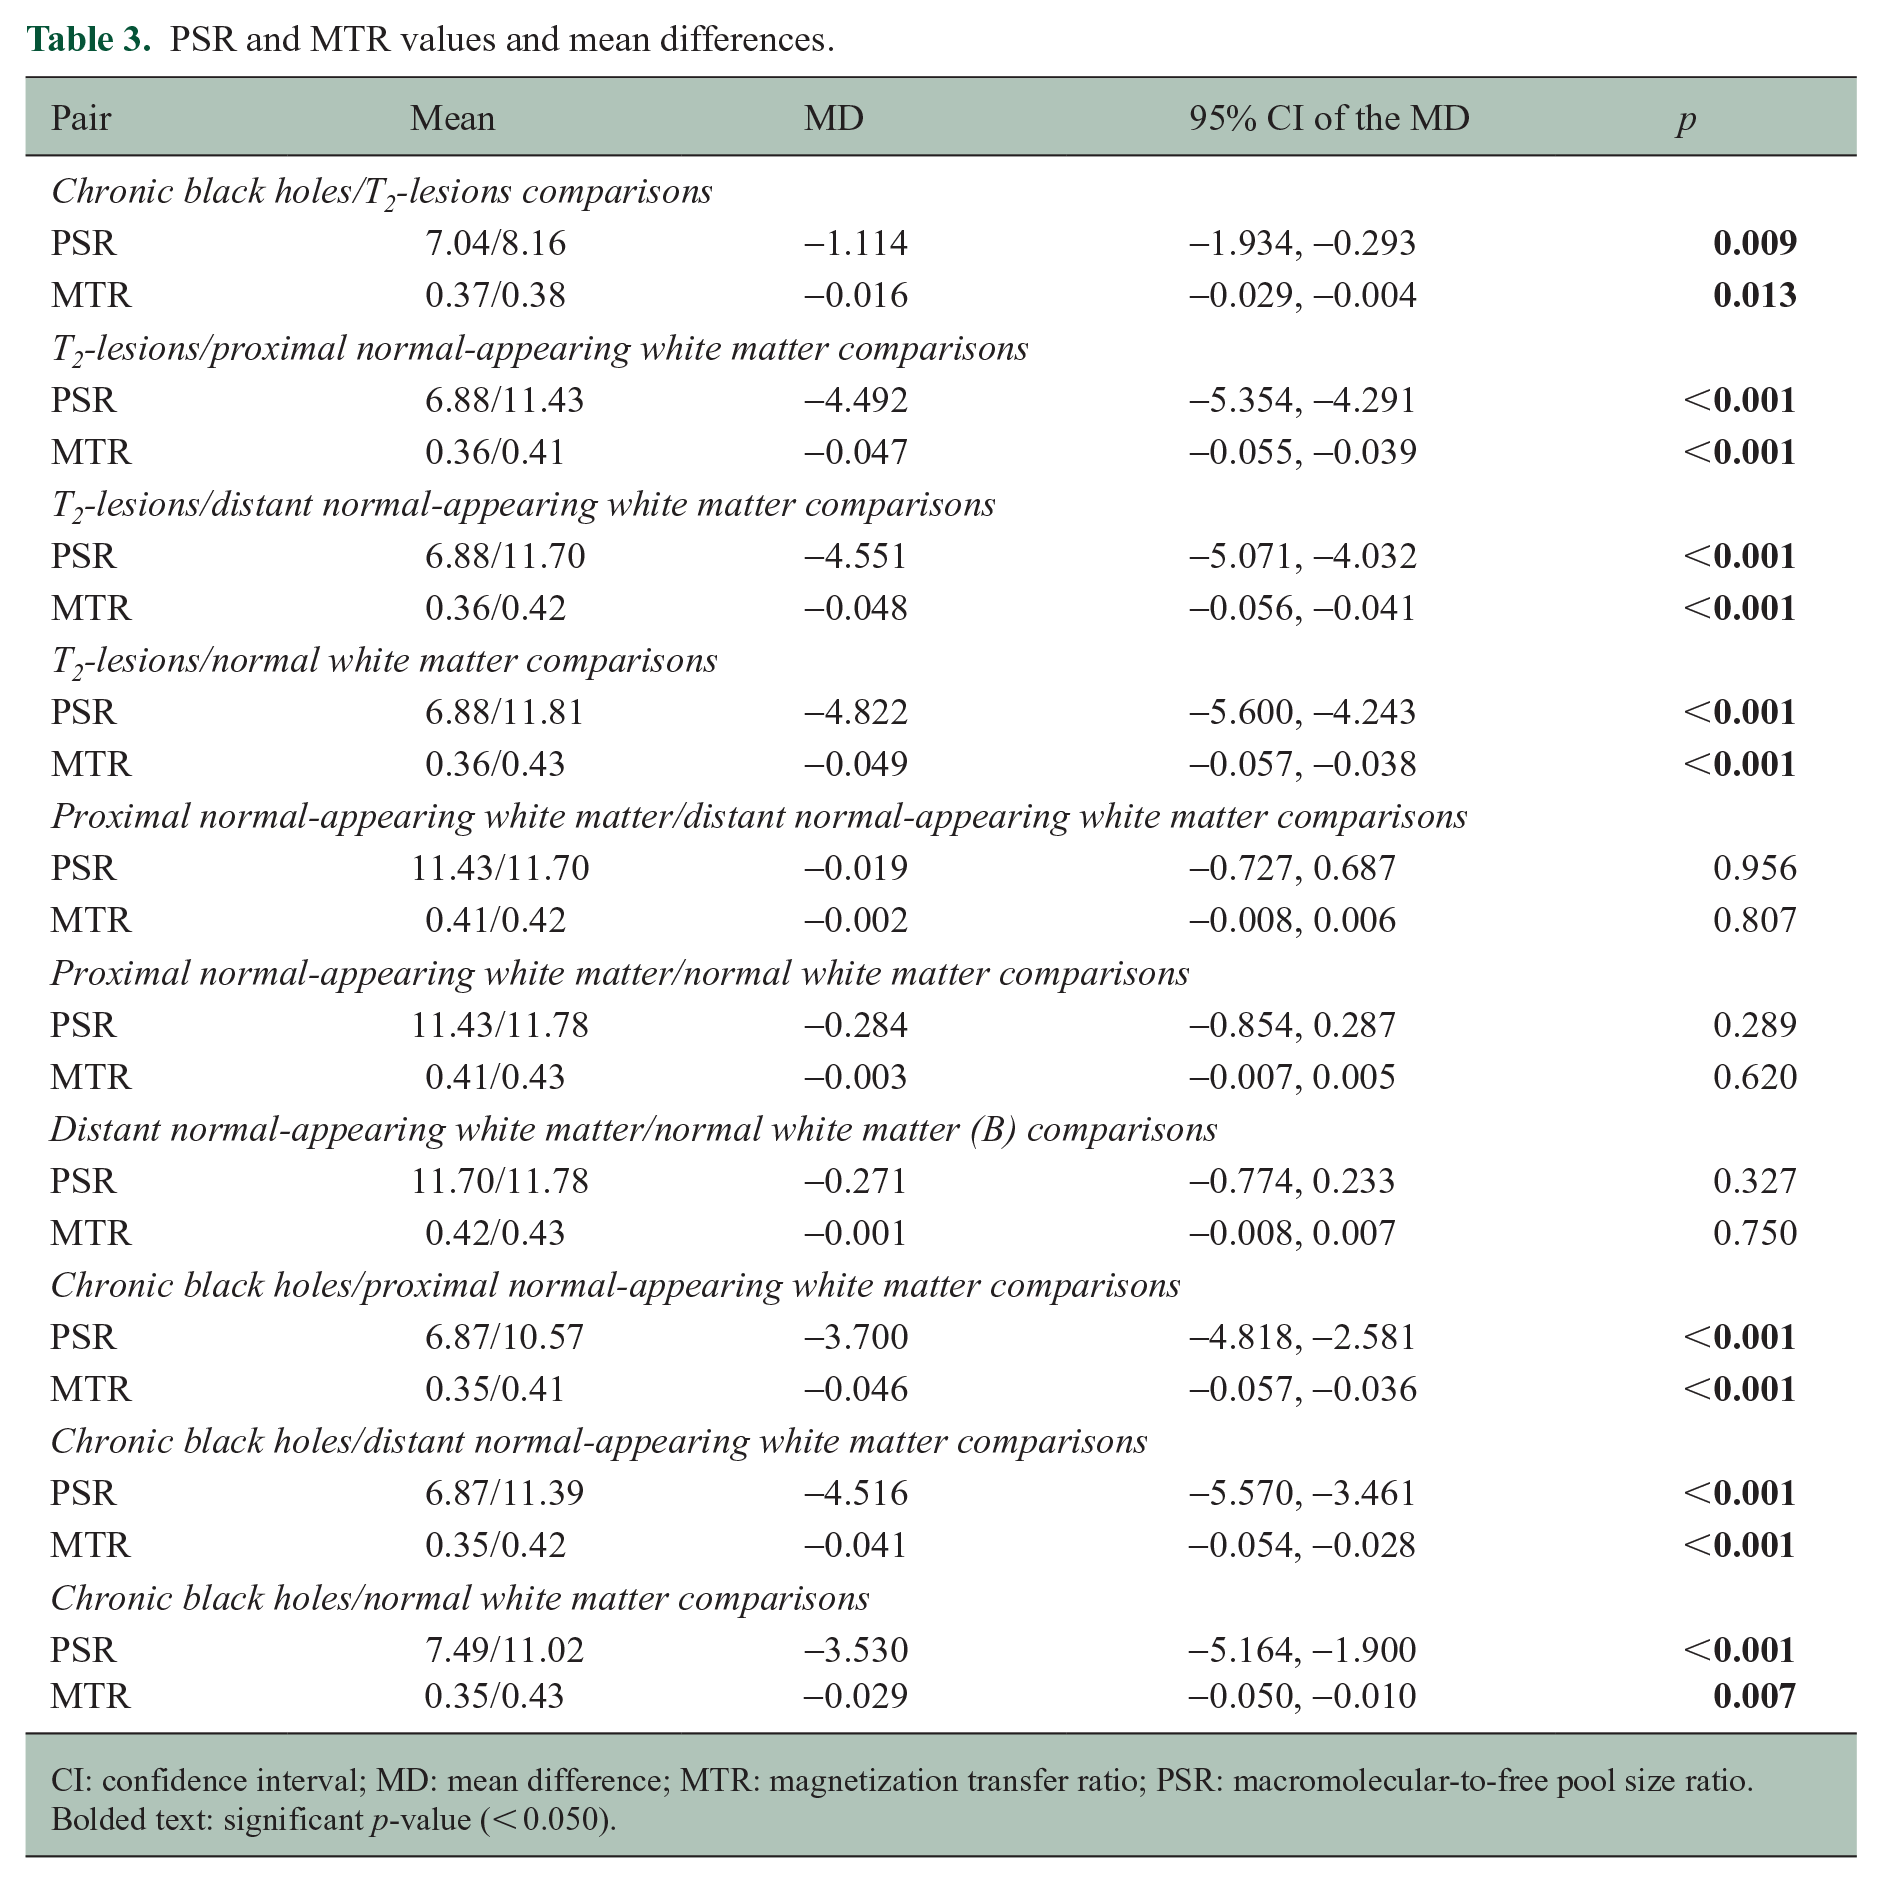
CI: confidence interval; MD: mean difference; MTR: magnetization transfer ratio; PSR: macromolecular-to-free pool size ratio.
Bolded text: significant p-value (< 0.050).
PSR and MTR AUC values.
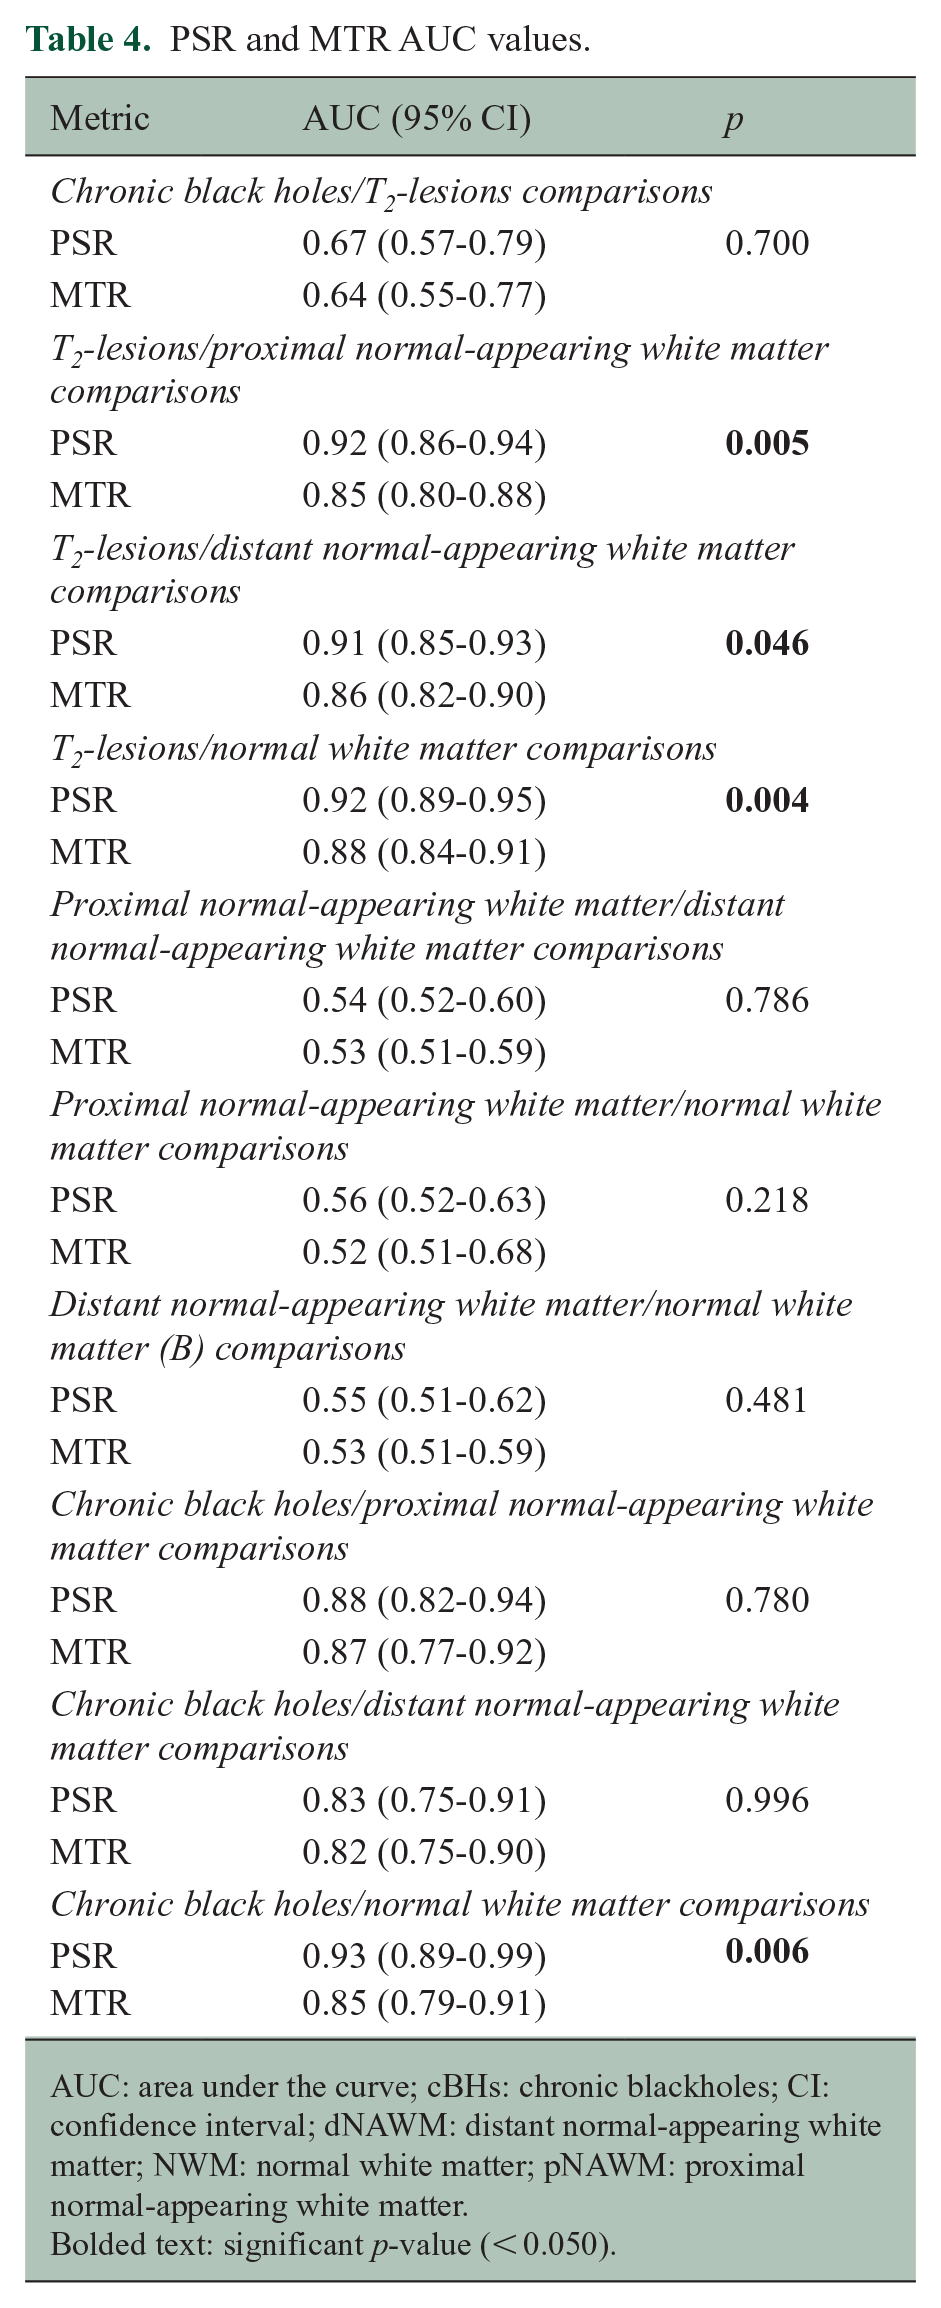
AUC: area under the curve; cBHs: chronic blackholes; CI: confidence interval; dNAWM: distant normal-appearing white matter; NWM: normal white matter; pNAWM: proximal normal-appearing white matter.
Bolded text: significant p-value (< 0.050).
Comparisons between T2-lesions and NAWM/NWM
For this set of comparisons (Figure 1(a)), 150 T2-lesions, 300 anatomically matched pNAWM (e.g. 150 pNAWM ROIs placed anteriorly and 150 pNAWM placed posteriorly to T2-lesions), 150 dNAWM, and 150 NWM ROIs were used. Both PSR and MTR were significantly lower in T2-lesions relative to their corresponding NAWM and NWM ROIs (Table 3). Both PSR and MTR were accurate in distinguishing T2-lesions from pNAWM and dNAWM ROIs (p < 0.001). However, the ROC output demonstrated higher accuracy for PSR when comparing T2-lesions with pNAWM (p = 0.005) and dNAWM (p = 0.046) (Table 4). Relative to MTR, PSR also had higher ES in separating T2-lesions from both pNAWM (MD = −0.70; 95% CI: −1.01, −0.54, p < 0.001) and dNAWM (MD = −0.78; 95% CI: −0.88, −0.51, p < 0.001). The Bland-Altman plots showed that the difference in the ES between PSR and MTR varied as a function of the mean ES value for both comparisons, for example, T2-lesions versus dNAWM (Figure 2(a)) and T2-lesions versus pNAWM (Figure 2(b)).
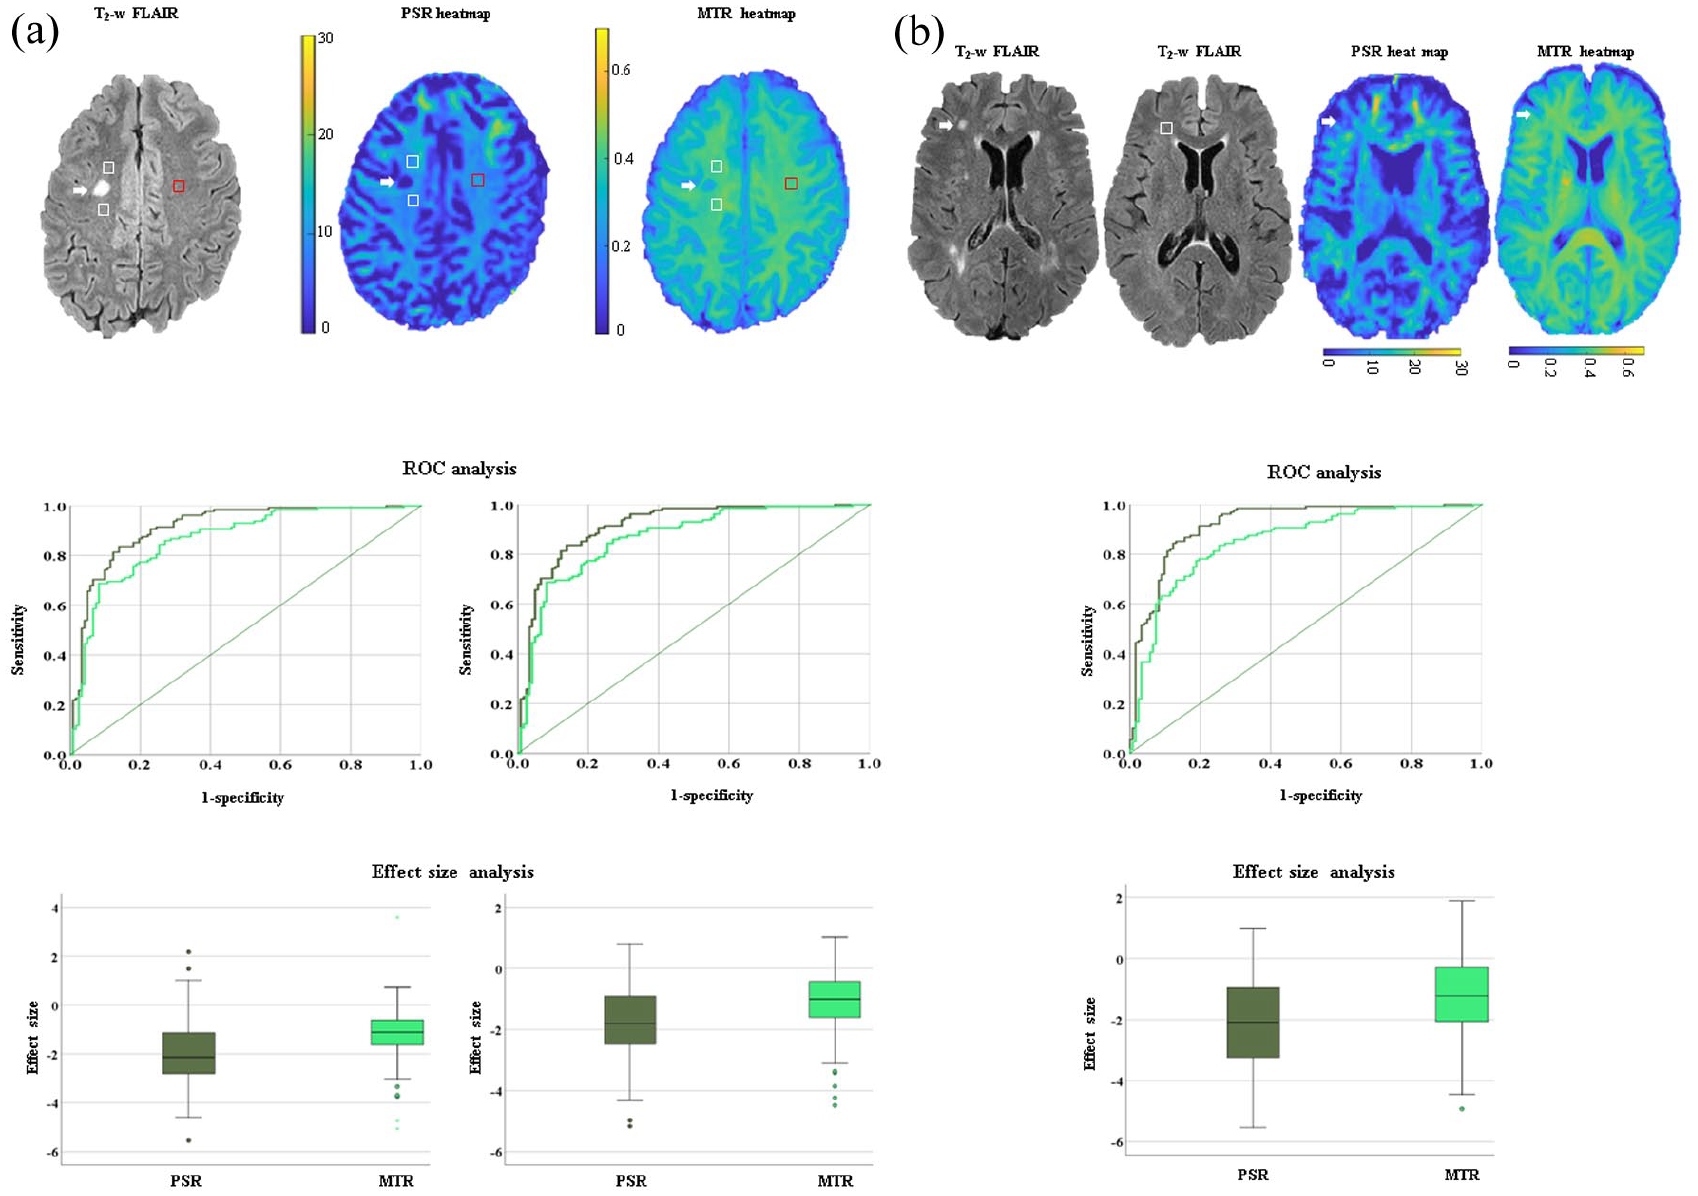
In (a), differences between T2-lesions and normal-appearing white matter (NAWM) regions of interest (ROIs) are shown. As an example of lesions and ROI delineation, we show a T2-lesion (indicated by the white arrow) on the T2-weighted fluid-attenuated inversion recovery (T2-w FLAIR) sequence along with the correspondent proximal (p) and distant (d) NAWM (indicated by the white and red boxes, respectively) on the same image. The same regions are shown on the heat maps of macromolecular-to-free pool size ratio (PSR) and magnetization transfer ratio (MTR), respectively. We also show the receiver operating curves (ROC) that compare the accuracy and the box plots that compare the effect size (ES) of PSR (dark green) and MTR (light green) in distinguishing T2-lesions from pNAWM and dNAWM ROIs arranged from left to right, respectively. In (b), we present differences between T2-lesions of people with multiple sclerosis (MS) and normal white matter (NWM) ROIs in healthy controls (HCs). As an example of lesions and ROI delineation, we show a T2-lesion (indicated by the white arrow on the T2-w FLAIR image of a person with MS) and a correspondent NWM ROI (indicated by the white box on the T2-w FLAIR image of an HC). The same T2-lesion is shown on the heatmaps of PSR and MTR. We demonstrate an ROC that compares the accuracy and a box plot that compares the ES of PSR and MTR in differentiating T2-lesions from NWM ROIs. For both (a) and (b), in the box plot, the box represents the interquartile range, the horizontal line represents the median, and the whiskers represent the 95% confidence interval. In the ROC, the straight line is the reference line.
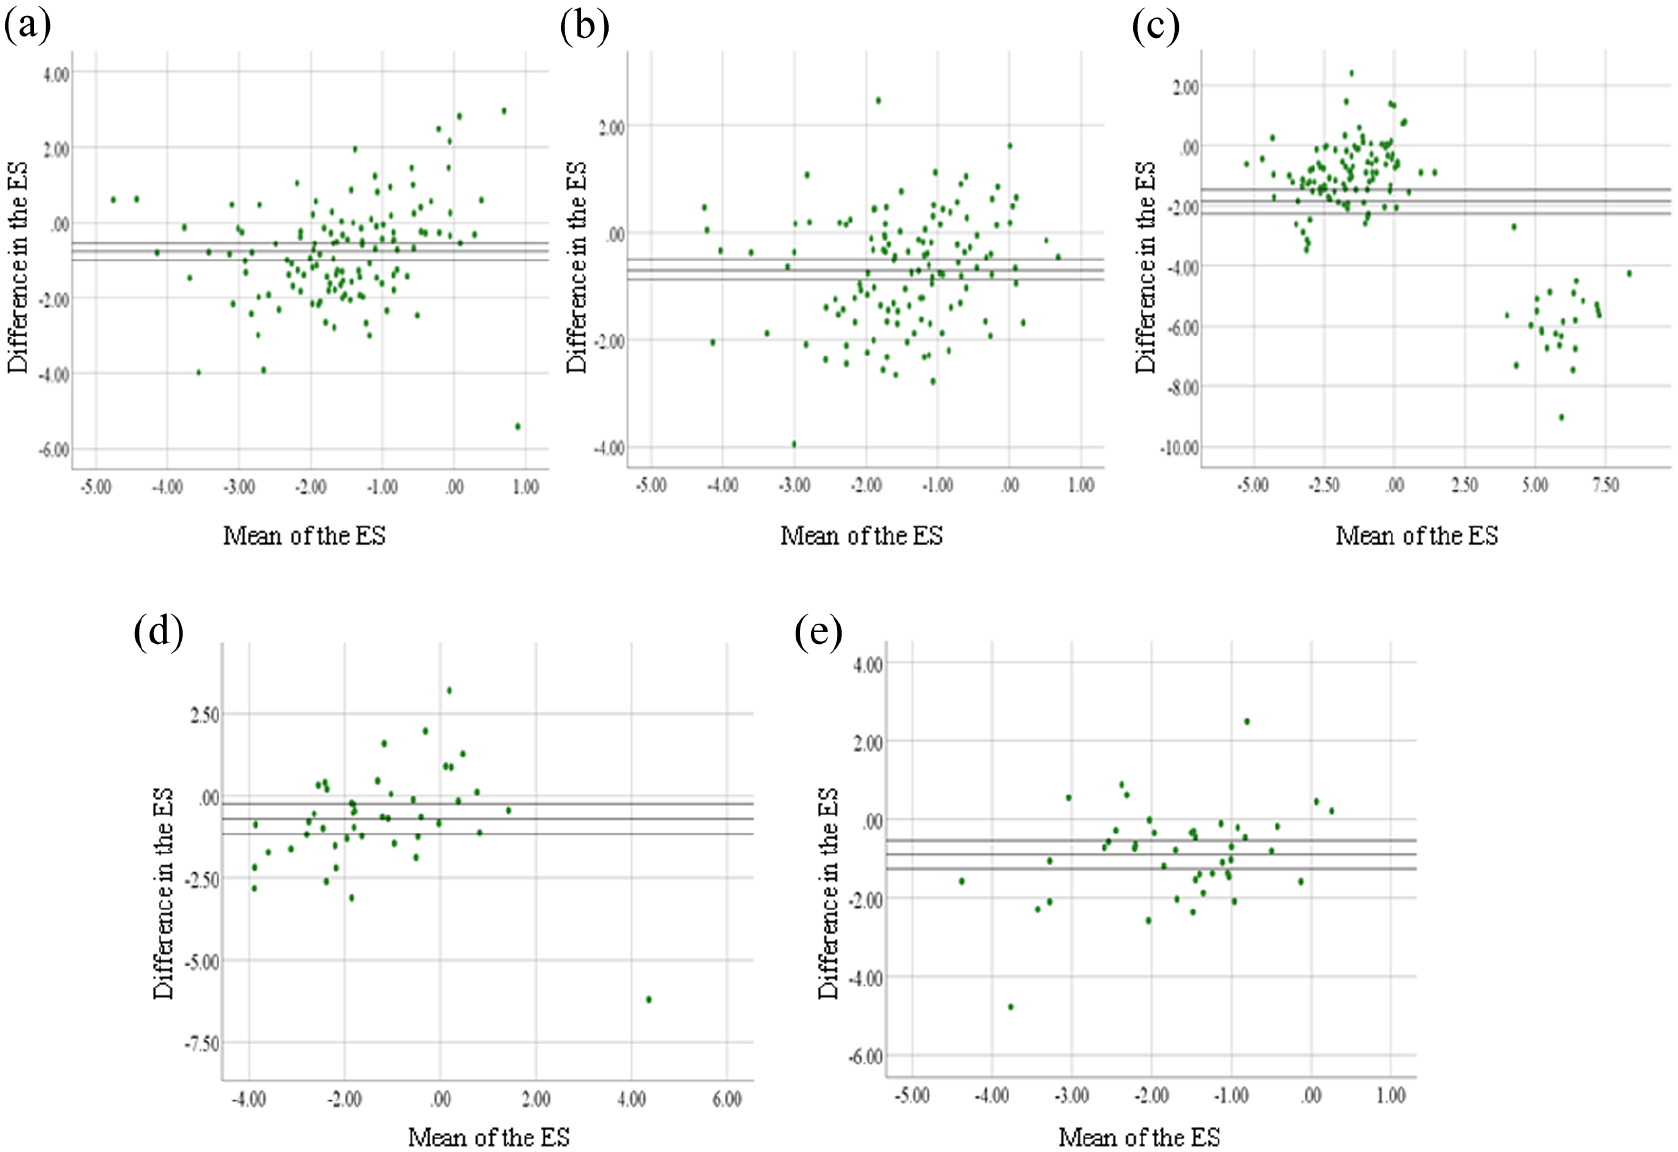
Bland-Altman plots of macromolecular-to-free pool size ratio (PSR) and magnetization transfer ratio (MTR) effect size (ES). The plots of the following pairs are shown: T2-lesions versus distant normal-appearing white matter (dNAWM) (a); T2-lesions versus proximal (p) NAWM (b); T2-lesions versus normal white matter (NWM) (c); chronic black holes (cBHs) versus dNAWM (d); and cBHs versus pNAWM (e). The y-axis shows the mean difference of PSR and MTR ES, while the x-axis shows the mean of the ES for PSR and MTR combined. The black lines represent the mean difference of the ES between PSR and MTR and the upper and lower 95% confidence intervals.
PSR and MTR were significantly lower in T2-lesions compared to NWM ROIs (Table 3). While both were accurate (Figure 1(b)) in distinguishing T2-lesions from NWM (p < 0.001), PSR had greater accuracy (p = 0.004) (Table 4) and ES (MD = −1.86; 95% CI: −2.25, −1.48, p < 0.001) relative to MTR. Bland-Altman plots showed that the difference in the ES between PSR and MTR varied as a function of the mean ES values (Figure 2(c)).
Comparisons between cBHs and NAWM/NWM
For this set of comparisons (Figure 3(a)), 45 cBHs, 90 anatomically matched pNAWM (e.g. 45 pNAWM ROIs placed anteriorly and 45 pNAWM placed posteriorly to the cBH), 45 dNAWM ROIs, and 45 NWM ROIs were used. Both PSR and MTR were significantly lower in cBHs relative to their corresponding pNAWM, dNAWM, and NWM ROIs (Table 3). PSR and MTR were accurate in differentiating cBHs from dNAWM (p < 0.001) and pNAWM (p < 0.001) with no difference between the two metrics (p ⩾ 0.780) (Table 4). Relative to MTR, PSR demonstrated larger ES in distinguishing cBHs from pNAWM (MD = −0.90; 95% CI: −1.25, −0.54, p = 0.003) and dNAWM (MD = −0.71; 95% CI: −1.17, −0.25, p < 0.001). Bland-Altman plots showed that the difference in the ES between PSR and MTR varied as a function of the mean ES values for both comparisons: cBHs versus pNAWM and cBHs (Figure 2(d)) versus dNAWM (Figure 2(e)).
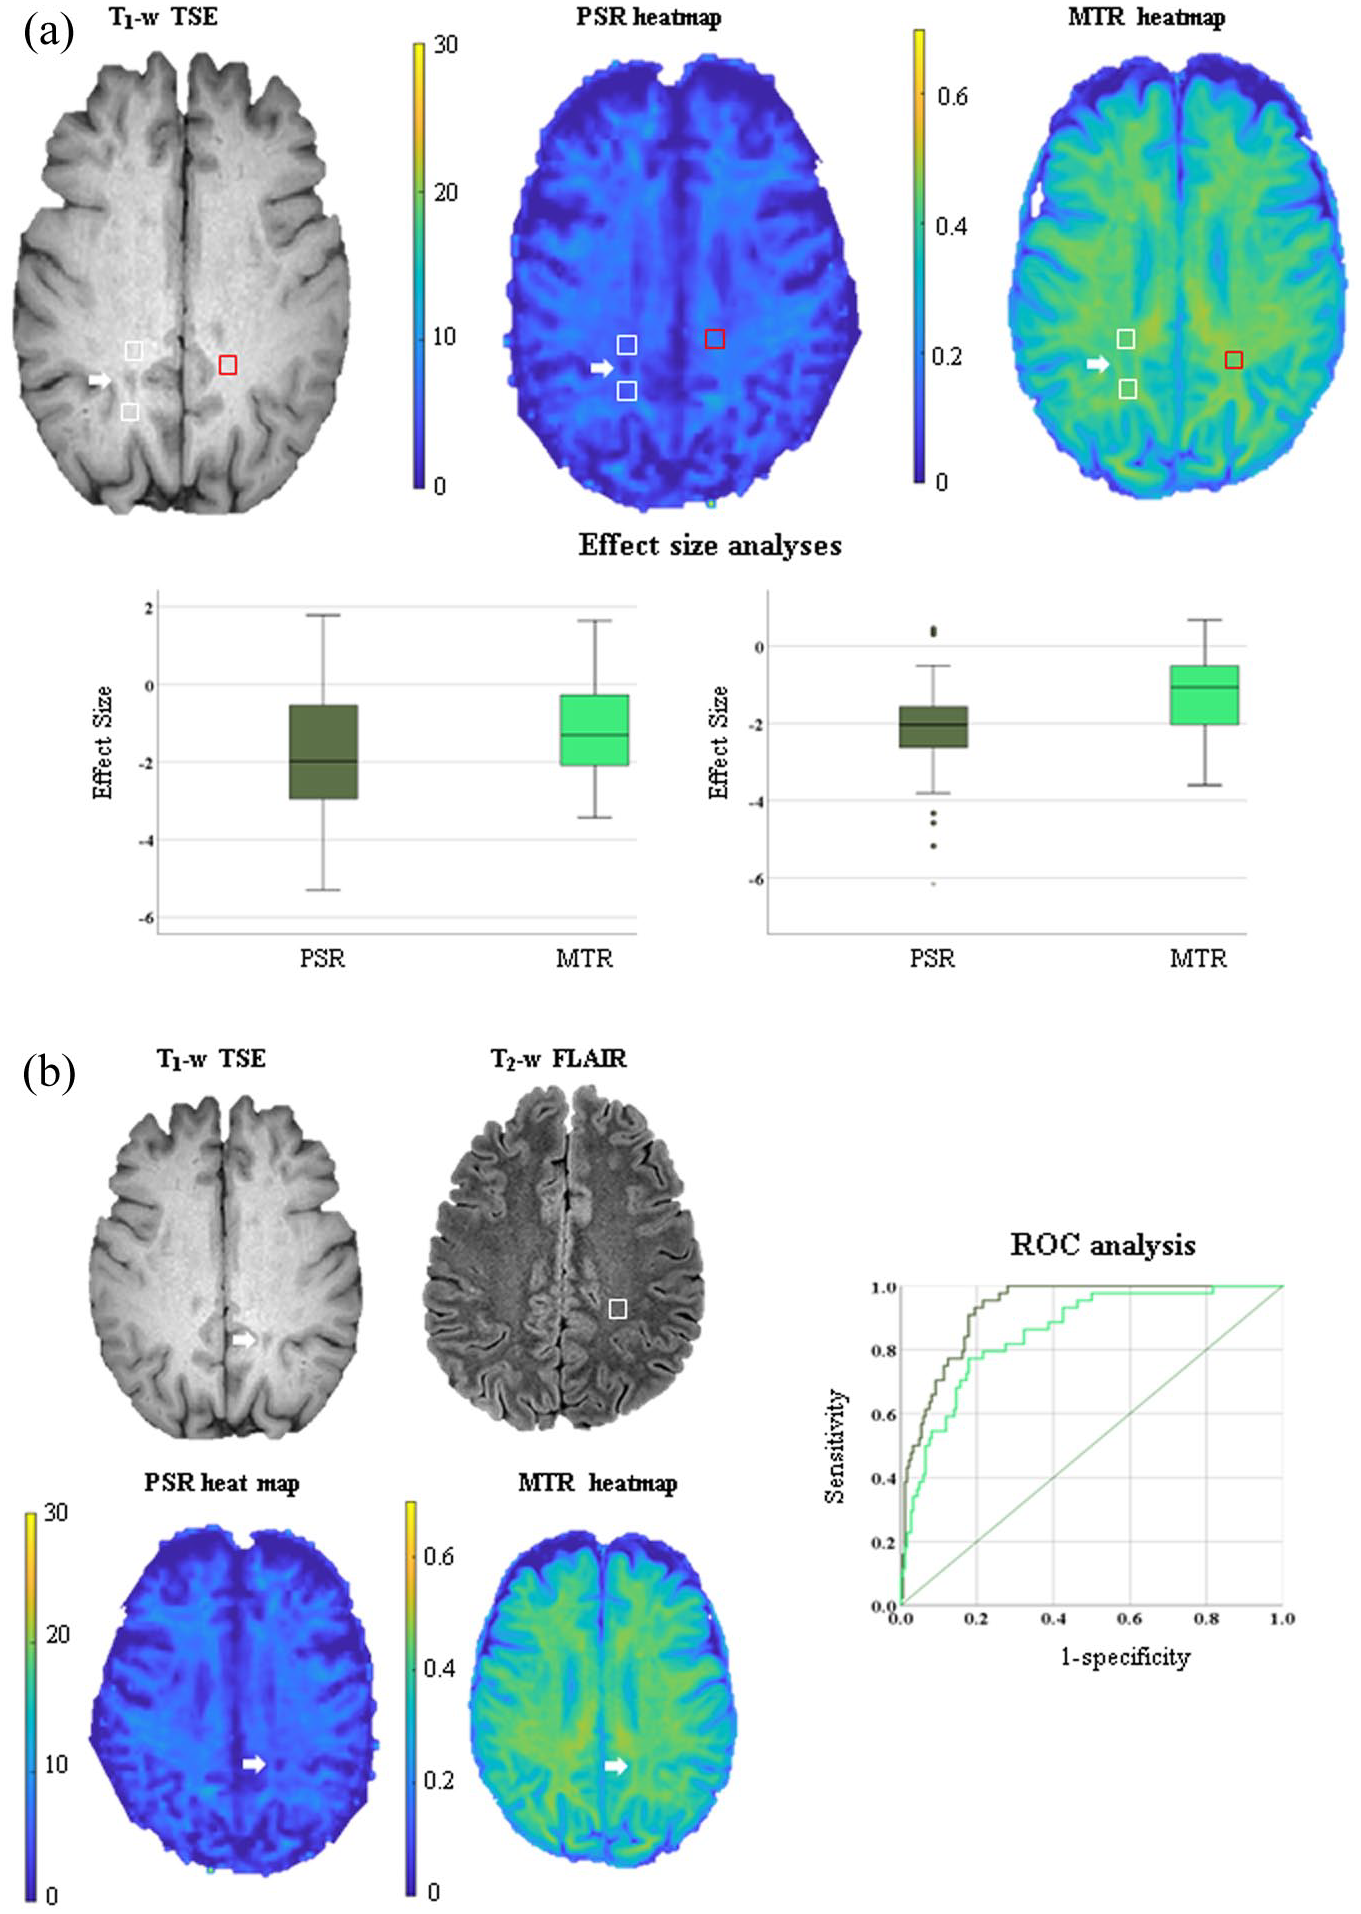
In (a), differences between chronic black holes (cBHs) and corresponding normal-appearing white matter (NAWM) regions of interest (ROIs) are shown. As an example of lesions and ROI delineation, we present a cBH (indicated by the white arrow on the T1-w turbo spin (TSE) echo image) along with the correspondent proximal (p) and distant (d) NAWM (indicated by the white and red boxes, respectively). The same regions are shown on the heat maps of macromolecular-to-free pool size ratio (PSR) and magnetization transfer ratio (MTR). We present comparisons between the effect size (ES) of PSR (dark green) and that of MTR (light green) in differentiating cBHs from pNAWM and dNAWM ROIs arranged from right to left, respectively. In the box plots, the box represents the interquartile range, the horizontal line represents the median, and the whiskers represent the 95% confidence interval. In (b), we present differences between cBHs in people with multiple sclerosis and normal white matter (NWM) ROIs in healthy controls (HCs). As an example of lesions and ROI delineation, the cBH is indicated by the white arrow on the T1-w TSE sequence, while the NWM ROI is indicated by the white box on the T2-weighted fluid-attenuated inversion recovery (T2-w FLAIR). The same cBH is present on the heatmaps of PSR and MTR. We also present the receiver operating characteristics (ROC) curve that compares the accuracy of PSR (dark green) and MTR (light green) in differentiating cBHs from NWM ROIs. In the ROC curve, the straight line is the reference line.
When looking at differences between cBHs and NWM (Figure 2(b)), we noted that both PSR and MTR were significantly lower in cBHs relative to NWM (Table 3). Both PSR and MTR were also accurate in distinguishing cBHs from NWM (p < 0.001), but PSR had greater accuracy (p = 0.006) (Table 4). There was no difference in the ES between PSR and MTR in separating cBHs from NWM (p = 0.426).
Comparisons between NAWM and NWM
For this set of comparisons, 450 NAWM and 150 anatomically matched NWM ROIs were assessed. PSR and MTR did not differ between pNAWM and dNAWM ROIs or between pNAWM/dNAWM and NWM ROIs (Table 3). ROC analysis (data not shown) demonstrated that PSR (p = 0.014) and MTR (p = 0.006) were accurate in differentiating pNAWM from dNAWM. There were no differences in accuracy (p = 0.786) (Table 4) or ES (p = 0.691) between the two metrics. PSR and MTR were accurate in differentiating pNAWM and dNAWM ROIs from NWM ROIs (p < 0.001 for all) with no difference in accuracy (p ⩾ 0.218) (Table 4) or ES (p ⩾ 0.403) (data not shown).
Correlations between radiologic and clinical metrics
After correction for multiple comparisons, only T2-lesion MTR correlated with cBHs PSR (r = 0.547, p = 0.001) and T2-lesion volumes with EDSS scores (r = 0.545, p = 0.002). Table 5 details the results of these correlation analyses.
Associations between clinical and radiological variables.
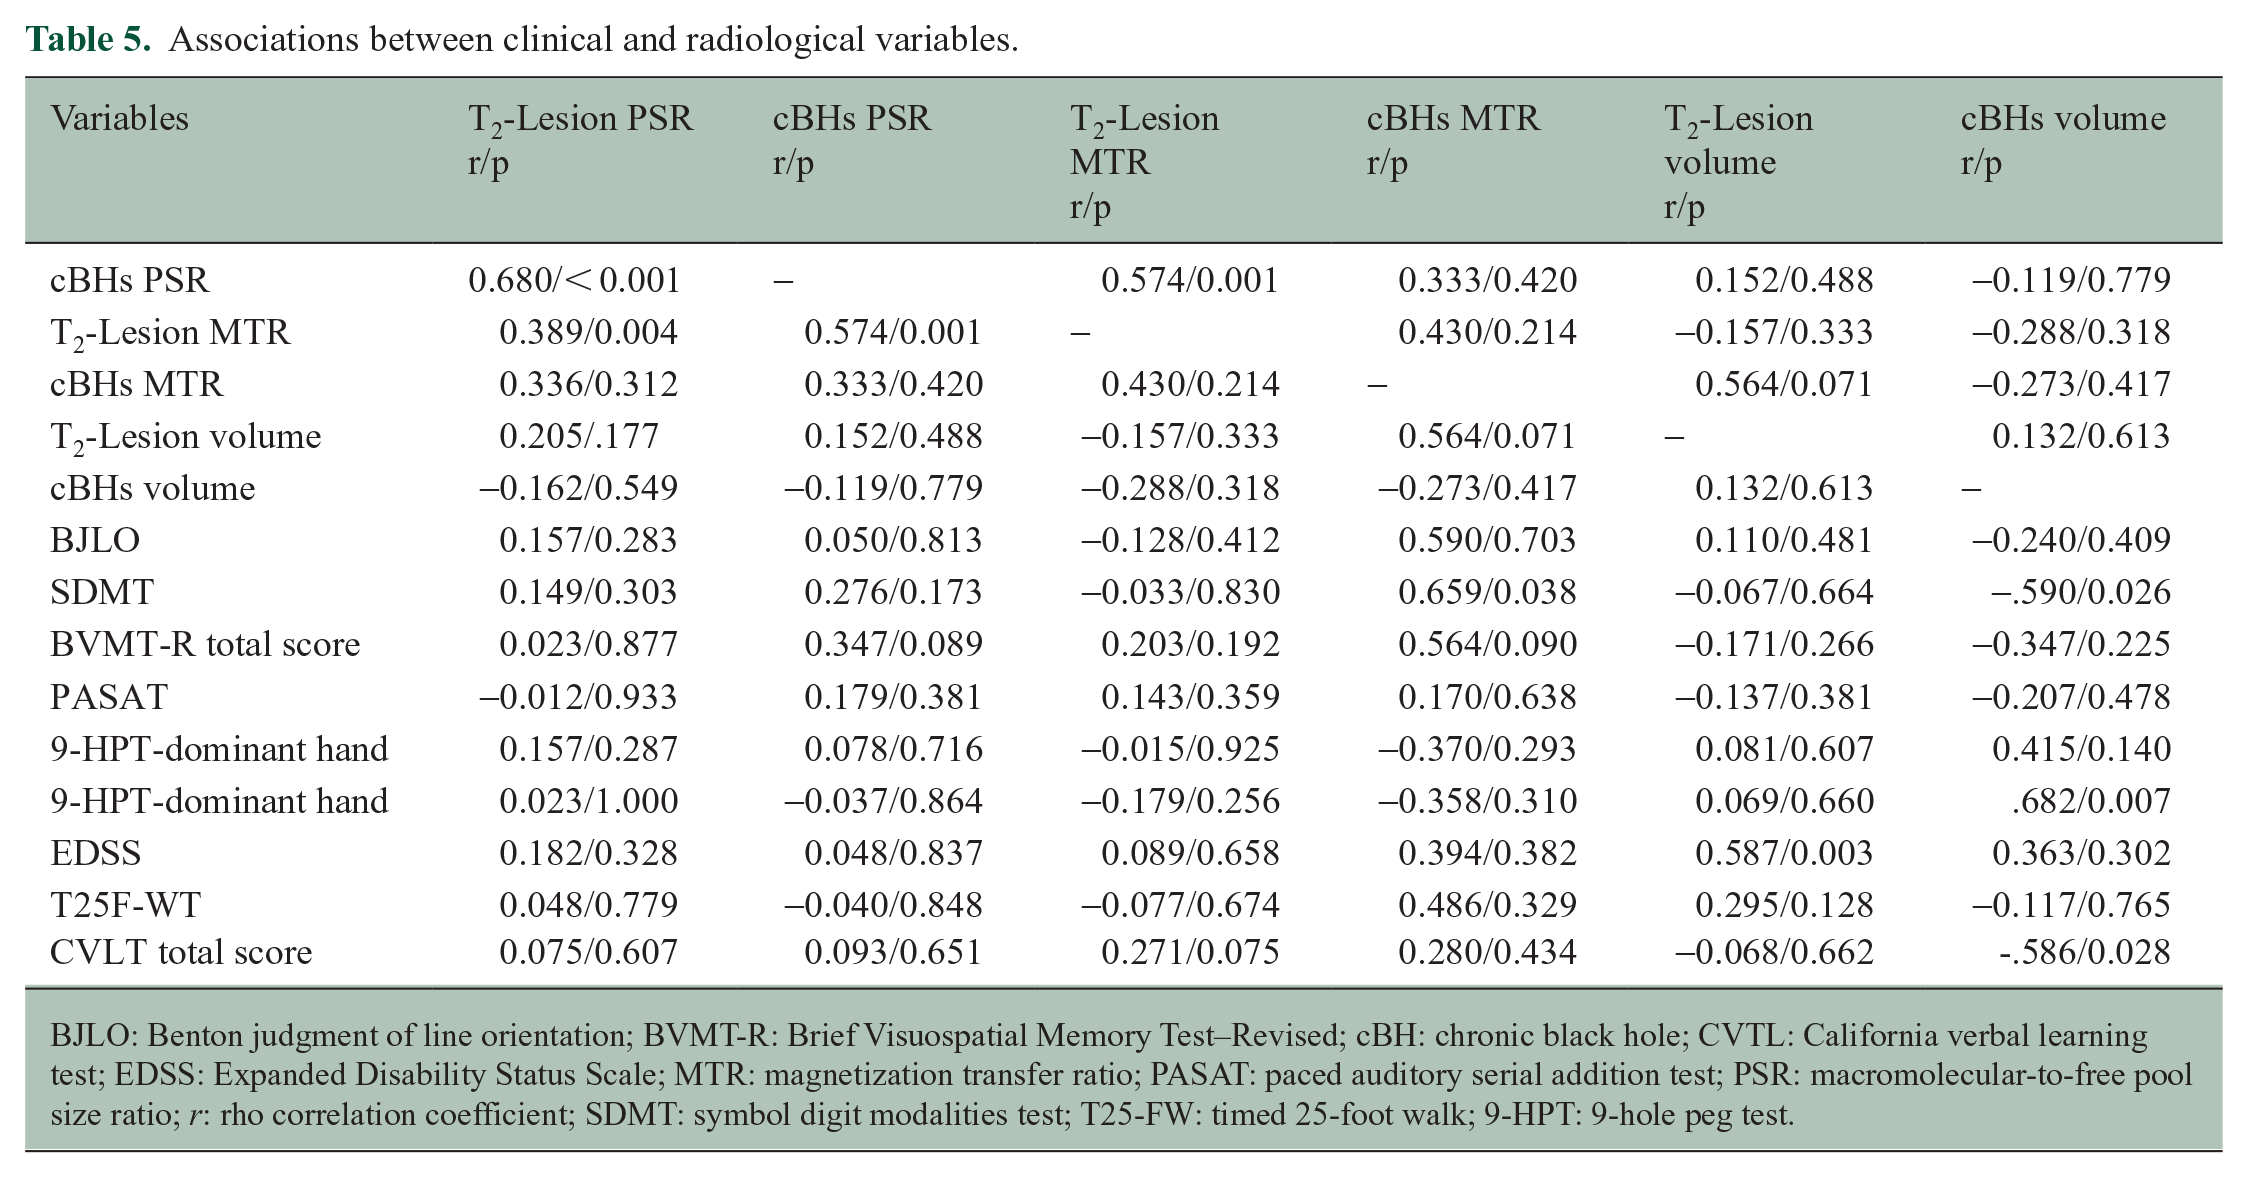
BJLO: Benton judgment of line orientation; BVMT-R: Brief Visuospatial Memory Test–Revised; cBH: chronic black hole; CVTL: California verbal learning test; EDSS: Expanded Disability Status Scale; MTR: magnetization transfer ratio; PASAT: paced auditory serial addition test; PSR: macromolecular-to-free pool size ratio; r: rho correlation coefficient; SDMT: symbol digit modalities test; T25-FW: timed 25-foot walk; 9-HPT: 9-hole peg test.
Discussion
In this study, we compared the ability of PSR and MTR in differentiating tissues with expected varying degrees of myelin injury in MS.
Several methods are available to approximate measurements of myelin integrity in vivo. Among those, MPRAGE derived T1 26 maps and T1 to T2 ratio (T1/T2)27,28 are clinically appealing due to their relatively simple post-processing methodologies. Although both metrics distinguish tissues with different degrees of structural injury,26–28 the pathological specificity of these measures is unkwnon. 29 For example, a previous study based on 22 PwMS showed that both T1/T2 and MTR values differed between tissues with various degrees of pathology but were only moderately correlated to each other, suggesting that T1/T2 is impacted by other factors aside from myelin quantity. 29 Ropele and collaborators demonstrated that opposite to MTR, T1 measurements were not able to discriminate NAWM from NWM. 30 The authors attributed the findings to the sensitivity of T1 values to edema and iron, aside from myelin. 27 Therefore, although sensitive to myelin injury, T1 and T1/T2 measurements are unlikely to reach the same specificity of MTR and PSR.
Our data demonstrate that PSR is more accurate than MTR in distinguishing T2-lesions and cBHs from NAWM and NWM. We explain our results related to T2-lesions with the expected greater pathological specificity of PSR relative to MTR, given the physics premises of both metrics. T2-lesions that do not have a correspondent cBH are considered areas with mainly myelin loss with minimal to absent axonal injury. 31 MTR is based on the ratio of signals; therefore, it is semi-quantitative and contains a mixture of contrast weightings. 32 In addition to myelin content, the contrasts include contamination from T1 relaxation time and the exchange rate between myelin and water protons. 32 In contrast, SIR-qMT fully models the effect of magnetization exchange between myelin-related macromolecules and water protons, resulting in a more quantitative and direct assessment of myelin content. 19
Unlike T2-lesions, cBHs are regarded as lesions with more axonal loss, although not necessarily fully depleted of myelin, which can still be present in debrides. Neither PSR nor MTR is considered specific to axonal loss.33,34 In contrast to MTR, PSR is considered relatively immune to water accumulation. 5 Thus, it is likely that PSR is selectively capturing changes in myelin content still measurable in cBHs, while MTR is largely affected by free water content, along with myelin degradation.
There were no significant differences in accuracy between PSR and MTR in differentiating pNAWM from dNAWM, NAWM from NWM, or T2-lesions from cBHs. This finding might be explained by the low differences in myelin content between these tissues, given the very early stage of disease of our study cohort.
There are no in vivo studies in literature comparing PSR and MTR performance; thus, we are unable to challenge our data with previous work. The abundance of work is indeed focused on the use of PSR and MTR in isolation. An in vivo study evaluated PSR and MTR separately by comparing PwMS to HCs values in the spinal cord. The authors demonstrated that PSR but not MTR distinguished WM and gray matter of PwMS from the same regions in HCs. 35
In line with our accuracy-related data, we observed that PSR had a larger ES in classifying T2-lesions from NAWM and NWM. Specifically, the Bland-Altman plots demonstrated that differences in ES varied as a function of its mean, indicating a systematic bias in the method with the lower ES, that is, MTR. Such bias would lead to overestimation of the myelin quantity in healthy tissue and underestimation of myelin quantity in injured areas. We also did not observe differences between the degrees of PSR and MTR numerical separation in distinguishing pNAWM from dNAWM and NAWM from NWM. Interestingly, a larger ES was seen for PSR in the separation between cBHs and NAWM but not NWM. The explanation of the disconnection between ROC and ES results seen for cBHs is largely unknown but likely to be ascribed to the complex pathology of cBHs. 34 These lesions may contain variable degrees of myelin either in the shape of debris or intact around remaining axons. Furthermore, the assessment of cBHs in a cross-sectional design is limited by the presence of subacute, possibly edematous lesions that also appear as hypointense on T1-w sequences. Thus, it is more plausible that an index of myelin integrity is less consistent for these lesions. Supportive data from independent, larger, and longitudinal cohorts are needed to challenge our interpretations.
After correction for multiple comparisons, we did not find any significant correlations between radiological metrics and clinical disability scores. Lack of clinic-radiological correlations can be attributed to the small sample size of our cohort. Furthermore, we assessed a cohort of patients with relatively homogeneous low levels of disability, given that they were all newly diagnosed. This factor as well significantly affected the output of our analyses.
Study limitations
Several limitations need to be addressed prior to drawing definitive conclusions. First, the relatively small sample size limited subgroups’ analyses focused on patients with distinct disease phenotypes, for example, CIS, RIS, or MS. Second, lack of longitudinal assessment precludes comparing the sensitivity, specificity, and accuracy of PSR and MTR in detecting microstructural changes over time. This element is important to understand the value of PSR as measures of outcome in clinical trials. Specifically, assessing CELs evolution is paramount to further elucidating the potential of PSR as biomarker of remyelination.
Third, we recognize that SIR-qMT has longer acquisition time than MTI. As with many quantitative imaging methods, SIR-qMT and conventional MTI involve tradeoffs. For example, because SIR-qMT requires longer acquisition times, it also typically forces relatively low-resolution acquisitions to remain clinically applicable. However, prior MRI/histopathology studies 36 and the results of the current work support the notion that SIR-derived PSR values are more specific to changes in myelin content in MS. As such, the additional scan time for SIR may be justifiable for specific research and clinical settings. Furtherore, although scan time is a factor that may hinder clinical translation at the moment, it is anticipated that advances in scanner technology and SIR-qMT design will further reduce scanning time. Toward this end, remarkable improvements 19 were made possible by reducing the recovery time, applying an acceleration factor and increasing the efficiency of 3D readouts. 19 Another limitation is the difference in the resolution between PSR and MTR. The MTR acquisition was part of a clinical multiparametric protocol, and thicker slices were selected to maintain acceptable exam times. We tried to account for this limitation by analyzing only large lesions, (> than 10 voxels of the MTR maps), to reduce biases from differential partial volume effects; however, through-plane partial volume averaging remains a concern which warrants further investigations.
Fourth, it is important to note that different areas of the brain vary in the amount of myelin. We performed anatomical matching analysis along with paired tests to minimize the impact of this variation, but this may not be sufficient given the lack of tractography maps.
Conclusion
Our study provides preliminary evidence that PSR might be a better detector of myelin injury compared to MTR in the context of chronic MS disease. MTR measurements have been employed in the two past decades, 37 yet their adoption did not grow due to the well-known limitations we discussed above. Here, we propose a more accurate and feasible alternative that has the potential to overcome these limitations. Work is ongoing in our group to assess if our results persist in patients with more advanced disease and longitudinal cohorts.
Footnotes
Acknowledgements
The authors are grateful to their patients and their families and all the healthy controls who agreed to participate in this study. The authors thank Mr Reece Clarke and Keejin Yoon for their invaluable help in setting up the study along with all the MRI technicians of the Vanderbilt University Institute of Imaging Science for assistance with scanning. The authors also thank Ms Pragnya Adapa and Ms Salma Ashshareef for their assistance with initial lesion masking and scanning. The authors thank the reviewers of this manuscript for their insightful comments which substantially improved the way our work is presented. This manuscript is dedicated to the sweet memory of Mr. Oscar Castro.
Data Availability Statement
Data are available upon reasonable request to the corresponding author and upon a between institutions data use agreement.
Declaration of Conflicting Interests
The author(s) declared no potential conflicts of interest with respect to the research, authorship, and/or publication of this article.
Funding
The author(s) disclosed receipt of the following financial support for the research, authorship, and/or publication of this article: This study was primarily supported by the Veterans Health Administration (I01CX002160-01A1: A.T., J.E.E., T.V., J.X., and F.B.). Additional support includes the National MS Society (RG-1901-33190: A.T., C.G., T.V., F.B. and RG-2111-38720: R.D.).