
Abstract
Background:
The cerebellum is a functionally and anatomically complex structure, which, in multiple sclerosis (MS), is affected by focal white/gray matter lesions and by secondary neurodegeneration of afferent/efferent connections to the supratentorial brain and the spinal cord.
Objectives:
To assess the efficacy of ocrelizumab compared with interferon β-1a (IFN β-1a)/placebo on cerebellar volume loss and the effect of switching to ocrelizumab on volume change in the Phase III trials in relapsing MS (RMS, OPERA I/II) and in primary progressive MS (PPMS, ORATORIO).
Methods:
Cerebellar volume change was computed using paired Jacobian integration and analyzed using a mixed-effect repeated measurement model.
Results:
In RMS, ocrelizumab reduced cerebellar volume loss in the double-blind period (DBP) and the difference (30% at DBP end) was maintained in the open-label extension (OLE) after control patients (IFN β-a) were switched to ocrelizumab. In PPMS, there was a small numerical difference in the DBP, but a larger (up to 22%) difference in favor of ocrelizumab in the OLE.
Conclusions:
In both RMS and PPMS, early treatment with ocrelizumab helps to prevent additional cerebellar volume loss compared with delayed switching to ocrelizumab. Further analysis is needed to fully understand the clinical impact of cerebellar atrophy.
Introduction
The cerebellum is a functionally and anatomically complex structure, involved in motor, higher-order cognitive, and emotional functions. 1 In multiple sclerosis (MS), the cerebellum is affected by focal white and gray matter lesions,2,3 and by secondary neurodegeneration of multiple afferent and efferent connections to the supratentorial brain and to the spinal cord. 4 Cerebellar volume loss in all stages of MS has been highlighted by previous magnetic resonance imaging (MRI) studies. These studies showed an increased cerebellar volume loss in MS compared with healthy controls5–7 and the presence of significant atrophy in all clinical disease courses, including clinically isolated syndrome.5,6 A recent MRI study has indicated that ocrelizumab has the potential to reduce cerebellar volume loss in relapsing MS (RMS). 8 However, larger cohorts and longer-term follow-up are still needed to better understand the extent and dynamics of cerebellar changes. Therefore, we analyzed a large dataset of patients with RMS and primary progressive MS (PPMS) from three randomized controlled trials (OPERA I/II 9 and ORATORIO, 10 respectively), to assess the effect of ocrelizumab on cerebellar volume changes. Our aims were to evaluate: The efficacy of ocrelizumab during the double-blind periods (DBPs); the effects of switching to or maintaining ocrelizumab in the open-label extensions (OLEs); the similarities and differences in cerebellar volume loss between patients with RMS and PPMS; and the prognostic relevance of baseline cerebellar volume in determining future disability progression.
Materials and methods
Trial design and population
OPERA I (NCT01247324), OPERA II (NCT01412333), and ORATORIO (NCT01194570) trials have been described previously.9,10 Briefly, OPERA I/II (hereafter referred to as OPERA) were two Phase III, multicenter, randomized, double-blind, double-dummy, interferon β-1a (IFN β-1a) controlled trials with identical designs, in patients with RMS. Key eligibility criteria included an age of 18–55 years, MS diagnosis according to 2010 revised McDonald criteria, 11 and a screening Expanded Disability Status Scale (EDSS) score of 0.0–5.5. Following completion of the 96-week DBP of both trials, patients maintained or switched to ocrelizumab (IFN β-1a–ocrelizumab), given every 24 weeks. ORATORIO was an international, multicenter, Phase III, randomized, parallel-group, double-blind, placebo-controlled trial investigating efficacy and safety of ocrelizumab in patients with PPMS. Key eligibility criteria included an age of 18–55 years, a diagnosis of PPMS by the McDonald 2005 criteria, 12 and a screening EDSS score of 3.0–6.5. ORATORIO had three treatment periods: The DBP, an extended controlled period (ECP), and the OLE. The DBP lasted at least 120 weeks until a prespecified number of 12-week confirmed disability progression events on EDSS (CDP12-EDSS) occurred. The subsequent ECP spanned from the end of the DBP to the first OLE dose of ocrelizumab for each individual. Patients entered the OLE between 144 and 294 weeks after randomization, where patients maintained or switched to ocrelizumab (placebo–ocrelizumab), given every 24 weeks. 13
The OLEs of all trials are ongoing and the data for this analysis were collected approximately to the end of 2020. By this cut-off date, patients had been exposed to ocrelizumab for up to 8 years (6 in OLE) in OPERA, and for up to 7.5 years (5 in OLE) in ORATORIO. The relevant institutional review boards/ethics committees approved the trial protocols and all patients provided written informed consent.
MRI volume measurements
In OPERA, MRI assessments were conducted at baseline, weeks 24, 48, and 96 in the DBP, and yearly in the OLE (OLE weeks 46, 94, 142, 190, and 238). In ORATORIO, MRI scans were acquired at baseline, weeks 24, 48, and 120 in the DBP, and at baseline (OLE day 1) and yearly thereafter in the OLE (OLE weeks 48, 96, and 144). As timings of MRI assessments in the ORATORIO OLE differed between patients relative to randomization, OLE MRIs were categorized relative to OLE entry date. 13
Whole brain, cerebellar volume, cerebral cortical gray, and white matter, all normalized by head size, were assessed using baseline MRIs. The whole brain, cerebral cortical gray, and white matter masks were derived from SIENAX (Structural Image Evaluation, using Normalization, of Atrophy (SIENA) and the cross-sectional version of SIENA), 14 and the cerebellum mask was derived using Brain Tissue Classification software developed by NeuroRx Research, which uses a multi-atlas label fusion approach for tissue segmentation. Relative percentage change from baseline was obtained for each subsequent visit using SIENA, 14 for whole brain, and paired Jacobian integration 15 for the rest. The paired Jacobian integration analysis was performed using in-house software that calculates the change in the local deformation from the nonlinear registration between the pair of images. 16 T1-weighted three-dimensional (3D) images and whole brain coverage acquired during the studies were used for those assessments. No distinction between white and gray matter in the cerebellum was performed.
For both cross-sectional and longitudinal assessment, the MRI scan resolution was 0.97 × 0.97 × 3 mm. Sequences used for the cross-sectional assessment included a 3D Gradient Recalled Echo T1-weighted, two-dimensional (2D) Turbo Spin Echo (TSE) T2-weighted, 2D TSE Fluid Attenuated Inversion Recovery and a 2D TSE Proton-density (PD) weighted sequence. The longitudinal assessment is based on the T1-weighted scan. A T2 lesion was defined as an area of abnormally increased signal intensity in the brain parenchyma on either a PD-weighted or T2-weighted image relative to the surrounding normal-appearing white matter. MRI readers performed a segmentation of the scans based on starting labels provided by automatic segmentation software using a Bayesian classifier with anatomical prior knowledge. 17
A subset of patients in OPERA II participating in a single-center substudy received additional nonconventional imaging (advanced 3T MRI), including mcDESPOT (spoiled gradient recalled echo (SPGR): repetition time (TR) = 6.5 milliseconds; echo time (TE) = 3.6 milliseconds; α =[2, 3, 4, 6, 9, 13, 18]°, balanced steady-state free precession (bSSFP): TR = 5.8 milliseconds; TE = 2.9 milliseconds; α =[7, 11, 15, 19, 24, 30, 47] acquired with phase-cycling patterns of 0 and 180, inversion recovery SPGR (IR-SPGR): TR = 6.5 milliseconds; TE = 3.2 milliseconds; α = 5°; inversion time (TI) = 450 milliseconds; voxel size = 1.7 × 1.7 × 1.7 mm and field of view (FOV) = 220 × 160 × 220 mm). From mcDESPOT, myelin water fraction (MWF) and quantitative T1 maps (QT1) were derived.
Statistical analysis
All analyses used the intent-to-treat (ITT) population and the OPERA trials were pooled. Missing data were not imputed. All statistical tests were exploratory and no adjustment for multiplicity was applied. The significance level of statistical tests was set at 5%. Analyses were performed in SAS 9.4 and R version 3.6.3. Random coefficient models were analyzed on the latter environment using package LME4 version 1.1.23.
Association between cerebellar volume and population characteristics at baseline
DBP baseline associations between normalized cerebellar volume and population characteristics were assessed through Spearman’s correlations for continuous variables or Wilcoxon rank-sum tests for categoric variables.
Longitudinal evaluation of cerebellar volume
Percentage change of cerebellar volume from DBP baseline was computed using a mixed-effect model of repeated measures (MMRM) including factors for time, treatment, treatment × time, and treatment × baseline cerebellar volume and adjusted for baseline characteristics: that is, age; region (United States vs rest of the world); EDSS category (< 4, ⩾ 4); normalized cerebellar volume; presence/absence of T1 gadolinium (Gd)-enhancing lesions; and T2 lesion volume.
Additional predictors of cerebellar atrophy were assessed in linear random coefficients mixed-effect models, in which treatment, region, time, treatment × time (for evaluating slope differences), and baseline characteristics (EDSS category, age, normalized cerebellar volume, presence/absence of T1 Gd-enhancing lesions, T2 lesion volume, and previous relapses on past year ⩽ 1 vs > 1, for OPERA) were entered as fixed effects. Participant and time (study day of the assessment) were included as random intercept and slopes, respectively. Model and bootstrapped estimates were retrieved. From random effect models, annualized percentage change were computed as ((adjusted slope estimate)/(adjusted mean at hypothetical baseline) × 100).
To assess the relationship between changes in cerebellar volume and other MRI measures (i.e. whole brain, white and cortical gray matter, supratentorial T2 lesion volume), a Spearman’s correlation was performed between the percentage change of cerebellar volume and the other MRI measures at DBP end.
Treatment effect size
We computed Cohen’s d as the between-arm difference at the last visit of the DBP (week 96 for RMS; week 120 for PPMS) divided by the adjusted standard deviation of the measurement. Estimates were obtained from the MMRM model.
Tissue integrity
Mean QT1 and MWF in the cerebellum were computed for IFN β-1a- vs ocrelizumab-treated substudy patients, with assessments performed at baseline, weeks 24, 48, and 96. Wilcoxon rank-sum test was used to compare QT1 and MWF baseline values in IFN β-1a vs ocrelizumab. Percentage changes from baseline in QT1 and MWF were compared using MMRMs including factors for time, treatment, and treatment time.
RMS versus PPMS comparison
To assess differences between the RMS and PPMS populations in a pooled analysis, baseline normalized cerebellar volumes were compared with an analysis of covariance (ANCOVA) corrected for age, sex, disease duration, EDSS, region, presence/absence of T1 Gd-enhancing lesions, and T2 lesion volume. Cerebellar volume loss rates in ocrelizumab-treated patients were compared using a random coefficients model as described above with an additional factor for the trial.
The association between baseline cerebellar volume and clinical outcomes
Baseline relationships between cerebellar volume and clinical outcomes (i.e. EDSS, Nine-Hole Peg Test [9HPT], and Timed 25-Foot Walk [T25FW]) test were assessed separately in the RMS and PPMS populations with linear regression analyses corrected for age, sex, presence/absence of T1 Gd-enhancing lesions, and T2 lesion volume.
For each arm, the prognostic ability of baseline cerebellar volume for future disability accumulation was evaluated by Cox proportional hazard regression models adjusted for age, sex, EDSS score, T2 lesion volume, presence/absence of T1 Gd-enhancing lesions, and normalized cerebellar volume. Time to 24-week CDP measured by EDSS (CDP-EDSS); 9HPT (CDP-9HPT); T25FW (CDP-T25FW); and composite CDP (CCDP: confirmed occurrence of an increase in EDSS score, the time to perform the T25FW of ⩾ 20%, or the time to complete 9HPT of ⩾ 20%) in the DBP were used.
Results
The baseline demographics and disease characteristics of the ITT population are summarized in Table 1.
Baseline characteristics of patients in the ITT population.
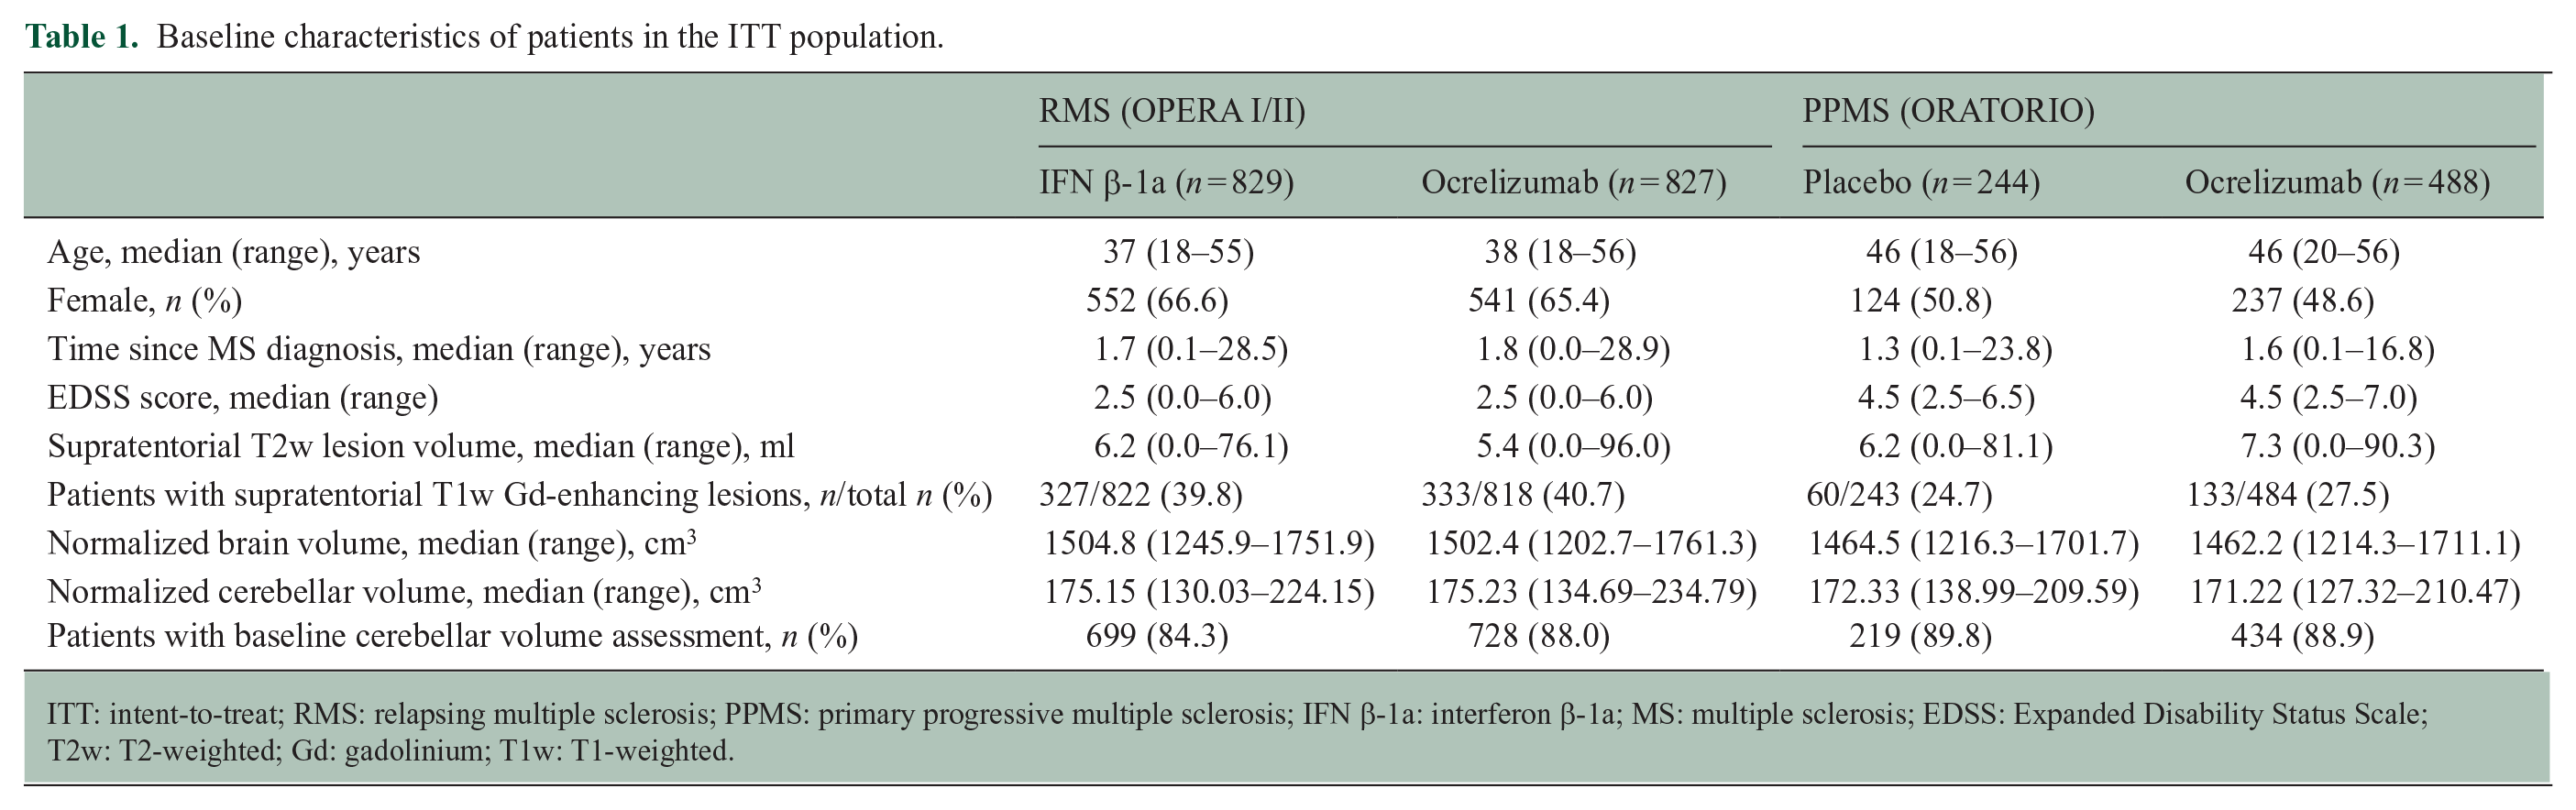
ITT: intent-to-treat; RMS: relapsing multiple sclerosis; PPMS: primary progressive multiple sclerosis; IFN β-1a: interferon β-1a; MS: multiple sclerosis; EDSS: Expanded Disability Status Scale; T2w: T2-weighted; Gd: gadolinium; T1w: T1-weighted.
The association between cerebellar volume and population characteristics at baseline
At baseline, in both RMS and PPMS, smaller cerebellar volume had a significant association with older age, longer disease duration, higher T2 lesion volume, and smaller whole brain, cortical gray matter and white matter volume (p < 0.001−0.024, Spearman’s correlation (continuous variables)). There were no significant associations with sex, prior relapses (RMS only, no prior relapses by trial entry criteria in PPMS) and T1 Gd-enhancing lesions (Wilcoxon rank-sum test (categorical variables)).
Longitudinal evaluation of cerebellar volume and treatment effect size
During the DBP, compared with the comparator arm, ocrelizumab reduced cerebellar volume loss in patients with RMS, reaching a percentage reduction of 30% (see Figure 1(a)), corresponding to an effect size of 0.298 at week 96. In PPMS, atrophy rates in the DBP were very similar in the two treatment arms (see Figure 1(b)). At week 120, the cerebellar volume loss of the ocrelizumab arm was 16% lower than the placebo arm, corresponding to an effect size of 0.101 (see Figure 1(b)). Across trials and treatment arms, percentage change in cerebellar volume loss at the end of the DBP showed the highest correlation with the whole brain volume loss, followed by white matter and gray matter volume loss (see Table 2). No or weak correlations were found with supratentorial T2 lesion volume changes (see Table 2). During the OLE, there was a statistically significant difference in cerebellar volume loss between patients initially randomized to ocrelizumab and those that switched to ocrelizumab later on for RMS and PPMS (see Figure 1). In RMS, when the OLE trajectories were compared, ocrelizumab and IFN β-1a–ocrelizumab patients showed similar slopes (p = 0.855). In RMS, considering time points occurring after OLE week 46 (to avoid confounding due to the potential reversal of pseudoatrophy in patients switching from IFN β-1a), estimated yearly percentage changes for IFN β-1a–ocrelizumab and ocrelizumab–ocrelizumab arms were both −0.18% (95% confidence interval (CI): −0.19% to −0.16% per year). Likewise, the slopes of cerebellar volume loss of the two treatment arms in PPMS were similar (p = 0.749). When considering time points after OLE day 1, estimated yearly percentage changes for placebo–ocrelizumab and ocrelizumab were both −0.30% (95% CI: −0.35% to −0.25% and −0.33% to −0.27% per year, respectively).
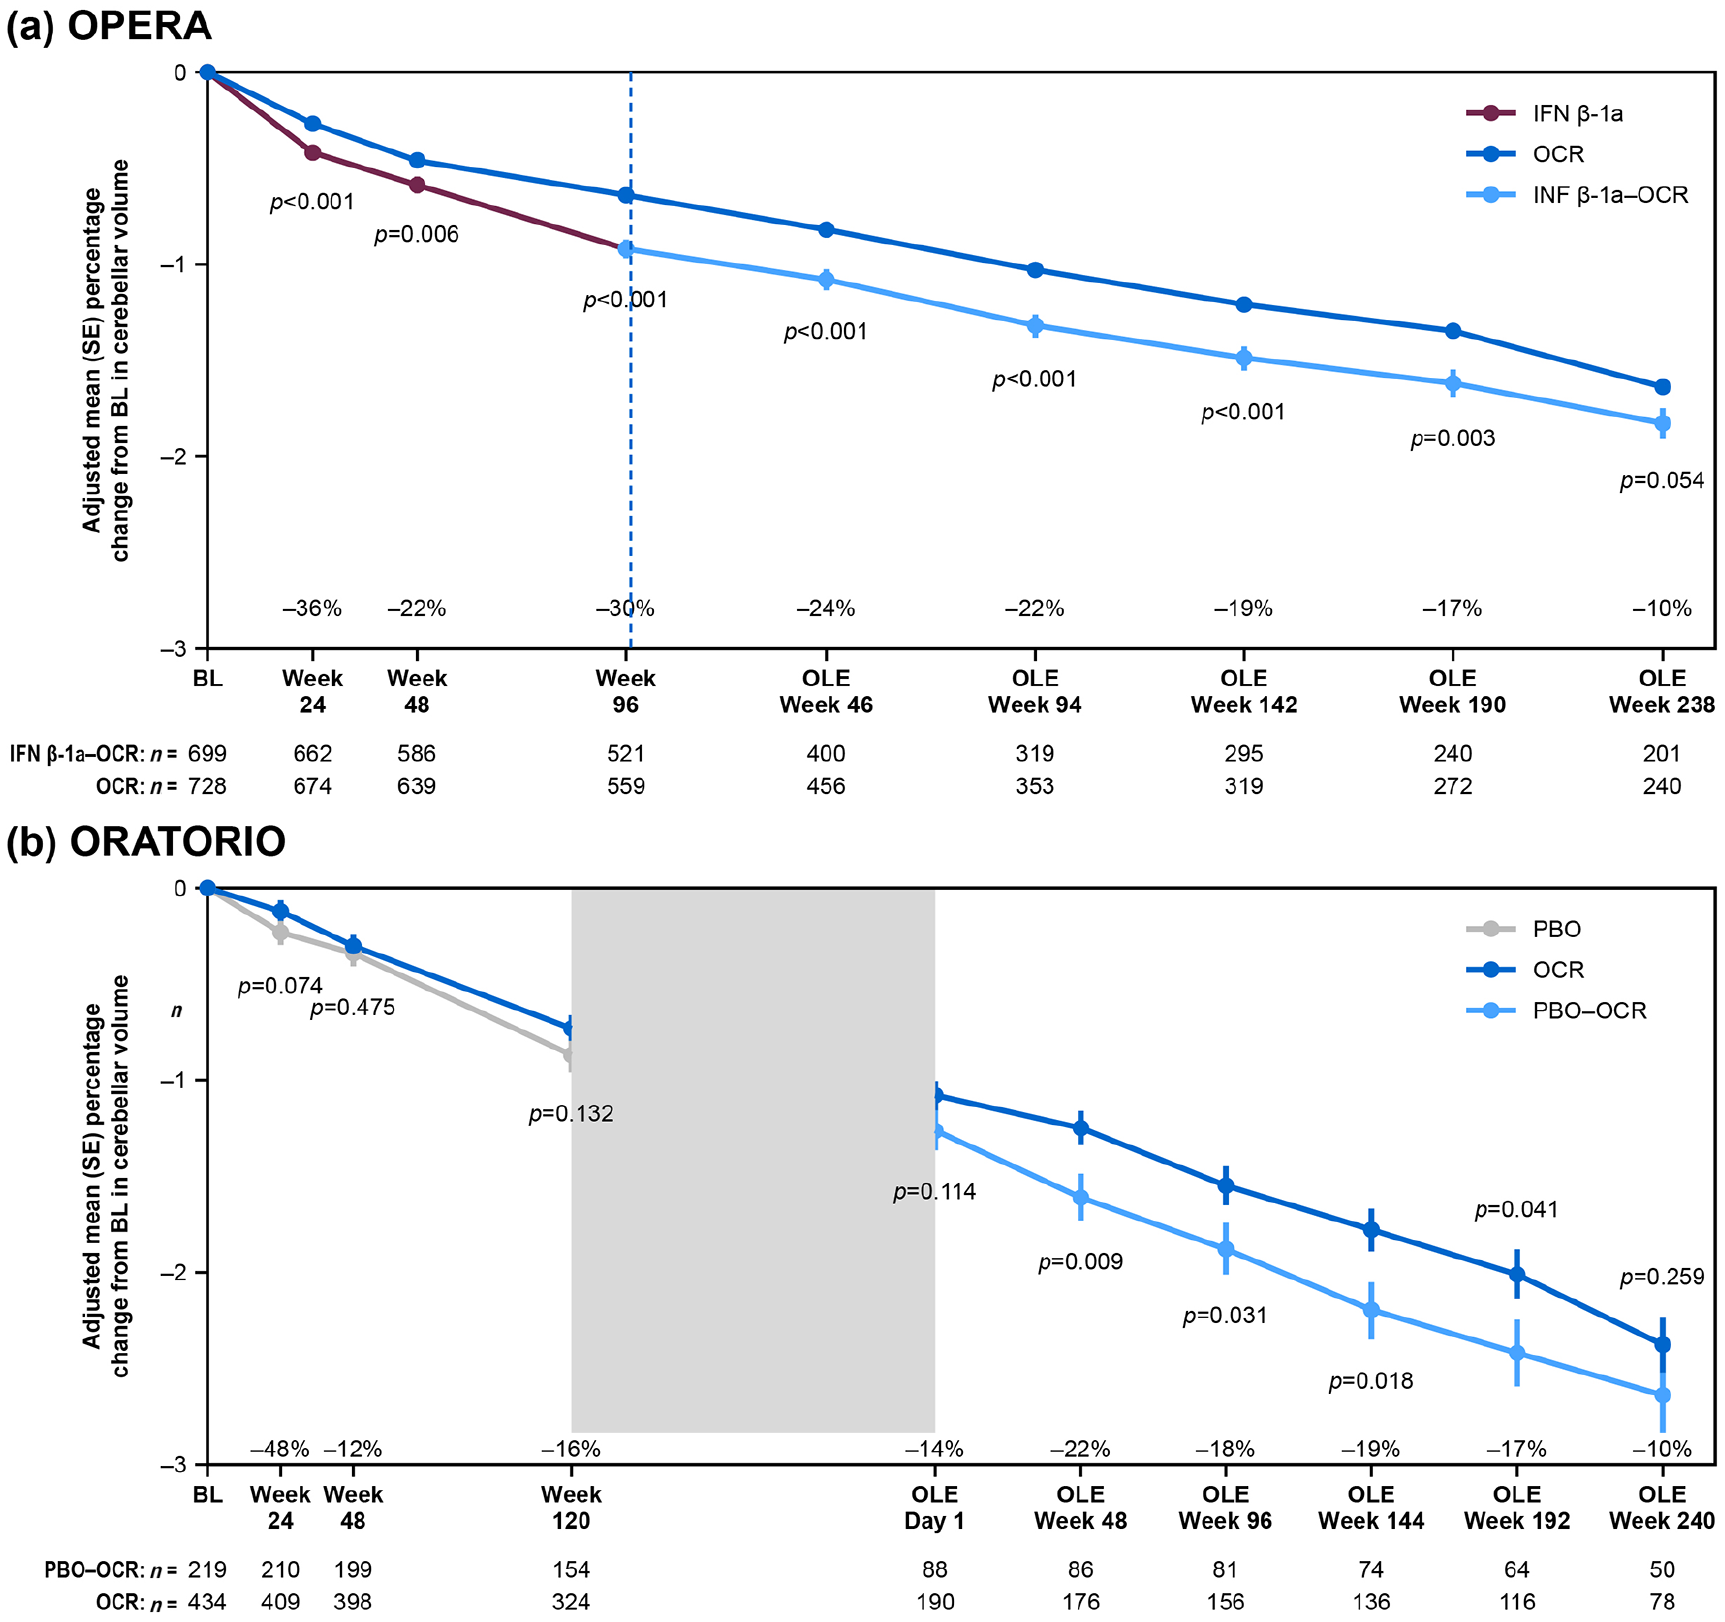
Treatment effect on cerebellar volume loss over time in (a) RMS and (b) PPMS.
Spearman correlations between cerebellar volume loss in percentage and other MRI measures of volume loss in percentage at the end of the DBP.
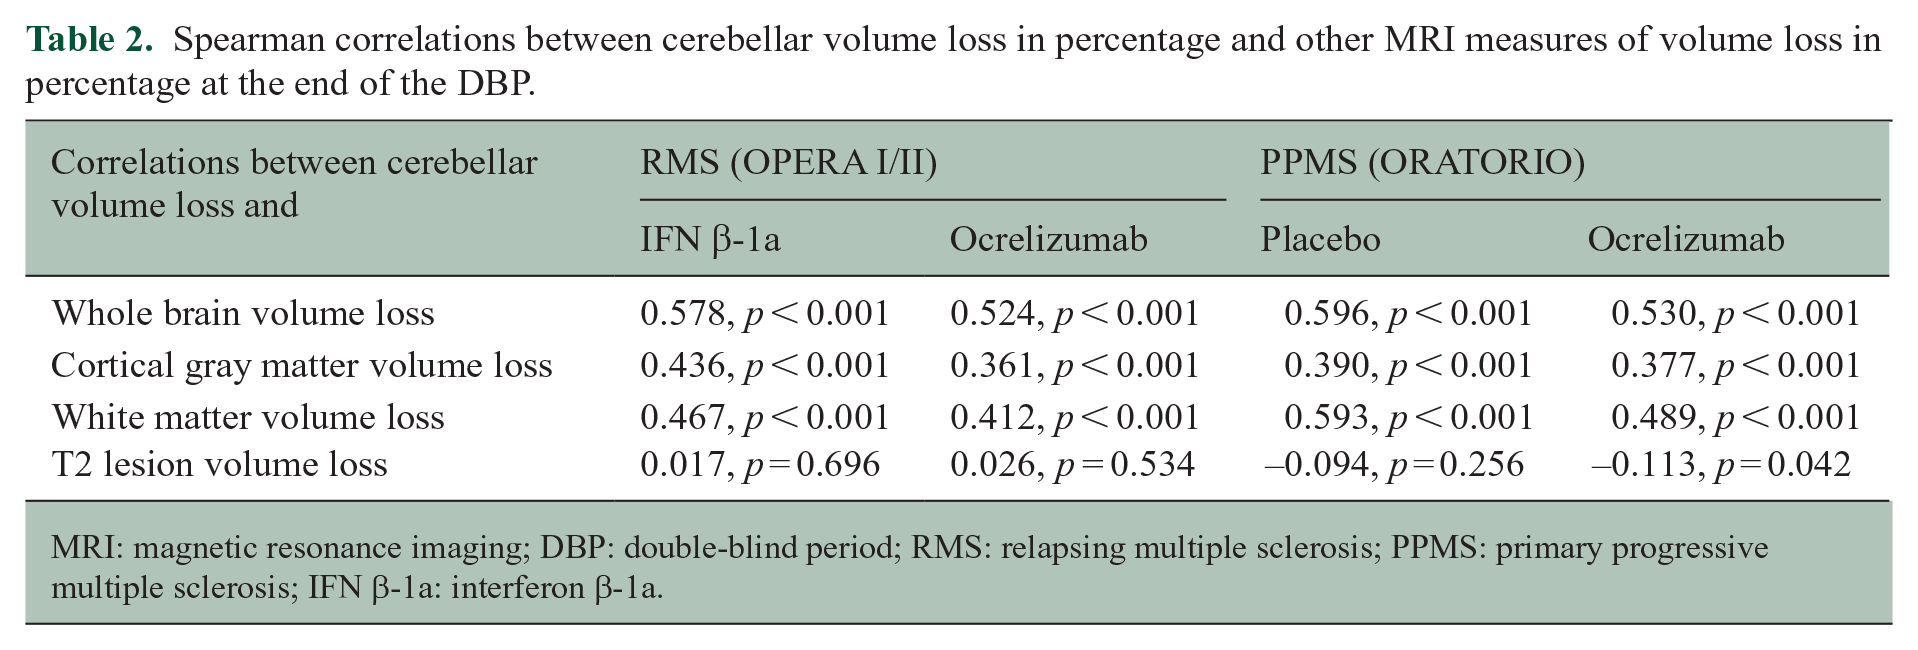
MRI: magnetic resonance imaging; DBP: double-blind period; RMS: relapsing multiple sclerosis; PPMS: primary progressive multiple sclerosis; IFN β-1a: interferon β-1a.
Tissue integrity
Forty-nine patients (IFN β-1a: n = 22; ocrelizumab: n = 27) participating in the substudy of OPERA II were included in this analysis. Comparing IFN β-1a- and ocrelizumab-treated patients, no differences were found between baseline cerebellar MWF and QT1 (p = 0.62 and p = 0.49, respectively) as well as cerebellar volume loss (p > 0.05). Over the DBP, a larger numerical increase of MWF and significant decrease of QT1 were observed in the ocrelizumab versus the IFN β-1a arm (see Figure 2).
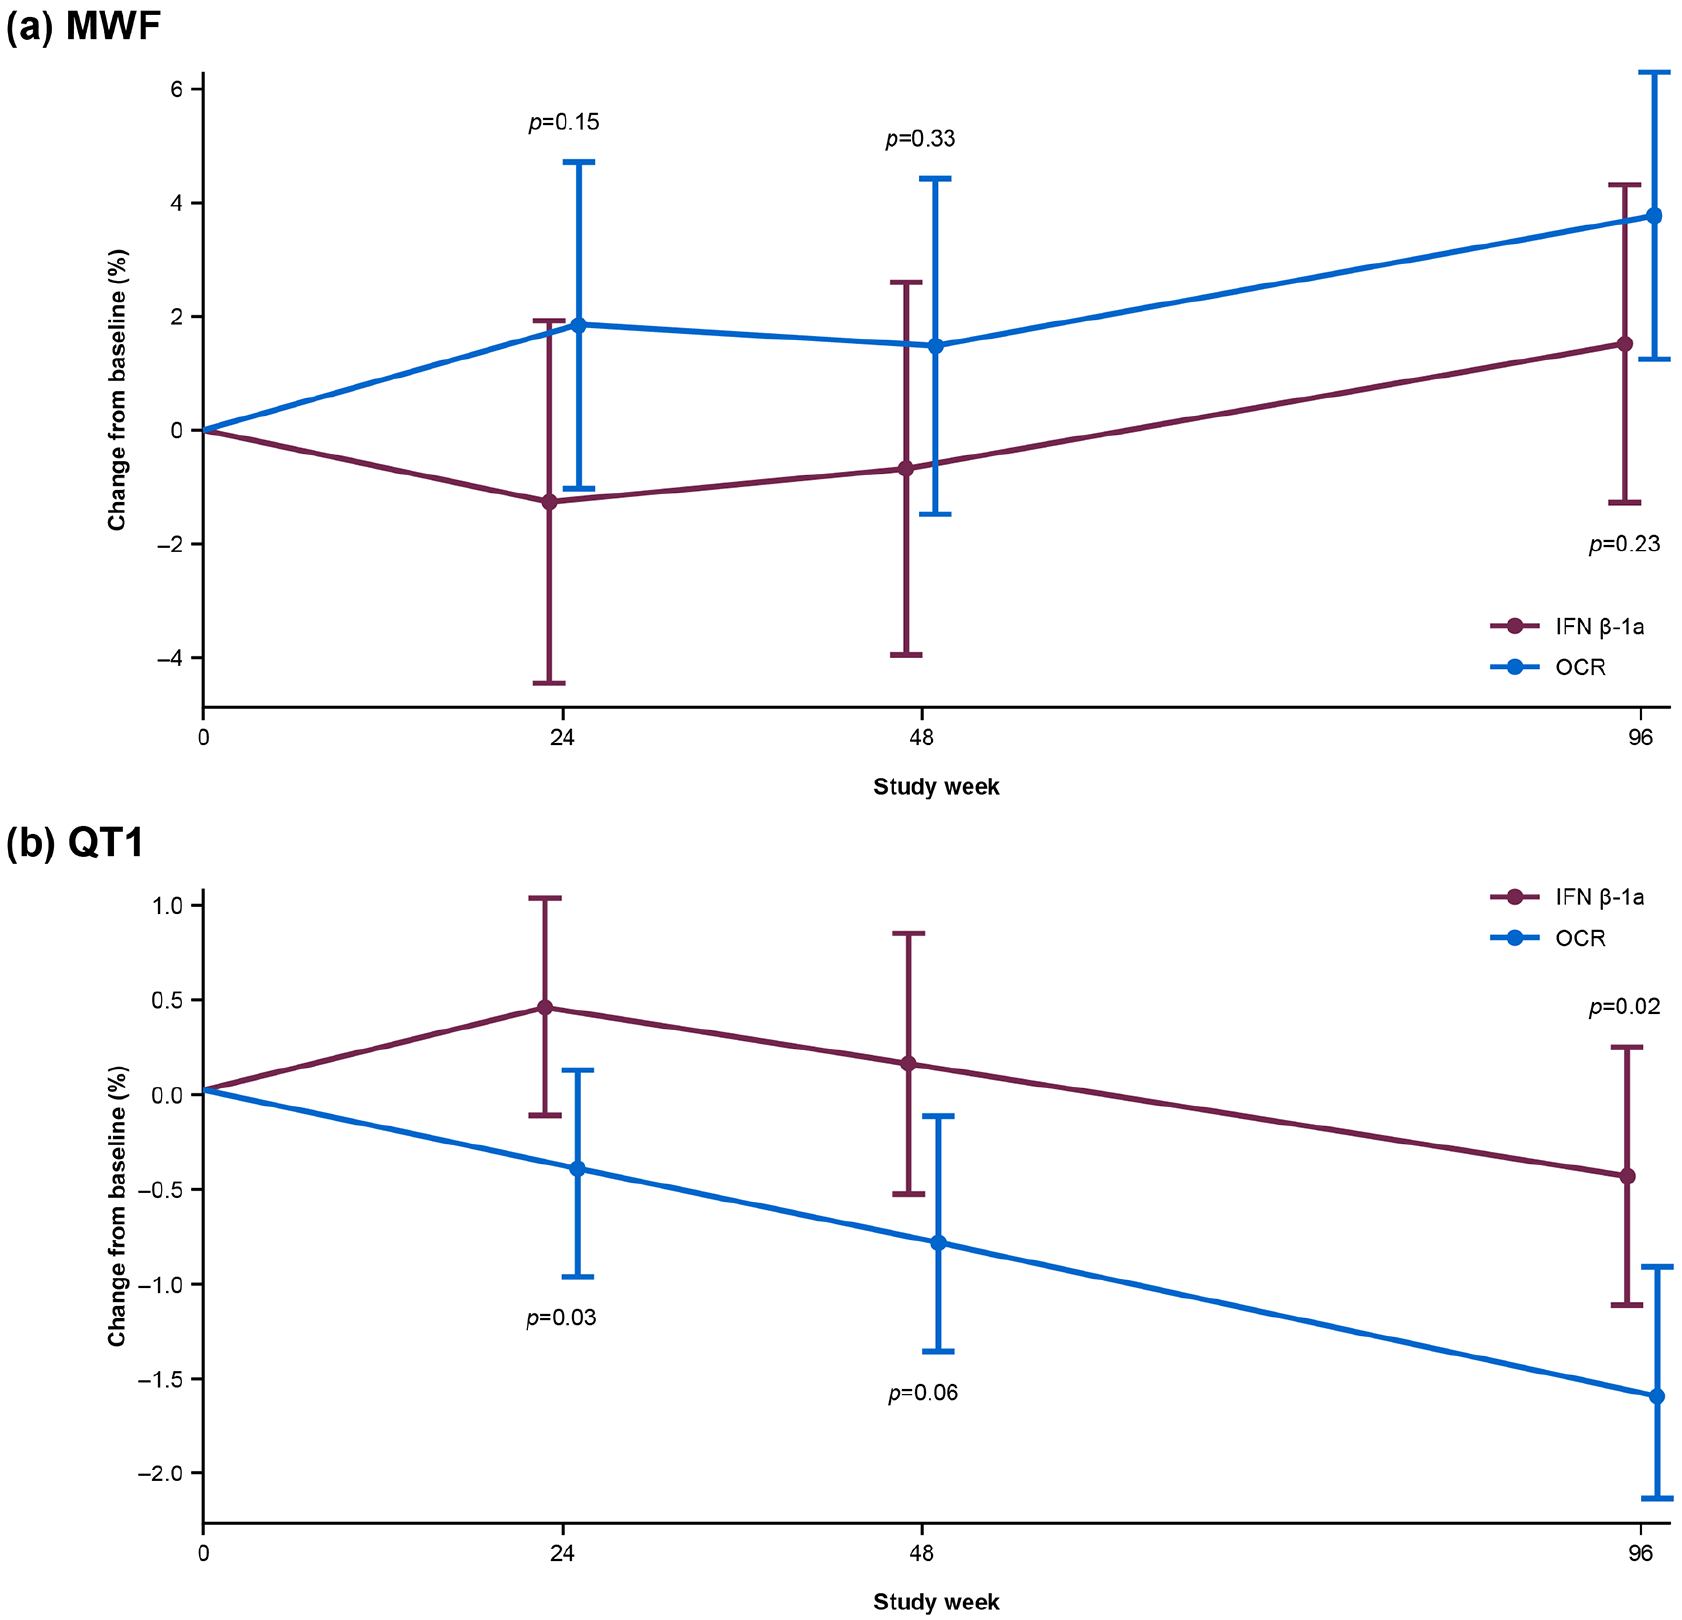
Longitudinal (a) myelin water fraction and (b) quantitative T1 changes in a subset of patients (n = 49, IFN β-1a: n = 22; ocrelizumab: n = 27 participating in a substudy of OPERA II).
RMS versus PPMS comparison
Patients with RMS and PPMS had similar baseline cerebellar volumes after adjusting for baseline characteristics (unadjusted mean ± standard deviation: RMS: 175.27 ± 13.78 cm3, PPMS: 172.07 ± 13.41 cm3; adjusted mean ± standard error: RMS: 174.36±0.51 cm3; PPMS: 174.54±0.77 cm3; p = 0.818), but cerebellar volume loss rates were different (p < 0.001). In particular, in the OLE, estimated yearly percentage changes for OPERA and ORATORIO were −0.18% (95% CI: −0.19% to −0.17%) and −0.30% (95% CI: −0.32% to −0.27%), respectively (p < 0.001, Wilcoxon rank-sum test).
The association between baseline cerebellar volume and clinical outcomes
A larger cerebellar volume at baseline was significantly associated with the 9HPT, T25FW, and EDSS score at baseline in RMS, but not in PPMS (see Table 3). In RMS and PPMS, there was no evidence of an association between baseline cerebellar volume and CDP occurring during the DBP (see Table 4).
Adjusted association between baseline cerebellar volume and baseline 9HPT, EDSS, and T25FW in RMS and PPMS populations.
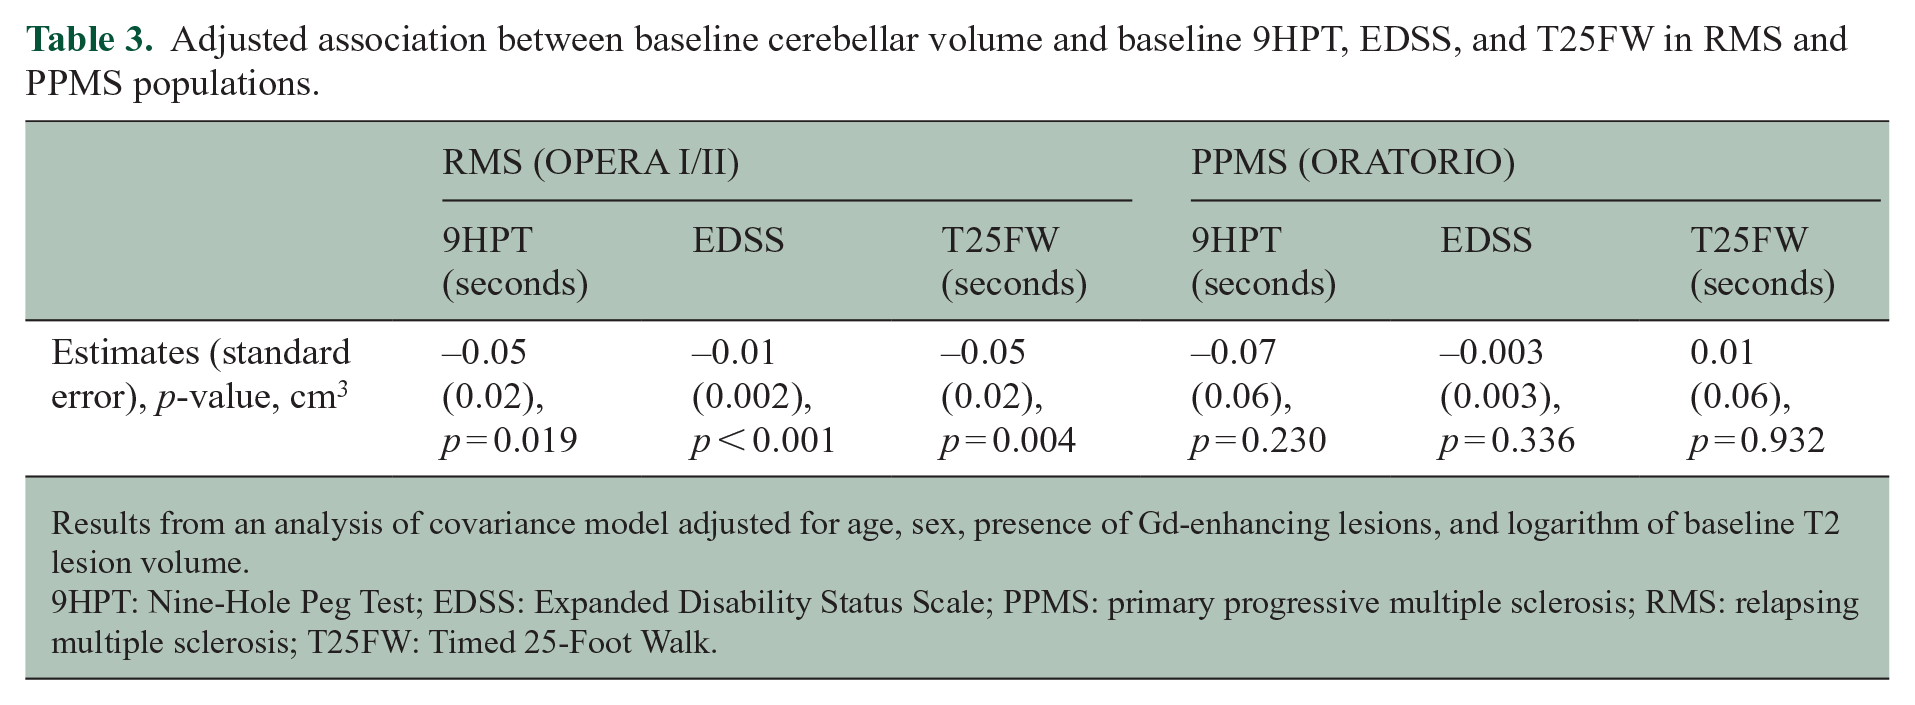
Results from an analysis of covariance model adjusted for age, sex, presence of Gd-enhancing lesions, and logarithm of baseline T2 lesion volume.
9HPT: Nine-Hole Peg Test; EDSS: Expanded Disability Status Scale; PPMS: primary progressive multiple sclerosis; RMS: relapsing multiple sclerosis; T25FW: Timed 25-Foot Walk.
Association between baseline cerebellar volume (cm3) and 24-week confirmed disability progression measured by EDSS, 9HPT, T25FW, and composite CDP in RMS and PPMS (multiple Cox regression).
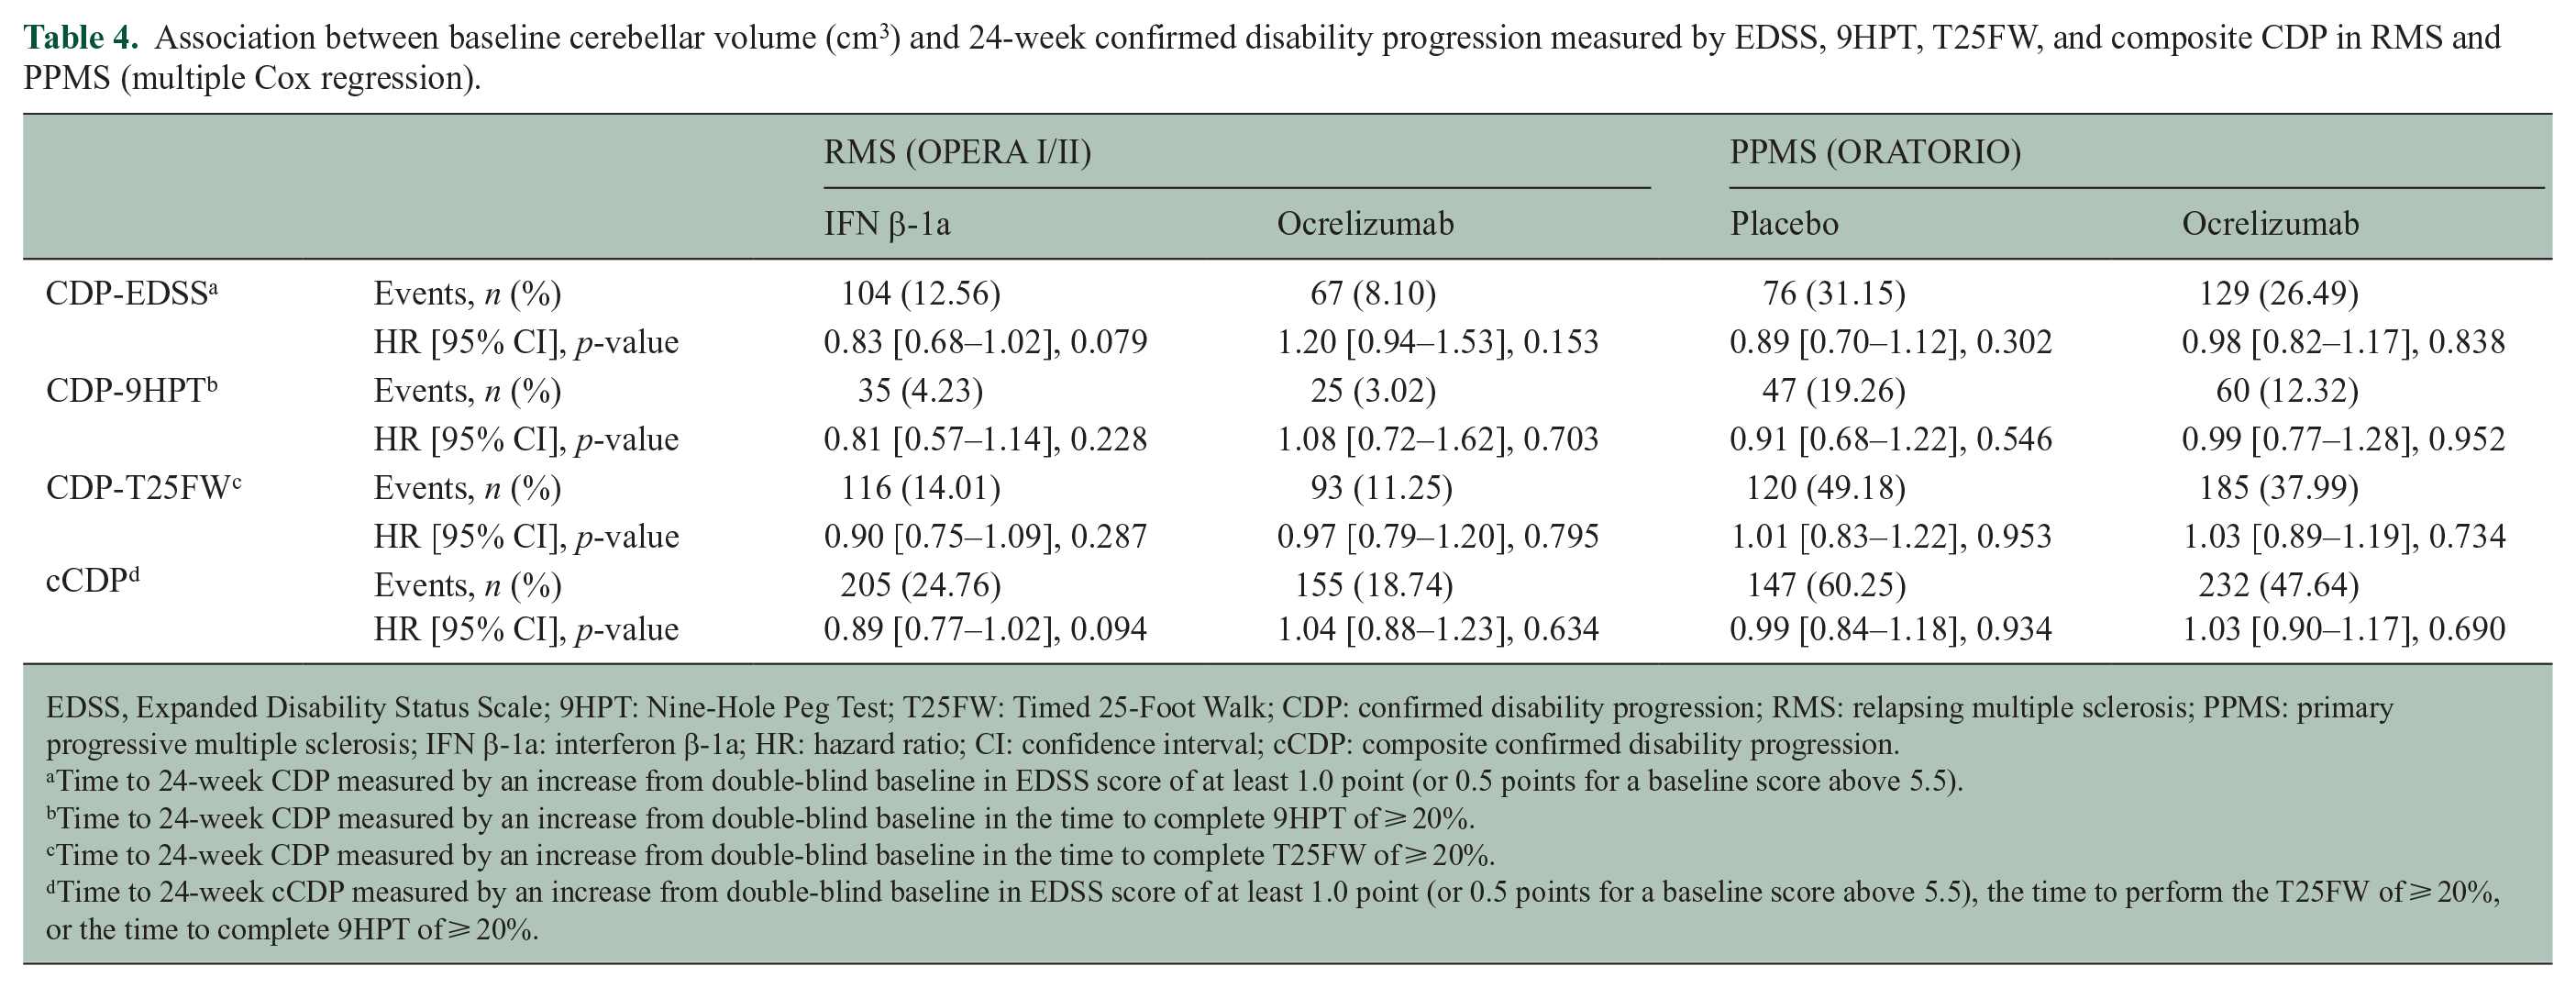
EDSS, Expanded Disability Status Scale; 9HPT: Nine-Hole Peg Test; T25FW: Timed 25-Foot Walk; CDP: confirmed disability progression; RMS: relapsing multiple sclerosis; PPMS: primary progressive multiple sclerosis; IFN β-1a: interferon β-1a; HR: hazard ratio; CI: confidence interval; cCDP: composite confirmed disability progression.
Time to 24-week CDP measured by an increase from double-blind baseline in EDSS score of at least 1.0 point (or 0.5 points for a baseline score above 5.5).
Time to 24-week CDP measured by an increase from double-blind baseline in the time to complete 9HPT of ⩾ 20%.
Time to 24-week CDP measured by an increase from double-blind baseline in the time to complete T25FW of ⩾ 20%.
Time to 24-week cCDP measured by an increase from double-blind baseline in EDSS score of at least 1.0 point (or 0.5 points for a baseline score above 5.5), the time to perform the T25FW of ⩾ 20%, or the time to complete 9HPT of ⩾ 20%.
Discussion
We assessed cerebellar volume changes in a large cohort of patients with RMS and PPMS, quantified the effect of ocrelizumab on cerebellar volume loss, and evaluated the usefulness of baseline cerebellar volume as a potential prognostic tool to capture the risk of subsequent disability progression.
The main finding is that starting ocrelizumab early helps prevent additional cerebellar volume loss compared with switching to ocrelizumab later on. This was a consistent result across patients with RMS and PPMS, and across two types of analyses, that is, MMRM and linear random coefficients models, which indicate that the separation of the two treatment arms, reflecting a better preservation of cerebellar tissue for patients started on ocrelizumab, is maintained in the long term. However, it is evident that the treatment effect develops rapidly during the DBP in RMS, but it is less clear in PPMS where a separation emerges after the transition phase to the OLE phase. One possible explanation could be related to the use of IFN β-1a as a comparator drug and its strength as an anti-inflammatory leading to accelerated volume loss over a period of a few months (also known as pseudoatrophy—the term is used to refer to an observation rather than a biological effect), 18 which is also observed for other brain structures such as the thalamus 19 and cortical gray matter. 20 The pathogenesis of pseudoatrophy is not clear and may be different for different drugs, as it does not have a straightforward relation to the strength of anti-inflammatory activity. For example, it was originally described in relation to platform IFN therapies, which are relatively weak compared to ocrelizumab, and is much greater with natalizumab 21 than with ocrelizumab, both of which are strong anti-inflammatories.
However, in the case of the cerebellum, the expected reversal of pseudoatrophy after stopping interferon appeared to be minimal. Another explanation could be attributable to MS pathology and a combination of inflammation and neurodegeneration occurring in the cerebellum. Since we measured total cerebellar volume, the results we observed may derive from relatively interconnected processes happening in white and gray matter. For the former, we cannot exclude that the early treatment effect in RMS is due to the strong effect of ocrelizumab in suppressing acute white matter inflammation associated with blood–brain barrier damage. At baseline, a higher percentage of patients with RMS showed supratentorial T1 Gd-enhancing lesions with, on average, a higher number of such lesions. 9 On this matter, it has been demonstrated that axonal damage occurs more pronouncedly in active lesions (acute or chronic) and in the cerebral white matter tissue surrounding them, especially in patients with shorter disease duration. 22 Regarding the processes occurring within the gray matter, postmortem studies have confirmed increased demyelination of cerebellar gray matter compared with white matter, especially in older patients with progressive MS, likely caused by meningeal inflammation present in niches preserved in the infoldings of the cerebellar cortex. 3 Supratentorial meningeal inflammation has also been shown to be associated with axonal and neuronal degeneration in the cerebral cortex23–25 and white matter due to secondary Wallerian degeneration. 22
In the cerebellum, increased meningeal inflammation was characterized by gray and white matter demyelination in secondary progressive MS patients. The severity of the gray matter demyelination has been associated with the density of macrophages and plasma cells in the meninges and activated microglia of the parenchyma. 26 We obtained moderate correlations between whole cerebellar volume/volume loss and supratentorial white matter as well as cortical gray matter volume/volume loss. We could speculate that the results observed already during the DBP in RMS were mainly caused by the decrease in axonal damage associated with the immediate reduction of active inflammatory processes by ocrelizumab. In PPMS, instead, the acute inflammation was less pronounced than in RMS and likely mechanisms such as chronic demyelination and secondary anterograde and/or retrograde degeneration could have had a more prevalent role. These mechanisms are slow and potentially more time is needed to appreciate a real change due to treatment through a crude measure such as cerebellar volume. In ocrelizumab-treated PPMS patients, cerebellar volume loss was faster than in RMS-treated patients. This could suggest that, when removing the acute inflammation, the axonal/neuronal vulnerability caused by a higher degree of continuous and slow inflammatory and neurodegeneration processes damage the tissue, resulting in irreversible tissue loss.
In a subset of 49 patients with RMS participating in an advanced MRI substudy of OPERA II, roughly half treated with IFN β-1a and half with ocrelizumab, a similar cerebellar volume loss over time was observed, as seen in the entire RMS group. In this single-center cohort, increasing MWF, histopathologically shown to be related to myelin content, 27 and significant decreasing QT1 were detected over the DBP in the ocrelizumab arm. QT1 is also related to myelin content, although it may be greatly influenced by water content. 28 While axonal damage is often accompanied by myelin damage, it is not measured directly by MWF or QT1. This could indicate that the cerebellar tissue integrity was preserved by ocrelizumab to a certain extent, supporting the hypothesis that ocrelizumab could create a milieu in which remyelination and tissue repair is promoted. 29
Regarding the relationship between cerebellar volume and disability, we identified an association between baseline cerebellar volume and clinical performance only in RMS, as reported in a smaller cohort of relapsing-remitting MS (RRMS).30,31 However, no association with future CDP was observed in patients with RMS and PPMS. This is in line with the work of Petracca and colleagues, 32 where, similar to us, the authors investigated the prognostic ability of baseline cerebellar volume in predicting disability progression measured by 9HPT, EDSS, and T25FW in a large cohort of RRMS participating in the CombiRx trial. They found that higher cerebellar lesion load was associated with a shorter time to 9HPT worsening, together with supratentorial lesions and EDSS. However, no association was found with whole cerebellar volume. In a smaller cohort of RRMS, baseline cerebellar volume was associated with future EDSS or 9HPT score, but not with EDSS/9HPT changes over time. 22 In patients with PPMS, instead, cerebellar volume loss over one year was indicative of clinical progression measured by EDSS in a similar time frame. 4 Smaller sample size, a smaller sensitivity of the measures in PPMS, different definitions of progression, and/or different analysis performed (e.g. association with clinical changes over time vs CDP) as well as measurement error, may cause the potential discrepancy between our results and previous ones. Overall, our findings do not provide clear evidence to support the routine measurement of cerebellar volume in patients receiving anti-CD20 therapies.
Limitations of this work should be considered to properly frame the results. First, a separate analysis of infratentorial white matter lesions was not available for those trials, and T2 lesions were not independently assessed in the cerebellum, so the relationship between cerebellar lesions and infratentorial lesions/volume loss/cerebellar volume loss, as well as supratentorial brain/lesions could not be investigated. Second, the low resolutions (i.e. 0.97 × 0.97 × 3 mm) of the T1-weighted images used to segment the cerebellum prevented us from making a distinction between white and gray matter and from disentangling potentially different processes occurring in one and/or the other tissue.
In conclusion, our results show that ocrelizumab helps preserve cerebellar volume and its integrity when treatment is started earlier. However, further and more detailed (maybe considering more specific regional volume losses) analyses are needed to fully understand short-and long-term effects on cerebellar atrophy and their clinical impacts.
Footnotes
Acknowledgements
We would like to thank all patients, their families, and the investigators who participated in this trial. This research was funded by F. Hoffmann-La Roche Ltd, Basel, Switzerland. Writing and editorial assistance for this manuscript was provided by Marina Dragovic from Nucleus Global, United Kingdom, and funded by F. Hoffmann-La Roche Ltd. The authors had full editorial control of the manuscript, provided their final approval of all content, approved all statements/declarations, and have authorized submission of the manuscript via a third party.
Declaration of Conflicting Interests
The author(s) declared the following potential conflicts of interest with respect to the research, authorship, and/or publication of this article: D.L.A. has received consultancy fees from Alkermes, Biogen, Celgene, Genentech/Roche, Frequency Therapeutics, Immunotec, Immune Tolerance Network, MedDay, Merck-Serono, Novartis, Pfizer, and Sanofi-Aventis. He has carried out contracted research for Novartis and Biogen. S.K. has received research support from Roche and Sanofi-Genzyme; and consultancy fees from Novartis. H.-E.A. is an employee of NeuroRx Research. A.B.-O. has received consultancy fees from Accure, Atara Biotherapeutics, Biogen, BMS/Celgene/Receptos, GlaxoSmithKline, Gossamer, Janssen/Actelion, MedImmune, Merck/EMD Serono, Novartis, Roche/Genentech, and Sanofi. He has carried out contracted research with Genentech, Merck/EMD Serono, and Biogen; and receives a salary from The University of Pennsylvania, Perelman School of Medicine. M.I. has received personal compensation for serving on a scientific advisory board, speaking, or other activities with Merck Serono, Novartis, Biogen, Roche, and Sanofi Genzyme. Has received research grants from NIH, NMSS, MS Society of Canada, FISM, Italian Ministry of Health, European Union; she serves as co-Editor for Controversies for Multiple Sclerosis Journal. L.K.’s institution (University Hospital Basel) has received the following exclusively for research support: Steering committee, advisory board, and consultancy fees (Actelion, Bayer HealthCare, Biogen, Bristol Myers Squibb, Genzyme, Janssen, Merck, Novartis, Roche, Sanofi, Santhera, and TG Therapeutics); speaker fees (Bayer HealthCare, Biogen, Merck, Novartis, Roche, and Sanofi); support of educational activities (Allergan, Bayer HealthCare, Biogen, CSL Behring, Desitin, Genzyme, Merck, Novartis, Roche, Pfizer, Sanofi, Shire, and Teva); license fees for Neurostatus products; and grants (Bayer HealthCare, Biogen, European Union, InnoSwiss, Merck, Novartis, Roche, Swiss MS Society, and Swiss National Research Foundation). K.P. has received consultancy fees from Allergan/AbbVie and Sanofi Genzyme. T.S.’s employer received compensation for speaking and advisory board/consulting activities from Actelion, Janssen, Eli Lilly, Merck-Serono, Roche, Novartis, Sandoz, Sanofi-Genzyme, and Teva. A.T. has received research support from Sanofi-Genzyme and Roche; has received consultancy fees from Sanofi-Genzyme and Roche; and has received honoraria for his involvement in speaker bureau activities for Sanofi-Genzyme and Roche. I.M.V. has nothing to disclose. J.S.W. has received personal compensation for consulting, serving on a scientific advisory board, speaking, or other activities with Alkermes, Avotres, Brainstorm Cell Therapeutics, Cleveland Clinic Foundation, EMD Serono, GW Pharma, MedDay, NervGen Pharma Corp, Novartis/Sandoz, Roche/Genentech, Sanofi-Genzyme, and University of Alabama; royalties are received for out-licensed monoclonal antibodies through UTHealth from Millipore Corporation. C.B. was, at the time of the study, a contractor for F. Hoffmann-La Roche Ltd and is currently an employee of Limites Medical Research Ltd, Vacallo, Switzerland. He has received consulting fees as a contractor for F. Hoffmann-La Roche Ltd during the execution of this work. U.B., S.M., and B.T. are all employees of and shareholders in F. Hoffmann-La Roche Ltd. L.G. was, at the time of this study, an employee of F. Hoffmann-La Roche Ltd and is currently an employee of Novartis AG.
Funding
The author(s) disclosed receipt of the following financial support for the research, authorship, and/or publication of this article: This study was sponsored by F. Hoffmann-La Roche Ltd, Basel, Switzerland.
Data Availability Statement
Qualified researchers may request access to individual patient-level data through the clinical study data request platform (https://clinicalstudydatarequest.com). Further details on Roche’s criteria for eligible studies are available at: https://clinicalstudydatarequest.com/Study-Sponsors/Study-Sponsors-Roche.aspx. For further details on Roche’s Global Policy on the Sharing of Clinical Information and how to request access to related clinical study documents, see ![]() .
.